
A New Method for the Determination of Fire Risk Zones in High-Bay Warehouses
by
 , , , ,
Goran Bošković
1 ,
,
Marko Todorović
1,
Dejan Ubavin
2,
Borivoj Stepanov
2,
Višnja Mihajlović
3,
Marija Perović
4 and
Zoran Čepić
2,* 1
Faculty of Mechanical and Civil Engineering in Kraljevo, University of Kragujevac, Dositejeva 19, 36000 Kraljevo, Serbia
2
Faculty of Technical Sciences, University of Novi Sad, Trg Dositeja Obradovića 6, 21000 Novi Sad, Serbia
3
Technical Faculty “Mihajlo Pupin”, University of Novi Sad, Đure Đakovića bb, 23000 Zrenjanin, Serbia
4
Jaroslav Černi Water Institute, Jaroslava Černog 80, 11226 Belgrade, Serbia
*
Author to whom correspondence should be addressed.
Fire 2024, 7(4), 149; https://doi.org/10.3390/fire7040149
Submission received: 2 February 2024
/
Revised: 3 April 2024
/
Accepted: 10 April 2024
/
Published: 21 April 2024
(This article belongs to the Special Issue Fire Safety Management and Risk Assessment)
Abstract
:Considering that the determination of fire hazard zones in warehouses is not sufficiently researched and studied, this paper aims to present a new methodological approach concerning the mentioned issue. Based on the COPRAS multi-criteria decision-making method, a new method was developed for the precise determination of potential zones where there is a risk of fire. The advantage of the described method is that it allows the quick and easy determination of all-orientation fire risk zones. The method requires fewer hardware resources compared to the existing ones and enables the display of the warehouse space in the form of a 3D model with calculated fire hazard zones. The mentioned procedure represents the first step when planning the layout and arrangement in the warehouse itself. The effectiveness of the proposed method was confirmed through a suitable numerical example.
1. Introduction
Fire represents a serious threat to the safety of people and property, regardless of whether it is about residential buildings, storage facilities, or industrial facilities; therefore, managing the risk of fire outbreaks is a big challenge in urban and rural environments [1]. Warehouses, as objects in which some activities and work processes are performed regarding the storage, transportation, and manipulation of goods and materials, are places where various accidents can often occur, which can result in the injury of employees, the occurrence of material damage, and the endangerment of the working environment, especially in cases of fire. In comparison with other places of fire origin, fires in warehouses have a small share in the total number of fires. Still, in terms of heat release, the size of the area affected by the fire, the degree of damage to the building itself, and material damage, these fires have significant consequences compared to fires in other types of buildings.
Warehouses, as an integral part of logistics, are often exposed to various improvements and corrections in the development phase, all with the aim of a better performance, capacity, and efficiency of the warehouses themselves. The aforementioned improvements result in larger and taller warehouses, the use of automated systems for the storage and retrieval of storage units (AS/RS systems), increased storage density, and the placement of storage units at higher heights [2]. The mentioned improvements make the warehouses efficient, but at the same time, they introduce potential dangers in terms of fire protection. With the increase in the height and density of storage, the possibility of the spreading and growth of flames in the case of fire increases, thereby reducing the possibility of a quick detection and localization of the fire, as well as increasing emissions of smoke and harmful substances, which significantly affects the health and safety of employees.
In modern society, we are witnesses of fires that occur in warehouses in which there are often human victims and large material losses. It is known that most deaths in fires are the result of the inhalation of toxic gases (CO, CO2, etc.), thick smoke, and an insufficient amount of oxygen [3,4]. The fire that occurred in August 2015 in the warehouse of the port of Tianjin in North China, due to the large number of victims and material damage caused, highlighted the importance of the issue of fire protection in warehouses. In this event, 173 people died, and several hundred were injured [5]. According to the conducted research, the cause of the accident was the improper storage of explosive materials (nitrocellulose) with 40 other flammable and explosive materials (for example, refined naphthalene, sodium sulfide, furfuryl alcohol, ammonium nitrate, etc.). Another fire with catastrophic consequences occurred in August 2020, in a port warehouse in Beirut (Lebanon) [6]. In this fire, 203 people died, more than 7000 were injured, and more than 300,000 people were left homeless. Based on the conducted investigation, the cargo of 2750 tons of ammonium nitrate was inadequately stored for 6 years without the application of appropriate safety and fire protection measures. In 2021, at least fourteen people died and twelve were seriously injured in a fire that occurred in a logistics warehouse located in Changchun [7], the capital of the northeastern province of Jilin. At least 49 people, including 9 firefighters, were killed in a major fire in 2022 at a container warehouse near a port city in southeastern Bangladesh [8], and more than 100 people were injured in total. The cause of such a large fire was the explosion of a container that was full of chemicals.
According to research published by the National Fire Protection Association (NFPA) in 2022 [9], the average number of fires that occurred in warehouses in the USA annually between 2016 and 2020 was 1450. It was estimated that an average of at least 2 people were killed, 16 were injured, and USD 283 million in direct property damage was generated.
Based on the large number of fires in warehouses, which by their scope and consequences can sometimes be considered catastrophic and which occurred around the world at the end of the last century and during this century, a large number of research related to this topic was initiated. The primary goal of these investigations consisted in answering questions related to risk assessment, safe evacuation from the warehouse, effective fire extinguishing and localization, and reducing the risk of the fire itself. Fires of various combustible materials in warehouses have been presented in the literature, including flammable liquid fires [10], chemical warehouse fires [11,12], warehouse and cotton industry fires [13], and lithium-ion battery factory and warehouse fires [14], in which fire risk analysis was conducted in different ways.
In paper [15], the introduction of a procedure based on Set Pair Analysis (SPA), which is based on the Fault Tree Analysis (FTA) method, was considered, and the fire risk assessment for a chemical warehouse was performed using a Bayesian network (BN) and Computational Fluid Dynamics (CFD). The paper also uses a methodology that is a combination of the Bow-Tie Method (BT), Fuzzy Set Theory (FST), and Bayesian Network (BN). FST was used to estimate the probability of occurrence of the Basic Events (BE), and the interaction probability between a set of variables was obtained using the Bayesian Network (BN). Paper [16] presents the methodology of risk assessment in a chemical warehouse using a Bayesian Network (BN), Computational Fluid Dynamics (CFD), Bow-Tie (BT), and Fuzzy Set Theory (FST) in order to analyze consequences and dynamic risk assessment. Using a similar approach, in paper [17], an assessment of the risk of fire in the storage of lithium-ion batteries was carried out to analyze the development of the fire and the consequences of the fire. The results of this procedure showed that the human factor is usually the cause of fires in this type of warehouse.
Existing risk assessment methods are still an effective tool for assessing, reducing, and eliminating all hazards to human life and health as well as the risk of damage to buildings. Among the methods used in fire risk assessment is the Gustav–Purt method, which stands out for its simplicity of application [18]. The mentioned method is not entirely suitable for assessing the dynamic risk of fire outbreaks, but due to its relatively good properties, simple use, and results, it still has significant application.
In order to obtain a more reliable method for assessing the risk of fire in logistics facilities, the authors of paper [19] improved the existing Gustav–Purt method by converting the planar model into a stereoscopic three-dimensional model. The mentioned improvement of the method makes it suitable for the analysis of different types of storage, and the obtained results show the feasibility and practicality of the model. Within this improved method, dynamic factors were defined that were used in the fire risk calculation and can be classified into several groups such as factors related to combustion, fire load, temperature, sources of ignition, factors related to human health, etc.
The main goal of the research in this paper is the development of a new method for determining the potential fire risk zone occurrence in high-bay warehouses. In comparison with existing methods and approaches in the domain of safety and risk assessment in warehouses, the developed method enables the precise determination of the zone where there is a probability of fire occurrence based on the weighting coefficients obtained based on the characteristics of the stored material. By using the multi-criteria decision-making method, weighting coefficients are obtained for each material that is stored and which represents input data in the process of determining the mentioned location in the high-bay warehouse. Compared to methods with two-dimensional representation, in the proposed approach, a spatial three-dimensional coordinate view of the space of the high-bay warehouse is obtained, with a sphere representing a potential fire hazard zone. Also, the developed method requires less time and fewer hardware resources compared to the increasingly popular and sophisticated CFD method.
2. Materials and Methods
The method developed in this paper consists of four parts. The first part refers to the selection of parameters used in fire risk assessment methods, needed to obtain the weighting coefficients necessary for determining fire hazard zones using multi-criteria decision-making procedures [20,21]. In the second part, the COPRAS method is presented, which was selected as relevant for obtaining the weighting coefficients necessary for further calculation, as in paper [22]. The third part describes the characteristics and advantages of the three-dimensional method for determining the parameters related to the contents placed in the warehouse necessary for calculations, fire risk assessment, and the determination of fire hazard zones. In the last, fourth part, the 3D COG method (center of gravity method) is presented, which is used to determine locations within the warehouse that are considered potential risk zones in case of fire. By entering the parameters of all transport units and obtaining the weighting coefficients based on the multi-criteria decision-making method, the locations are determined. The flowchart of the proposed method is shown in Figure 1.
2.1. Selection of Parameters for Multi-Criteria Analysis
The basic concept in the development of the method was to combine factors related to the emission of harmful substances due to the frequency of poisoning in fires, as well as factors related to the process of burning materials in a fire. Due to the limitations of the COPRAS method related to the number of criteria that can be applied, 7 key parameters were selected based on the available literature. The mentioned parameters represent the criteria in the multi-criteria analysis procedure, which are divided into two groups: criteria related to the impact on human health and criteria related to the thermal characteristics of the stored materials. To determine potential fire risk zones in warehouses based on data sources [19,23], 7 different parameters were selected: the concentration of CO [mg/g], the concentration of CO2 [mg/g], smoke density [kg/m3], ignition temperature [°C], thermal conductivity [W/mK], specific heat capacity [J/(kg K)], and calorific value [MJ/kg]. Increasing the number of criteria in the COPRAS method impairs the quality and precision of the results obtained in the multi-criteria decision-making process [22].
2.2. Determination of Simulation Parameters Using the COPRAS Method
The COPRAS method has a very wide field of applications. It was used for risk assessment in the construction industry [24], in the selection of materials for solar panels [25], in the selection of mechanical processing of composite materials [26], in the selection of the type of robotization in production [27], etc. In this paper, the COPRAS method was used to determine the weighting coefficients, which also represent input parameters for risk assessment in the case of a high-bay warehouse, as the authors presented in paper [28]. The COPRAS method includes several steps:
- Step 1—Creation of the initial decision matrix
In the first step, to create the initial decision-making matrix, 5 materials were selected to be stored: wood, cardboard, chipboard, PVC plastic, and rubber. These materials will represent alternatives in the process of multi-criteria decision-making using the COPRAS method in further steps. In a multi-criteria decision-making process, the criteria usually have different units of measure. In order to transform the performance of the considered alternatives, which represent the materials in the warehouse, into dimensionless values, the normalization procedure is used. For normalization in the COPRAS method, the following formula is used, which also represents the initial matrix containing the input data related to the i-th alternative and the j-th criterion:
where alternatives are marked with i = 1, 2, …, m, and criteria are marked with j = 1, 2, …, n.
- Step 2—Normalization of the decision matrix
The normalization of the values of the elements of the decision matrix to remove the dimensionality is performed by means linear transformation with the mathematical form according to Equation (2).
where kij—performance of the i-th alternative in relation to the j-th criterion; m—number of alternatives; n—number of criteria.
- Step 3—Forming the weighted normalized decision matrix
The weight vector indicating the preference level is represented in Equation (3).
The weight-normalized value of the decision matrix Vij is calculated using the weight vector and the normalized decision matrix, using Equation (4):
- Step 4—Sum of the weighted normalized values of criteria Vij
In this step, it is necessary to categorize the criteria into useful or useless criteria, with the aim of maximizing all those criteria that are useful and minimizing all those that are considered useless. In order to make it easier to calculate income S+i (maximizing indices) and expenditure S−i (minimizing indices), the decision matrix first places the income and the expenditure criteria, and S+i and S−i are calculated using expressions (5) and (6):
- Step 5—Determining the relative importance (weight) of each alternative
Relative importance helps to compare different alternatives through a generalized metric. It can be calculated according to the following formula:
where S−min is the minimum value of S−i.
- Step 6—Ranking the alternatives
The considered alternatives are ranked in ascending order, according to the value of Qi, and the best alternative is determined using the following formula:
The higher the value of Ui [%], the better the alternative.
2.3. Three-Dimensional Method for Determining Storage Parameters
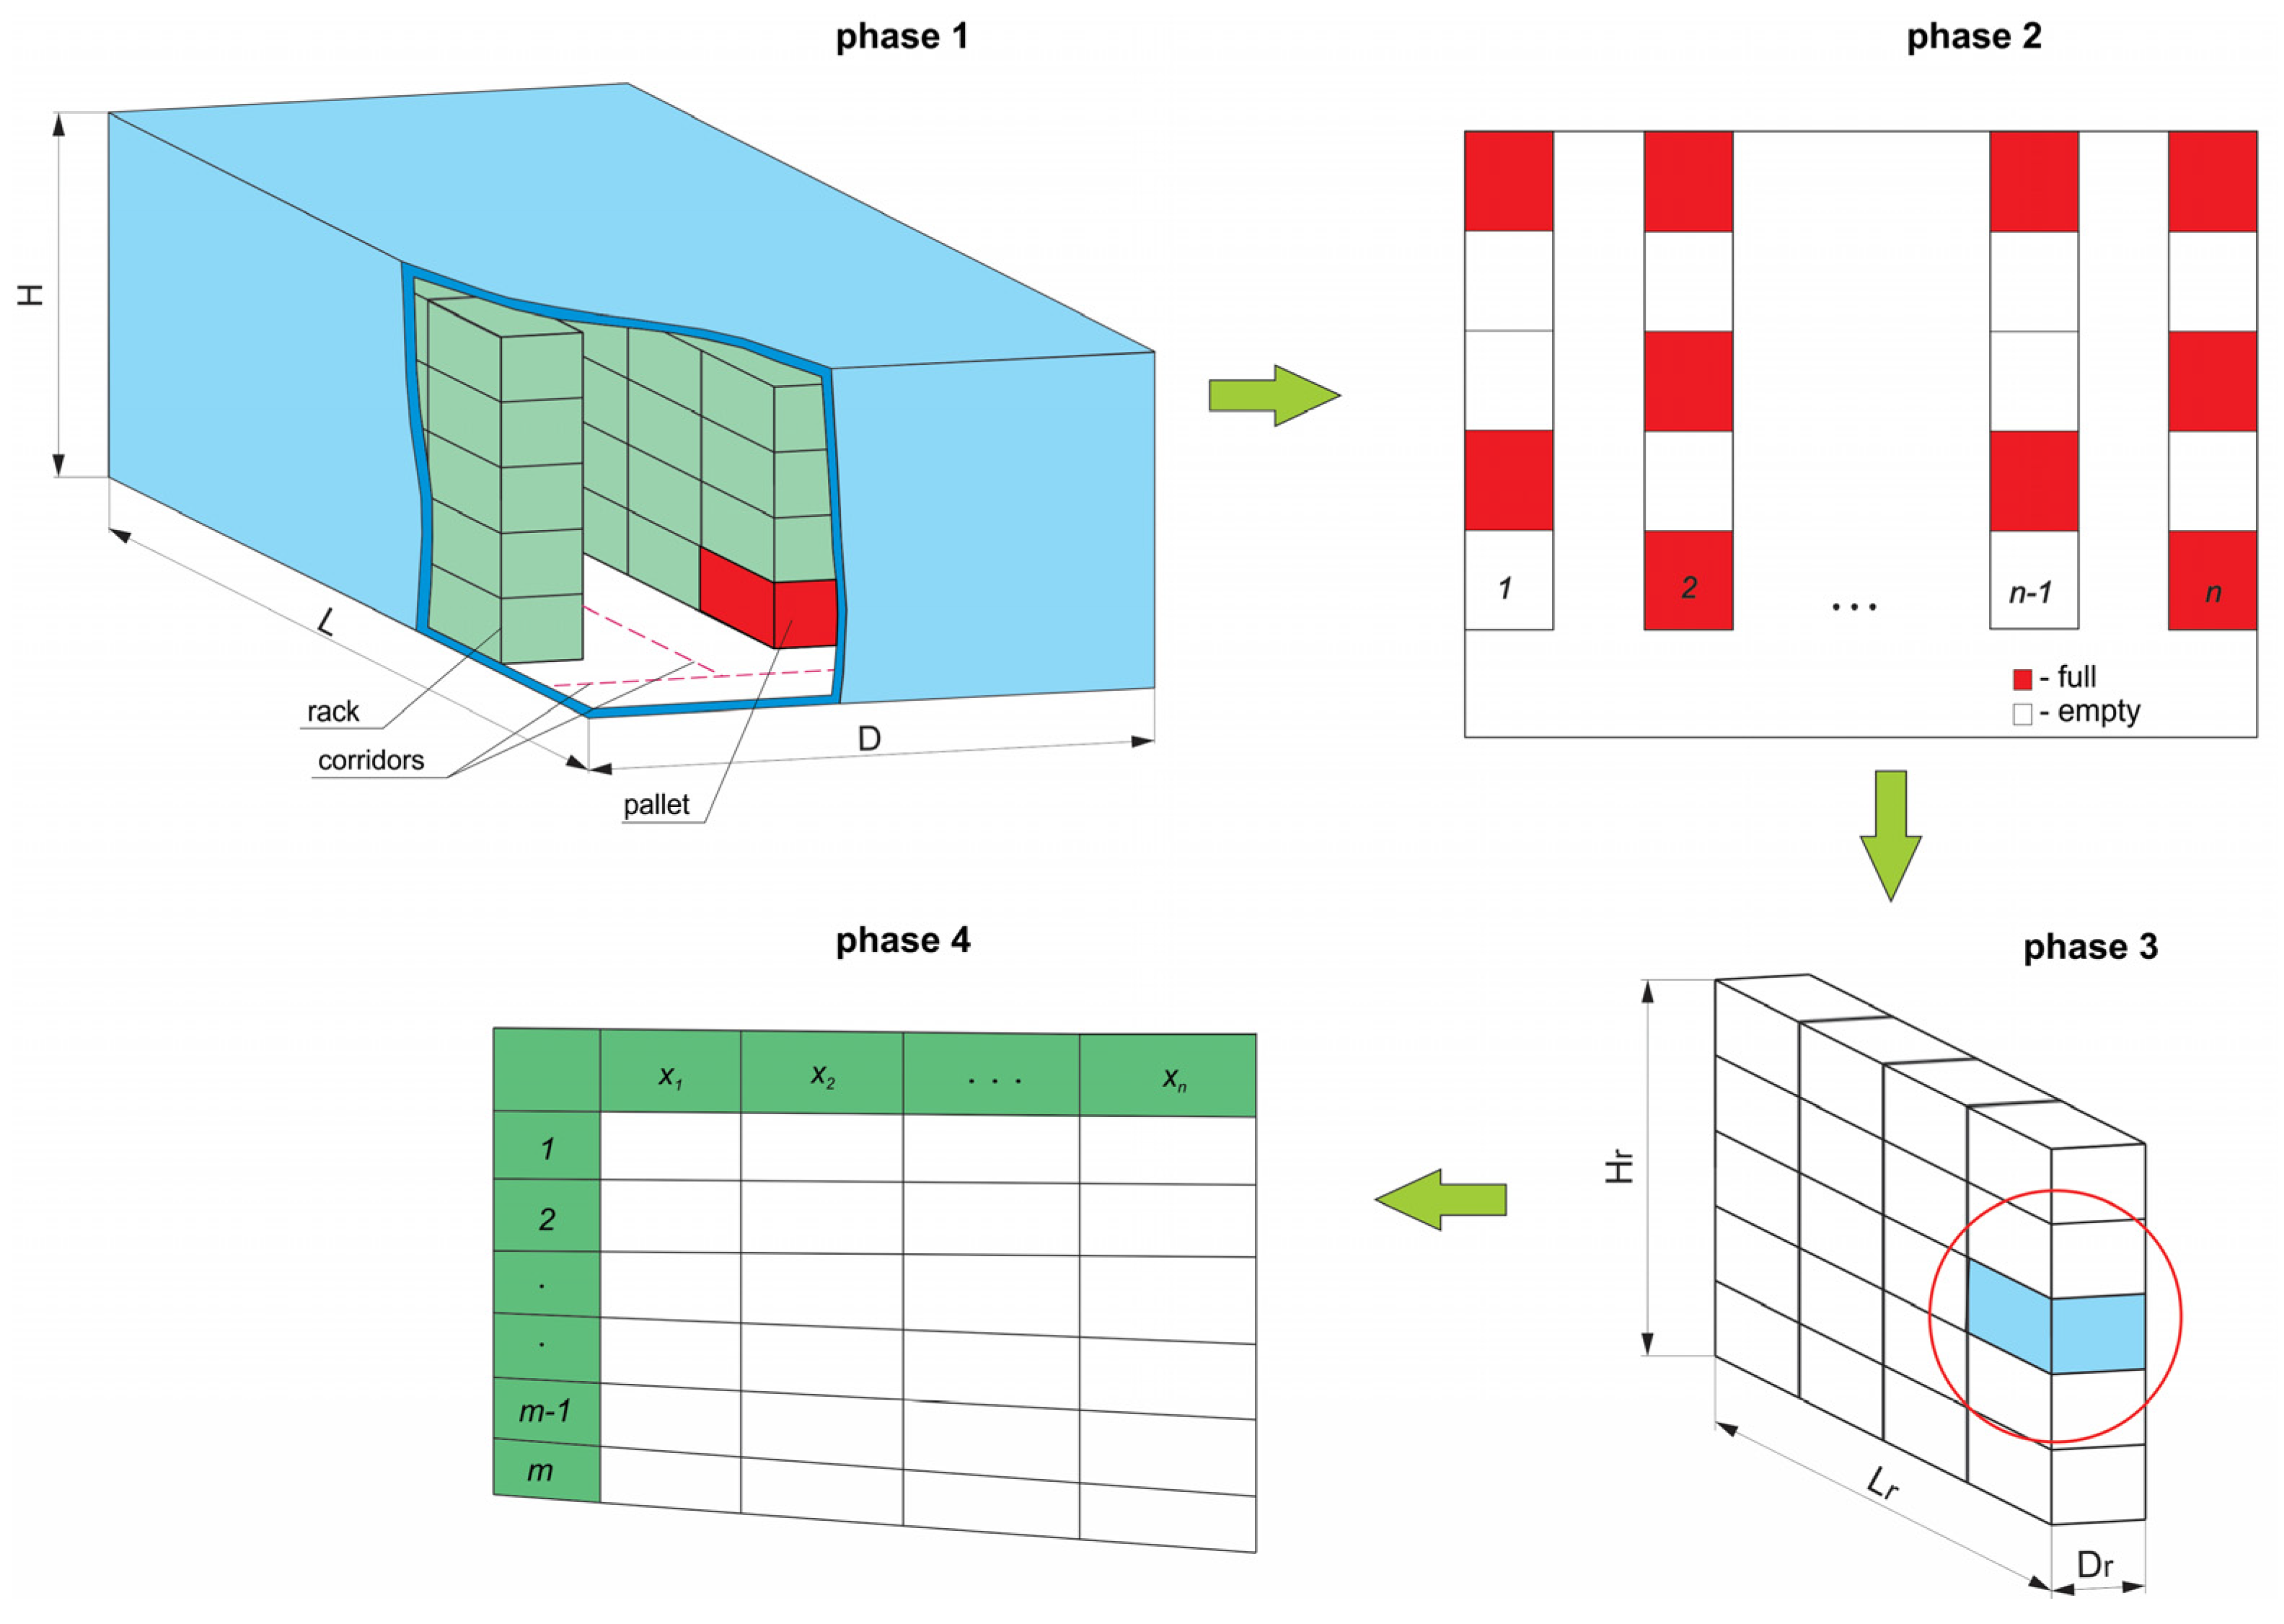
To determine the most precise parameters related to the locations of transport units, flexibility in terms of the configuration of the layout within the facility itself, and using the approach as in papers [29,30], a procedure was developed for the formation of a three-dimensional model of the warehouse with associated elements. The proposed structure of the procedure for determining the parameters of the warehouse, as shown in Figure 2, includes three main phases for the calculation and determination of the necessary parameters related to the storage of materials inside the warehouse.
Let us assume that the useful volume of a typical high-bay warehouse can be represented using overall dimensions (length, width, and height), as presented in phase 1. In order to simplify the presentation and define the parameters that depend on the layout of the content within it, in the following text, a two-dimensional view of the warehouse from a bird’s eye view will be used. This two-dimensional representation is obtained based on the three-dimensional model presented in phase 2. In Figure 2, the elements of the warehouse are corridors for the passage of transport vehicles, racks, and space for storing pallets. The racks themselves are marked in the range i = 1, …, n ∈ N.
Filling the racks in the warehouse (phase 3) is carried out by filling them with pallets which are represented by three dimensions Lp, Dp, and Hp, i.e., length, width, and height, respectively. Based on the mathematical model used in this method, as a final result in phase 4, parameters related to racks and transport units can be obtained in a simple way. These parameters are presented in the form of a table (Figure 2), which represents the basis for further calculation of the object’s fire risk. The mentioned table contains parameters related to the location of all pallets, the belonging of the pallets to the racks, the binary status of the space for placing the pallets (full/empty), the characteristics of the material in the pallet, and the individual numbering of the pallets.
In this way, a demonstration of the advantages of using alternative solutions for an easier configuration of warehouse and storage space design, as well as the possibility of forming different layout configurations, was performed. This enables the faster generation and acquisition of parameters related to the contents of the warehouse, which are necessary for calculations related to fire risk assessment. Another advantage of the mentioned approach is that when creating the configuration of the warehouse, there is no limitation in terms of the dimensions of the building and the number of storage units, and the same can be applied to high-rack warehouses with a height of several tens of meters. It is important to note that the warehouse filling strategy in this procedure can be implemented in two ways: automatically and manually. Automatic filling can be carried out according to a given rule or randomly. Manually filling the warehouse involves manually changing the cell index, which gives greater control over the layout of the pallets in the warehouse, but it is time-consuming and prone to error.
2.4. The Procedure for Determining the Coordinates of Potential Risk Zones
To simplify the presentation and further calculation, transport units as bodies of appropriate dimensions and characteristics that occupy only a stationary position in the warehouse will be represented by a material point. In this way, the dimensions of the transport units can be considered infinitely small, and assuming that each point of the volume has the same properties, i.e., that the content of the transport unit is homogeneous, the entire volume can be represented by a point that represents the center of gravity of the body and which is defined by its coordinates in three-dimensional space, as well as by the weighting coefficient of the corresponding material that replaces the mass in the further calculation.
The procedure for evaluating the center of gravity of transport units represented in the form of a material point (Figure 3) and determining the weighting coefficients for materials placed in the warehouse are the main prerequisites for determining the potential fire risk zone. The classical approach to the method of determining the center of gravity (COG method) used in logistics [31,32,33] enables the determination of optimal locations in the two-dimensional coordinate system XoY.
To assess potential fire risk zones and their coordinates, an improved version of the COG method will be used to determine the center of gravity in a three-dimensional coordinate system, which has found application in medicine, electrical engineering, mechanics, and other fields [34,35,36]. Algorithm 1 (Pseudocode for determining the coordinates of the center of gravity) shows the algorithm for obtaining coordinates in the form of a pseudocode to make the procedure easier to understand. Input parameters when determining potential fire risk zones are the coordinates of the center of gravity of transport units (Xci, Yci, and Zci), as well as the weighting coefficient Qi, which contains the values of all relevant fire-related parameters.
| Algorithm 1: Algorithm to find pointset of potential fire hazard zones |
| INPUT: Pointset Xci, Yci, Zci, Qi |
| OUTPUT: X, Y, Z |
| Numerator = 0 |
| Denominator = 0 |
| for i = 1:n |
| Numerator_x = Numerator + Xci*Qi |
| Numerator_y = Numerator + Yci*Qi |
| Numerator_z = Numerator + Zci*Qi |
| Denominator = Denominator + Qi |
| end |
| X = Numerator_X/Denominator |
| Y = Numerator_Y/Denominator |
| Z = Numerator_Z/Denominator |
| Post-processing and presentation of results |
All calculations and simulations were done using a computer in the Matlab 2023 software package. For the purposes of the experimental research, DELL OptiPlex 3000 SF workstations with the following configuration were used: Intel® Core™ i5-11300H processor, 32GB DDR4 RAM memory and 512GB SSD disk.
3. Numerical Example
In the numerical example shown in this section, the parameters of the high-bay warehouse related to dimensions and layout (see Figure 4) given in paper [28] were used. Based on the considerations given in Section 2, to obtain the most accurate data needed for further simulation, it was decided to select five types of solid materials (wood, cardboard, chipboard, PVC plastic, and rubber) as alternatives in the multi-criteria decision-making process, which will be the subject of further calculations.
The list of materials and the numerical values of the seven selected parameters are given in Table 1. The listed characteristics of materials related to combustion shown in the mentioned table represent criteria in the multi-criteria decision-making process and are taken from the literature [37,38,39,40,41,42,43].
Table 1 presents the criteria in the order shown in Section 2.1. C1, C2, and C3 are considered useful because they take into account the emission of harmful gases that affect human health, while the other criteria, C4, C5, C6, and C7, which take combustion into account, are declared useless in the first case. Alternatives related to materials are marked with Aj (j = 1, …, 5). After converting the qualitative attributes into quantitative ones, the decision matrix with assigned weighting coefficients formed based on Equation (1) is shown in Table 2.
Following all the steps provided by the COPRAS method (1–6) and based on Equations (2)–(8), in step 6, the weights for each of the alternatives Qi and the corresponding ranking are obtained, as shown in Table 3. Identically, the parameters for case 2 can be determined when the decision matrix is replaced, so that parameters C4, C5, C6, and C7 are considered useful, and the other criteria, C1, C2, and C3, are considered useless, as shown in Table 3.
Each of the materials presented in Algorithm 1 occupies two racks, so the total number of racks in the warehouse is 10; that is, there can be a maximum of 1200 transport units in the warehouse. In practice, it is rarely the case that the warehouse is filled to 100%, and so testing the effectiveness of the proposed method is carried by varying the layout of the transport units in the racks so that the total percentage of the warehouse is filled to a maximum of 70%, as in [8], with the rule that the percentage share of each of material should be equal, i.e., 20% of the total number of transport units. In this way, each rack contains 168 transport units.
To confirm the functionality of the method and the comparative presentation of the results, the coordinates X, Y, Z, and the vector r were calculated for the following variants of warehouse filling:
- -
- Variant 1: The first three racks on the left side of the warehouse are completely emptied and the filling of the warehouse with the remaining 840 transport units starts from rack number 4;
- -
- Variant 2: The last three racks on the right side of the warehouse are completely emptied and the filling of the warehouse with the remaining 840 transport units starts from rack number 1;
- -
- Variant 3: The content of each of the racks on the upper front side is reduced by 30%;
- -
- Variant 4: The content of each of the racks on the lower front side is reduced by 30%;
- -
- Variant 5: The content of each of the racks in the uppermost rows is reduced by 30%;
- -
- Variant 6: The content of each of the racks is reduced by 30% in the initial lower rows;
- -
- Variant 7: The content of each of the racks is reduced by 30% and the arrangement of transport units within the racks is carried out randomly.
Based on the obtained weight coefficients for the selected five materials for case 1 and case 2, the following can be concluded:
- -
- Due to the significant difference in the parameters concentration of CO [mg/g] and smoke density [kg/m3] for tire compared to the other materials (case 1), the weight coefficient we5 = 0.45105 of the mentioned material has the highest value, in comparison to the weight coefficients of the other four materials.
- -
- There is no big difference between the weight coefficients wci in case 2 because there is no significant deviation in the values of the parameters related to the thermal characteristics of the stored materials.
The obtained results were compared using correlation analysis based on Spearman’s rank correlation coefficients and the standard deviation of the ranks of the alternative levels [44]. Spearman’s rank correlation coefficient R is in the range of 0.7 ≤ R (R = 0.74).
4. Results and Discussion
Based on the parameters related to the location of the transport units determined by implementing the procedure shown in Figure 2, and the weighting coefficients obtained using the COPRAS method and entering the mentioned parameters into the COG algorithm, the locations of the potential fire risk zones in the high-bay warehouse are obtained. These locations are represented in the form of coordinates X, Y, Z and the distance r which represents the distance of the potential risk zone from the zero point. The radius of the fire risk zone R is defined as the distance from the center of the fire risk zone to the nearest storage unit. It is defined to include the closest place where a fire can start. In this case, this volume practically includes storage units where it is most unfavorable, from the point of view of safety and occupational health, for the initial spark to fall and cause a fire.
As can be seen in paper [45], when burning, tires emit a large amount of smoke and substances harmful to human health, so for reasons of safety, visibility, and easier evacuation from the warehouse, as shown in Figure 4, transport units with tires occupy the last two racks, which represents one of the considered cases. To obtain the most accurate and reliable results, the calculation of potential zones was also performed for the case when the rubber-filled storage units occupied the first two racks. It is important to note that when calculating the mentioned fire risk zones, economic and logistical factors were not considered.
The calculated coordinates of potential fire risk zones, distance r, and radius R for the variant where tires occupy the last two racks are shown in Table 4. The left part of the table presents the results obtained using the weighting coefficients for case 1, while the right side presents the results obtained using the weighting coefficients for case 2.
Based on the results and illustrations shown in Table 4, it can be noted that by changing the weighting coefficients, the position of the fire risk zone also changes due to the difference in the values of the weighting coefficients themselves. In the case when the dominant factors are related to the emission of harmful combustion products, the weighting coefficient for tire is we5 = 0.45105, while in the other case, when the dominant factors are related to combustion, the weighting coefficient is wc5 = 0.155235. The mentioned difference in the weighting coefficient has the effect that in all variants in the first column, the fire risk zone gravitates toward the racks where tire is located, which directly indicates that the width and position of the fire risk zone depend on the arrangement and amount of material in the warehouse.
Based on the results obtained using the described method (see Table 4), it can be noted that in the case where the storage units are randomly distributed within the warehouse (variants 7.1 and 7.2), the position of the fire risk zone is between the fire risk zones determined in extreme cases (variants 1.2, 2.2, etc.), which is supported by the following observations:
- -
- The X coordinate for variants 7.1 and 7.2 represents approximately the mean value of the X coordinate for pairs 1.1 and 2.1, that is, 1.2 and 2.2, respectively;
- -
- The Y coordinate for variants 7.1 and 7.2 represents approximately the mean value of the Y coordinate for pairs 3.1 and 4.1, that is, 3.2 and 4.2;
- -
- The Z coordinate of variants 7.1 and 7.2 represents approximately the mean value of the Z coordinate of pairs 5.1 and 6.1, that is, 5.2 and 6.2.
Using the method described in the previous sections, the case of warehouse filling was considered where the first two racks, viewed from left to right, are filled with rubber, which is the only difference compared to the previously considered case. The obtained results are shown in Table 5.
In contrast to the previous case, it can be noted that the fire risk zone is closer to the zero coordinate, that is, the entry/exit from the warehouse. This phenomenon can be explained by the fact that tire has a high value of the weighting coefficient; since its position is now closer to the entrance/exit of the warehouse, the fire risk zone is also closer to the entrance/exit. As it was previously established that tire emits a high level of harmful substances, which is the reason why it has a high value of the weighting coefficient, this shift of the fire risk zone is expected, which in a way represents a confirmation of the validity of the method/model.
As in the previous case, it can be noted that in the case where the storage units are randomly distributed within the warehouse (variants 7.1 and 7.2), the position of the fire risk zone is between the fire risk zones determined in extreme cases (variants 1.2, 2.2, etc.).
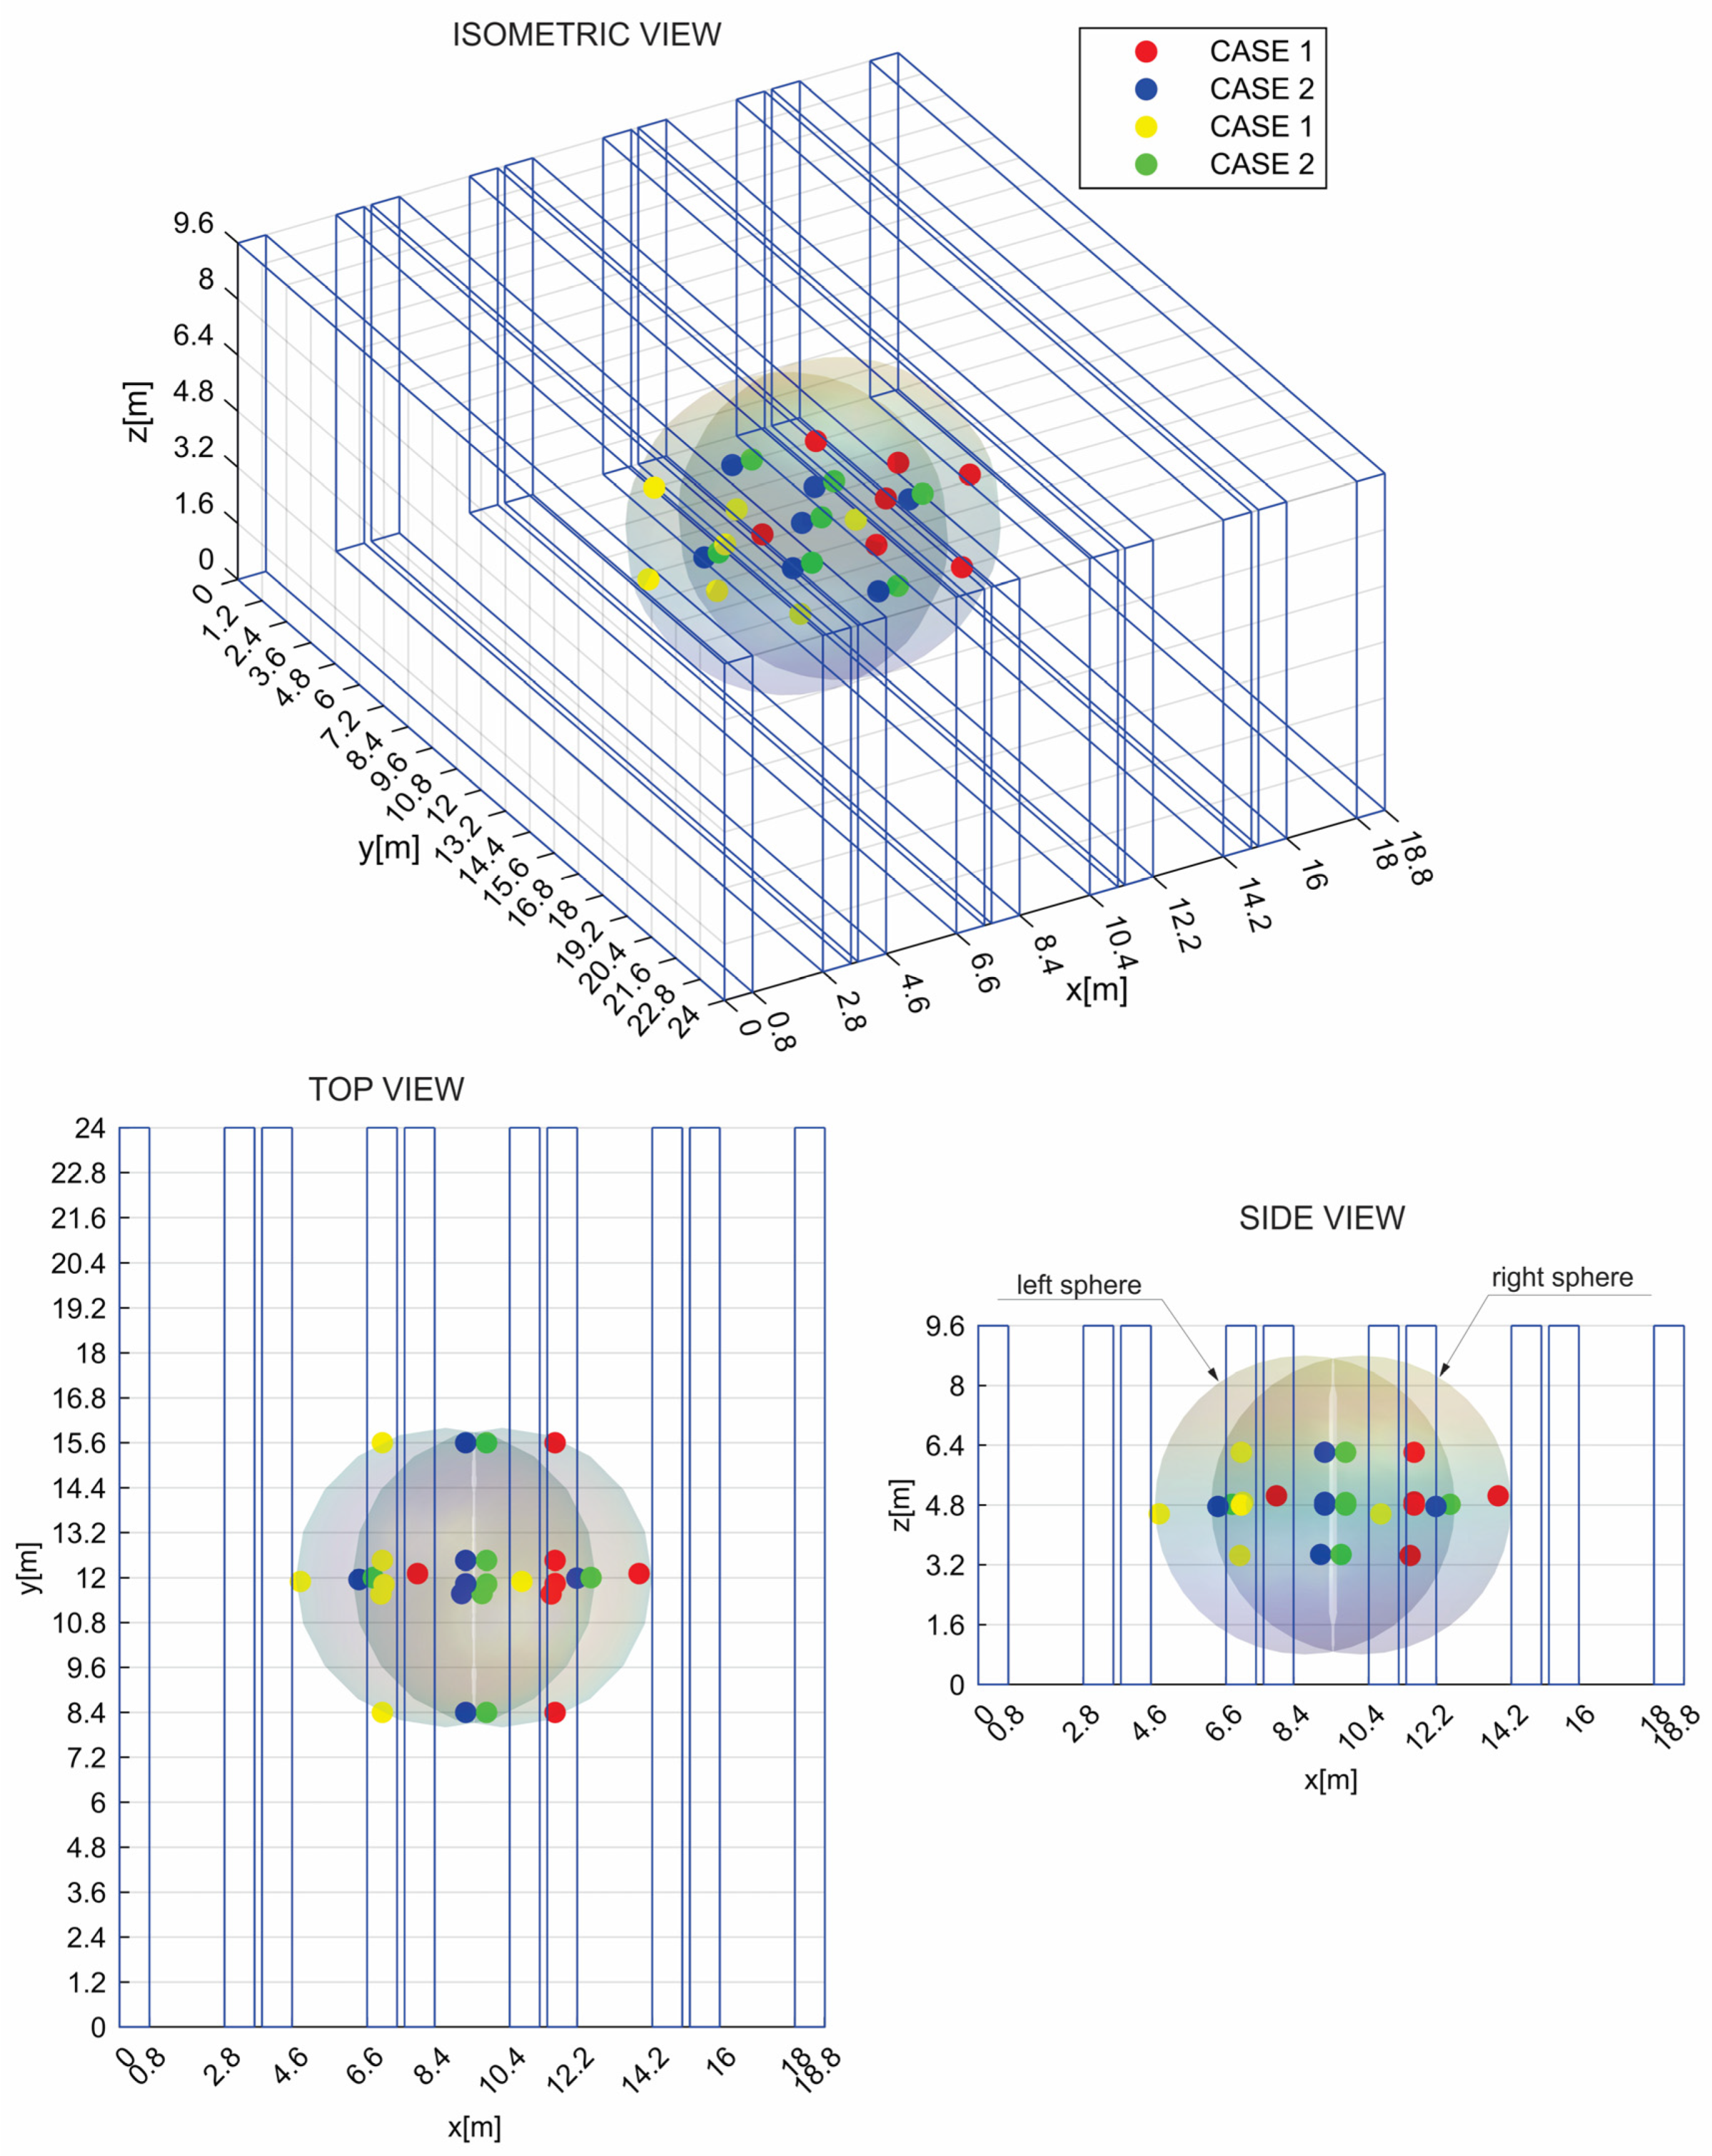
The results in the form of coordinates of spatial points obtained by means of simulation are shown in Table 4 and Table 5. Based on the obtained coordinates and using a three-dimensional model of a high-bay warehouse, two spheres that define potential fire risk zones were generated (Figure 5). The mentioned spheres represent the space that is considered vulnerable in terms of fire and which includes normal and random variants of material distribution within the space of the observed high-bay warehouse. Considering the symmetrical arrangement inside the warehouse along all axes, the homogeneity of the stored material, and the warehouse occupancy, the left sphere (with coordinates of center x = 8.7 m, y = 12 m, z = 4.8 m, and r = 4 m) and the right sphere (with coordinates of center x = 10.2 m, y = 12 m, z = 4.8 m, and r = 4.1 m) are generated. Figure 5 shows the deviation in the coordinates of the spheres along the x-axis, which is directly related to the change in the distribution of materials in the racks. Coordinates of spatial points are obtained for the cases of warehouse layout when tire as material occupies the last two racks and when it occupies the first two racks, respectively.
The warehouse space covered by the mentioned spheres should be taken into consideration during the process of designing the warehouse system, fire extinguishing, prevention, and alarm systems, as well as the evacuation plan from the warehouse. The implemented procedure based on the method described in this paper can be applied to any closed-type storage and is not related only to the considered example.
In relation to the existing fire risk assessment methods (e.g., Gustav method), in the proposed approach, the simulation results are obtained based on the weight coefficients related to the materials that are stored, the percentage share of storage units, and the parameters related to the dimensions of the warehouse. By varying the mentioned parameters in the proposed approach, shown in the form of a flowchart diagram in Figure 1, the location of the fire risk zones in the warehouse changes automatically. In accordance with the popular trend of warehouse development by increasing the dimensions and capacity of the warehouses themselves, this method represents a quick and useful tool for fire risk assessment in the phases of designing new or adapting existing solutions related to high-bay warehouses. The practicality and usability of the proposed method are reflected in the simplicity and practicality of application, with fewer necessary parameters and resources, simple data acquisition, and the possibility of a three-dimensional display of risk zones in real time.
The described method was not meant to be a replacement for the Gustav method. The Gustav method is more complicated and can be more complex. This means that it takes some time to adapt it and use it by the warehouse designer, and it gives more broad results. The method described in this paper enables quick calculation and provides general guidelines for warehouse designers, but does not provide detailed results like those of the Gustav method.
5. Conclusions
A method for risk assessment and the determination of potential fire hazard zones in high-bay warehouses is presented in this paper. Concerning existing methods related to risk assessment in warehouses, the proposed method is based on weight coefficients related to the type of material being stored, the percentage share of storage units, as well as parameters related to the structure and configuration of the warehouse. Weight coefficients related to the type of material represent input parameters in the process of simulation and the determination of potential fire hazard zones. They are determined by a multi-criteria decision-making process using the COPRAS method.
Compared to other, mostly two-dimensional methods, this method enables simple data acquisition in the form of data tables and the generation of a three-dimensional model of the warehouse, which contains spatial points that define potential risk zones. By incorporating the mentioned spatial points within the 3D model of the high-bay warehouse, a sphere is obtained, whose radius represents the critical area of the risk of fire. The results obtained by the proposed method can be a good basis during the planning and design of the warehouse, the layout of the objects, and also when designing the appropriate fire protection and evacuation systems in the warehouse.
Considering how the parameters related to the materials in the warehouse, the dimensions of the object, and the arrangement of the storage units, are generated, as well as the way that the simulation works, the method can be upgraded with other tools such as an optimization algorithm inspired by metaheuristic biology. The focus of further research will be on the attempt to incorporate some of the parameters related to the working environment using some other method of multi-criteria decision-making. The research will also focus on the possibility of implementing some of the meta-heuristic biologically inspired optimization methods for solving a wide range of engineering problems. The goal is to obtain the best possible simulation results and locations of potential risk zones. With the support of logistics IoT platforms, the weights and values of parameters related to materials and working environments can be quantitatively calculated.
Author Contributions
Conceptualization, G.B., M.T. and Z.Č.; methodology, D.U. and B.S.; software, M.T.; validation, G.B. and Z.Č.; formal analysis, G.B., V.M., and M.P.; investigation, M.T. and B.S.; resources, B.S. and M.T.; data curation, D.U.; writing—original draft preparation, G.B and Z.Č.; writing—review and editing, V.M.; visualization, M.T. and M.P.; supervision, D.U., V.M. and Z.Č. All authors have read and agreed to the published version of the manuscript.
Funding
This research received no funding.
Institutional Review Board Statement
Not applicable.
Informed Consent Statement
Not applicable.
Data Availability Statement
All data are presented in the paper (manuscript).
Acknowledgments
This study has been supported by the Republic of Serbia, Ministry of Education, Science and Technological Development through projects no. 451-03-65/2024-03/200108 and 451-03-65/2024-03/200156, and the Faculty of Technical Sciences, University of Novi Sad, through the project “Scientific and Artistic Research Work of Researchers in Teaching and Associate Positions at the Faculty of Technical Sciences, University of Novi Sad” (No. 01-3394/1).
Conflicts of Interest
The authors declare no conflicts of interest.
References
- Alkış, S.; Aksoy, E.; Akpınar, K. Risk Assessment of Industrial Fires for Surrounding Vulnerable Facilities Using a Multi-Criteria Decision Support Approach and GIS. Fire 2021, 4, 53. [Google Scholar] [CrossRef]
- Dinaburg, J.; Gottuk, D.T. Fire Detection in Warehouse Facilities; Springer Briefs in Fire; Springer: New York, NY, USA, 2012; ISBN 978-1-4614-8114-0. [Google Scholar]
- Martin, D.; Tomida, M.; Meacham, B. Environmental Impact of Fire. Fire Sci. Rev. 2016, 5, 5. [Google Scholar] [CrossRef]
- D’Evelyn, S.M.; Jung, J.; Alvarado, E.; Baumgartner, J.; Caligiuri, P.; Hagmann, R.K.; Henderson, S.B.; Hessburg, P.F.; Hopkins, S.; Kasner, E.J.; et al. Wildfire, Smoke Exposure, Human Health, and Environmental Justice Need to Be Integrated into Forest Restoration and Management. Curr. Environ. Health Rep. 2022, 9, 366–385. [Google Scholar] [CrossRef]
- Fu, G.; Wang, J.; Yan, M. Anatomy of Tianjin Port Fire and Explosion: Process and Causes. Process Saf. Prog. 2016, 35, 216–220. [Google Scholar] [CrossRef]
- Course, M.I. MBC News. Ann. Burns Fire Disasters 2020, 33, 265–266. [Google Scholar]
- Xu, L.; Wang, Y.; Chen, J. Analysis of Characteristics of Fire Incident on 24 July 2021 in Jilin Province, China. Safety 2022, 8, 65. [Google Scholar] [CrossRef]
- Tahmid, M.; Jahan, N.; Tasnim, N.; Syeda, S.R. Major Accident Control in Temporary Storage Facilities: An Investigative Consequence Analysis of the Bangladesh Container Depot Accident 2022. ACS Chem. Health Saf. 2022, 29, 494–505. [Google Scholar] [CrossRef]
- Campbell, R. Warehouse Structure Fires; National Fire Protection Association NFPA, Research, Data and Analytics Division: Quincy, MA, USA, 2022. [Google Scholar]
- Tauseef, S.M.; Abbasi, T.; Pompapathi, V.; Abbasi, S.A. Case Studies of 28 Major Accidents of Fires/Explosions in Storage Tank Farms in the Backdrop of Available Codes/Standards/Models for Safely Configuring Such Tank Farms. Process Saf. Environ. Prot. 2018, 120, 331–338. [Google Scholar] [CrossRef]
- Tyldesley, A.; Rew, P.J.; Houlding, R.C. Benefits of Fire Compartmentation in Chemical Warehouses. Process Saf. Environ. Prot. 2004, 82, 331–340. [Google Scholar] [CrossRef]
- Kátai-Urbán, M.; Bíró, T.; Kátai-Urbán, L.; Varga, F.; Cimer, Z. Identification Methodology for Chemical Warehouses Dealing with Flammable Substances Capable of Causing Firewater Pollution. Fire 2023, 6, 345. [Google Scholar] [CrossRef]
- Ding, L.; Ji, J.; Khan, F.; Li, X.; Wan, S. Quantitative Fire Risk Assessment of Cotton Storage and a Criticality Analysis of Risk Control Strategies. Fire Mater. 2020, 44, 165–179. [Google Scholar] [CrossRef]
- Niu, H.; Li, Z. Application of RAC Method in Fire Risk Assessment of Lithium-Ion Battery Factories. Procedia Eng. 2018, 211, 1115–1119. [Google Scholar] [CrossRef]
- Ramezanifar, E.; Gholamizadeh, K.; Mohammadfam, I.; Mirzaei Aliabadi, M. Risk Assessment of Methanol Storage Tank Fire Accident Using Hybrid FTA-SPA. PLoS ONE 2023, 18, e0282657. [Google Scholar] [CrossRef]
- Jafari, M.J.; Pouyakian, M.; Mozaffari, P.; Laal, F.; Mohamadi, H.; Pour, M.T.; Hanifi, S.M. A New Approach to Chemicals Warehouse Risk Analysis Using Computational Fluid Dynamics Simulation and Fuzzy Bayesian Network. Heliyon 2022, 8, e12520. [Google Scholar] [CrossRef]
- Xie, J.; Li, J.; Wang, J.; Jiang, J.; Shu, C.-M. Fire Risk Assessment in Lithium-Ion Battery Warehouse Based on the Bayesian Network. Process Saf. Environ. Prot. 2023, 176, 101–114. [Google Scholar] [CrossRef]
- Prieto Muñoz, B. Calculating the Risk of Fire in Community Pharmacies. Gustav-Purt Method. Sun 2023, 39, 307–318. [Google Scholar] [CrossRef]
- Ju, W.; Su, G.; Wu, L.; Oforiwaa, P.O. The 3D-Dynamic Fire Risk Evaluation Method of Modern Logistics Warehouses: A Modified Gustav Method. Fire Technol. 2023, 1–34. [Google Scholar] [CrossRef]
- Bošković, G.; Čepić, Z.; Ubavin, D. Determination of Relative Weight Coefficients Based on Thermal Characteristics of Materials Using the F-AHP Method. Eng. Today 2022, 1, 27–32. [Google Scholar] [CrossRef]
- Chanthakhot, W.; Ransikarbum, K. Integrated IEW-TOPSIS and Fire Dynamics Simulation for Agent-Based Evacuation Modeling in Industrial Safety. Safety 2021, 7, 47. [Google Scholar] [CrossRef]
- Alinezhad, A.; Khalili, J. COPRAS Method. In New Methods and Applications in Multiple Attribute Decision Making (MADM); International Series in Operations Research & Management Science; Springer International Publishing: Cham, Switzerland, 2019; Volume 277, pp. 87–91. ISBN 978-3-030-15008-2. [Google Scholar]
- Hurley, M.J.; Gottuk, D.; Hall, J.R.; Harada, K.; Kuligowski, E.; Puchovsky, M.; Torero, J.; Watts, J.M.; Wieczorek, C. (Eds.) SFPE Handbook of Fire Protection Engineering; Springer: New York, NY, USA, 2016; ISBN 978-1-4939-2564-3. [Google Scholar]
- Valipour, A.; Yahaya, N.; Md Noor, N.; Antuchevičienė, J.; Tamošaitienė, J. Hybrid SWARA-COPRAS Method for Risk Assessment in Deep Foundation Excavation Project: An Iranian Case Study. J. Civ. Eng. Manag. 2017, 23, 524–532. [Google Scholar] [CrossRef]
- Pandit, C.P.; Chandra, M.; Choubey, A.; Rajak, S. Selection of Suitable Material for the Solar Panel Using SWARA and COPRAS Method. In Recent Trends in Mechanical Engineering; Maurya, A., Srivastava, A.K., Jha, P.K., Pandey, S.M., Eds.; Lecture Notes in Mechanical Engineering; Springer Nature: Singapore, 2023; pp. 153–162. ISBN 978-981-19770-8-4. [Google Scholar]
- Ganesan, K.P.; Dhilip, J.D.J.; Sivalingam, V.; Duraipalam, A.; Seenivasan, G.; Perumal, G.K.; Karthikeyan, B.; Rajagopal, R.K.; Chandran, M. Machinability Analysis and Optimisation of EDM in AA6082/3 Wt% BN/1 Wt% MoS2 Hybrid Composites Using Entropy Method Weights Integrated with Complex Proportional Assessment (COPRAS) Method. Int. J. Adv. Manuf. Technol. 2022, 123, 4051–4064. [Google Scholar] [CrossRef]
- Sampathkumar, S.; Augustin, F.; Kaabar, M.K.; Yue, X.-G. An Integrated Intuitionistic Dense Fuzzy Entropy-COPRAS-WASPAS Approach for Manufacturing Robot Selection. Adv. Mech. Eng. 2023, 15, 168781322311602. [Google Scholar] [CrossRef]
- Bošković, G.; Todorović, M.; Markovic, G.; Čepić, Z.; Mladenović, P. Multi-Aisle Automated Rack Warehouse Simulation for Average Travel Time; Faculty of Mechanical and Civil Engineering: Kraljevo, Serbia, 2023; pp. A53–A58. [Google Scholar]
- Saderova, J.; Rosova, A.; Sofranko, M.; Kacmary, P. Example of Warehouse System Design Based on the Principle of Logistics. Sustainability 2021, 13, 4492. [Google Scholar] [CrossRef]
- Bolaños-Zuñiga, J.; Salazar-Aguilar, M.A.; Saucedo-Martínez, J.A. Solving Location Assignment and Order Picker-Routing Problems in Warehouse Management. Axioms 2023, 12, 711. [Google Scholar] [CrossRef]
- SinemBüyüksaatçı, Ş. Carbon Emission Based Optimisation Approach for the Facility Location Problem. JOR 2014, 4, 9–20. [Google Scholar]
- Sanjaya, A.; Sembiring, A.C.; Willyanto, W. Determination of the Optimal Distribution Centre Location with Gravity Location Model. J. Phys. Conf. Ser. 2019, 1402, 022041. [Google Scholar] [CrossRef]
- Koohathongsumrit, N.; Chankham, W. A Hybrid Approach of Fuzzy Risk Assessment-Based Incenter of Centroid and MCDM Methods for Multimodal Transportation Route Selection. Cogent. Eng. 2022, 9, 2091672. [Google Scholar] [CrossRef]
- Yan, M.; Zhang, Y.; Bocobo, G.A.; Su, Q.; Zhu, K.; Zhang, Q.; Tan, J. A Novel Tissue Separation Method for Determining Upper Trunk Center of Gravity in Patients with Thoracolumbar Kyphosis Using MIMICS. Clin. Biomech. 2020, 71, 101–106. [Google Scholar] [CrossRef] [PubMed]
- Li, Z.; Li, X. Centroid Computation for Shack-Hartmann Wavefront Sensor in Extreme Situations Based on Artificial Neural Networks. Opt. Express 2018, 26, 31675. [Google Scholar] [CrossRef]
- Xiao, J.Z.; Yang, Z.F.; Wang, H.R.; Yang, X.C. Detection Method of Human Three-Dimensional Body Center of Gravity Based on Inclinometer Network. Sens. Mater. 2017, 27, 1081–1087. [Google Scholar] [CrossRef]
- Rajulu, K.V.; Nandanwar, A.; Kiran, M.C. Evaluation of Smoke Density on Combustion of Wood Based Panel Products. Int. J. Mater. Chem. 2013, 2, 225–228. [Google Scholar] [CrossRef]
- Hirschler, M. Fire Properties of Polyvinyl Chloride; GBI International: Mill Valley, CA, USA, 2017. [Google Scholar]
- Kutz, M. Handbook of Environmental Degradation of Materials; Elsevier: Amsterdam, The Netherlands, 2018; ISBN 978-0-323-52472-8. [Google Scholar]
- Ding, L.; Khan, F.; Ji, J. Risk-Based Safety Measure Allocation to Prevent and Mitigate Storage Fire Hazards. Process Saf. Environ. Prot. 2020, 135, 282–293. [Google Scholar] [CrossRef]
- Chivas, C.; Bertrand, J.-P.; Malvaux, C.; Marlair, G.; Tack, K. Smoke Toxicity from Combustion Products Based on Polymers Containing Flame Retardant Additives. In Proceedings of the Flame Retardants Conference, Stamford, CT, USA, 7–9 June 2006; Interscience Communications: London, UK, 2006; pp. 59–69. [Google Scholar]
- Ślusarczyk, B.; Baryń, M.; Kot, S. Tire Industry Products as an Alternative Fuel. Pol. J. Environ. Stud. 2016, 25, 1263–1270. [Google Scholar] [CrossRef]
- Lou, Z.; Wang, K.; Kang, M.; Zhao, W.; Wei, G.; Yue, J.; Yao, H. Plugging Methods for Underground Gas Extraction Boreholes in Coal Seams: A Review of Processes, Challenges and Strategies. Gas Sci. Eng. 2024, 122, 205225. [Google Scholar] [CrossRef]
- Baydaş, M.; Pamučar, D. Determining Objective Characteristics of MCDM Methods under Uncertainty: An Exploration Study with Financial Data. Mathematics 2022, 10, 1115. [Google Scholar] [CrossRef]
- Mentes, D.; Tóth, C.E.; Nagy, G.; Muránszky, G.; Póliska, C. Investigation of Gaseous and Solid Pollutants Emitted from Waste Tire Combustion at Different Temperatures. Waste Manag. 2022, 149, 302–312. [Google Scholar] [CrossRef]
Figure 1.
Flowchart of the proposed method.

Figure 2.
Schematic representation of the formation of a three-dimensional warehouse model and the procedure for obtaining the relevant parameters.
Figure 2.
Schematic representation of the formation of a three-dimensional warehouse model and the procedure for obtaining the relevant parameters.

Figure 3.
Representation of the palette in the form of a material point.

Figure 4.
Layout of a high-bay warehouse with associated dimensions and materials (• wood, • cardboard, • chipboard, • PVC, and • rubber).
Figure 4.
Layout of a high-bay warehouse with associated dimensions and materials (• wood, • cardboard, • chipboard, • PVC, and • rubber).

Figure 5.
Graphic representation of the fire risk zones in the warehouse with isometric view, top view, and side view.
Figure 5.
Graphic representation of the fire risk zones in the warehouse with isometric view, top view, and side view.


Table 1.
Input parameters in the procedure of determining the weighting coefficients required for the simulation.
Table 1.
Input parameters in the procedure of determining the weighting coefficients required for the simulation.
| Material | CO [mg/g] | CO2 [mg/g] | Smoke Density [kg/m3] | Ignition Temperature [°C] | Thermal Conductivity [W/mK] | Specific Heat Capacity [J/(kg K)] | Calorific Value [MJ/kg] |
|---|---|---|---|---|---|---|---|
| Wood | 6 | 1696 | 100 | 350 | 0.15 | 1360 | 14.4 |
| Cardboard | 0.1 | 1450 | 39.8 | 427 | 0.061 | 1400 | 13.5 |
| Plywood | 6 | 1774 | 400 | 150 | 0.13 | 2500 | 17 |
| PVC | 71 | 657 | 55.03 | 391 | 0.185 | 900 | 41 |
| Rubber (tire) | 600 | 1911 | 8000 | 315 | 1.85 | 1880 | 35 |
Table 2.
Decision matrix (CASE 1).
| Criteria | C1 | C2 | C3 | C4 | C5 | C6 | C7 |
|---|---|---|---|---|---|---|---|
| Unit of Measure | [mg/g] | [mg/g] | [kg/m3] | [°C] | [W/mK] | [J/(kg K)] | [MJ/kg] |
| Goal | min | min | min | max | min | max | min |
| Beneficial | Non-Beneficial | ||||||
| Weights | 0.2 | 0.2 | 0.2 | 0.1 | 0.1 | 0.1 | 0.1 |
| A1 | 6 | 1696 | 100 | 350 | 14.4 | 1360 | 0.15 |
| A2 | 0.1 | 1450 | 3.8 | 427 | 13.5 | 1400 | 0.061 |
| A3 | 6 | 1774 | 400 | 150 | 17 | 2500 | 0.13 |
| A4 | 71 | 657 | 55.03 | 391 | 41 | 900 | 0.185 |
| A5 | 600 | 1911 | 8000 | 315 | 35 | 1880 | 1.85 |
Table 3.
Tabular representation of the entire procedure in the process of determining the weight of alternatives, steps 1–6.
Table 3.
Tabular representation of the entire procedure in the process of determining the weight of alternatives, steps 1–6.
| STEP 1 | |||||||
| A1 | 0.00878 | 0.22650 | 0.01168 | 0.21433 | 0.06313 | 0.16915 | 0.11911 |
| A2 | 0.00015 | 0.19364 | 0.00044 | 0.26148 | 0.02567 | 0.17413 | 0.11166 |
| A3 | 0.00878 | 0.23691 | 0.04674 | 0.09186 | 0.05471 | 0.31095 | 0.14061 |
| A4 | 0.10394 | 0.08774 | 0.00643 | 0.23944 | 0.07786 | 0.11194 | 0.33912 |
| A5 | 0.87835 | 0.25521 | 0.93471 | 0.19290 | 0.77862 | 0.23383 | 0.28950 |
| STEP 2 | |||||||
| A1 | 0.00878 | 0.22650 | 0.01168 | 0.21433 | 0.06313 | 0.16915 | 0.11911 |
| A2 | 0.00015 | 0.19364 | 0.00044 | 0.26148 | 0.02567 | 0.17413 | 0.11166 |
| A3 | 0.00878 | 0.23691 | 0.04674 | 0.09186 | 0.05471 | 0.31095 | 0.14061 |
| A4 | 0.10394 | 0.08774 | 0.00643 | 0.23944 | 0.07786 | 0.11194 | 0.33912 |
| A5 | 0.87835 | 0.25521 | 0.93471 | 0.19290 | 0.77862 | 0.23383 | 0.28950 |
| STEP 3 | |||||||
| A1 | 0.00176 | 0.04530 | 0.00234 | 0.02143 | 0.00631 | 0.01692 | 0.01191 |
| A2 | 0.00003 | 0.03873 | 0.00009 | 0.02615 | 0.00257 | 0.01741 | 0.01117 |
| A3 | 0.00176 | 0.04738 | 0.00935 | 0.00919 | 0.00547 | 0.03109 | 0.01406 |
| A4 | 0.02079 | 0.01755 | 0.00129 | 0.02394 | 0.00779 | 0.01119 | 0.03391 |
| A5 | 0.17567 | 0.05104 | 0.18694 | 0.01929 | 0.07786 | 0.02338 | 0.02895 |
| CASE 1 | |||||||
| STEP 4 | STEP 5 | STEP 6 | |||||
| S+i | S−i | S−min/S−i | wei | Ui | Rank | ||
| 0.04939 | 0.0566 | 1 | 0.14821 | 32.8586 | 3 | ||
| 0.03885 | 0.0573 | 0.98738885 | 0.13642 | 30.2442 | 4 | ||
| 0.05849 | 0.0598 | 0.94582261 | 0.15195 | 33.6878 | 2 | ||
| 0.03962 | 0.0768 | 0.73626964 | 0.11238 | 24.9145 | 5 | ||
| 0.41365 | 0.1495 | 0.37844907 | 0.45105 | 100 | 1 | ||
| CASE 2 | |||||||
| STEP 4 | STEP 5 | STEP 6 | |||||
| S+i | S−i | S−min/S−i | wci | Ui | Rank | ||
| 0.03364 | 0.07181 | 0.890464834 | 0.191791 | 82.62265 | 4 | ||
| 0.03168 | 0.06584 | 0.971262209 | 0.204186 | 87.96209 | 3 | ||
| 0.05135 | 0.06871 | 0.930749428 | 0.216658 | 93.33521 | 2 | ||
| 0.05452 | 0.06395 | 1 | 0.232129 | 100 | 1 | ||
| 0.12880 | 0.42969 | 0.148824442 | 0.155235 | 66.87452 | 5 | ||
Table 4.
Coordinates of potential fire risk zones, distance r, and radius R for cases 1 and 2 (when tire occupies the last two racks).
Table 4.
Coordinates of potential fire risk zones, distance r, and radius R for cases 1 and 2 (when tire occupies the last two racks).
| Variant | X | Y | Z | r | R | View | Variant | X | Y | Z | r | R | View |
|---|---|---|---|---|---|---|---|---|---|---|---|---|---|
| Variant 1.1 | 13.85 | 12.11 | 5.05 | 19.08 | 1.054 |  | Variant 1.2 | 12.19 | 11.98 | 4.76 | 17.74 | 1.038 |  |
| Variant 2.1 | 7.94 | 12.11 | 5.05 | 15.34 | 0.742 |  | Variant 2.2 | 6.38 | 11.95 | 4.76 | 14.36 | 1.142 |  |
| Variant 3.1 | 11.61 | 8.40 | 4.80 | 15.11 | 1.018 |  | Variant 3.2 | 9.23 | 8.40 | 4.80 | 13.37 | 1.584 |  |
| Variant 4.1 | 11.61 | 15.60 | 4.8 | 20.03 | 1.018 |  | Variant 4.2 | 9.23 | 15.60 | 4.80 | 18.75 | 1.584 |  |
| Variant 5.1 | 11.51 | 11.56 | 3.45 | 16.67 | 0.648 |  | Variant 5.2 | 9.12 | 11.57 | 3.47 | 15.14 | 1.249 |  |
| Variant 6.1 | 11.61 | 12.46 | 6.21 | 18.13 | 0.654 |  | Variant 6.2 | 9.23 | 12.46 | 6.21 | 16.70 | 1.379 |  |
| Variant 7.1 | 11.61 | 11.84 | 4.89 | 17.29 | 0.862 |  | Variant 7.2 | 9.23 | 11.84 | 4.87 | 15.78 | 1.493 |  |
Table 5.
Coordinates of potential fire risk zones, distance r, and radius R for cases 1 and 2 (when tire occupies the first two racks).
Table 5.
Coordinates of potential fire risk zones, distance r, and radius R for cases 1 and 2 (when tire occupies the first two racks).
| Variant | X | Y | Z | r | R | View | Variant | X | Y | Z | r | R | View |
|---|---|---|---|---|---|---|---|---|---|---|---|---|---|
| Variant 1.1 | 10.73 | 11.89 | 4.56 | 16.65 | 0.757 |  | Variant 1.2 | 12.56 | 12 | 4.82 | 18.03 | 1.242 |  |
| Variant 2.1 | 4.82 | 11.90 | 4.56 | 13.62 | 0.976 |  | Variant 2.2 | 6.76 | 12 | 4.82 | 14.59 | 1.006 |  |
| Variant 3.1 | 7.01 | 8.40 | 4.80 | 11.95 | 1 |  | Variant 3.2 | 9.78 | 8.40 | 4.80 | 13.76 | 1.426 |  |
| Variant 4.1 | 7.01 | 15.60 | 4.8 | 17.76 | 1 |  | Variant 4.2 | 9.78 | 15.60 | 4.80 | 19.03 | 1.426 |  |
| Variant 5.1 | 6.97 | 11.56 | 3.45 | 13.93 | 0.578 |  | Variant 5.2 | 9.66 | 11.57 | 3.48 | 15.47 | 1.262 |  |
| Variant 6.1 | 7.01 | 12.46 | 6.21 | 15.59 | 0.626 |  | Variant 6.2 | 9.78 | 12.46 | 6.21 | 17.01 | 1.193 |  |
| Variant 7.1 | 7.05 | 11.82 | 4.88 | 14.60 | 0.838 |  | Variant 7.2 | 9.78 | 11.84 | 4.87 | 16.11 | 1.322 |  |
Disclaimer/Publisher’s Note: The statements, opinions and data contained in all publications are solely those of the individual author(s) and contributor(s) and not of MDPI and/or the editor(s). MDPI and/or the editor(s) disclaim responsibility for any injury to people or property resulting from any ideas, methods, instructions or products referred to in the content. |
© 2024 by the authors. Licensee MDPI, Basel, Switzerland. This article is an open access article distributed under the terms and conditions of the Creative Commons Attribution (CC BY) license (https://creativecommons.org/licenses/by/4.0/).
Share and Cite
MDPI and ACS Style
Bošković, G.; Todorović, M.; Ubavin, D.; Stepanov, B.; Mihajlović, V.; Perović, M.; Čepić, Z. A New Method for the Determination of Fire Risk Zones in High-Bay Warehouses. Fire 2024, 7, 149. https://doi.org/10.3390/fire7040149
AMA Style
Bošković G, Todorović M, Ubavin D, Stepanov B, Mihajlović V, Perović M, Čepić Z. A New Method for the Determination of Fire Risk Zones in High-Bay Warehouses. Fire. 2024; 7(4):149. https://doi.org/10.3390/fire7040149
Chicago/Turabian StyleBošković, Goran, Marko Todorović, Dejan Ubavin, Borivoj Stepanov, Višnja Mihajlović, Marija Perović, and Zoran Čepić. 2024. "A New Method for the Determination of Fire Risk Zones in High-Bay Warehouses" Fire 7, no. 4: 149. https://doi.org/10.3390/fire7040149