


Experimental Linear and Nonlinear Vibration Methods for the Structural Health Monitoring (SHM) of Polymer-Matrix Composites (PMCs): A Literature Review


Abstract
:1. Introduction
2. Reminder about PMCs and Their Damage Mechanisms
2.1. Composition and Structure of PMC
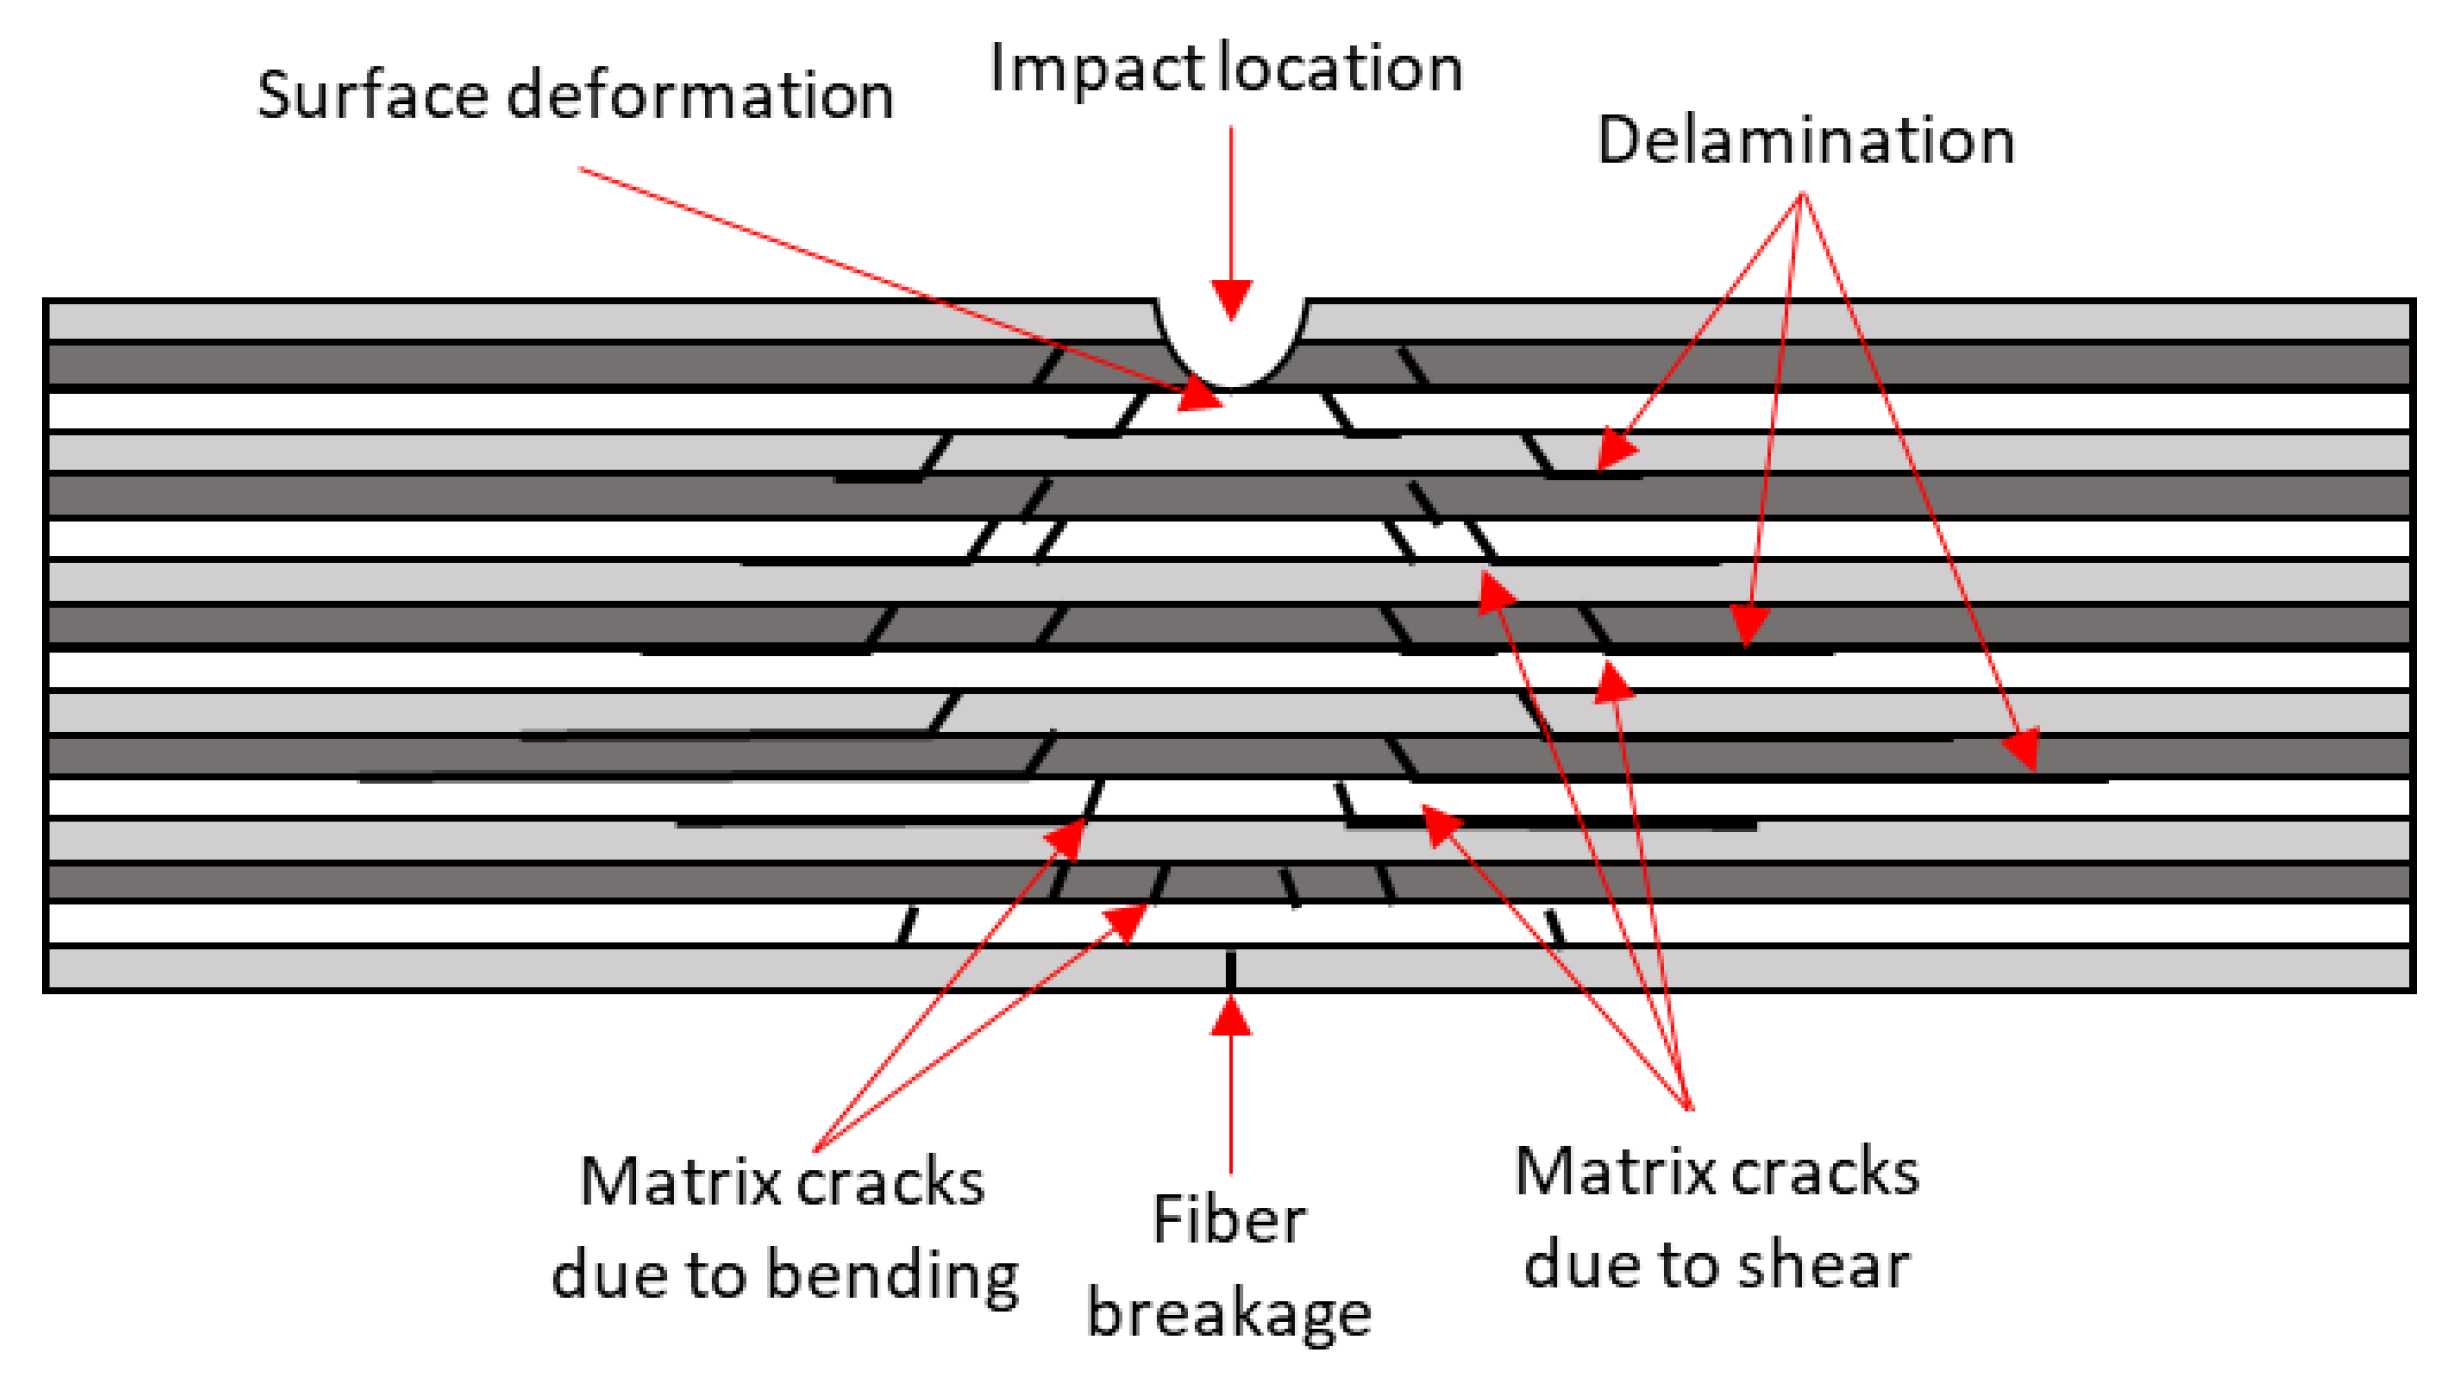
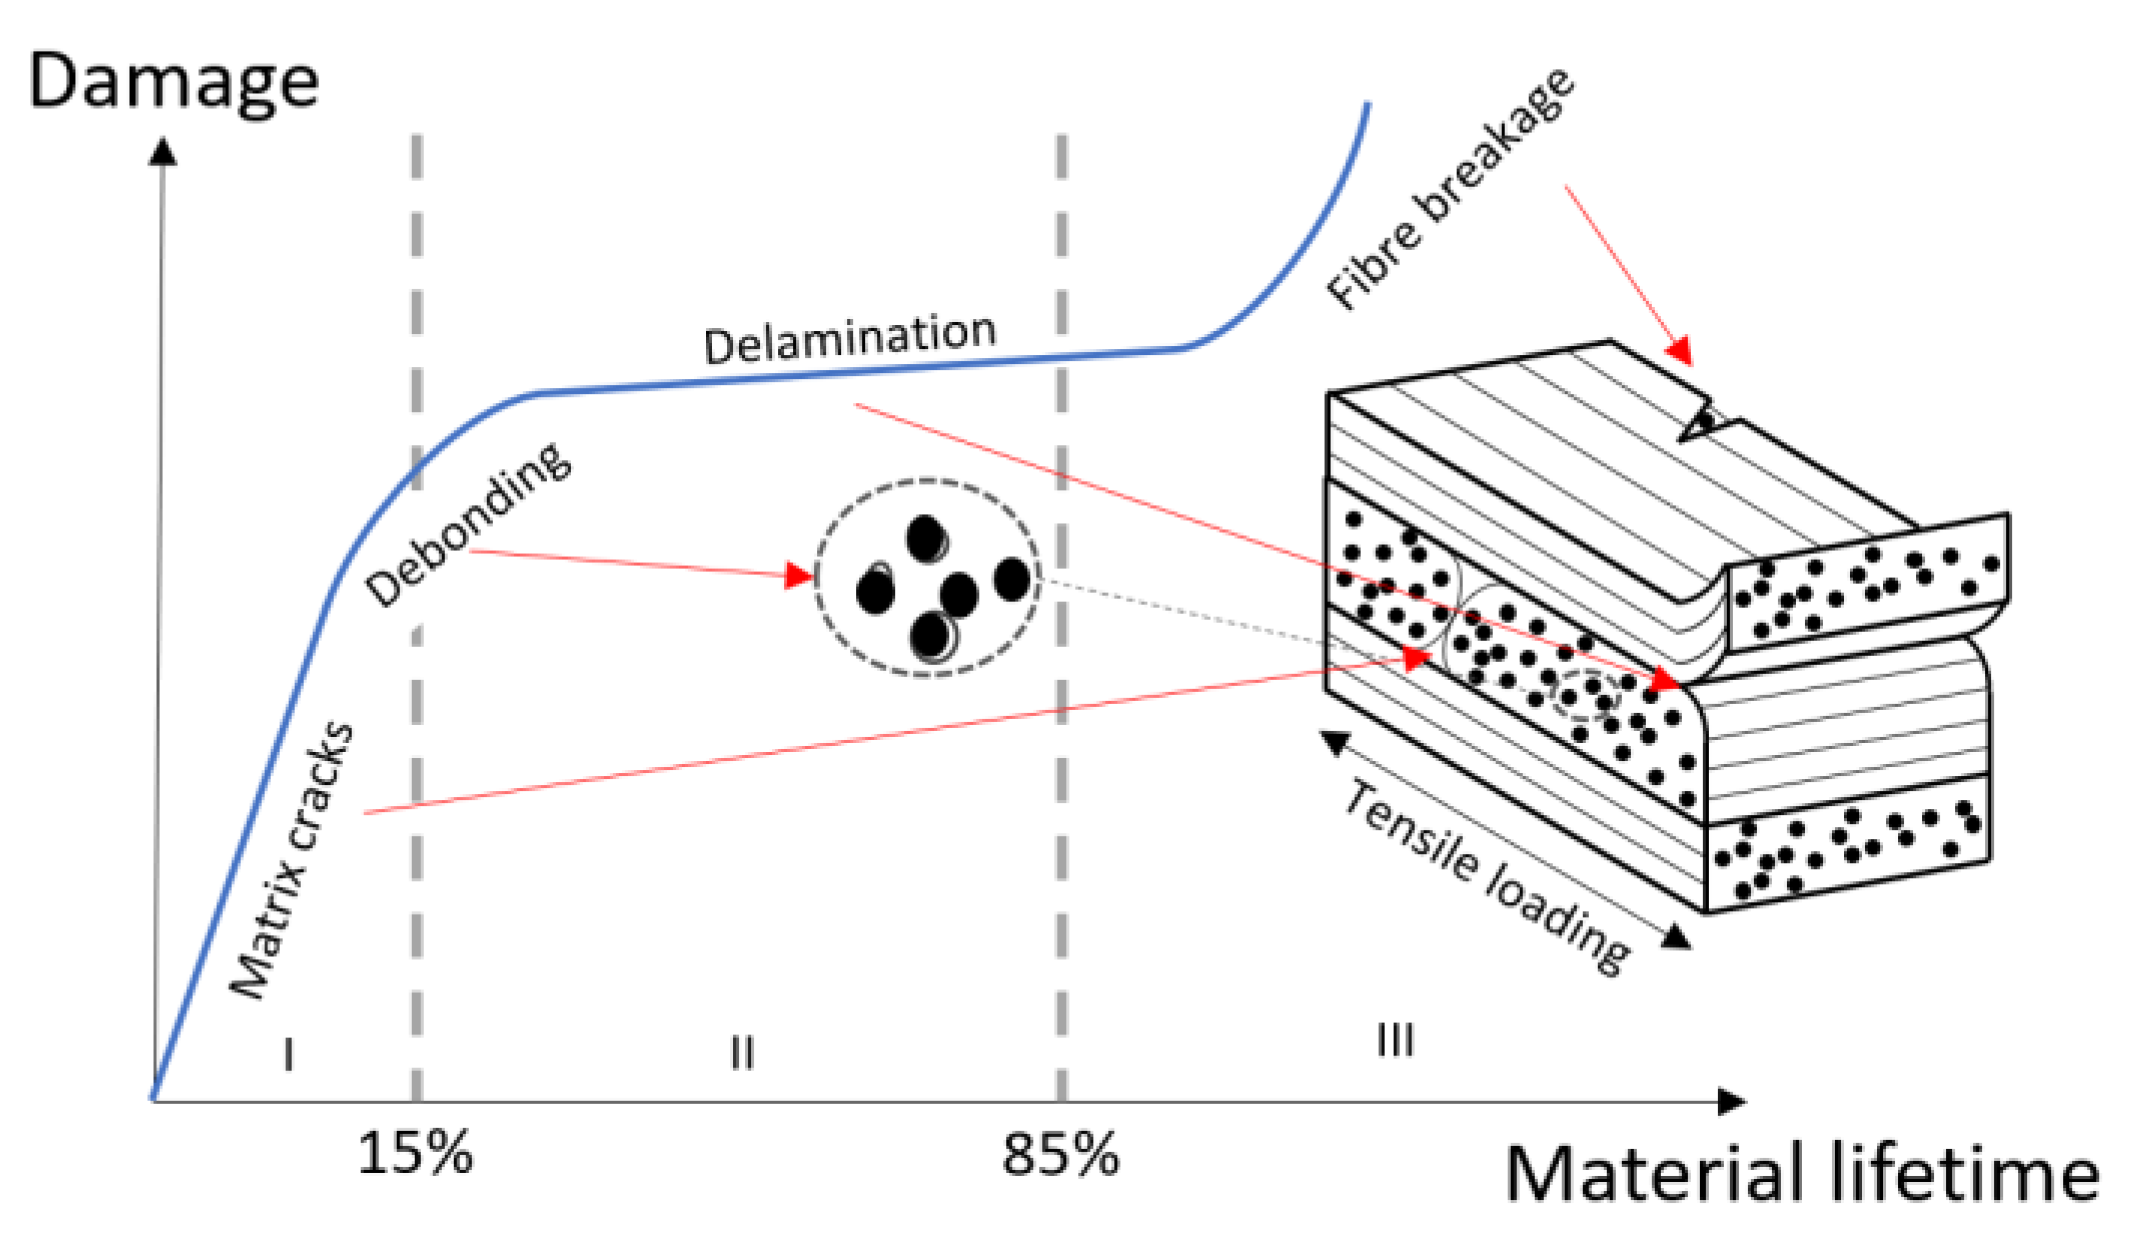
2.2. Damage Mechanisms
2.2.1. Matrix Cracking
2.2.2. Fiber-Matrix Interfacial Debonding
2.2.3. Delamination or Interlaminar Cracking
2.2.4. Fiber Breaking
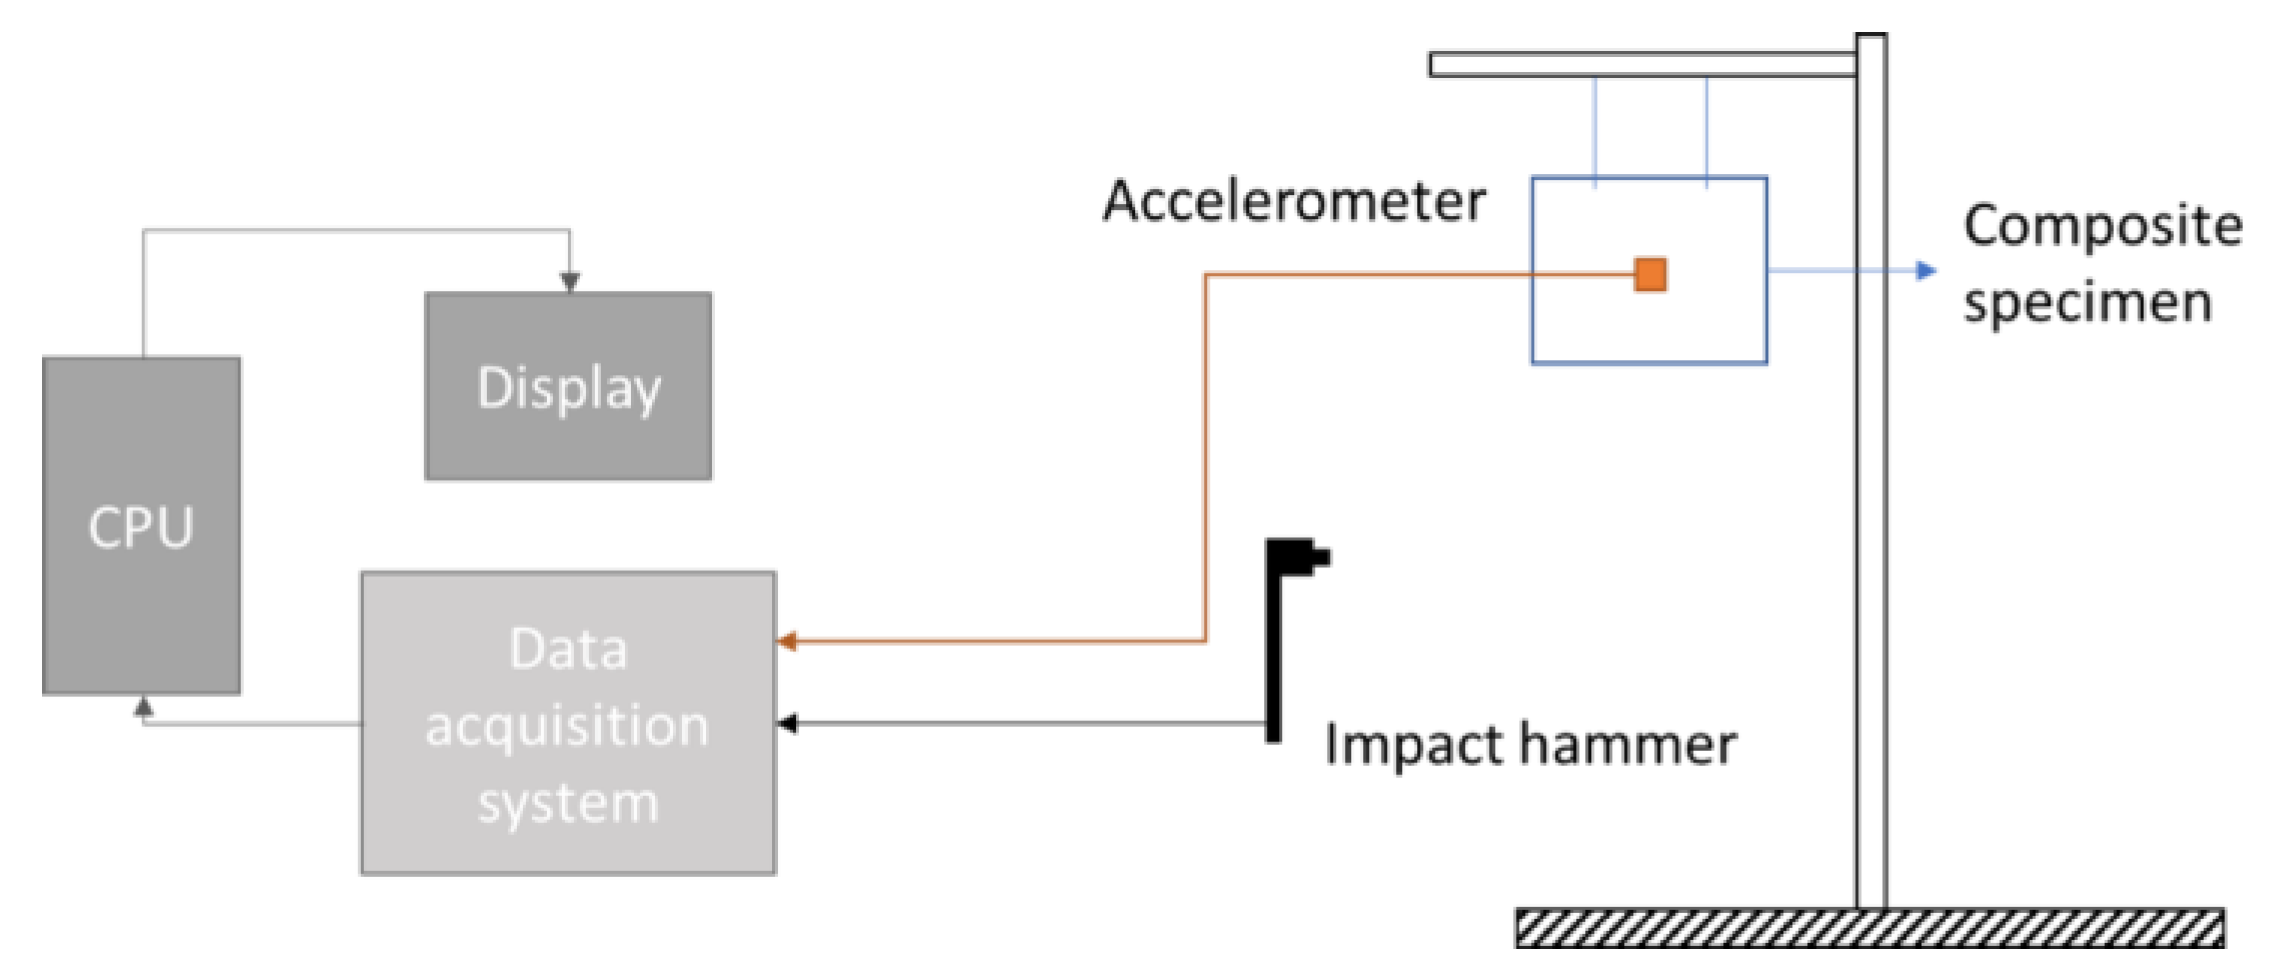
3. Equipment and Setup for Vibration Analysis
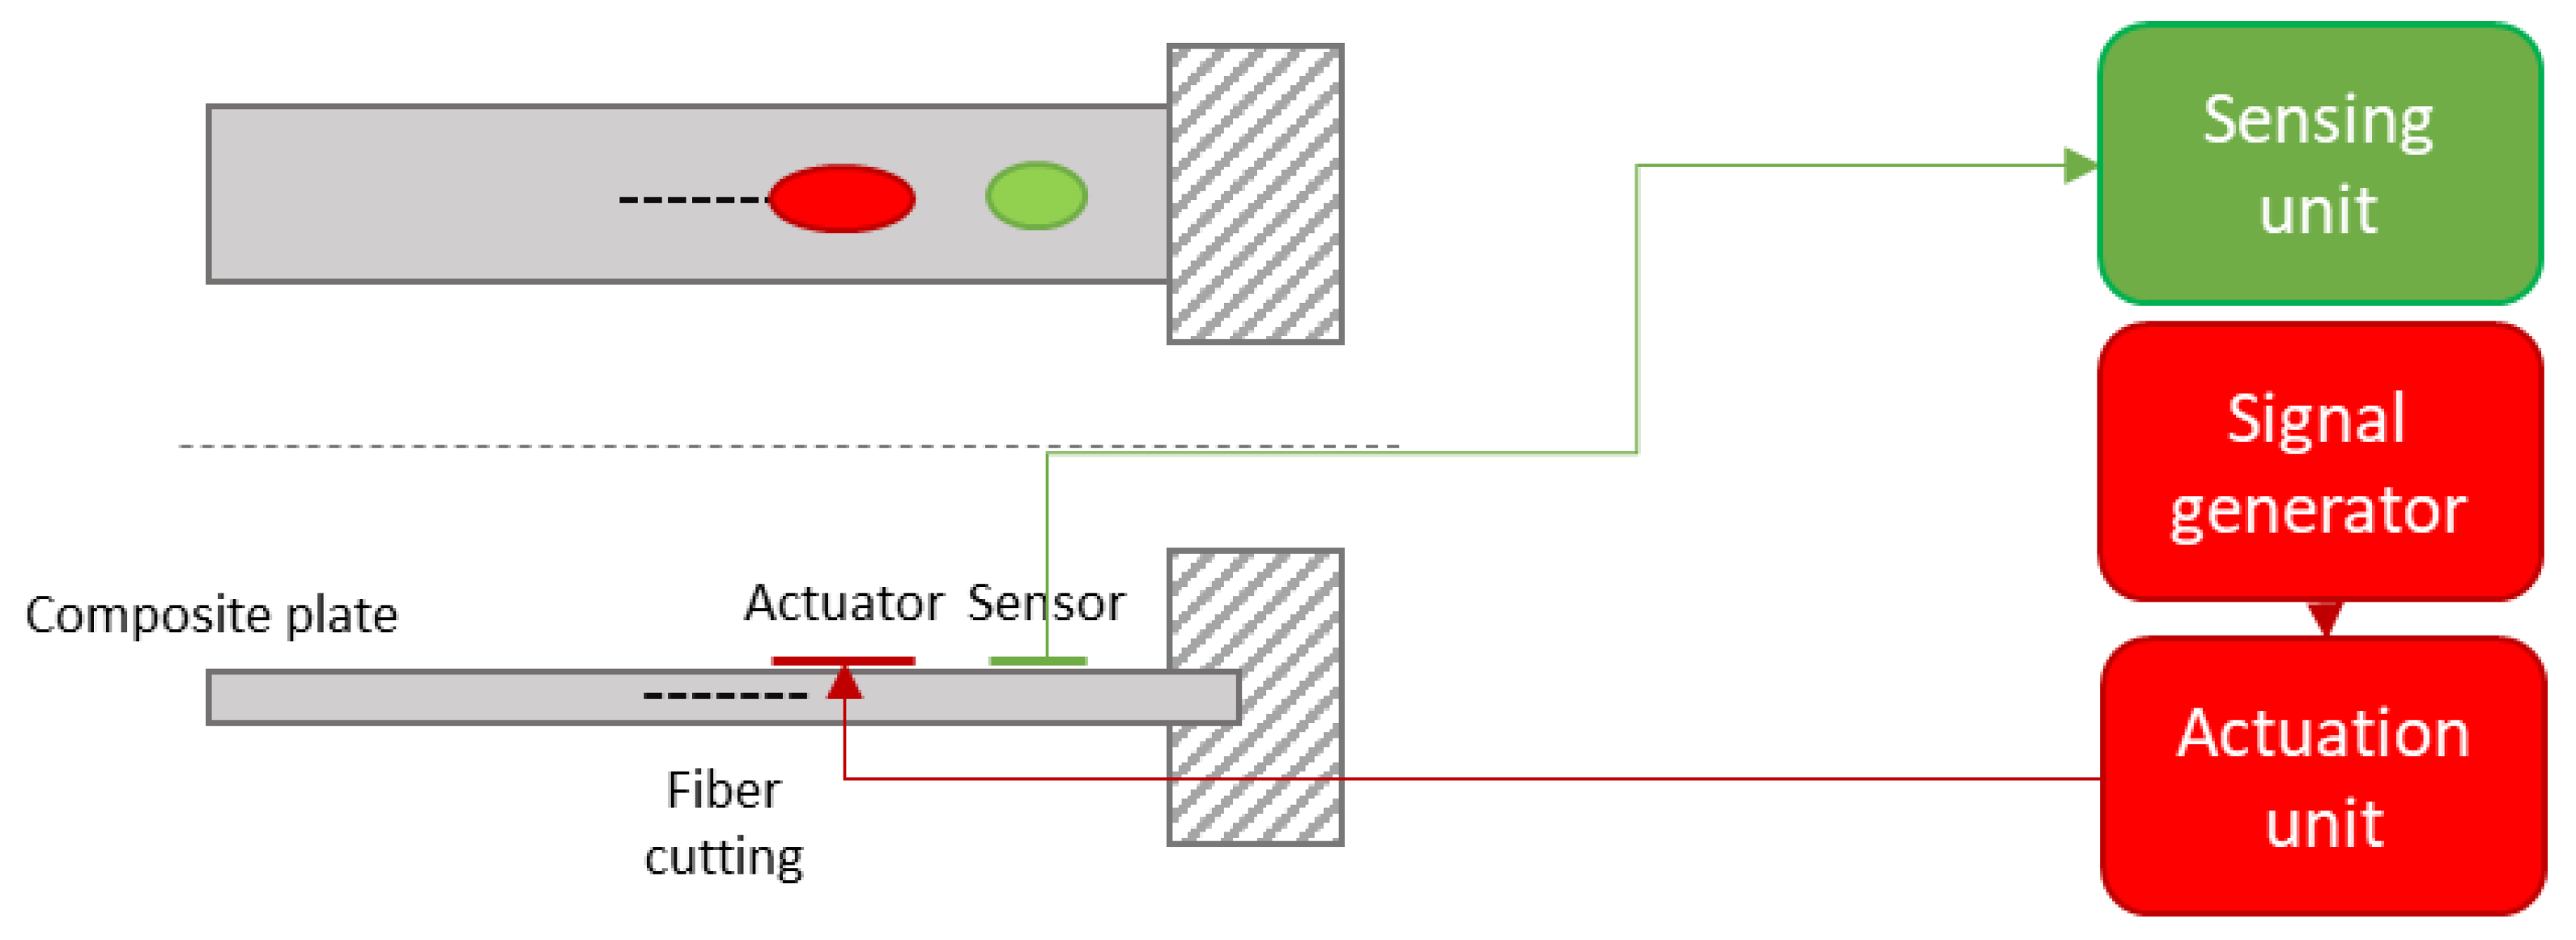
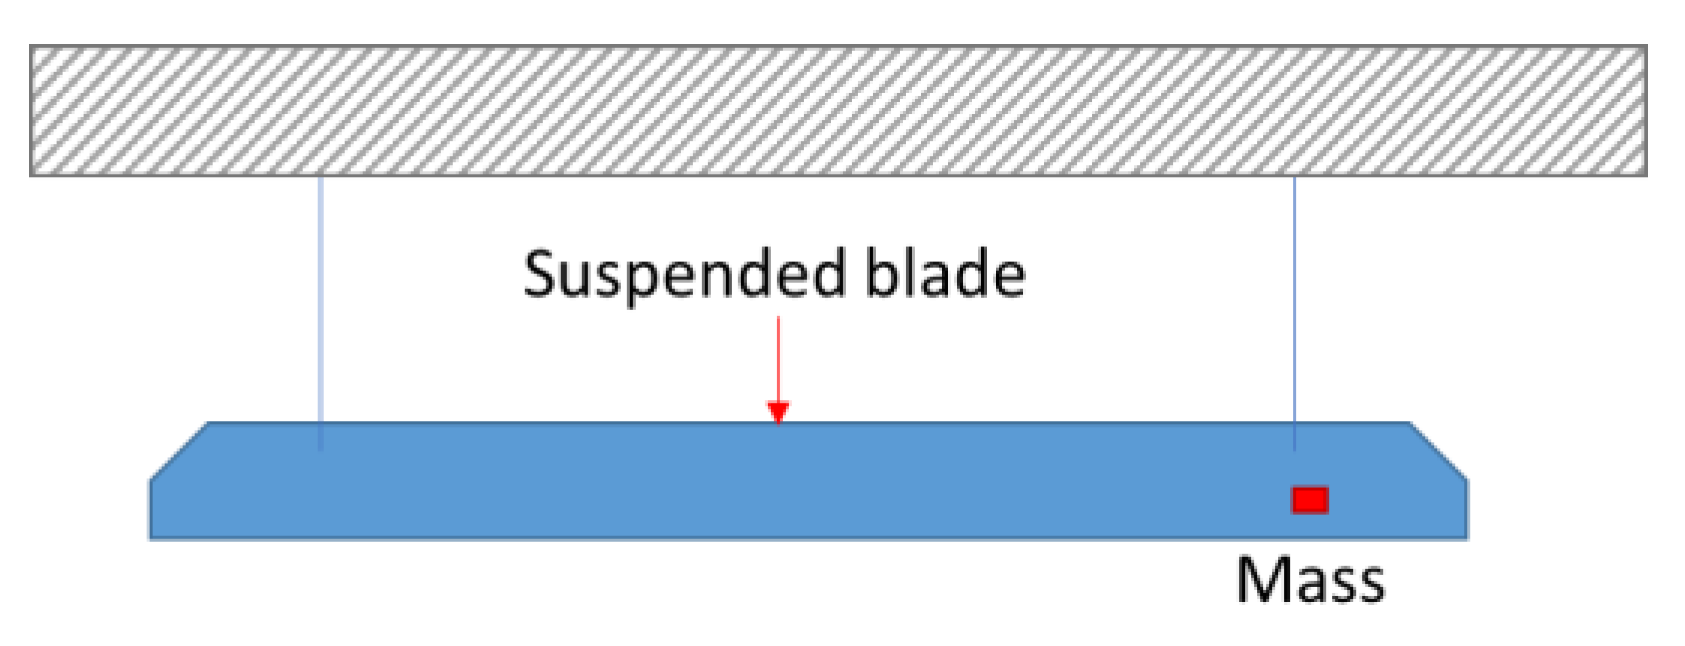
3.1. Fixation Setup
3.2. Actuators and Sensors
3.3. Data Processing
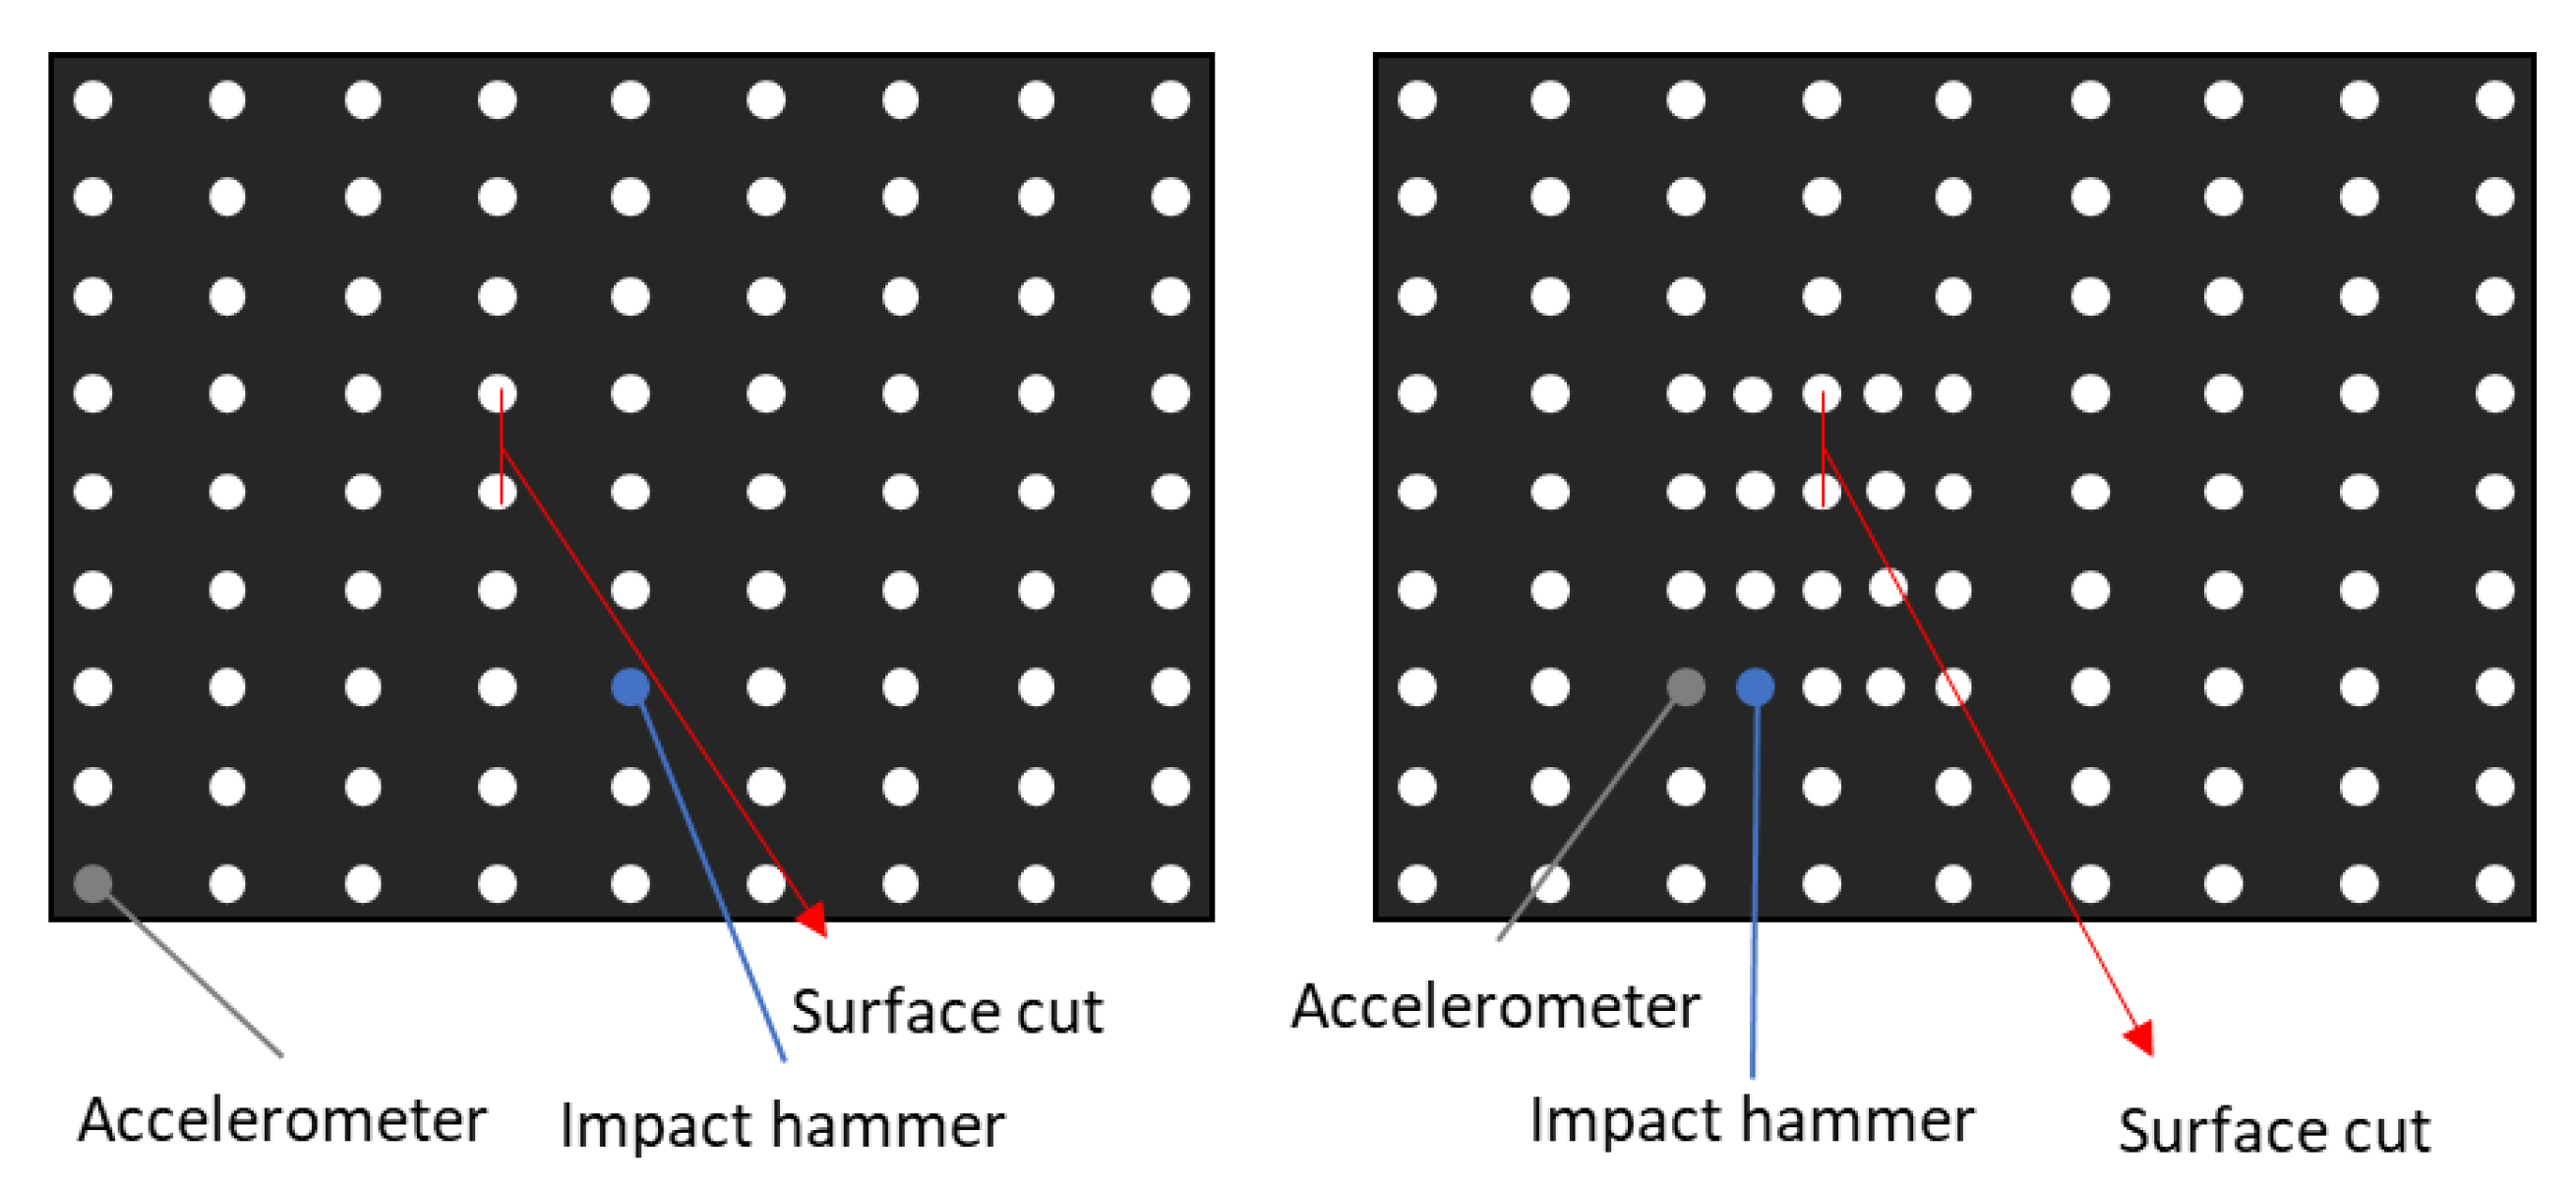
3.4. Sensor Placement
4. Vibration Methods for SHM
4.1. Linear Vibration Methods
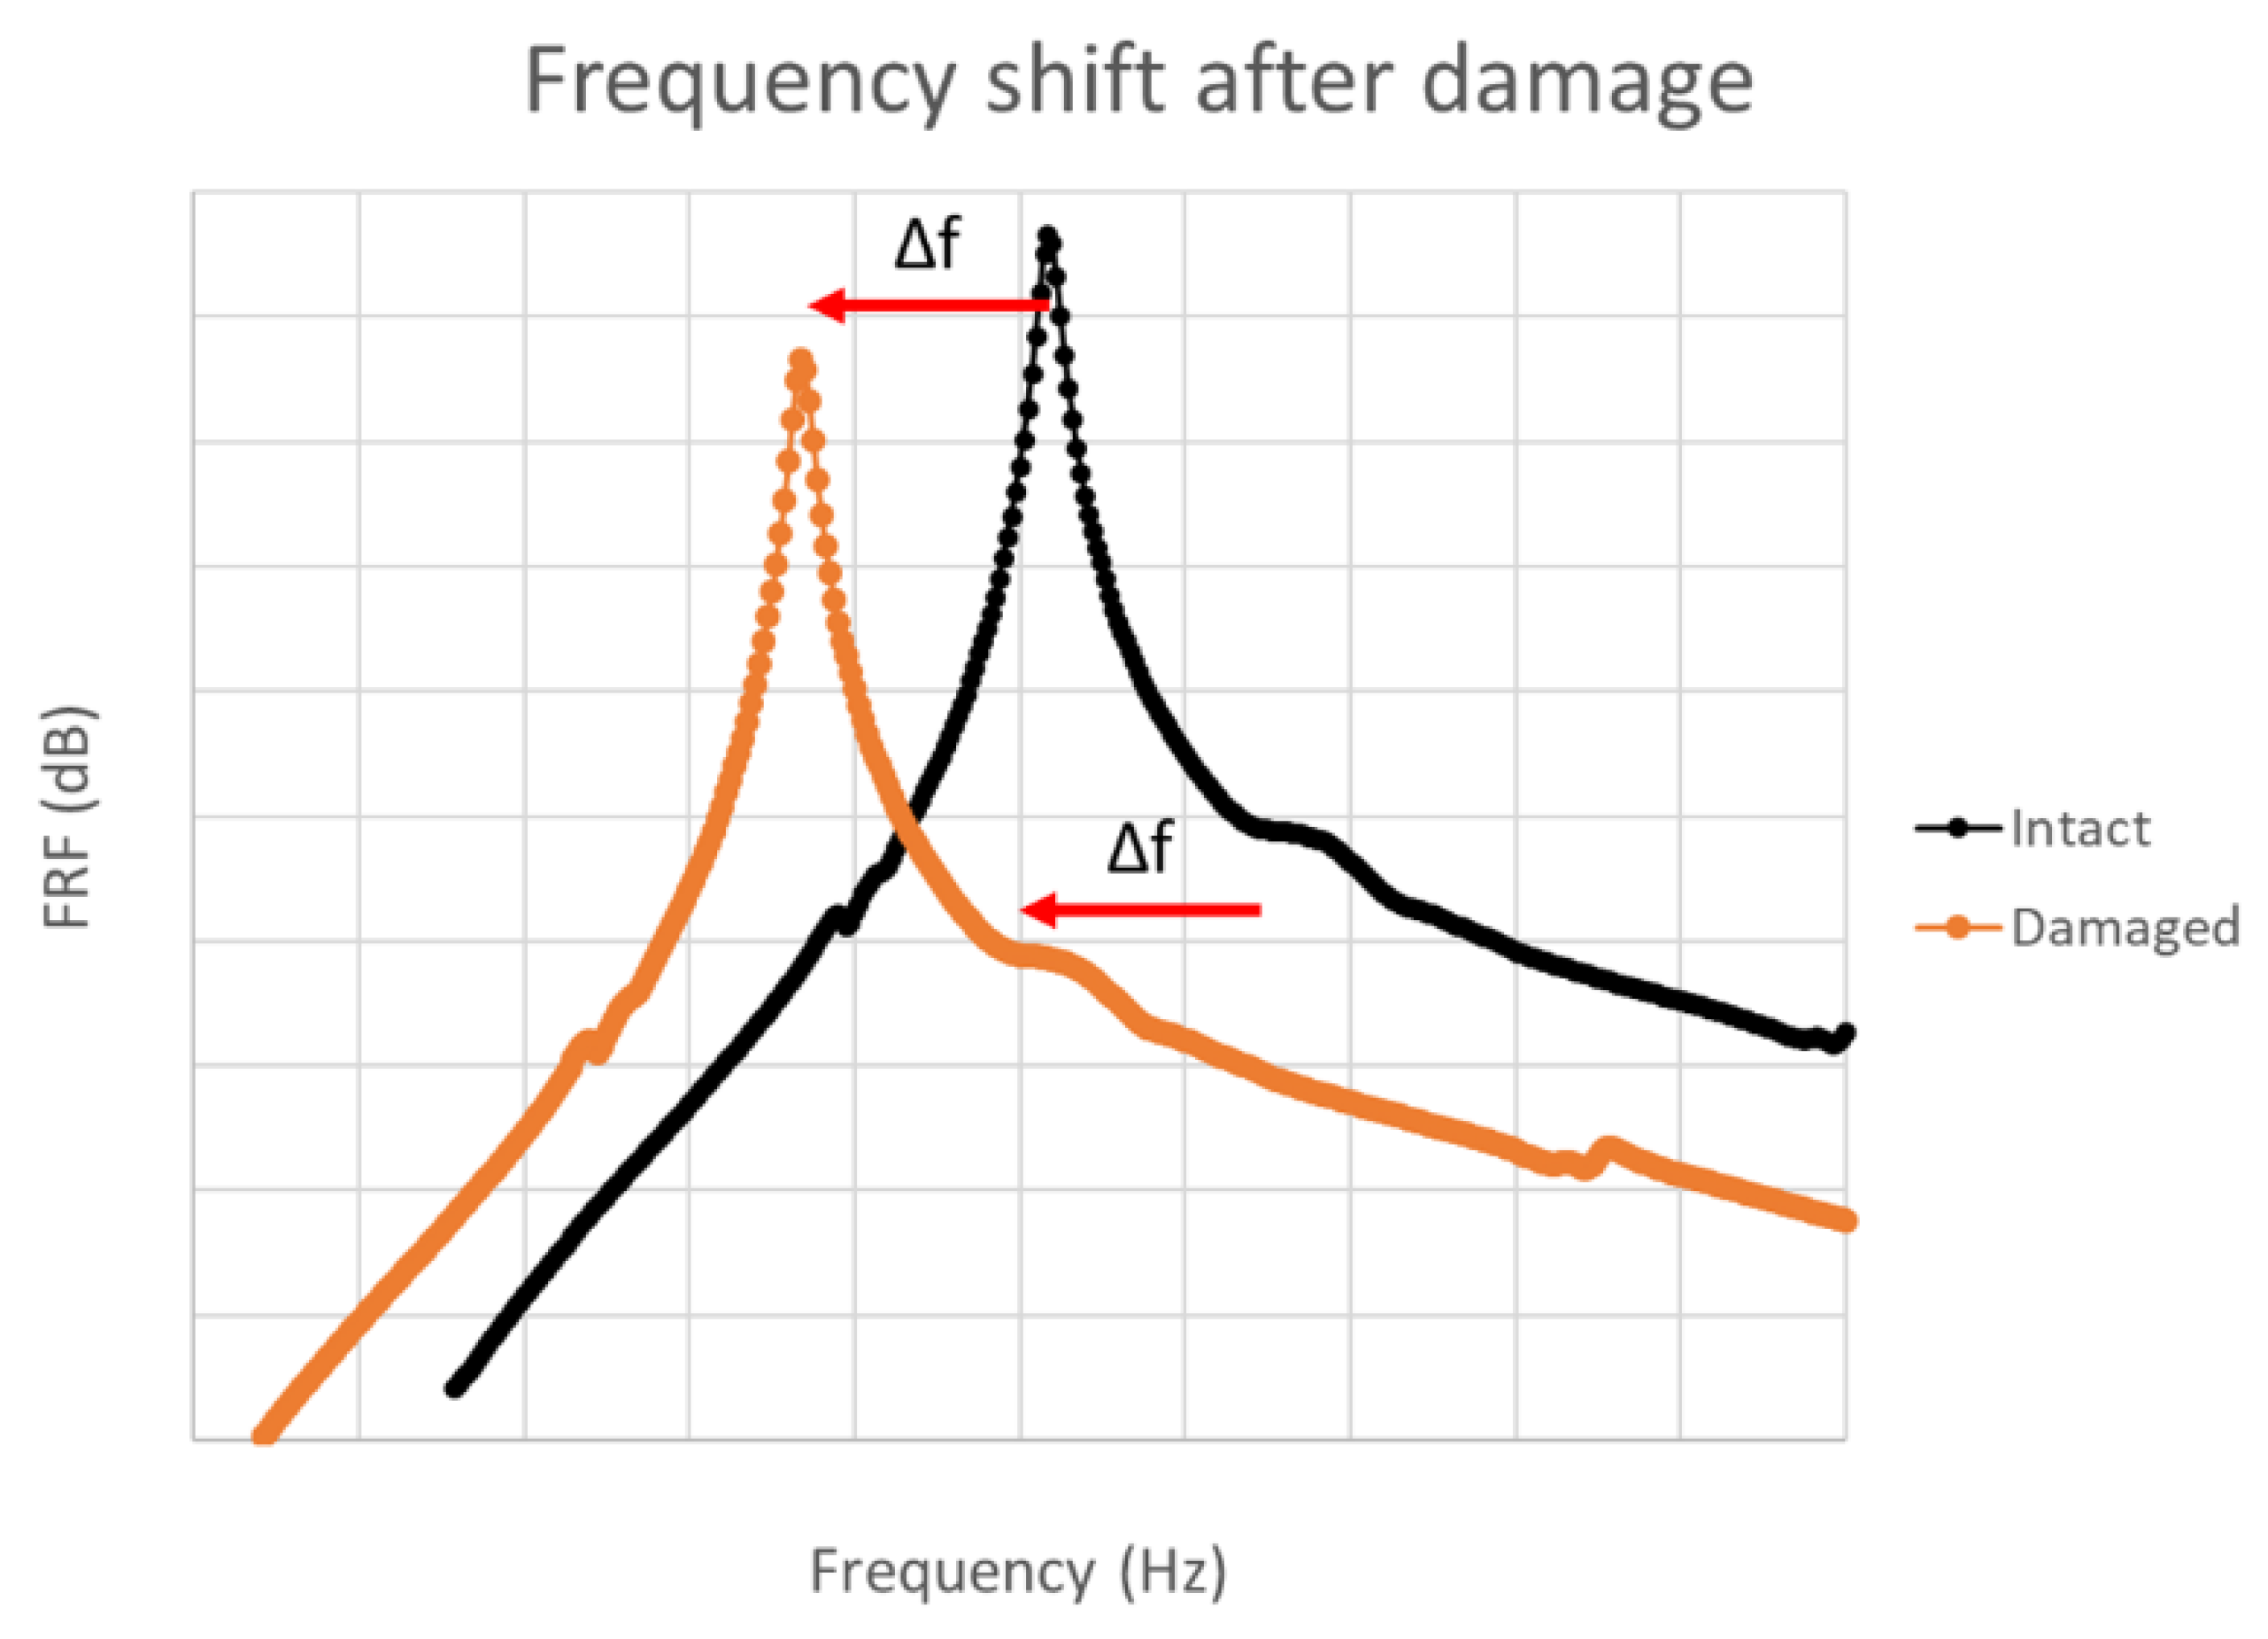
4.1.1. Natural Frequencies
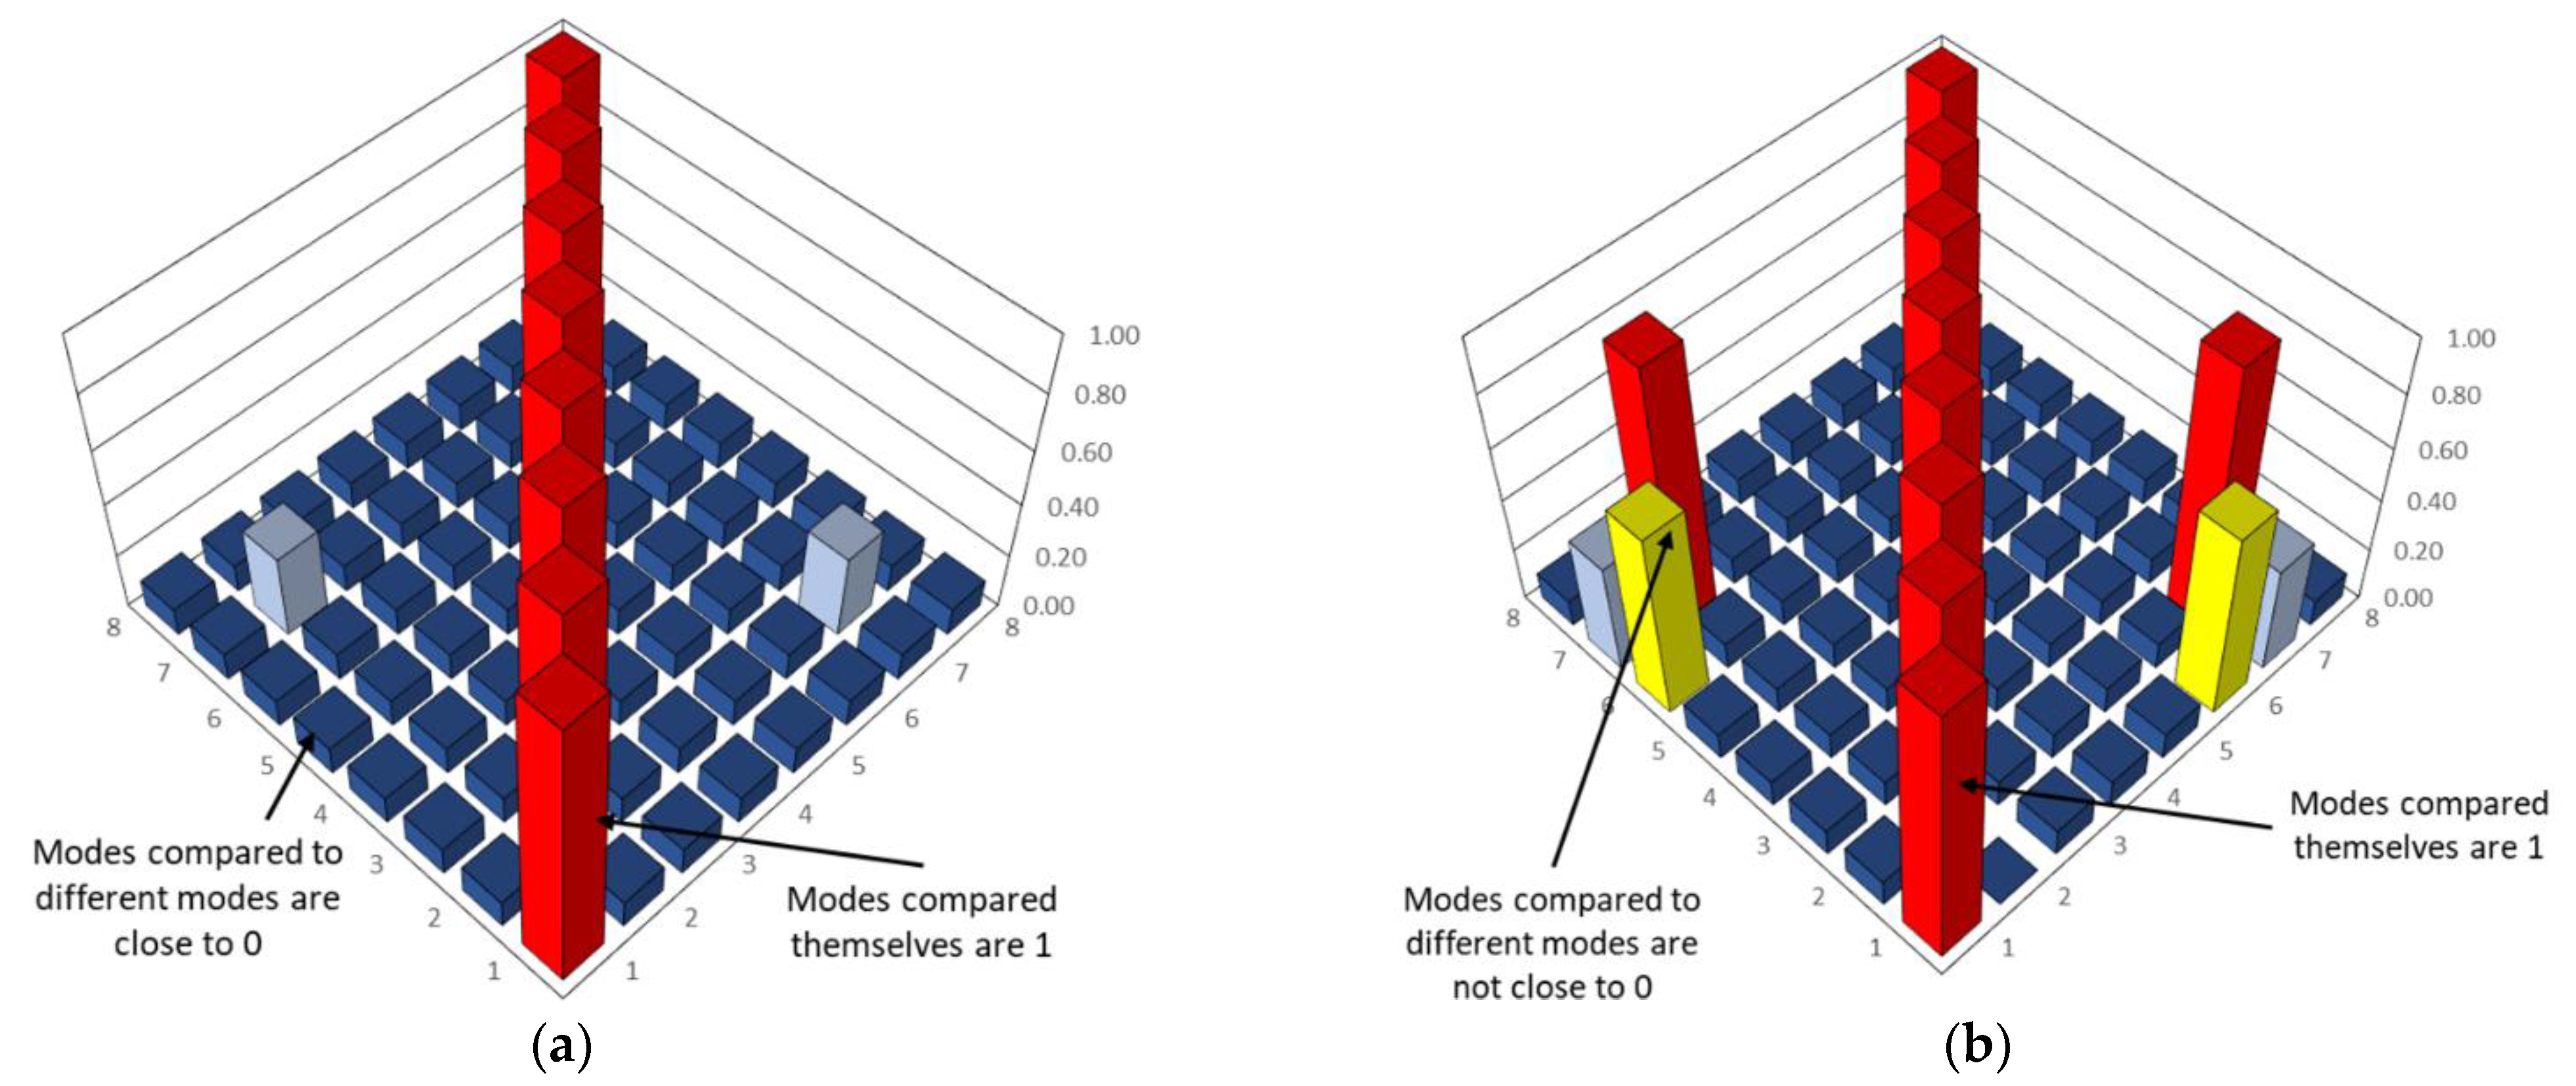
4.1.2. Mode Shapes
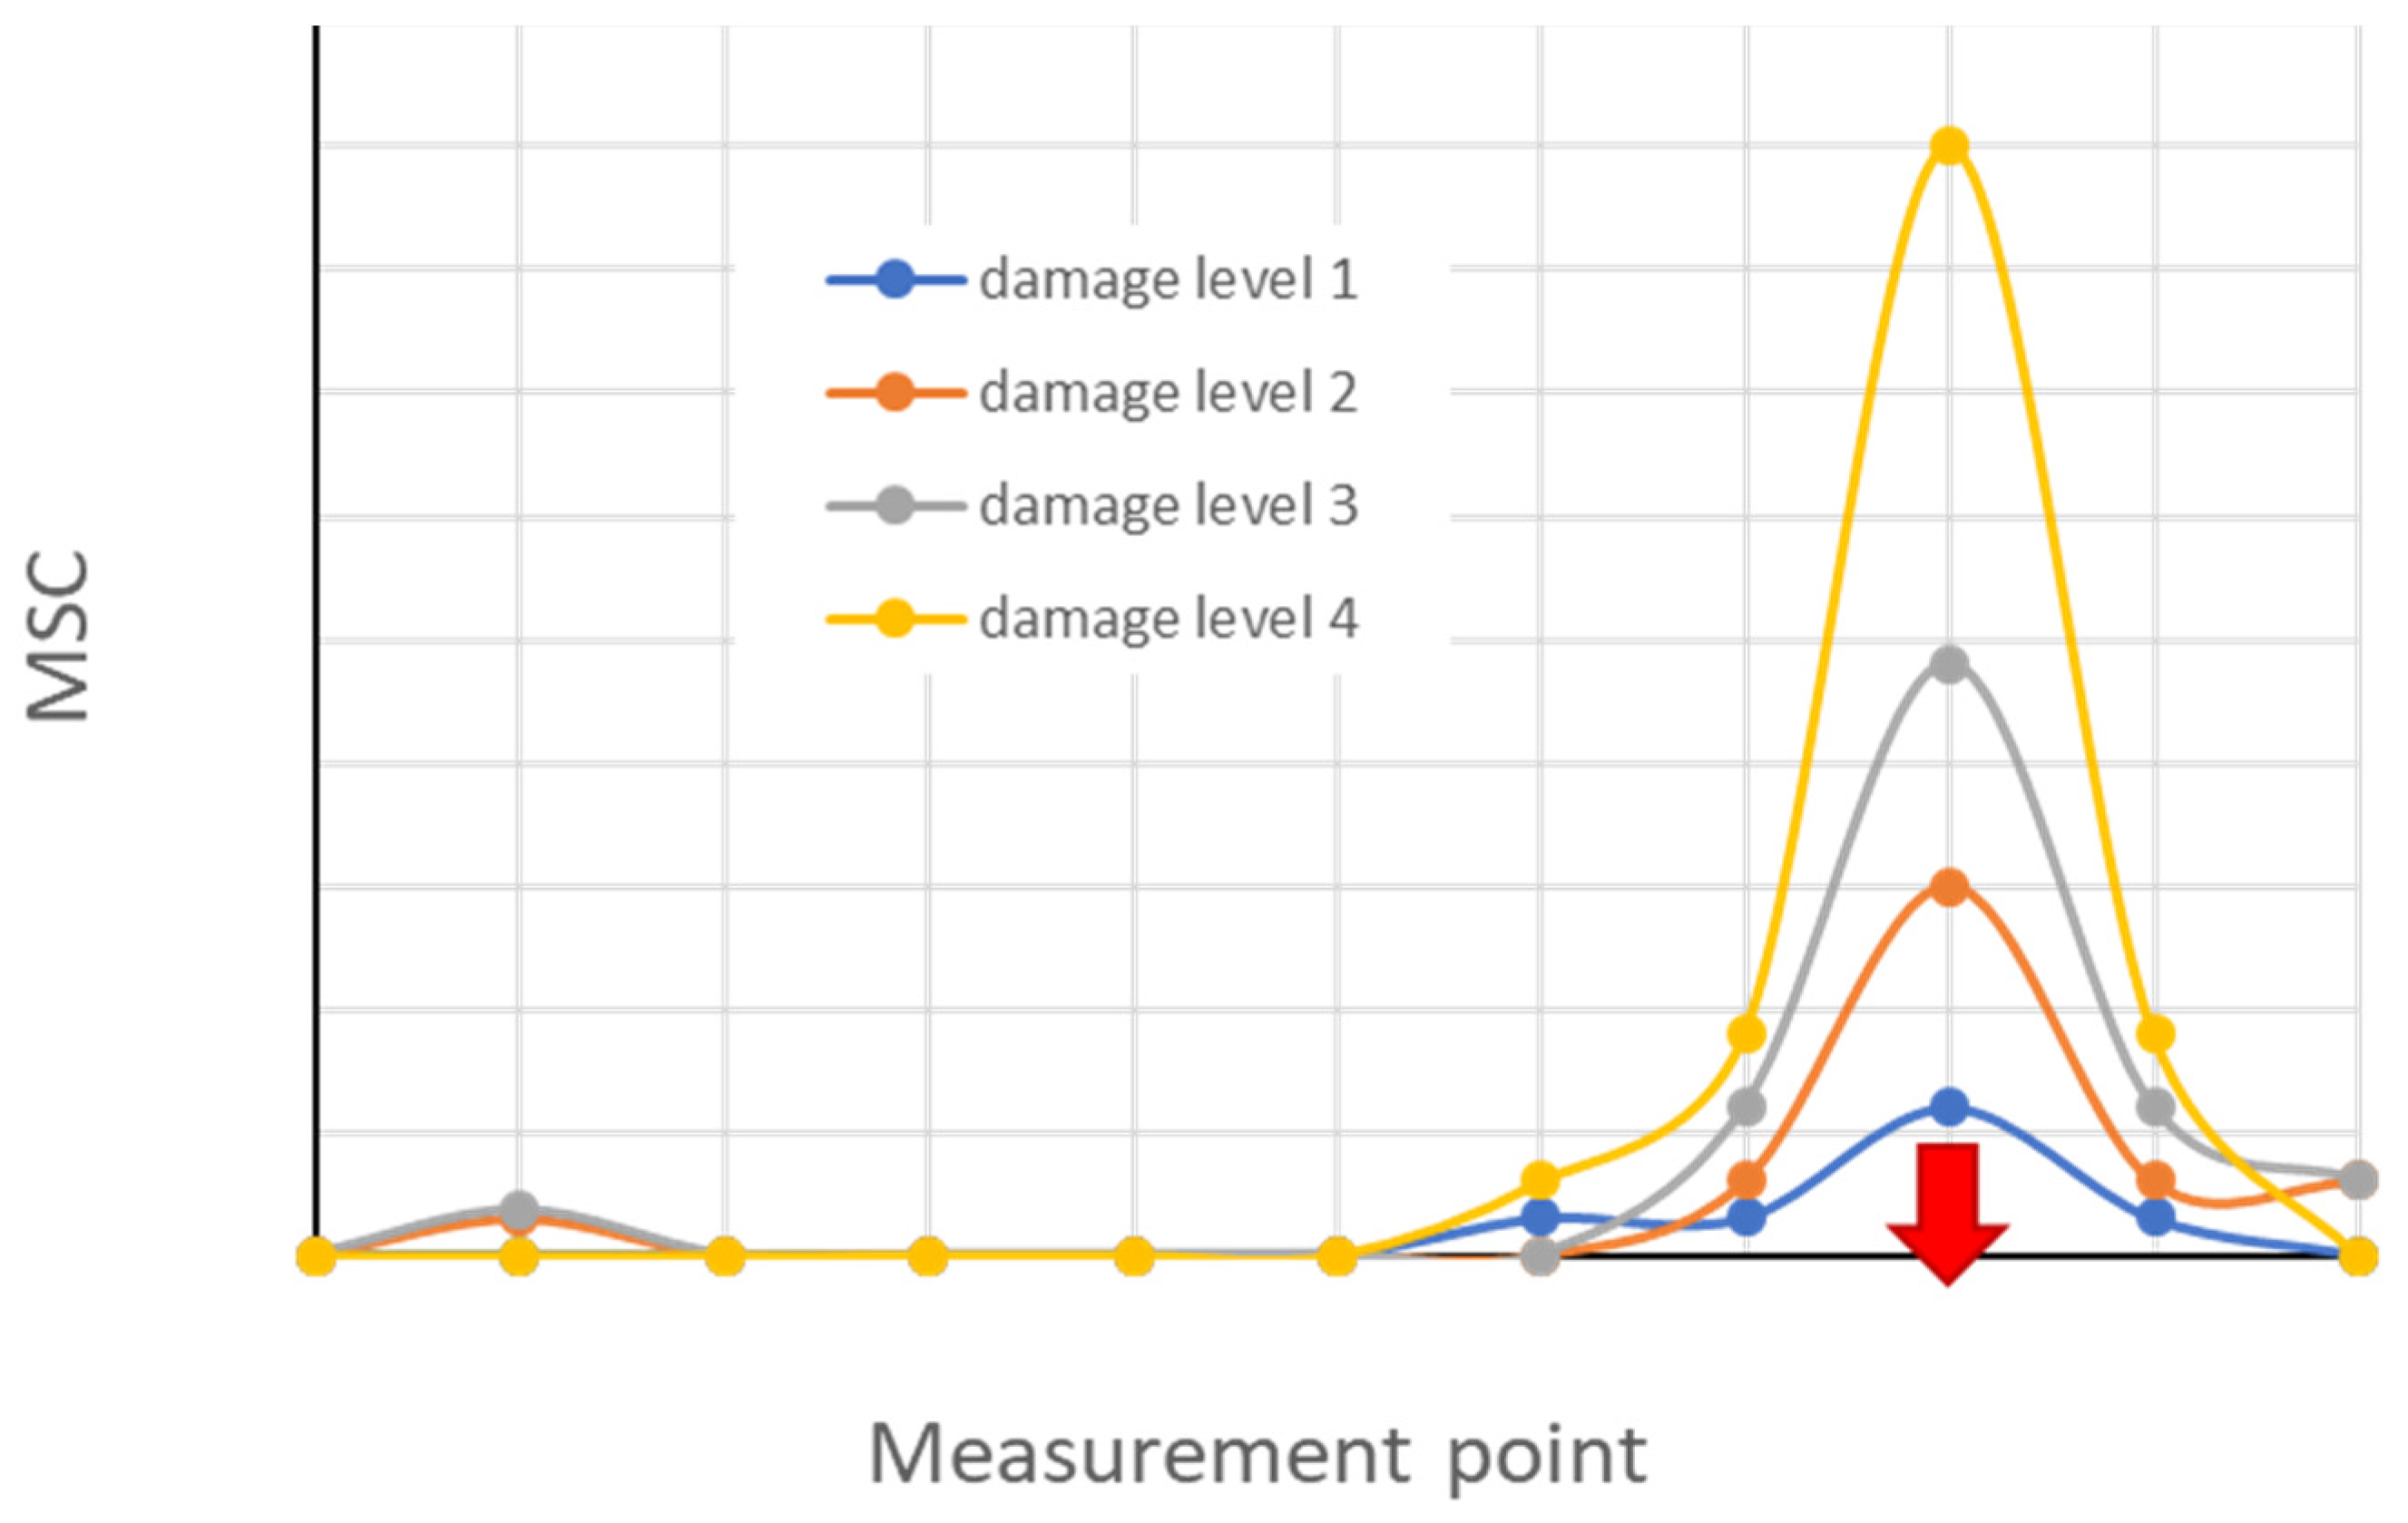
4.1.3. Mode Shape Curvature
4.1.4. Modal Strain Energy
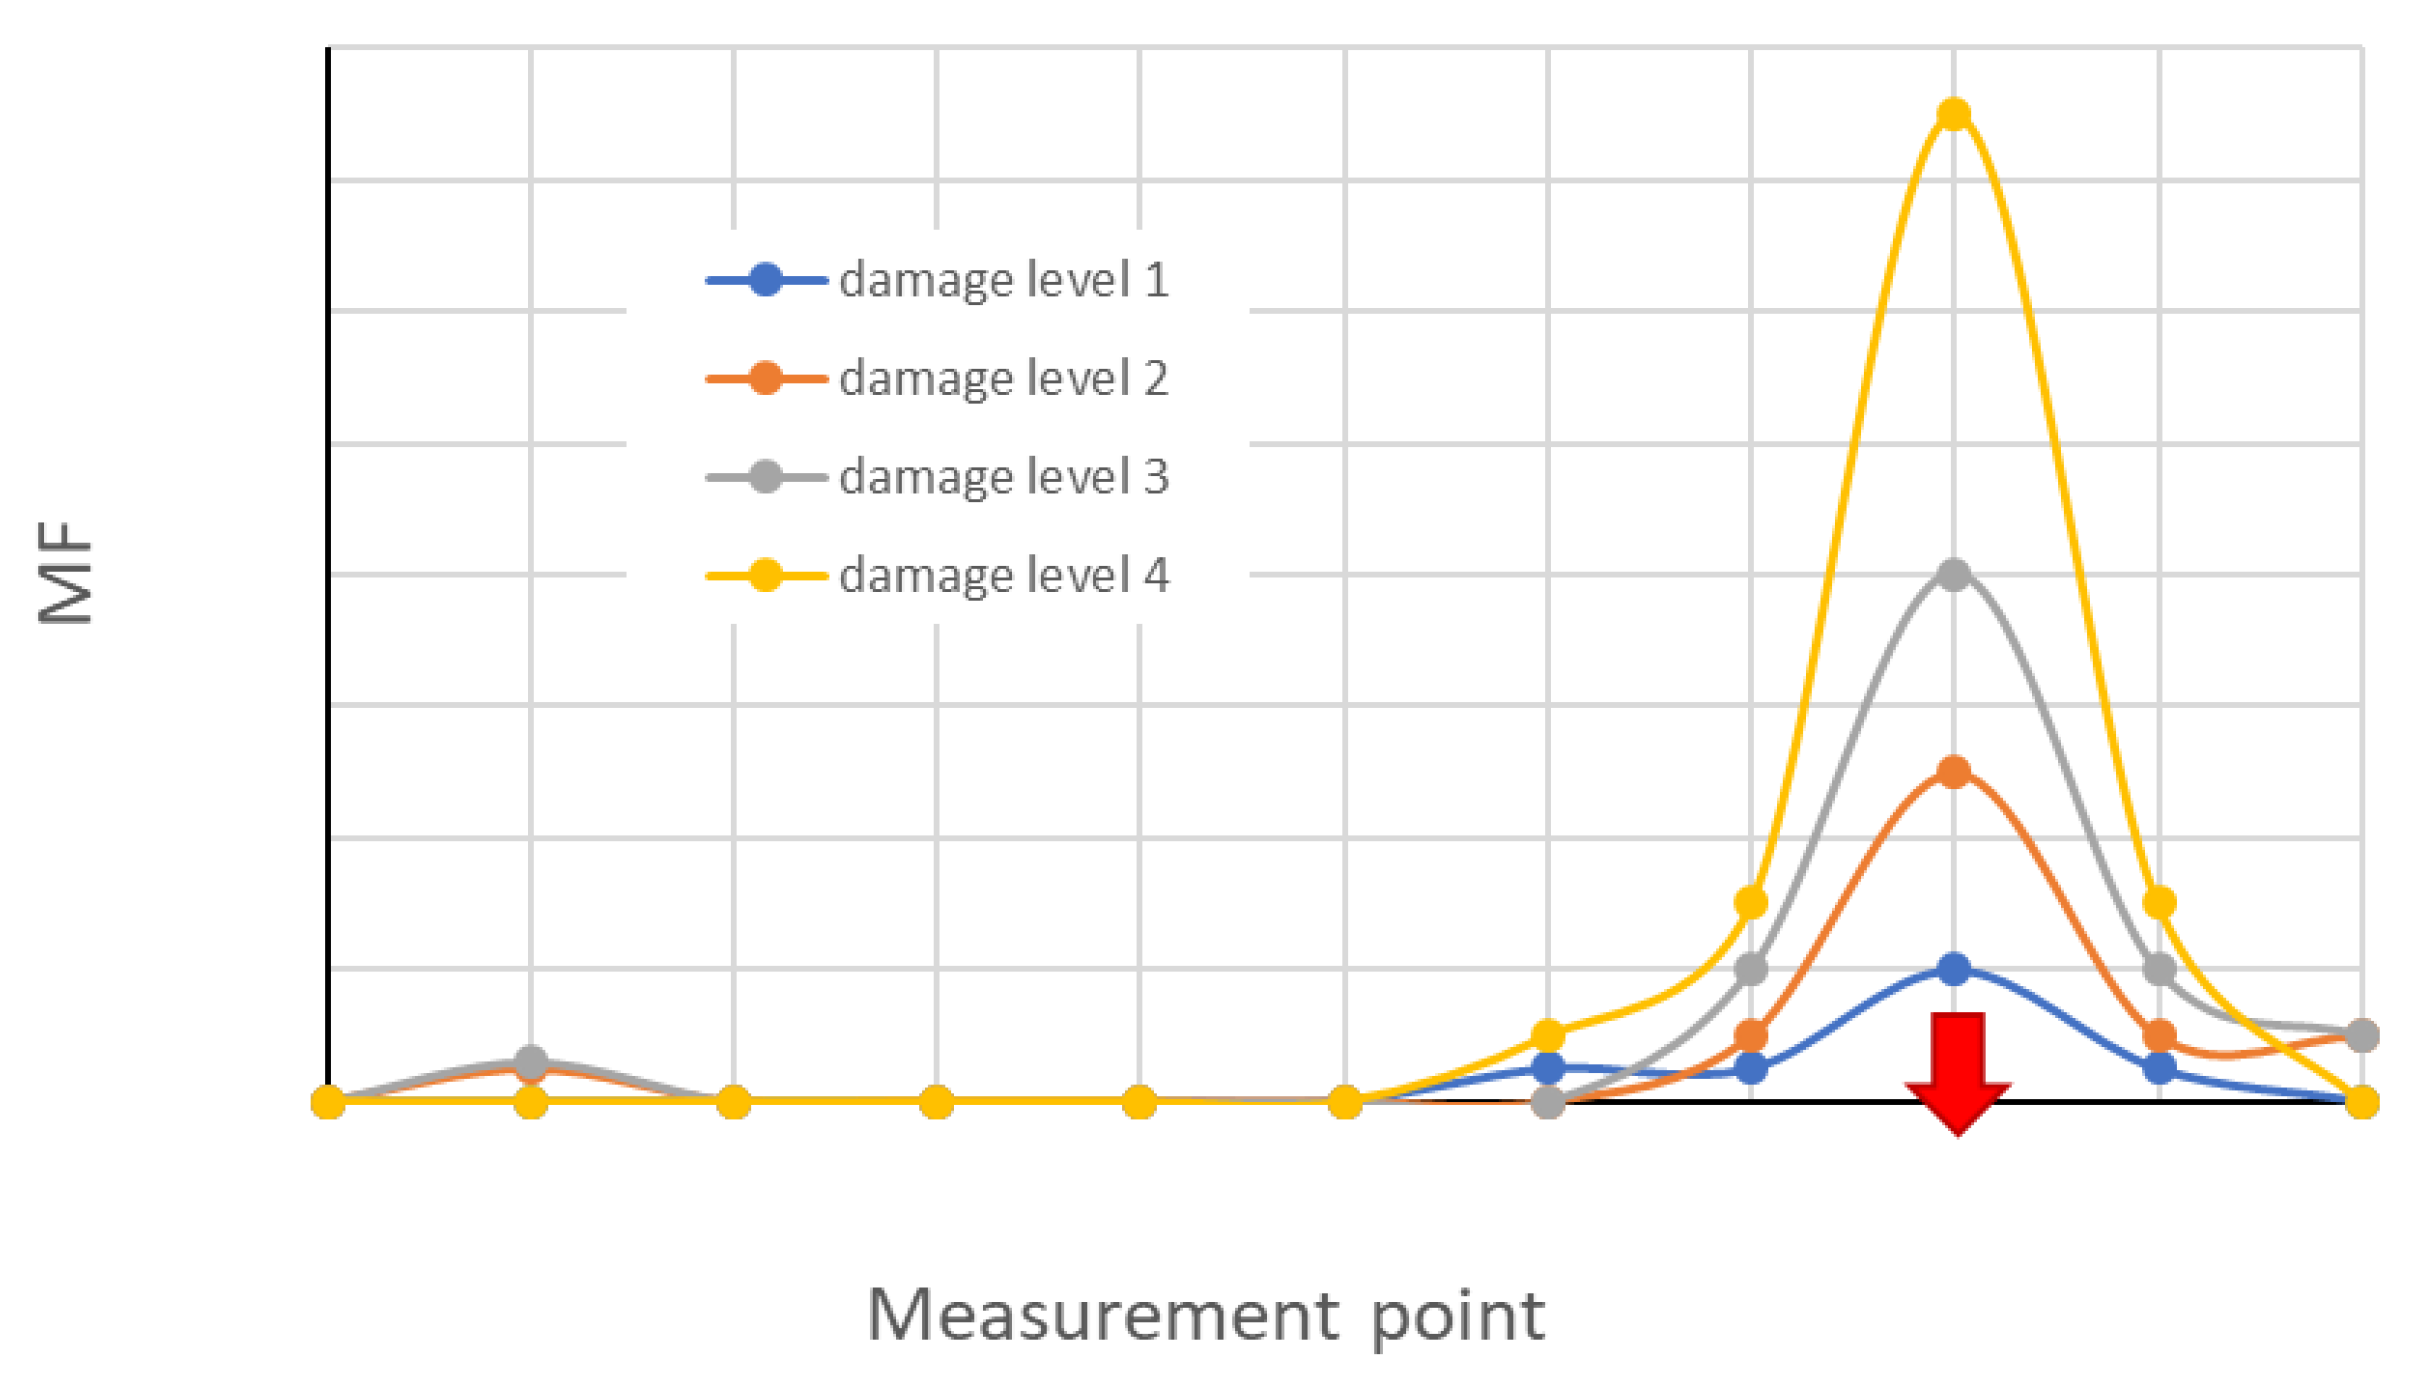
4.1.5. Modal Flexibility
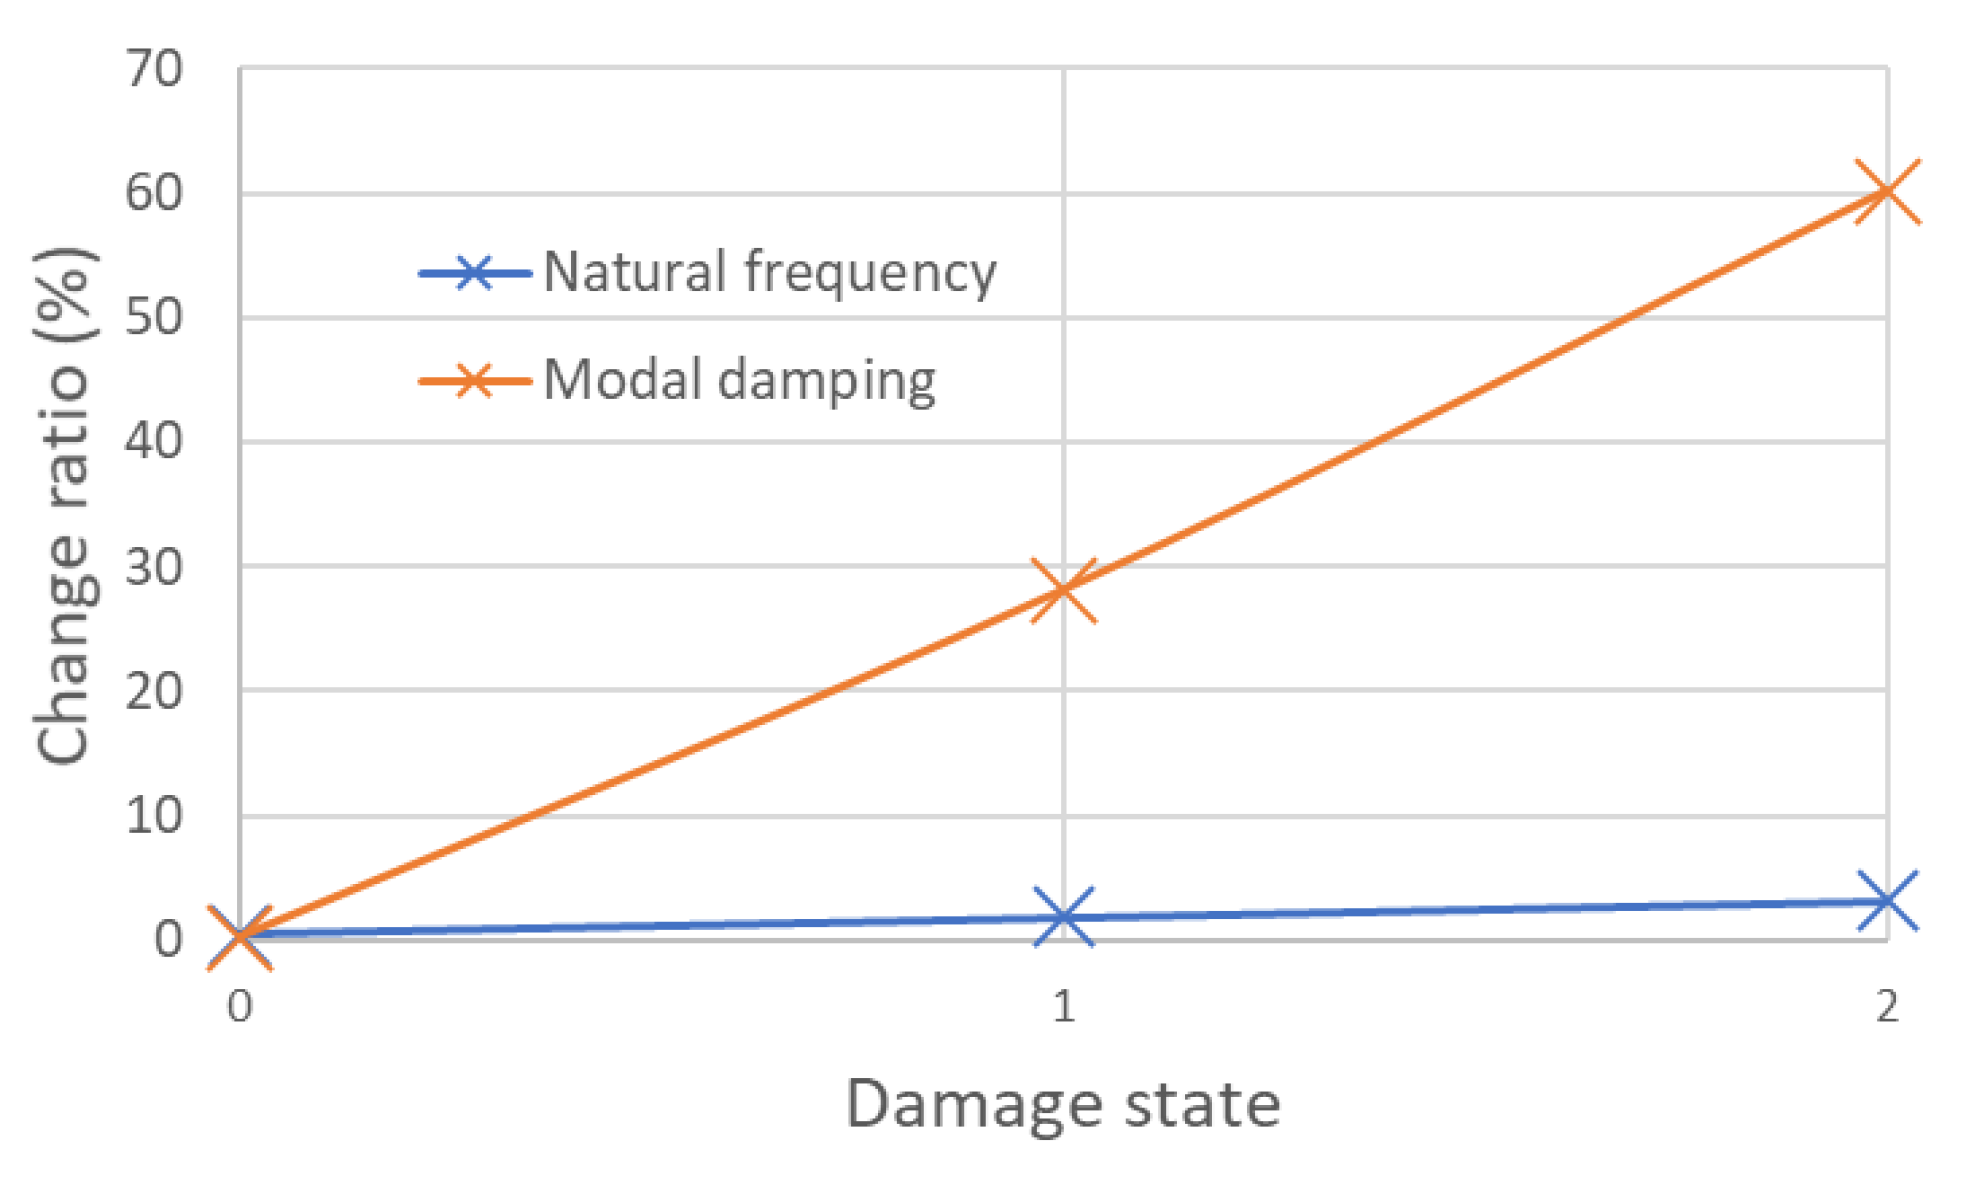
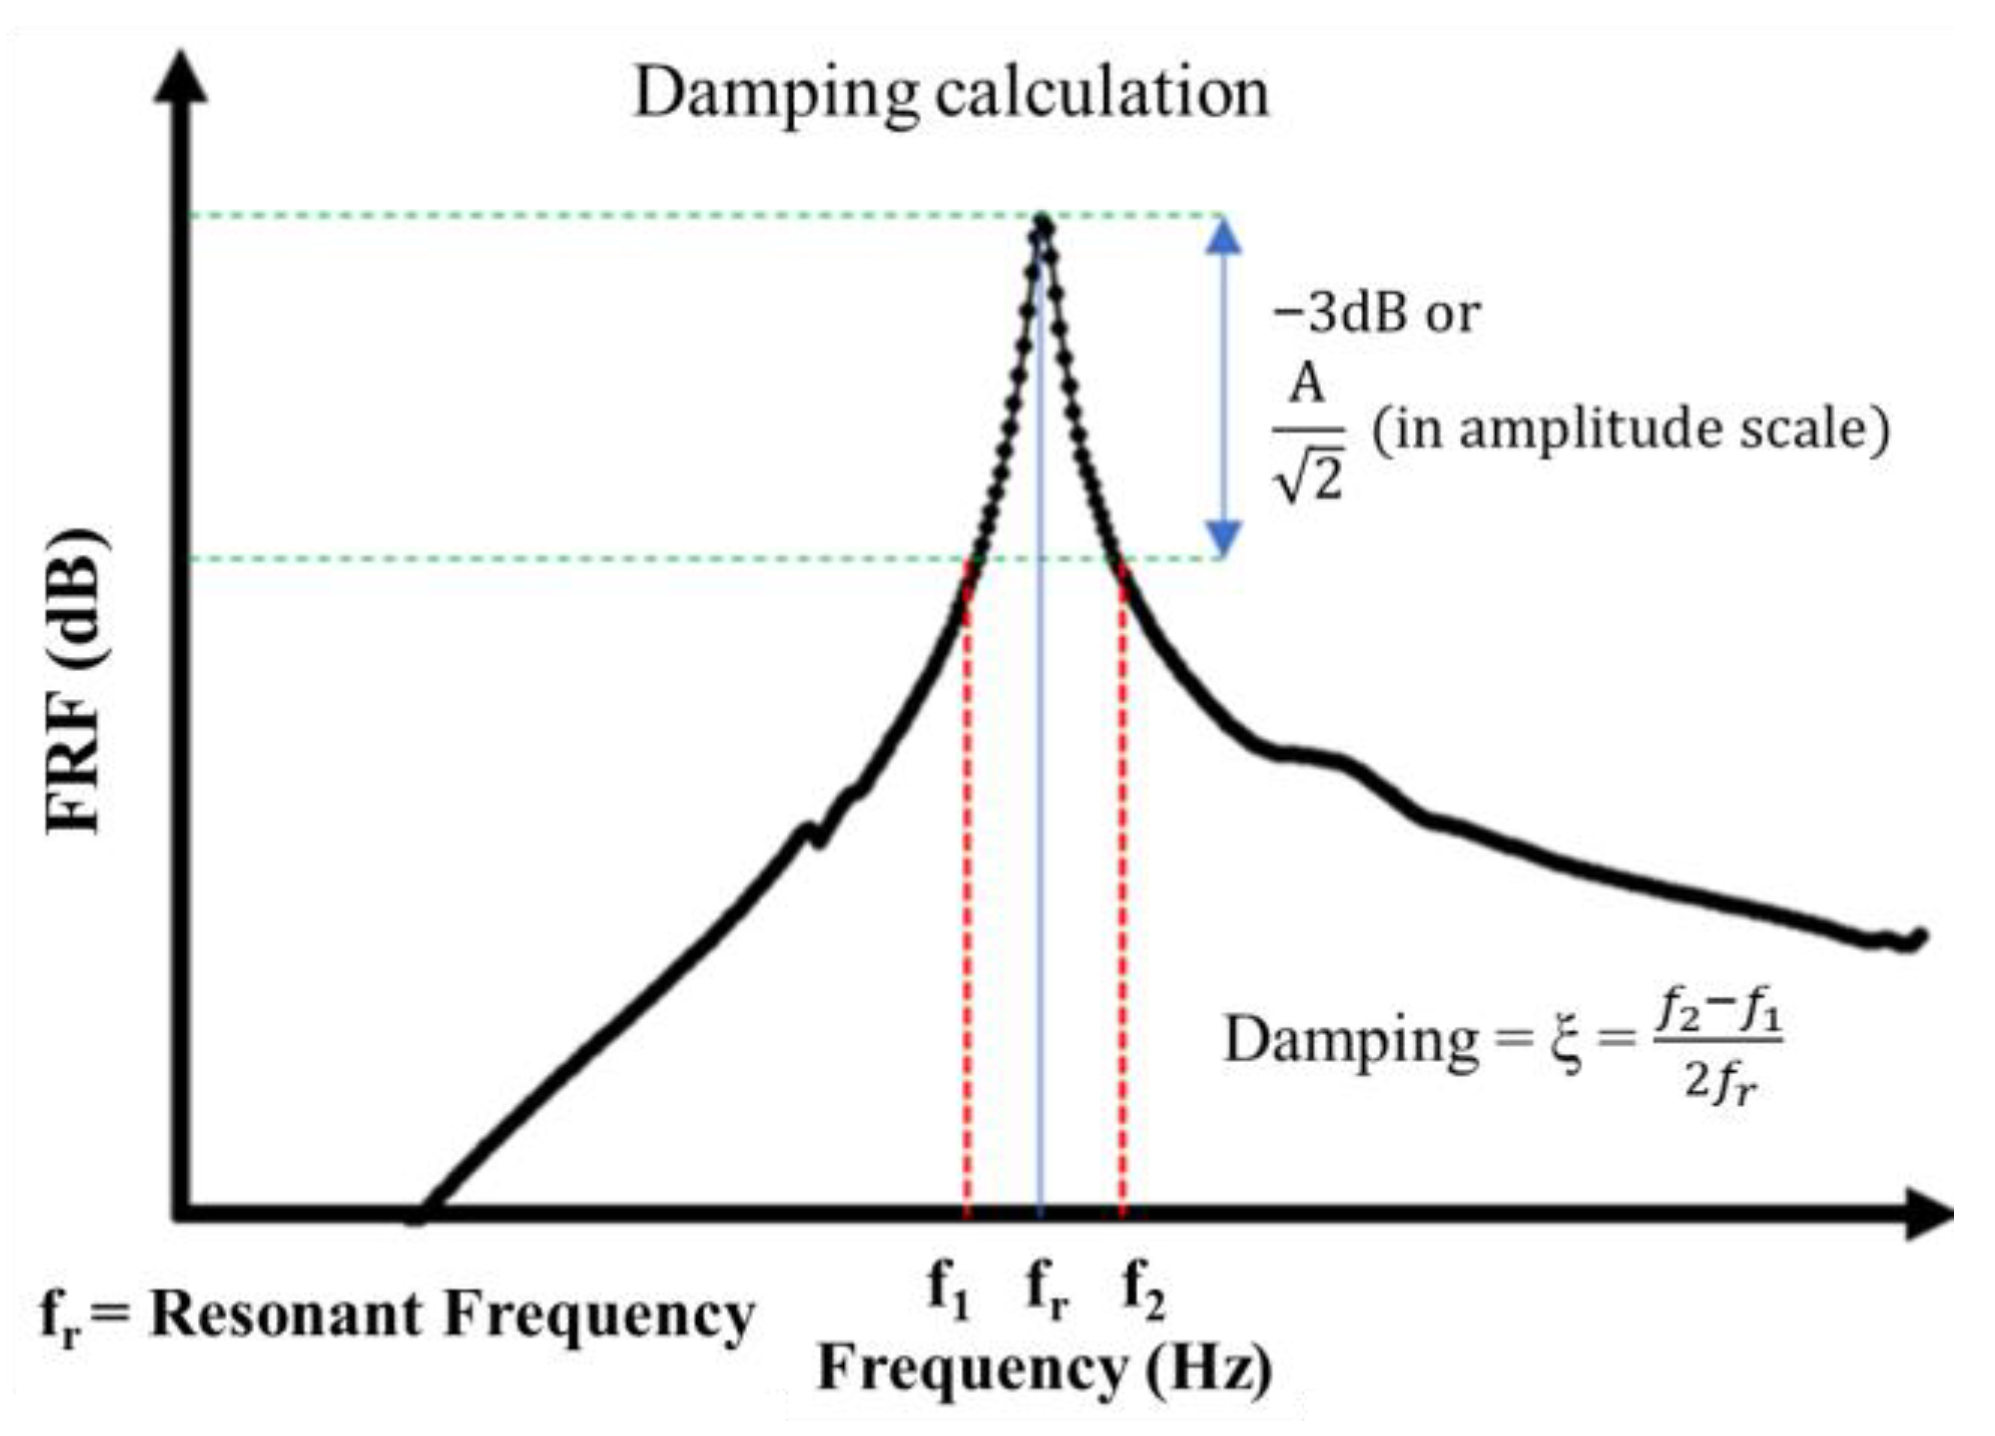
4.1.6. Damping
4.1.7. Frequency Response Function Metrics
4.1.8. Transmittance or Transmissibility Function (TF)
4.1.9. Wavelet Transforms
4.2. Nonlinear Vibration Methods
4.2.1. Single Frequency Excitation (SFE) and Sub-/Super-Harmonics Generation
4.2.2. Frequency Shifts from Different Excitation Amplitude
4.2.3. Vibro-Acoustic Modulation—VAM
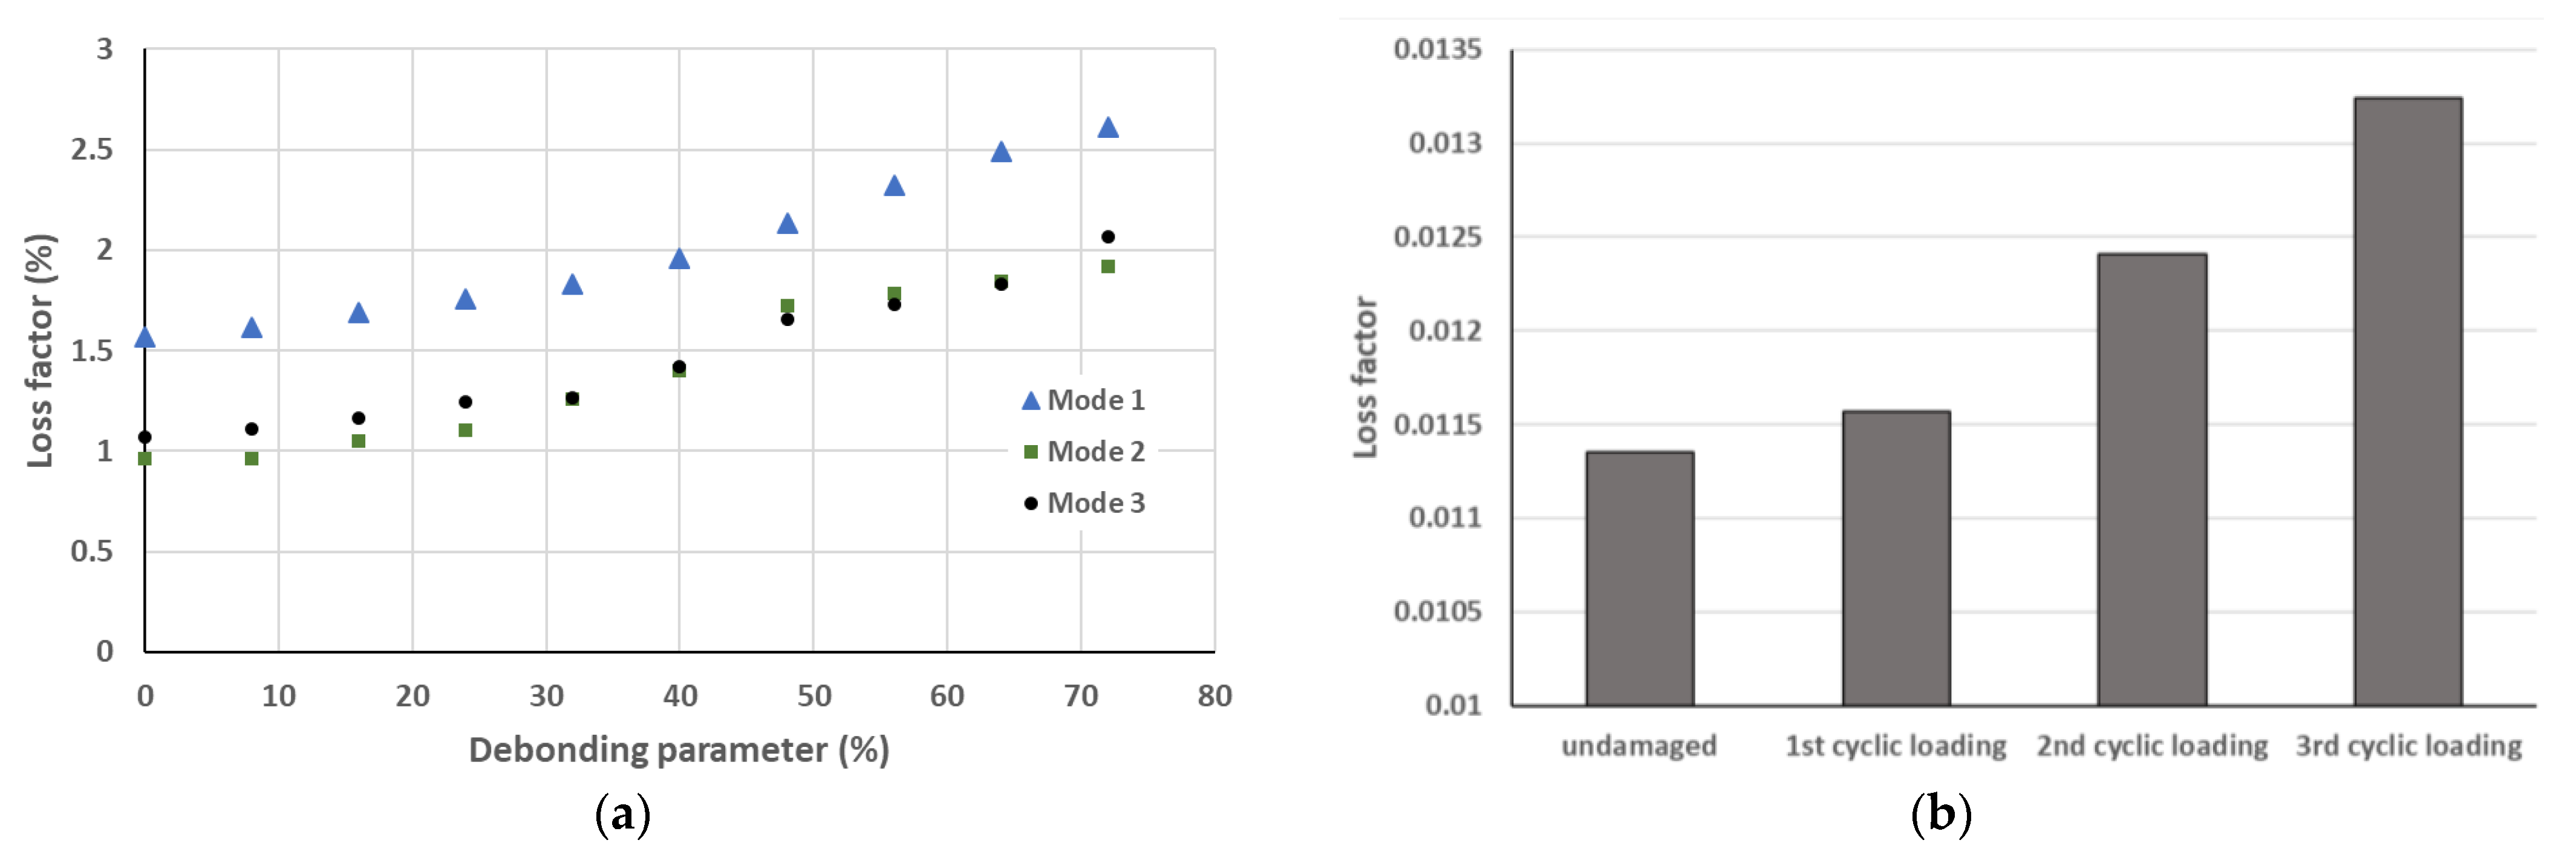
4.2.4. Damping
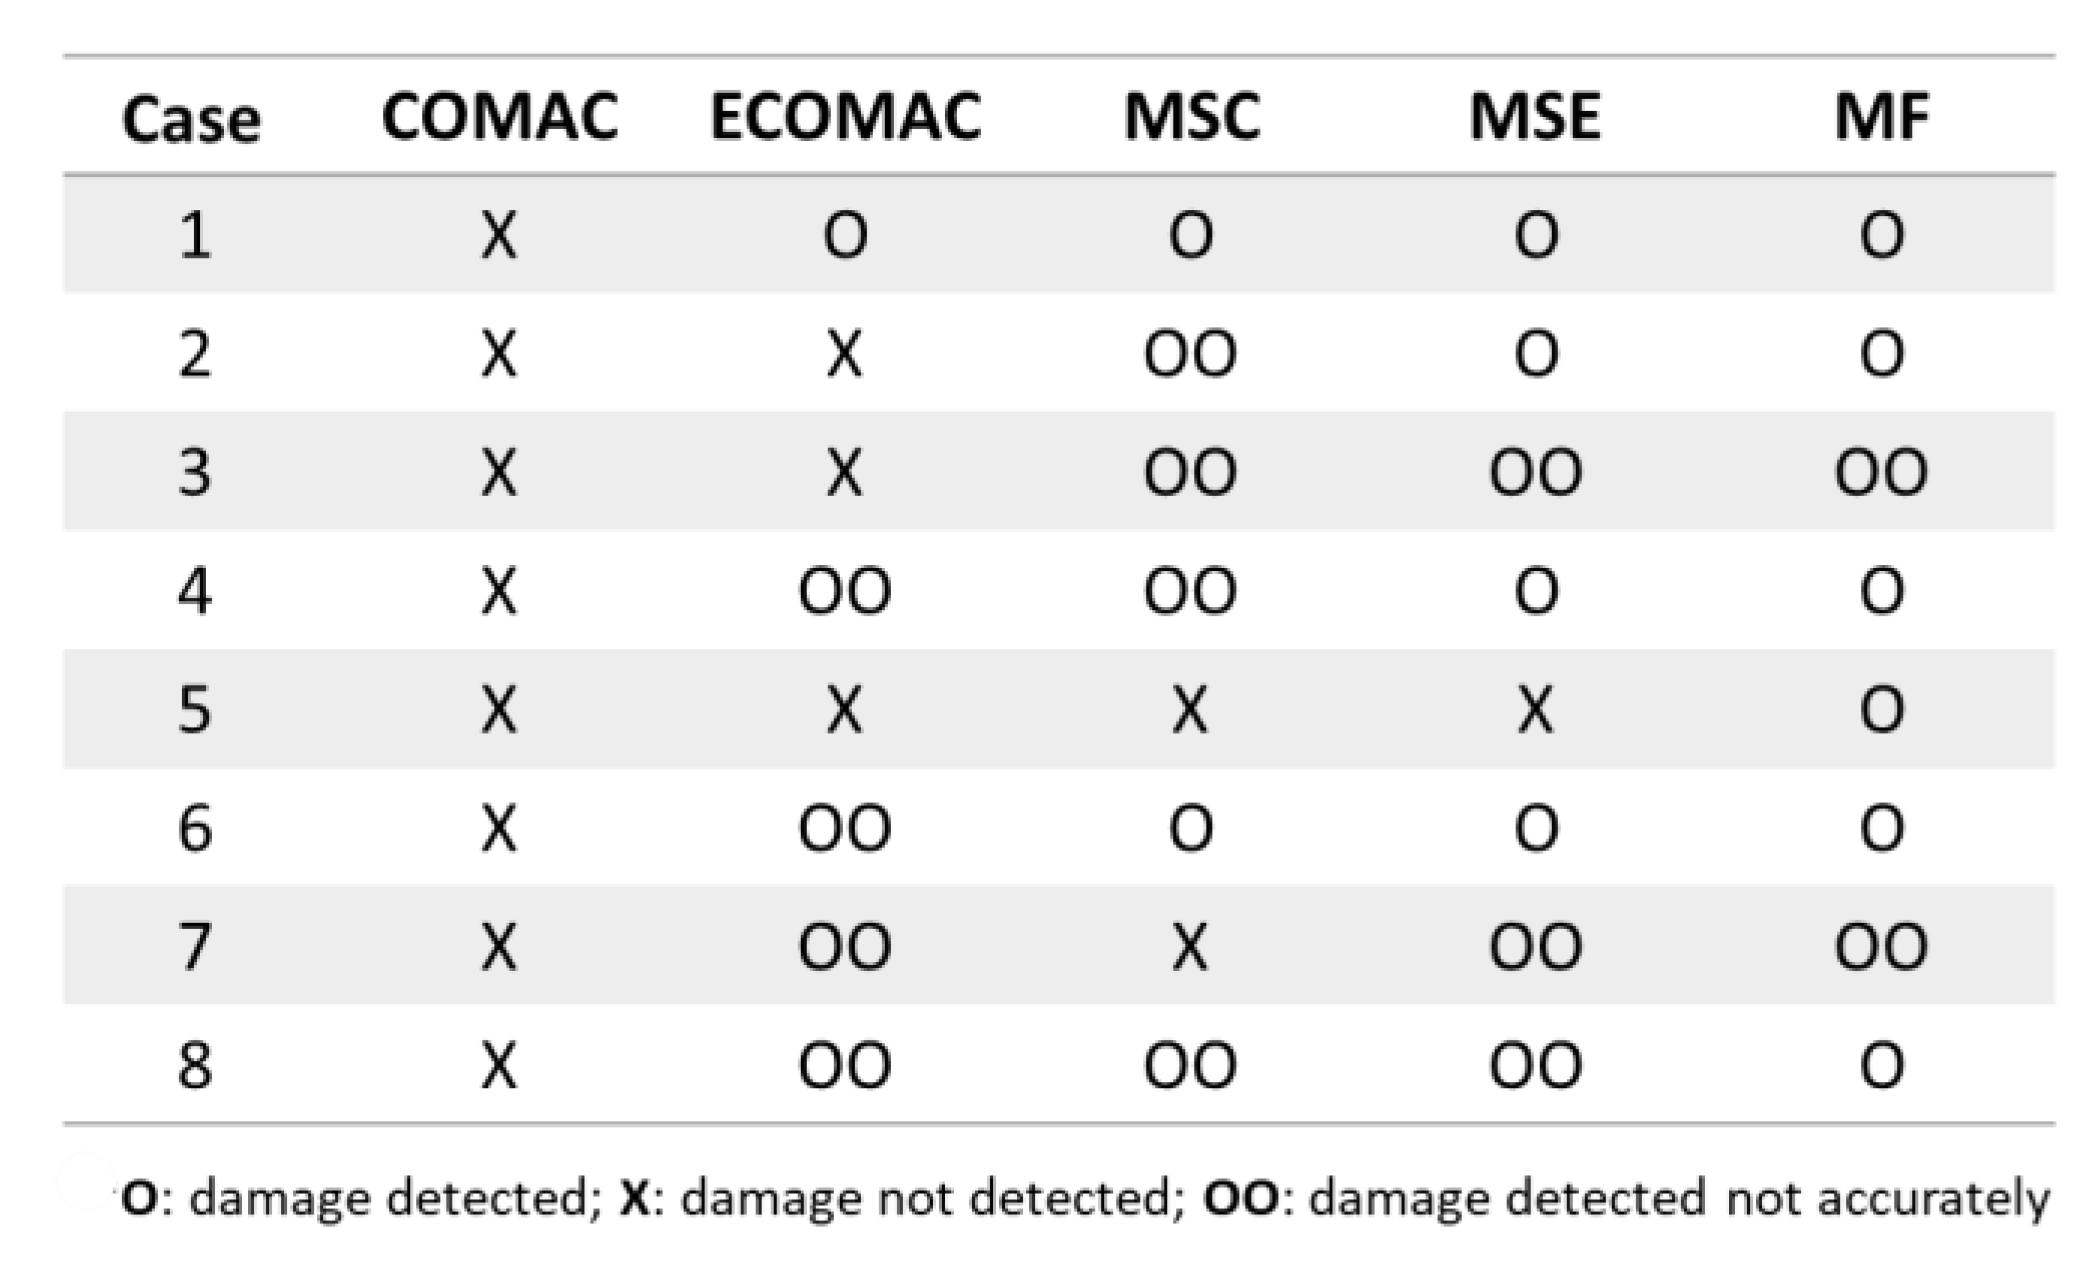
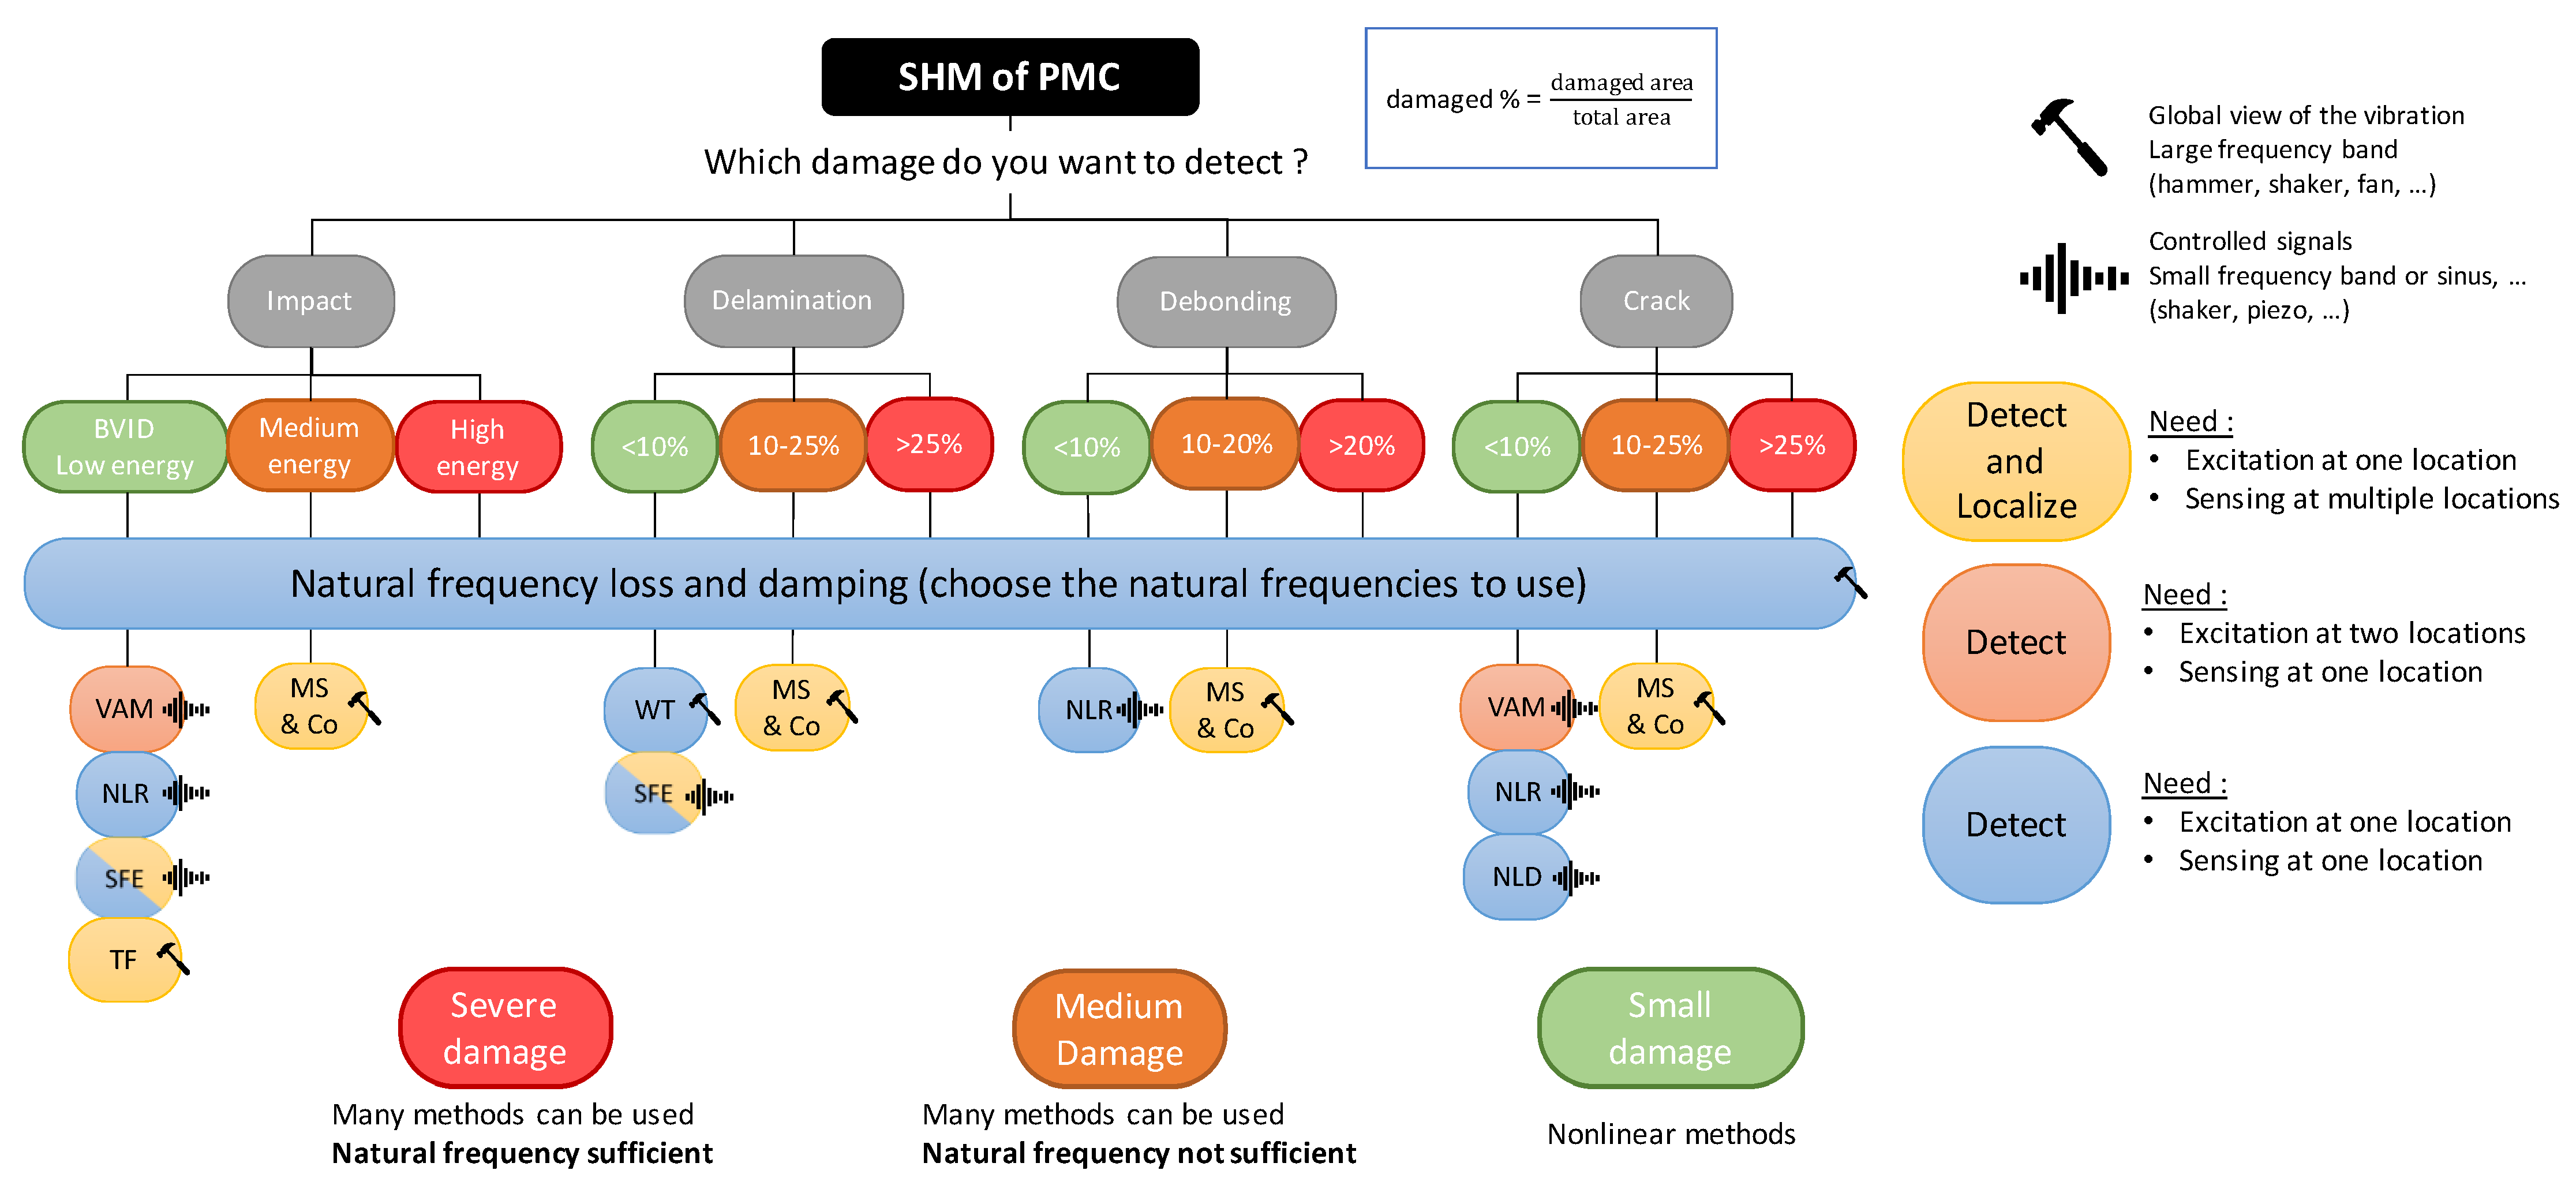
4.3. Summary of the Vibration Methods and Decision Tree
5. Conclusions
Author Contributions
Funding
Data Availability Statement
Conflicts of Interest
Glossary
| AE | Acoustic Emission |
| AI | Artificial Intelligence |
| BVID | Barely Visible Impact Damage |
| CFRP | Carbon-Fiber Reinforced Polymer |
| CMC | Ceramic-Matrix Composite |
| DaDI | Damping Damage Indicator |
| DI | Damage Indicator |
| DIC | Digital Image Correlation |
| FEP | Fluorinated Ethylene Propylene |
| FFT | Fast Fourier Transform |
| FRF | Frequency Response Function |
| GFRP | Glass-Fiber-Reinforced Polymer |
| LDR | Local Defect Resonance |
| LV | Laser Vibrometer |
| MAC | Modal Assurance Criterion |
| MF | Modal Flexibility |
| MFC | Macro-Fiber Composite |
| MMC | Metal-Matrix Composite |
| MSC | Modal Shape Curvature |
| MSD | Modal Shape Displacement |
| MSE | Modal Strain Energy |
| NDT | Non-Destructive Techniques |
| NWMS | Nonlinear Wave Modulation Technique |
| PFC | Piezo-Fiber Composite |
| PM | Process Monitoring |
| PMC | Polymer-Matrix Composite |
| PSF | Plane Shape Function |
| PVC | PolyVinyl Chloride |
| PVDF | Polyvinylidene Fluoride |
| PZT | Lead Zirconate Titanate |
| SFE | Single Frequency Excitation |
| SHM | Structural Health Monitoring |
| SWP | Sweep Signal Excitation |
| TF | Transmittance or Transmissibility Function |
| UT | Ultrasonic Testing |
| VAM | Vibro-Acoustic Modulation |
References
- Harizi, W.; Chaki, S.; Bourse, G.; Ourak, M. Mechanical Damage Characterization of Glass Fiber-Reinforced Polymer Laminates by Ultrasonic Maps. Compos. B Eng. 2015, 70, 131–137. [Google Scholar] [CrossRef]
- Harizi, W.; Chaki, S.; Bourse, G.; Ourak, M. Mechanical Damage Assessment of Polymer-Matrix Composites Using Active Infrared Thermography. Compos. B Eng. 2014, 66, 204–209. [Google Scholar] [CrossRef]
- Harizi, W.; Chaki, S.; Bourse, G.; Ourak, M. Mechanical Damage Assessment of Glass Fiber-Reinforced Polymer Composites Using Passive Infrared Thermography. Compos. B Eng. 2014, 59, 74–79. [Google Scholar] [CrossRef]
- Saba, N.; Jawaid, M. A Review on Thermomechanical Properties of Polymers and Fibers Reinforced Polymer Composites. J. Ind. Eng. Chem. 2018, 67, 1–11. [Google Scholar] [CrossRef]
- Al-Haik, M.S.; Hussaini, M.Y.; Garmestani, H. Prediction of Nonlinear Viscoelastic Behavior of Polymeric Composites Using an Artificial Neural Network. Int. J. Plast. 2006, 22, 1367–1392. [Google Scholar] [CrossRef]
- Sajan, S.; Philip Selvaraj, D. A Review on Polymer Matrix Composite Materials and Their Applications. Mater. Today Proc. 2021, 47, 5493–5498. [Google Scholar] [CrossRef]
- Jia, Z.; Li, T.; Chiang, F.P.; Wang, L. An Experimental Investigation of the Temperature Effect on the Mechanics of Carbon Fiber Reinforced Polymer Composites. Compos. Sci. Technol. 2018, 154, 53–63. [Google Scholar] [CrossRef]
- Indra Reddy, M.; Vijaya Kumar Raju, P.; Bhargava, N.R.M.R. Experimental Investigation on the Mechanical and Thermal Properties of Sprouts Center Stem (Asian Palmyra) Fiber Reinforced Polymer Composites. Mater. Today Proc. 2018, 5, 7808–7817. [Google Scholar] [CrossRef]
- Colombo, C.; Vergani, L.; Burman, M. Static and Fatigue Characterisation of New Basalt Fibre Reinforced Composites. Compos. Struct. 2012, 94, 1165–1174. [Google Scholar] [CrossRef]
- Harizi, W.; Chaki, S.; Ourak, M.; Harizi, W.; Chaki, S.; Bourse, G.; Ourak, M. Characterization of the Damage Mechanisms in Polymer Composite Materials by Ultrasonic Waves, Acoustic Emission and Infrared Thermography. In Proceedings of the ECCM15, Venice, Italy, 24–28 June 2012. [Google Scholar]
- Rytter, A. Vibrational Based Inspection of Civil Engineering Structures. Fract. Dyn. 1993, R9314, 44. [Google Scholar]
- Jones, D.R.H.; Ashby, M.F. Engineering Materials 1––An Introduction to Their Properties & Applications; Butterworth-Heinemann: Oxford, UK, 1996. [Google Scholar]
- Tuloup, C.; Harizi, W.; Aboura, Z.; Meyer, Y.; Khellil, K.; Lachat, R. On the Use of In-Situ Piezoelectric Sensors for the Manufacturing and Structural Health Monitoring of Polymer-Matrix Composites: A Literature Review. Compos. Struct. 2019, 215, 127–149. [Google Scholar] [CrossRef]
- Bastianini, F.; di Tommaso, A.; Pascale, G. Ultrasonic Non-Destructive Assessment of Bonding Defects in Composite Structural Strengthenings. Compos. Struct. 2001, 53, 463–467. [Google Scholar] [CrossRef]
- Aymerich, F.; Meili, S. Ultrasonic Evaluation of Matrix Damage in Impacted Composite Laminates. Compos. B Eng. 2000, 31, 1–6. [Google Scholar] [CrossRef]
- Bourchak, M.; Farrow, I.R.; Bond, I.P.; Rowland, C.W.; Menan, F. Acoustic Emission Energy as a Fatigue Damage Parameter for CFRP Composites. Int. J. Fatigue 2007, 29, 457–470. [Google Scholar] [CrossRef]
- Harizi, W.; Chaki, S.; Bourse, G.; Ourak, M. Damage Mechanisms Assessment of Glass Fiber-Reinforced Polymer (GFRP) Composites Using Multivariable Analysis Methods Applied to Acoustic Emission Data. Compos. Struct. 2022, 289, 115470. [Google Scholar] [CrossRef]
- Hack, E.; Rastogi, P. Optical Methods for Solid Mechanics; Wiley: Hoboken, NJ, USA, 2012. [Google Scholar]
- McCormick, N.; Lord, J. Digital Image Correlation. Mater. Today 2010, 13, 52–54. [Google Scholar] [CrossRef]
- Schilling, P.J.; Karedla, B.P.R.; Tatiparthi, A.K.; Verges, M.A.; Herrington, P.D. X-ray Computed Microtomography of Internal Damage in Fiber Reinforced Polymer Matrix Composites. Compos. Sci. Technol. 2005, 65, 2071–2078. [Google Scholar] [CrossRef]
- Wang, L.B.; Frost, J.D.; Voyiadjis, G.Z.; Harman, T.P. Quantification of Damage Parameters Using X-ray Tomography Images. Mech. Mater. 2003, 35, 777–790. [Google Scholar] [CrossRef]
- Gaussorgues, G.S.C. Infrared Thermography; Springer: Berlin/Heidelberg, Germany, 1993. [Google Scholar]
- Chaupal, P.; Rajendran, P. A Review on Recent Developments in Vibration-Based Damage Identification Methods for Laminated Composite Structures: 2010–2022. Compos. Struct. 2023, 311, 116809. [Google Scholar] [CrossRef]
- Gomes, G.F.; Mendez, Y.A.D.; da Silva Lopes Alexandrino, P.; da Cunha, S.S.; Ancelotti, A.C. A Review of Vibration Based Inverse Methods for Damage Detection and Identification in Mechanical Structures Using Optimization Algorithms and ANN. Arch. Comput. Methods Eng. 2019, 26, 883–897. [Google Scholar] [CrossRef]
- Bovsunovsky, A.; Surace, C. Non-Linearities in the Vibrations of Elastic Structures with a Closing Crack: A State of the Art Review. Mech. Syst. Signal Process. 2015, 62, 129–148. [Google Scholar] [CrossRef]
- He, M.; Zhang, Z.; Ramakrishnan, K.R. Delamination Identification for FRP Composites with Emphasis on Frequency-Based Vibration Monitoring–A Review. SDHM Struct. Durab. Health Monit. 2018, 12, 213–256. [Google Scholar] [CrossRef]
- Hou, R.; Xia, Y. Review on the New Development of Vibration-Based Damage Identification for Civil Engineering Structures: 2010–2019. J. Sound. Vib. 2021, 491, 115741. [Google Scholar] [CrossRef]
- Montalvão, D.; Maia, N.M.M.; Ribeiro, A.M.R. A Review of Vibration-Based Structural Health Monitoring with Special Emphasis on Composite Materials. Shock. Vib. Dig. 2006, 38, 295–324. [Google Scholar] [CrossRef]
- Sinou, J.-J. A Review of Damage Detection and Health Monitoring of Mechanical Systems from Changes in the Measurement of Linear and Non-Linear Vibrations. In Mechanical Vibrations: Measurement, Effects and Control; Nova Science: Hauppauge, NY, USA, 2013. [Google Scholar]
- Worden, K.; Farrar, C.R.; Haywood, J.; Todd, M. A Review of Nonlinear Dynamics Applications to Structural Health Monitoring. Struct. Control Health Monit. 2008, 15, 540–567. [Google Scholar] [CrossRef]
- Fan, W.; Qiao, P. Vibration-Based Damage Identification Methods: A Review and Comparative Study. Struct. Health Monit. 2011, 10, 83–111. [Google Scholar] [CrossRef]
- Hassani, S.; Mousavi, M.; Gandomi, A.H. Structural Health Monitoring in Composite Structures: A Comprehensive Review. Sensors 2021, 22, 153. [Google Scholar] [CrossRef]
- Akay, M. An Introduction to Polymer-Matrix Composites; Bookboon: London, UK, 2015; ISBN 9788740309805. [Google Scholar]
- Tang, X.; Yan, X. A Review on the Damping Properties of Fiber Reinforced Polymer Composites. J. Ind. Text. 2020, 49, 693–721. [Google Scholar] [CrossRef]
- Mohan Kumar, S.; Raghavendra Ravikiran, K.; Govindaraju, H.K. Development of E-Glass Woven Fabric/Polyester Resin Polymer Matrix Composite and Study of Mechanical Properties. Mater. Today Proc. 2018, 5, 13367–13374. [Google Scholar] [CrossRef]
- Tableau, N.; Aboura, Z.; Khellil, K.; Laurin, F.; Schneider, J. Multiaxial Loading on a 3D Woven Carbon Fiber Reinforced Plastic Composite Using Tensile-Torsion Tests: Identification of the First Damage Envelope and Associated Damage Mechanisms. Compos. Struct. 2019, 227, 111305. [Google Scholar] [CrossRef]
- Loi, G.; Marongiu, G.; Porcu, M.C.; Aymerich, F. Vibro-Acoustic Modulation with Broadband Pump Excitation for Efficient Impact Damage Detection in Composite Materials. IOP Conf. Ser. Mater. Sci. Eng. 2023, 1275, 012008. [Google Scholar] [CrossRef]
- Talreja, R. PMC Failure Mechanisms. In Comprehensive Composite Materials II; Elsevier: Amsterdam, The Netherlands, 2017; pp. 107–117. [Google Scholar] [CrossRef]
- Greenhalgh, E. Defects and Damage and Their Role in the Failure of Polymer Composites. In Failure Analysis and Fractography of Polymer Composites; Woodhead: Cambridge, UK, 2009; pp. 356–440. [Google Scholar] [CrossRef]
- Duchene, P.; Chaki, S.; Ayadi, A.; Krawczak, P. A Review of Non-Destructive Techniques Used for Mechanical Damage Assessment in Polymer Composites. J. Mater. Sci. 2018, 53, 7915–7938. [Google Scholar] [CrossRef]
- Bolotin, V. Mechanics of Delaminations in Laminate Composite Structures. In Mechanics of Composite Materials; CRC Press: Boca Raton, FL, USA, 2001; Volume 37. [Google Scholar]
- Avitabile, P. Experimental modal analysis. Sound Vib. 2001, 35, 20–31. [Google Scholar]
- Kranjc, T.; Slavić, J.; Boltežar, M. A Comparison of Strain and Classic Experimental Modal Analysis. JVC J. Vib. Control. 2016, 22, 371–381. [Google Scholar] [CrossRef]
- Cugnoni, J.; Guzman, E.; Cugnoni, J.; Gmür, T. Use of PVDF Transducers as Actuators for Operational Modal Analysis on Composite Samples. In Proceedings of the ICCE21, Tenerife, Spain, 21–27 July 2013. [Google Scholar]
- Guzman, E.; Cugnoni, J.; Gmur, T. Monitoring of Composite Structures Using a Network of Integrated PVDF Film Transducers. Smart Mater. Struct. 2015, 24, 055017. [Google Scholar] [CrossRef]
- Xin, Y.; Sun, H.; Tian, H.; Guo, C.; Li, X.; Wang, S.; Wang, C. The Use of Polyvinylidene Fluoride (PVDF) Films as Sensors for Vibration Measurement: A Brief Review. Ferroelectrics 2016, 502, 28–42. [Google Scholar] [CrossRef]
- Bregar, T.; Starc, B.; Čepon, G.; Boltežar, M. On the Use of PVDF Sensors for Experimental Modal Analysis. In Proceedings of the Society for Experimental Mechanics Series; Springer: Berlin/Heidelberg, Germany, 2021; pp. 279–281. [Google Scholar]
- Tuloup, C.; Harizi, W.; Aboura, Z.; Meyer, Y.; Ade, B.; Khellil, K. Detection of the Key Steps during Liquid Resin Infusion Manufacturing of a Polymer-Matrix Composite Using an in-Situ Piezoelectric Sensor. Mater. Today Commun. 2020, 24, 101077. [Google Scholar] [CrossRef]
- Janeliukstis, R.; Mironovs, D. Smart Composite Structures with Embedded Sensors for Load and Damage Monitoring–A Review. Mech. Compos. Mater. 2021, 57, 131–152. [Google Scholar] [CrossRef]
- Paradies, R.; Ruge, M. In Situ Fabrication of Active Fibre Reinforced Structures with Integrated Piezoelectric Actuators. Smart Mater. Struct. 2000, 9, 220. [Google Scholar] [CrossRef]
- Kovalovs, A.; Wesolowski, M.; Barkanov, E.; Gluhihs, S. Application of Macro-Fiber Composite (MFC) as a Piezoelectric Actuator. Vibromech. J. Vibroeng. 2009, 11, 105–112. [Google Scholar]
- Siemens Company. What Is a Frequency Response Function (FRF)? Available online: https://community.sw.siemens.com/s/article/what-is-a-frequency-response-function-frf (accessed on 11 March 2022).
- Siemens Company. Autopower Function. Available online: https://community.sw.siemens.com/s/article/the-autopower-function-demystified (accessed on 11 March 2022).
- Baptiste Chomette MIMO Modal Parameters Identification in Frequency Domain–File Exchange–MATLAB Central. Available online: https://fr.mathworks.com/matlabcentral/fileexchange/82380-mimo-modal-parameters-identification-in-frequency-domain (accessed on 11 April 2022).
- An, H.; Youn, B.D.; Kim, H.S. A Methodology for Sensor Number and Placement Optimization for Vibration-Based Damage Detection of Composite Structures under Model Uncertainty. Compos. Struct. 2022, 279, 114863. [Google Scholar] [CrossRef]
- Mallardo, V.; Aliabadi, M.H. Optimal Sensor Placement for Structural, Damage and Impact Identification: A Review. SDHM Struct. Durab. Health Monit. 2014, 9, 287–323. [Google Scholar] [CrossRef]
- Ferreira Gomes, G.; SimõesSim, S.; da Cunha, S., Jr.; da Silva Lopes Alexandrino, P.; Silva de Sousa, B.; Carlos Ancelotti Jr, A. Sensor Placement Optimization Applied to Laminated Composite Plates under Vibration. Struct. Durab. Health Monit. 2022, 58, 2099–2118. [Google Scholar] [CrossRef]
- Doebling, S.W.; Farrar, C.R.; Prime, M.B.; Shevitz, D.W. Damage Identification and Health Monitoring of Structural and Mechanical Systems from Changes in Their Vibration Characteristics: A Literature Review. Shock. Vib. Dig. 1996, 30, 249299. [Google Scholar]
- Lifshitz, J.M.; Rotem, A. Determination of Reinforcement Unbonding of Composites by a Vibration Technique. J. Compos. Mater. 2016, 3, 412–423. [Google Scholar] [CrossRef]
- Kuriakose, V.M.; Sreehari, V.M. Experimental Investigation on the Enhancement of Vibration and Flutter Characteristics of Damaged Composite Plates Using Piezoelectric Patches. Compos. Struct. 2021, 275, 114518. [Google Scholar] [CrossRef]
- Prasad Konka, H. Embedded Piezoelectric Fiber Composite Sensors for Applications in Composite Structures. Ph.D. Thesis, Louisiana State University and Agricultural and Mechanical College, Bâton-Rouge, LA, USA, 2011. [Google Scholar]
- Konka, H.P.; Wahab, M.A.; Lian, K. On Mechanical Properties of Composite Sandwich Structures with Embedded Piezoelectric Fiber Composite Sensors. J. Eng. Mater. Technol. Trans. ASME 2012, 134, 011010. [Google Scholar] [CrossRef]
- Kessler, S.S.; Spearing, S.M. In-Situ Sensor-Based Damage Detection of Composite Materials for Structural Health Monitoring. In Proceedings of the Collection of Technical Papers–AIAA/ASME/ASCE/AHS/ASC Structures, Structural Dynamics and Materials Conference, Denver, CO, USA, 22–25 April 2002; American Inst. Aeronautics and Astronautics Inc.: Reston, VA, USA, 2002; Volume 4, pp. 2706–2716. [Google Scholar]
- De Medeiros, R.; Sartorato, M.; Tita, V.; De Medeiros, R.; Sartorato, M.; Vandepitte, D.; Tita, V. SHM of Composite Plates: Vibration Based Method by Using PZT Sensors. In Proceedings of the ISMA2014, Le Mans, France, 7–12 July 2014. [Google Scholar]
- de Medeiros, R.; Sartorato, M.; Marques, F.D.; Tita, V.; De, R.; Murilo, M.; Flávio, S.; Marques, D.; Vandepitte, D. Vibration-Based Damage Identification Applied for Composite Plate: Experimental Analyses. In Proceedings of the COBEM 2013, Rio de Janeiro, Brazil, 3–7 November 2013. [Google Scholar]
- Idriss, M.; El Mahi, A. Linear and Nonlinear Resonant Techniques for Characterizing Cyclic Fatigue Damage in Composite Laminate. Compos. B Eng. 2018, 142, 36–46. [Google Scholar] [CrossRef]
- Idriss, M.; El Mahi, A.; El Guerjouma, R. Characterization of Sandwich Beams with Debonding by Linear and Nonlinear Vibration Method. Compos. Struct. 2015, 120, 200–207. [Google Scholar] [CrossRef]
- El Mahi, A.; Idriss, M.; Assarar, M.; El Guerjouma, R.; Dazel, O. Effets de l’endommagement Sur Le Comportement Vibratoire Des Matériaux Sandwichs Endommagés. In Proceedings of the 19ème Congrès Français de Mécanique, Marseille, France, 24–28 August 2009. [Google Scholar]
- Tracy, J.J.; Manager, S.; Pardoen, G.C. Effect of Delamination on the Natural Frequencies of Composite Laminates. J. Compos. Mater. 1989, 23, 1200–1251. [Google Scholar]
- Ghoshal, A.; Chattopadhyay, A.; Schulz, M.J.; Thornburgh, R.; Waldron, K. Experimental Investigation of Damage Detection in Composite Material Structures Using a Laser Vibrometer and Piezoelectric Actuators. J. Intell. Mater. Syst. Struct. 2003, 14, 521–537. [Google Scholar] [CrossRef]
- Okafor, A.C.; Chandrashekhara, K.; Jiang, Y.P. Delamination Prediction in Composite Beams with Built-in Piezoelectric Devices Using Modal Analysis and Neural Network. Smart Mater. Struct. 1996, 5, 338–347. [Google Scholar] [CrossRef]
- Islam, A.S.; Craig, K.C. Damage Detection in Composite Structures Using Piezoelectric Materials. Smart Mater. Struct. 1994, 3, 318–328. [Google Scholar] [CrossRef]
- Hou, J.P.; Jeronimidis, G. Vibration of Delaminated Thin Composite Plates. Compos. Part A Appl. Sci. Manuf. 1999, 30, 989–995. [Google Scholar] [CrossRef]
- Lakhdar, M.; Mohammed, D.; Boudjemâa, L.; Rabiâ, A.; Bachir, M. Damages Detection in a Composite Structure by Vibration Analysis. Energy Procedia 2013, 36, 888–897. [Google Scholar] [CrossRef]
- Siemens Company. Modal Tips: Roving Hammer versus Roving Accelerometer. Available online: https://community.sw.siemens.com/s/article/modal-tips-roving-hammer-versus-roving-accelerometer (accessed on 7 March 2022).
- Pastor, M.; Binda, M.; Harčarik, T. Modal Assurance Criterion. Procedia Eng. 2012, 48, 543–548. [Google Scholar] [CrossRef]
- Allemang, R.J. The Modal Assurance Criterion (MAC): Twenty Years of Use and Abuse. Sound. Vib. 2003, 37, 14–23. [Google Scholar]
- Siemens Company. Modal Assurance Criterion (MAC). Available online: https://community.sw.siemens.com/s/article/modal-assurance-criterion-mac (accessed on 4 March 2022).
- Patil, S.; Mallikarjuna Reddy, D. Damage Identification in Hemp Fiber (Cannabis sativa) Reinforced Composite Plates Using MAC and COMAC Correlation Methods: Experimental Study. J. Nat. Fibers 2020, 19, 1249–1264. [Google Scholar] [CrossRef]
- dos Santos, F.L.M.; Peeters, B.; van der Auweraer, H.; Góes, L.C.S.; Desmet, W. Vibration-Based Damage Detection for a Composite Helicopter Main Rotor Blade. Case Stud. Mech. Syst. Signal Process. 2016, 3, 22–27. [Google Scholar] [CrossRef]
- Pérez, M.A.; Gil, L.; Oller, S. Impact Damage Identification in Composite Laminates Using Vibration Testing. Compos. Struct. 2014, 108, 267–276. [Google Scholar] [CrossRef]
- Herman, A.P.; Orifici, A.C.; Mouritz, A.P. Vibration Modal Analysis of Defects in Composite T-Stiffened Panels. Compos. Struct. 2013, 104, 34–42. [Google Scholar] [CrossRef]
- Hu, H.; Wang, B.-T.; Su, J.-S. Application of Modal Analysis to Damage Detection in Composite Laminates. In Proceedings of the ESDA04, Manchester, UK, 19–22 July 2004. [Google Scholar]
- Hu, H.; Wang, B.T.; Lee, C.H.; Su, J.S. Damage Detection of Surface Cracks in Composite Laminates Using Modal Analysis and Strain Energy Method. Compos. Struct. 2006, 74, 399–405. [Google Scholar] [CrossRef]
- Qiao, P.; Lestari, W.; Shah, M.G.; Wang, J. Dynamics-Based Damage Detection of Composite Laminated Beams Using Contact and Noncontact Measurement Systems. J. Compos. Mater. 2007, 41, 1217–1252. [Google Scholar] [CrossRef]
- Sampaio, R.P.C.; Maia, N.M.M.; Silva, J.M.M. Damage Detection Using the Frequency-Response-Function Curvature Method. J. Sound. Vib. 1999, 226, 1029–1042. [Google Scholar] [CrossRef]
- Pandey, A.K.; Biswas, M.; Samman, M.M. Damage Detection from Changes in Curvature Mode Shapes. J. Sound. Vib. 1991, 145, 321–332. [Google Scholar] [CrossRef]
- Radzieński, M.; Krawczuk, M.; Palacz, M. Improvement of Damage Detection Methods Based on Experimental Modal Parameters. Mech. Syst. Signal Process. 2011, 25, 2169–2190. [Google Scholar] [CrossRef]
- Govindasamy, M.; Kamalakannan, G.; Kesavan, C.; Meenashisundaram, G.K. Damage Detection in Glass/Epoxy Laminated Composite Plates Using Modal Curvature for Structural Health Monitoring Applications. J. Compos. Sci. 2020, 4, 185. [Google Scholar] [CrossRef]
- Lestari, W.; Qiao, P.; Hanagud, S. Curvature Mode Shape-Based Damage Assessment of Carbon/Epoxy Composite Beams. J. Intell. Mater. Syst. Struct. 2007, 18, 189–208. [Google Scholar] [CrossRef]
- Hamey, C.S.; Lestari, W.; Qiao, P.; Song, G. Experimental Damage Identification of Carbon/Epoxy Composite Beams Using Curvature Mode Shapes. Struct. Health Monit. 2004, 3, 333–353. [Google Scholar] [CrossRef]
- He, M.; Yang, T.; Du, Y. Nondestructive Identification of Composite Beams Damage Based on the Curvature Mode Difference. Compos. Struct. 2017, 176, 178–186. [Google Scholar] [CrossRef]
- Mehdizadeh, M. Curvature Mode Shape Analyses of Damage in Structures. Ph.D. Thesis, School of Aerospace, Mechanical & Manufacturing Engineering College of Science, Engineering and Technology, Bundoora, Australia, 2009. [Google Scholar]
- Sazonov, E.; Klinkhachorn, P. Optimal Spatial Sampling Interval for Damage Detection by Curvature or Strain Energy Mode Shapes. J. Sound. Vib. 2005, 285, 783–801. [Google Scholar] [CrossRef]
- Cha, Y.J.; Buyukozturk, O. Structural Damage Detection Using Modal Strain Energy and Hybrid Multiobjective Optimization. Comput. Aided Civ. Infrastruct. Eng. 2015, 30, 347–358. [Google Scholar] [CrossRef]
- Eraky, A.; Anwar, A.M.; Saad, A.; Abdo, A. Damage Detection of Flexural Structural Systems Using Damage Index Method—Experimental Approach. Alex. Eng. J. 2015, 54, 497–507. [Google Scholar] [CrossRef]
- Wang, S.; Xu, M. Modal Strain Energy-Based Structural Damage Identification: A Review and Comparative Study. Struct. Eng. Int. 2019, 29, 234–248. [Google Scholar] [CrossRef]
- Hu, H.; Wang, J. Damage Detection of a Woven Fabric Composite Laminate Using a Modal Strain Energy Method. Eng. Struct. 2009, 31, 1042–1055. [Google Scholar] [CrossRef]
- Hu, H.; Lee, C.H.; Wu, C.B.; Lu, W.J. Detection of Matrix Cracks in Composite Laminates by Using the Modal Strain Energy Method. Mech. Compos. Mater. 2010, 46, 117–132. [Google Scholar] [CrossRef]
- dos Santos, F.L.M.; Peeters, B.; van der Auweraer, H.; Góes, L.C.S. Modal Strain Energy Based Damage Detection Applied to a Full Scale Composite Helicopter Blade. Key Eng. Mater. 2013, 569–570, 457–464. [Google Scholar]
- Kumar, M.; Shenoi, R.A.; Cox, S.J. Experimental Validation of Modal Strain Energies Based Damage Identification Method for a Composite Sandwich Beam. Compos. Sci. Technol. 2009, 69, 1635–1643. [Google Scholar] [CrossRef]
- Meng, F.; Yu, J.; Alaluf, D.; Mokrani, B.; Preumont, A. Modal Analysis and Damage Detection for Suspension Bridges: A Numerical and Experimental Investigation. Smart Struct. Syst. 2019, 23, 15–29. [Google Scholar]
- Yang, J.S.; da Liu, Z.; Schmidt, R.; Schröder, K.U.; Ma, L.; Wu, L.Z. Vibration-Based Damage Diagnosis of Composite Sandwich Panels with Bi-Directional Corrugated Lattice Cores. Compos. Part. A Appl. Sci. Manuf. 2020, 131, 105781. [Google Scholar] [CrossRef]
- Cao, M.S.; Sha, G.G.; Gao, Y.F.; Ostachowicz, W. Structural Damage Identification Using Damping: A Compendium of Uses and Features. Smart Mater. Struct. 2017, 26, 043001. [Google Scholar] [CrossRef]
- Inman, D.J. Engineering Vibration; Pearson Education Limited: London, UK, 1994; ISBN 978-0-13-287169-3. [Google Scholar]
- Slavič, J.; Simonovski, I.; Boltežar, M. Damping Identification Using a Continuous Wavelet Transform: Application to Real Data. J. Sound. Vib. 2003, 262, 291–307. [Google Scholar] [CrossRef]
- Montalvão, D.; Ribeiro, A.M.R.; Duarte-Silva, J. A Method for the Localization of Damage in a CFRP Plate Using Damping. Mech. Syst. Signal Process. 2009, 23, 1846–1854. [Google Scholar] [CrossRef]
- Montalvão, D.; Ribeiro, A.M.R.; Duarte-Silva, J.A.B. Experimental Assessment of a Modal-Based Multi-Parameter Method for Locating Damage in Composite Laminates. Exp. Mech. 2011, 51, 1473–1488. [Google Scholar] [CrossRef]
- Montalvão, D.; Karanatsis, D.; Ribeiro, A.M.; Arina, J.; Baxter, R. An Experimental Study on the Evolution of Modal Damping with Damage in Carbon Fiber Laminates. J. Compos. Mater. 2015, 49, 2403–2413. [Google Scholar] [CrossRef]
- Kessler, S.S.; Spearing, S.M.; Atalla, M.J.; Cesnik, C.E.S.; Soutis, C. Damage Detection in Composite Materials Using Frequency Response Methods. Compos. Part B 2002, 33, 87–95. [Google Scholar] [CrossRef]
- Sampaio, R.P.C.; Maia, N.M.M.; Silva, J.M.M. The Frequency Domain Assurance Criterion as a Tool for Damage Detection. Key Eng. Mater. 2003, 245–246, 69–76. [Google Scholar] [CrossRef]
- Chen, A. Frequency Response Assurance Criterion and Applications to Model Correlation of Body Structures. SAE Tech. Pap. 2003. [Google Scholar] [CrossRef]
- de Medeiros, R. Development of a Criterion for Predicting Residual Strength of Composite Structures Damaged by Impact Loading. Ph.D. Thesis, Mechanical Engineering, University of Sao Paulo–USP Sao Carlos School of Engineering, Sao Paulo, Brazil, 2016. [Google Scholar]
- Chesné, S.; Deraemaeker, A. Damage Localization Using Transmissibility Functions: A Critical Review. Mech. Syst. Signal Process. 2013, 38, 569–584. [Google Scholar] [CrossRef]
- Zhang, H.; Schulz, M.J.; Ferguson, F.; Pai, P.F. Structural Health Monitoring Using Transmittance Functions. Mech. Syst. Signal Process. 1999, 13, 765–787. [Google Scholar] [CrossRef]
- Sundaresan, M.; Ferguson, F.; Pai, P.; Sundaresan, M.J.; Schulz, M.J.; Hill, J.; Wheater, E.A.; Ferguson, F.; Pai, P.F. Damage Detection on a Wind Turbine Blade Section. In Proceedings of the International Society for Optical Engineering, San Jose, CA, USA, 26–28 January 1999. [Google Scholar]
- Poulimenos, A.G.; Sakellariou, J.S. A Transmittance-Based Methodology for Damage Detection under Uncertainty: An Application to a Set of Composite Beams with Manufacturing Variability Subject to Impact Damage and Varying Operating Conditions. Struct. Health Monit. 2019, 18, 318–333. [Google Scholar] [CrossRef]
- Liu, C.-L. A Tutorial of the Wavelet Transform. NTUEE 2010, 21, 22. [Google Scholar]
- Yan, Y.J.; Yam, L.H. Detection of Delamination Damage in Composite Plates Using Energy Spectrum of Structural Dynamic Responses Decomposed by Wavelet Analysis. Comput. Struct. 2004, 82, 347–358. [Google Scholar] [CrossRef]
- Singh, A.K. Detection of Defects in Composite Laminates with Vibro-Ultrasonic Methods. Ph.D. Thesis, National University of Singapore, Singapore, 2019. [Google Scholar]
- Andreaus, U.; Baragatti, P. Experimental Damage Detection of Cracked Beams by Using Nonlinear Characteristics of Forced Response. Mech. Syst. Signal Process. 2012, 31, 382–404. [Google Scholar] [CrossRef]
- Dolbachian, L.; Harizi, W.; Aboura, Z. Structural Health Monitoring (SHM) Study of Polymer Matrix Composite (PMC) Materials Using Nonlinear Vibration Methods Based on Embedded Piezoelectric Transducers. Sensors 2023, 23, 3677. [Google Scholar] [CrossRef]
- Andreades, C.; Ciampa, F. CFRP Composites with Embedded PZT Transducers for Nonlinear Ultrasonic Inspection of Space Structures. In Proceedings of the EWSHM2018, Manchester, UK, 10–13 July 2018. [Google Scholar]
- Andreades, C.; Malfense Fierro, G.P.; Meo, M. A Nonlinear Ultrasonic SHM Method for Impact Damage Localisation in Composite Panels Using a Sparse Array of Piezoelectric PZT Transducers. Ultrasonics 2020, 108, 106181. [Google Scholar] [CrossRef]
- Polimeno, U.; Meo, M.; Almond, D.P. Smart Nonlinear Acoustic Based Structural Health Monitoring System. Adv. Sci. Technol. 2008, 56, 426–434. [Google Scholar] [CrossRef]
- Loi, G.; Porcu, M.C.; Aymerich, F. Impact Damage Detection in Composite Beams by Analysis of Non-Linearity under Pulse Excitation. J. Compos. Sci. 2021, 5, 39. [Google Scholar] [CrossRef]
- Ooijevaar, T.H.; Rogge, M.D.; Loendersloot, R.; Warnet, L.L.; Akkerman, R.; Tinga, T. Nonlinear Dynamic Behavior of an Impact Damaged Composite Skin-Stiffener Structure. J. Sound. Vib. 2015, 353, 243–258. [Google Scholar] [CrossRef]
- Wei, L.; Chen, J. Far-End Delamination Characterization of CFRP Laminates Using Nonlinear Ultrasonic Spectra of Scaling Subtracted Vibration Response. Compos. Commun. 2024, 45, 101811. [Google Scholar] [CrossRef]
- Meo, M.; Polimeno, U.; Zumpano, G. Detecting Damage in Composite Material Using Nonlinear Elastic Wave Spectroscopy Methods. Appl. Compos. Mater. 2008, 15, 115–126. [Google Scholar] [CrossRef]
- Polimeno, U.; Meo, M. Understanding the Effect of Boundary Conditions on Damage Identification Process When Using Nonlinear Elastic Wave Spectroscopy Methods. Int. J. Non Linear Mech. 2008, 43, 187. [Google Scholar] [CrossRef]
- Bentahar, M. Nonlinear Acoustics: Application to Ultrasonic Characterisation of Damage in Heterogeneous Materials and Remaining Life Determination. Ph.D. Thesis, INSA Lyon, Lyon, France, 2005. [Google Scholar]
- Wei, Q.; Zhu, L.; Zhu, J.; Zhuo, L.; Hao, W.; Xie, W. Characterization of Impact Fatigue Damage in CFRP Composites Using Nonlinear Acoustic Resonance Method. Compos. Struct. 2020, 253, 112804. [Google Scholar] [CrossRef]
- van den Abeele, K.E.A.; Sutin, A.; Carmeliet, J.; Johnson, P.A. Micro-Damage Diagnostics Using Nonlinear Elastic Wave Spectroscopy (NEWS). NDT E Int. 2001, 34, 239–248. [Google Scholar] [CrossRef]
- Novak, A.; Bentahar, M.; Tournat, V.; el Guerjouma, R.; Simon, L. Nonlinear Acoustic Characterization of Micro-Damaged Materials through Higher Harmonic Resonance Analysis. NDT E Int. 2012, 45, 1–8. [Google Scholar] [CrossRef]
- Haggui, M.; Jendli, Z.; El Mahi, A.; Akrout, A.; Haddar, M. Damage Analysis in Flax/Elium Composite Using Linear and Nonlinear Resonance Techniques. J. Vib. Eng. Technol. 2023. [Google Scholar] [CrossRef]
- Pieczonka, L.; Klepka, A.; Martowicz, A.; Staszewski, W.J. Nonlinear Vibroacoustic Wave Modulations for Structural Damage Detection: An Overview. Opt. Eng. 2015, 55, 011005. [Google Scholar] [CrossRef]
- Andreades, C.; Malfense Fierro, G.P.; Meo, M.; Ciampa, F. Nonlinear Ultrasonic Inspection of Smart Carbon Fibre Reinforced Plastic Composites with Embedded Piezoelectric Lead Zirconate Titanate Transducers for Space Applications. J. Intell. Mater. Syst. Struct. 2019, 30, 2995–3007. [Google Scholar] [CrossRef]
- Klepka, A.; Pieczonka, L.; Staszewski, W.J.; Aymerich, F. Impact Damage Detection in Laminated Composites by Non-Linear Vibro-Acoustic Wave Modulations. Compos. B Eng. 2014, 65, 99–108. [Google Scholar] [CrossRef]
- Adebahr, W.; Solodov, I.; Rahammer, M.; Gulnizkij, N.; Kreutzbruck, M. Local Defect Resonance for Sensitive Non-Destructive Testing. In Proceedings of the AIP Conference Proceedings, Liptovsky Jan, Slovakia, 9–11 April 2014; American Institute of Physics Inc.: Melville, NY, USA, 10 February 2016; Volume 1706. [Google Scholar]
- Solodov, I.; Bai, J.; Bekgulyan, S.; Busse, G. A Local Defect Resonance to Enhance Acoustic Wave-Defect Interaction in Ultrasonic Nondestructive Evaluation. Appl. Phys. Lett. 2011, 99, 211911. [Google Scholar] [CrossRef]
- Solodov, I.; Bai, J.; Bekgulyan, S.; Busse, G. A Local Defect Resonance to Enhance Wave-Defect Interaction in Nonlinear Spectroscopy and Ultrasonic Thermography. In Proceedings of the World Conference on Nondestructive Testing, Durban, South Africa, 16–20 April 2012. [Google Scholar]
- Aymerich, F.; Staszewski, W.J. Impact Damage Detection in Composite Laminates Using Nonlinear Acoustics. Compos. Part A Appl. Sci. Manuf. 2010, 41, 1084–1092. [Google Scholar] [CrossRef]
- Aymerich, F.; Staszewski, W.J. Experimental Study of Impact-Damage Detection in Composite Laminates Using a Cross-Modulation Vibro-Acoustic Technique. Struct. Health Monit. 2010, 9, 541–553. [Google Scholar] [CrossRef]
- Ooijevaar, T.H.; Loendersloot, R.; Rogge, M.D.; Akkerman, R.; Tinga, T. Vibro-Acoustic Modulation Based Damage Identification in a Composite Skin-Stiffener Structure. Struct. Health Monit. 2016, 15, 458–472. [Google Scholar] [CrossRef]
- Ooijevaar, T.H.; Loendersloot, R.; Warnet, L.L.; de Boer, A.; Akkerman, R. Vibration Based Structural Health Monitoring of a Composite T-Beam. Compos. Struct. 2010, 92, 2007–2015. [Google Scholar] [CrossRef]
- Chen, B.Y.; Soh, S.K.; Lee, H.P.; Tay, T.E.; Tan, V.B.C. A Vibro-Acoustic Modulation Method for the Detection of Delamination and Kissing Bond in Composites. J. Compos. Mater. 2016, 50, 3089–3104. [Google Scholar] [CrossRef]
- Prevorovsky, Z.; Krofta, J.; Kober, J.; Chlada, M.; Kirchner, A. Non-Linear Ultrasonic Spectroscopy of 3D Printed Metallic Samples. Insight Non-Destr. Test. Cond. Monit. 2019, 61, 157–161. [Google Scholar] [CrossRef]
- Loi, G.; Uras, N.; Porcu, M.C.; Aymerich, F. Damage Detection in Composite Materials by Flexural Dynamic Excitation and Accelerometer-Based Acquisition. IOP Conf. Ser. Mater. Sci. Eng. 2022, 1214, 012007. [Google Scholar] [CrossRef]
- Kim, S.; Adams, D.E.; Sohn, H.; Rodriguez-Rivera, G.; Myrent, N.; Bond, R.; Vitek, J.; Carr, S.; Grama, A.; Meyer, J.J. Crack Detection Technique for Operating Wind Turbine Blades Using Vibro-Acoustic Modulation. Struct. Health Monit. 2014, 13, 660–670. [Google Scholar] [CrossRef]
- Willmann, E.; Boll, B.; Mikaelyan, G.; Wittich, H.; Meißner, R.H.; Fiedler, B. Vibro-Acoustic Modulation Based Measurements in CFRP Laminates for Damage Detection in Open-Hole Structures. Compos. Commun. 2023, 42, 101659. [Google Scholar] [CrossRef]
- Ruiz, D.V.; de Bragança, C.S.C.; Poncetti, B.L.; Bittencourt, T.N.; Futai, M.M. Vibration-Based Structural Damage Detection Strategy Using FRFs and Machine Learning Classifiers. Structures 2024, 59, 105753. [Google Scholar] [CrossRef]


| Material | Volume Mass ρ (g/cm3) | Young’s Modulus E (GPa) | Strength Re (MPa) | Tenacity KIC (MPam1/2) | E/ρ | E1/2/ρ | E1/3/ρ | Re/ρ |
|---|---|---|---|---|---|---|---|---|
| Composite | ||||||||
| Carbon-Fiber-Reinforced Polymer (58% uniaxial fiber in epoxy) | 1.5 | 189 | 1050 | 32–45 | 126 | 9 | 3.8 | 700 |
| Glass-Fiber-Reinforced Polymer (50% uniaxial fiber in epoxy) | 2.0 | 48 | 1240 | 42–60 | 24 | 3.5 | 1.8 | 620 |
| Kevlar-Fiber-Reinforced Polymer (60% uniaxial fiber in epoxy) | 1.4 | 79 | 1240 | - | 54 | 6.2 | 3.0 | 886 |
| Metal | ||||||||
| High-resistance steel | 7.8 | 207 | 1000 | 100 | 27 | 1.8 | 0.76 | 128 |
| Aluminum alloy | 2.8 | 71 | 500 | 28 | 25 | 3.0 | 1.5 | 179 |
| Reinforcement (Fiber) | Matrix (Polymer) | |
|---|---|---|
| Thermoplastics | Thermosets | |
| Carbon Glass Aramid (Kevlar) Polypropylene Hemp Flax etc. | Nylon Polypropylene Polycarbonate Cellulose Acetate Polystyrene Polyethylene Polyvinyl chloride Acrylonitrile-butadiene-styrene Polyether-ether-ketone etc. | Phenolic Polyimide Polyurethane Polyepoxide Polyester etc. |
| Equipment | Additional Equipment | Details | |
|---|---|---|---|
| Fixation | Foam Wire Clamping system Fixed–fixed | “ | “ |
| Input | Impact hammer Manual action Fan | “ | “ |
| Shaker Loudspeaker | Generator—Amplifier | “ | |
| PZT | Generator— Piezo amplifier | 40–100 V out of the amplifier | |
| PVDF | 500 V out of the amplifier | ||
| MFC | Generator | “ | |
| Output | Accelerometer Laser Vibrometer (LV) Piezoelectric sensors | Analyzer and PC Oscilloscope | “ |
| Structure | Fixation | Input | Output | Damage | Description | Ref. |
|---|---|---|---|---|---|---|
| Graphite/epoxy-laminated plate | Fixed in V-blocks | Accelerometers | Delamination (Fluorinated Ethylene Propylene (FEP) patches) | 4 first natural frequencies were used to observe that delamination has effects on the frequency loss, and 1/3 of the area of the specimen will lead to 20% of max defect | [69] | |
| Carbon/cyanate-laminated plate | Cantilever configuration | Surface bonded bimorph PZT patch actuator QP25N (150 V) Agilient 33120A waveform generator CX Quickpack Amplifier | LV | Delamination (plastic film) | Natural frequencies are used to identify delamination in composite plates; a small loss in natural frequencies is observed, especially for higher modes (20% decrease) | [70] |
| Glass/epoxy-laminated beam | Cantilever configuration | Impact hammer G1195 PZT bonded patch (sine sweep signal) Amplifier | PVDF bonded patch Analyzer (HP35665A) | Delamination (Teflon patches) | Natural frequencies shift induced by delamination is used to feed an NN; the natural frequencies became lower when the structure was damaged | [71] |
| Carbon- and Kevlar/epoxy-laminated beam | Cantilever configuration | Impact hammer PZT | Accelerometer PZT | Delamination (FEP patches) | Natural frequencies decrease is observable for the damaged structure for both PZT and accelerometer sensors | [72] |
| Circular glass/epoxy-laminated plate | Suspended with 3 flexibles | Loudspeaker Oscillator and amplifier | Accelerometer Oscilloscope | Delamination (impact 45 J) | Natural frequencies tend to decrease when the delamination area gets bigger and bigger; for mode 1 and 6, the natural frequency increases after reaching a delamination area (probably induced by a local change in the geometry) | [73] |
| Glass/polyester-laminated beam | Suspended by flexible | Impact hammer | Accelerometer Analyzer | Crack | Natural frequencies tended to decrease when the crack size increases, and some modes seemed more influenced by this damage | [74] |
| Method | Structure | Fixation | Input | Output | Damage | Description | Ref |
|---|---|---|---|---|---|---|---|
| MSC | T-stiffened panels of carbon/epoxy | Elastic bands | Shaker (sinusoidal wave (0–10 kHz)) | LV | Delamination (PTFE Film) Porosity | Change in mode shape displacement between damaged and intact structures was not the best indicator of damage presence | [82] |
| MSC and mode shape slope change | Carbon/epoxy-laminated plate | Suspended with 2 cotton strings | Impulse hammer | Accelerometer | Surface and penetrated crack | The experimental results were not able to detect crack location using both methods (Mode Shape Displacement and Slope Change) | [83,84] |
| Gapped-Smoothing Method (GSM) | E-glass/epoxy-laminated beam | Cantilever configuration | PZT (Continuous-sweep sine 140 V) Power amplifier | LV (PSV 400 SLV) and PVDF | 3 delaminations (Teflon insertion), impact damage, and saw-cut | GSM is able to localize damage through LV or a network of PVDF | [85] |
| Method | Structure | Fixation | Input | Output | Damage | Description | Ref. |
|---|---|---|---|---|---|---|---|
| MSC | T-stiffened panels of carbon/epoxy | Elastic bands | Shaker (sinusoidal wave (0–10 kHz)) | LV | Delamination (PTFE Film) Porosity | MSC showed that it can detect delamination accurately, but porosity was not detectable | [82] |
| MCI and CMD | Carbon/epoxy-laminated beam | Cantilever configuration | Modal hammer | Accelerometer | Delamination (Teflon patch) | CMD showed higher sensitivity than MCI to localized damage | [92] |
| MSC | Carbon/epoxy beams | Suspended on a frame | Shaker (periodic chirp) Impulse hammer | LV | Delamination and crack | The damage was identified efficiently by the MSC | [93] |
| Method | Structure | Fixation | Input | Output | Damage | Description | Ref. |
|---|---|---|---|---|---|---|---|
| MSEC | Carbon/epoxy-laminated plate | Suspended with 2 cotton strings | Impulse hammer | Accelerometer | Surface and penetrated crack | MSEC was able to locate both types of damage | [83] |
| MSE and Differential Quadrature (DQM) | Carbon/epoxy-laminated plate | Suspended with 2 cotton strings | Impulse hammer | Accelerometer | Surface and penetrated crack | For MSE, peaks were present around the location of damage, but some also occurred at other positions; this is why the DQM was implemented, and very good results were obtained with it | [84] |
| MSEC | E-glass/epoxy-laminated beam | Cantilever configuration | PZT (sweep sine 140 V) Power amplifier | LV (PSV 400 SLV) and PVDF | 3 delaminations (Teflon insertion), impact damage, and saw-cut | Strain energy detected well the location of damage, except for special cases with some doubt caused by other high value | [85] |
| MSECR | E-glass/epoxy skin and PVC foam for sandwich beams | Cantilever configuration | Electrodynamic shaker | Accelerometer | Debonding + remove face (Teflon sheet) | MSECR correctly located damage for single and multiple damage cases | [101] |
| Delamination Area of the Total Area | ||||
|---|---|---|---|---|
| 0.11% | 0.167% | 0.22% | ||
| Sub-Wavelets | 0 | 1.703 | 2.491 | 0.908 |
| 1 | 8.053 | 6.078 | 21.32 | |
| 2 | 0.403 | 3.718 | −1.005 | |
| 3 | −0.634 | 2.197 | −1.818 | |
| 4 | −14.10 | −45.38 | −6.603 | |
| 5 | 12.83 | 5.221 | 36.42 | |
| 6 | 0.395 | 1.546 | 3.626 | |
| 7 | 6.811 | 5.449 | 17.76 | |
| 8 | 0.961 | 3.068 | −2.736 | |
| 9 | 3.575 | −0.045 | 8.691 | |
| 10 | 0.561 | 4.663 | −1.279 | |
| 11 | 0.165 | 1.226 | −2.389 | |
| 12 | −12.30 | −31.87 | −8.129 | |
| 13 | 3.143 | −2.751 | 17.04 | |
| 14 | 0.412 | 4.026 | −1.193 | |
| 15 | 0.602 | 3.390 | 0.225 | |
| Method | Structure | Fixation | Input | Output | Damage | Description | Ref. |
|---|---|---|---|---|---|---|---|
| Higher harmonics | Carbon/epoxy-laminated plates | - | Signal generator Power amplifier Periodic signal | Accelerometer | BVID | Higher harmonics are observable and their amplitudes get bigger with higher damage severity | [125] |
| Damage indicator based on the amplitude of higher harmonics | Carbon/epoxy-laminated beam | Suspended with nylon cords | PI PL055.31—piezo actuator Harmonic excitation—6 V—1580, 2860, and 3915 Hz | PZT Oscilloscope | Impact damage | The first thing observed is that the response of the sensor is a linear function of the excitation amplitude for the intact structure, and this is not the case for the damaged ones. The damage index for the first frequency clearly detected the damage presence, but it was not the case for the two other frequencies. This is why they used a damage index combining all of the frequencies | [126] |
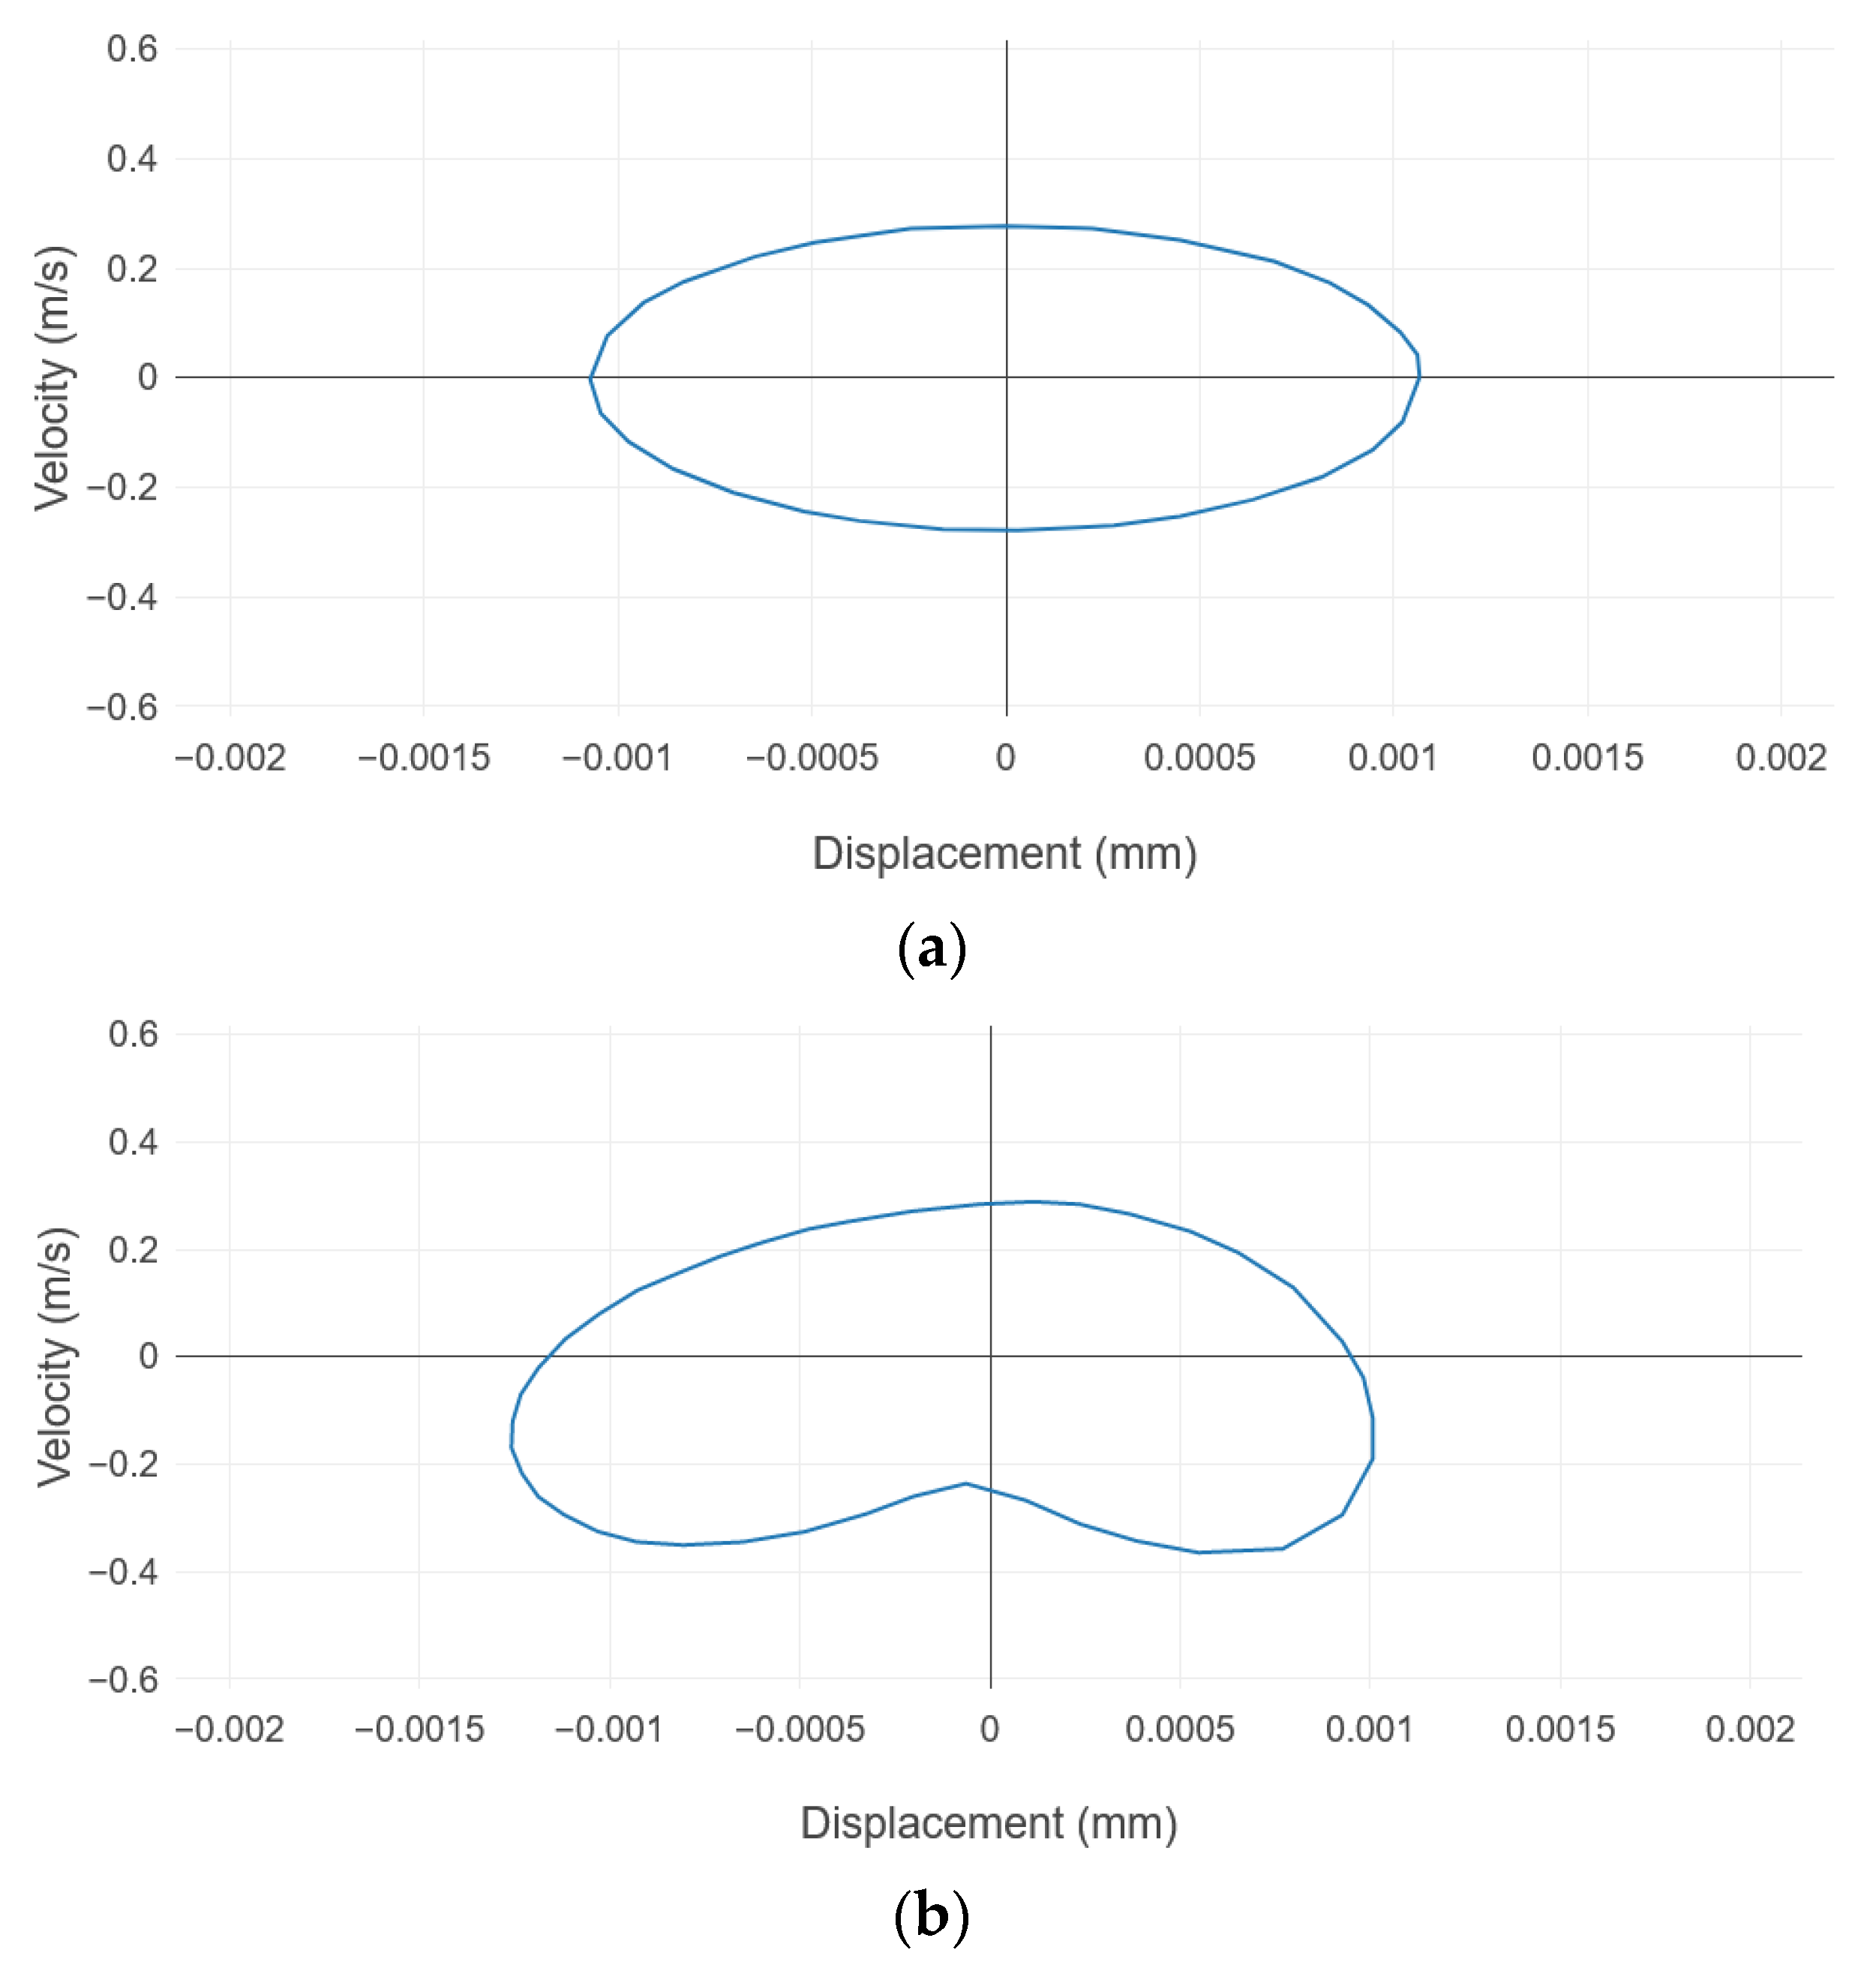
| Sub- and super-harmonics Velocity and acceleration distortions Phase portraits | Skin-stiffener composite structure | Freely suspended by elastic wire | Electromechanical shaker Single tone harmonic excitation signal—4th bending mode frequency—at different amplitude of excitation | LV | Damaged from impact testing (delamination) | Super-harmonics were present for the damaged structure Velocity, acceleration and also phase portrait showed distortion in the time-domain for damaged structure. Link between the motion of the structure and the distortions has been made. Opening and closing phases did not give high distortions, but the contact phase gave these distortions | [127] |
| Scaling subtraction method (SSM) | Carbon-fiber-reinforced polymer | Freely suspended by elastic ropes | Piezoelectric ceramic | LV | Far-end delamination | SSM methods showed very good results to filter noise and to effectively localize the delamination | [128] |
| Structure | Fixation | Input | Output | Damage | Description | Ref |
|---|---|---|---|---|---|---|
| CFRP-laminated plate | Supported by foam | Waveform generator Amplifier Speaker—100 Hz sweep signal around resonance frequencies—from 1.05 to 1.3 V (0.05 V step) | Accelerometer | Pendulum impact damage (repeated) | An obvious frequency shift is observable with increasing excitation amplitude. The damage indicator used in this article increased with the increase in the damage. | [132] |
| Rectangular beam of fibre-cemented slate | Suspended with nylon wires | Function generator Speaker Excited at the lowest flexural resonance mode at different amplitude | Accelerometer Labview | Hydrothermal shocks | The micro-cracks, induced by the hydrothermal shocks, clearly exhibited nonlinear behavior in the vibration response of the structure, with a frequency shift increasing with the damage severity. | [133] |
| Steel–TiC composite beams Glass rods Polymer-based beams | PZT or electromagnetic shaker Swept-sine signal—around bending mode frequencies—from 1 to 10 V | Accelerometer | Damage from tensile test | The classical nonlinear frequency shift gave nice results, but it was also combined with the harmonic-generation method, which showed higher sensitivity. | [134] | |
| Flax/elium cross-ply and unidirectional composite | Clamped–Free | Impact hammer Shaker | LV Accelerometer | Damage from tensile test | Greater sensitivity obtained from the nonlinear resonance methods over the linear ones. | [135] |
| Structure | Fixation | Input | Frequencies | Output | Damage | Description | Ref. |
|---|---|---|---|---|---|---|---|
| Carbon/epoxy-laminated beam | Glued on an aluminum stud linked to the rod of the shaker | Pump:
| Pump: 155, 282 and 494 Hz Probe: 6710 and 7180 Hz | Accelerometer | Delamination and fiber break (impact damage at 1.8 and 2.4 J) | VAM clearly detected damage occurrence in composite beam, but the accuracy of it depends on the choice of the pumping and probing frequencies. The lowest pumping frequency showed higher performance. | [148] |
| Carbon-reinforced fiberglass wind turbine | On service | Pump:
| Pump: 3.1, 6.2, 9.4, 400 Hz Probe: 5–10 kHz | MFC | Crack | VAM can be used while the turbine is rotating, and it can detect the presence of damage. The sidebands for damage cases were higher than for the healthy structure, but it still showed high sidebands for the healthy structure. | [149] |
| CFRP | Fix-end | Pump:
| Pump: 3 Hz Probe: 185–220 kHz | Surface-bonded piezoceramic | Hole | The pump wave for VAM was created from a fatigue mechanical loading, which is an original way. Phase modulation showed higher sensitivity than frequency modulation. | [150] |
| Technique | What Is Needed? | How to? | Drawbacks | Damage | Detected Size |
|---|---|---|---|---|---|
| Natural frequencies shift | The vibration of the structure in the frequency domain for a large frequency range is needed to evaluate the natural frequencies. | Send a white noise or a sweep signal with a large frequency band. Compare the natural frequencies of intact and damaged structures. | Only big damages are detectable. It can be influenced by some external conditions: temperature, boundary conditions, etc. Some modes show a higher shift, which means several modes have to be tested. | Delamination | >20% |
| Crack | >20% | ||||
| Impact | X | ||||
| Fiber cutting | X | ||||
| Debonding | >16% | ||||
| Modes shape (MS) | The vibration of the structure in the frequency domain for a large frequency range and at several locations is needed to record the mode shapes. | With LV, a network of sensors, or a roving input method, displacement at several locations can be obtained. Several criteria comparing intact and damaged structures can be used: MAC, CoMAC, ECoMAC, PrMAC, etc. | A large number of sensors or heavy processes are needed. | Delamination | >10% |
| Crack | >10% | ||||
| Impact | >10% | ||||
| Layer cutting | >0.4% | ||||
| Mode shape curvature | The modes shape. | Several criteria comparing intact and damaged structures can be used: MSC, NMSC, NCDF, etc. | Crack | >27.7% | |
| Surface cut | >7% | ||||
| Debonding | >10% | ||||
| Modal strain energy | The modes shape. | Several criteria comparing intact and damaged structures can be used: MSEC, MSED, CMSE, etc. | Delamination | >11% | |
| Surface cut | >11% | ||||
| Impact | >11% | ||||
| Modal flexibility | The modes shape. | Check the flexibility change. | Debonding | >1.2% | |
| Core | >0.3% | ||||
| Damping | The vibration of the structure is needed, and the damping can be obtained with several techniques, but the most classical one is the −3 dB method. | Send a white noise or a sweep signal with a large frequency band. Compare the damping parameter of intact and damaged structures. | Mainly influenced by operational factors and uncertainty in the damping characterization. | Delamination | >48% |
| Fatigue | 3rd cycle | ||||
| Impact | BVID | ||||
| FRF | Input and output are needed to build the FRF. | Some metrics can be used to observe differences in the FRF of intact and damaged structures for a large frequency range. | Impact | ||
| Hole | |||||
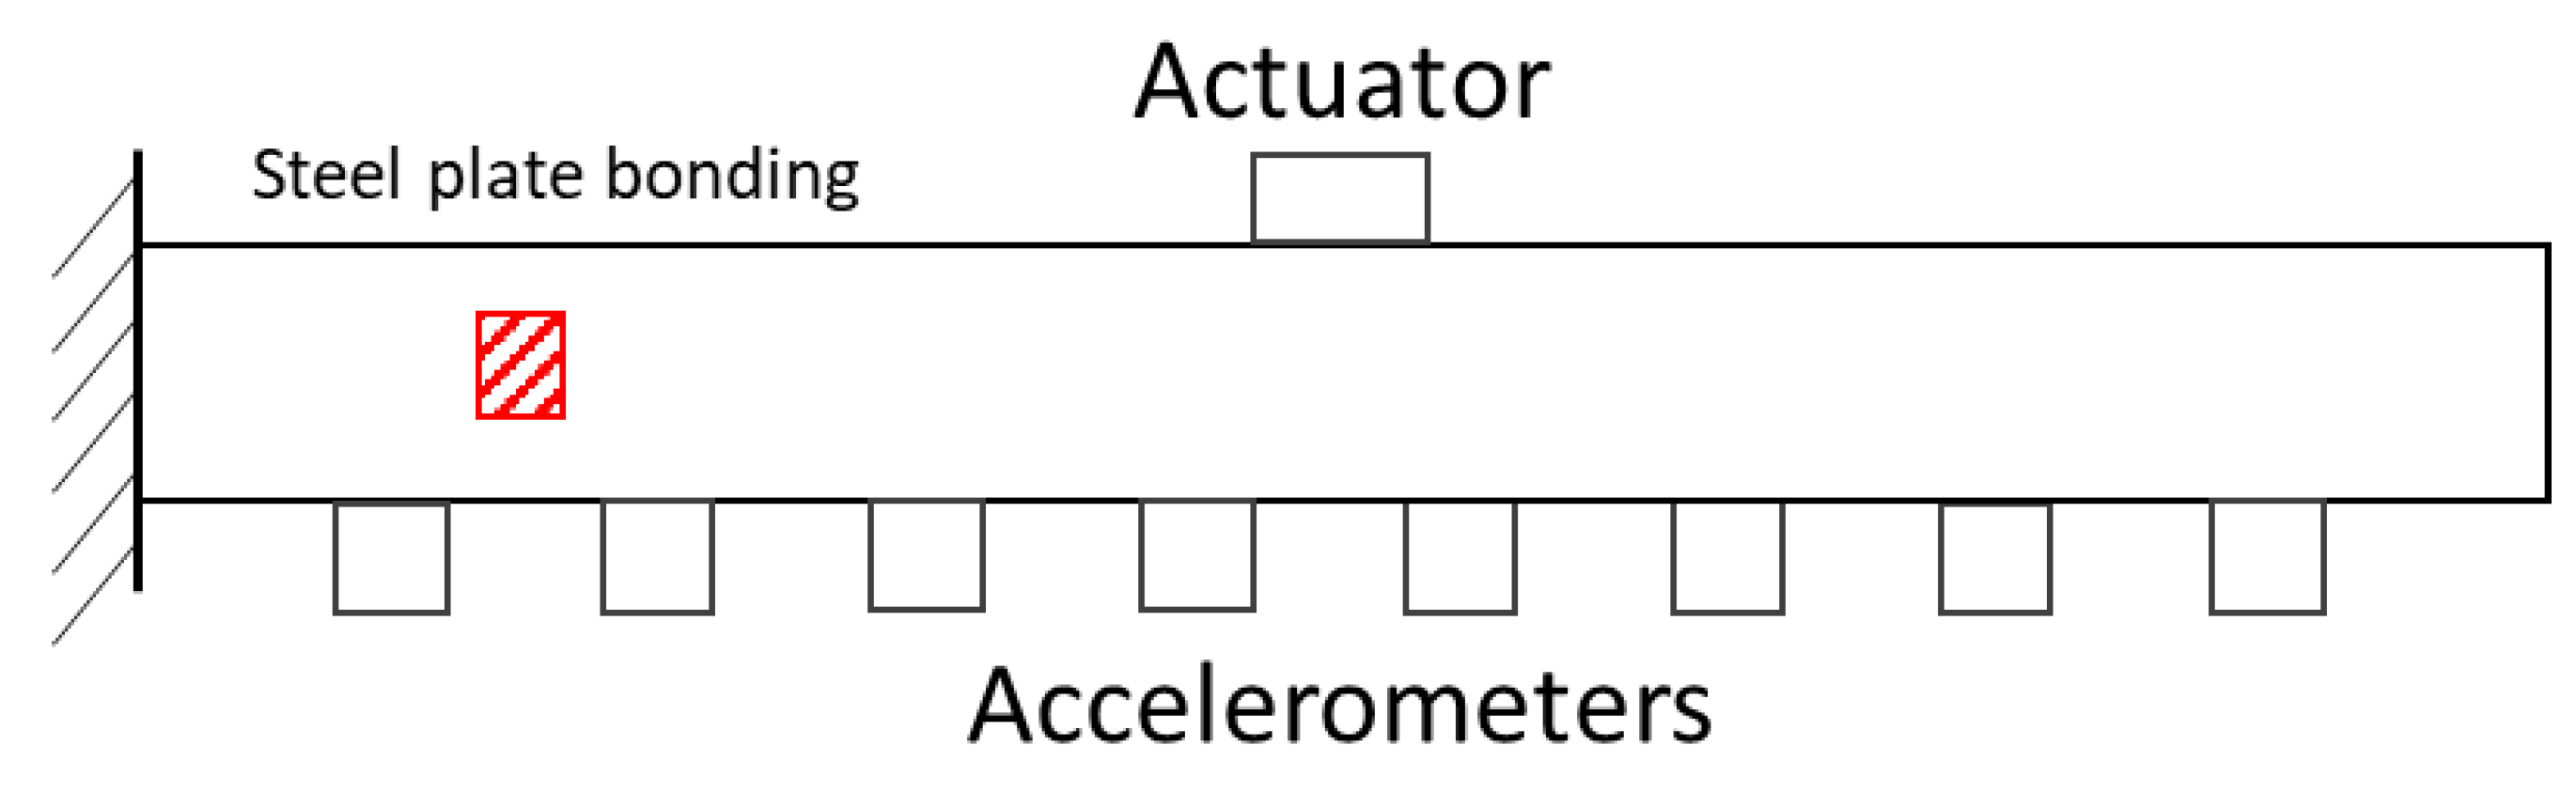
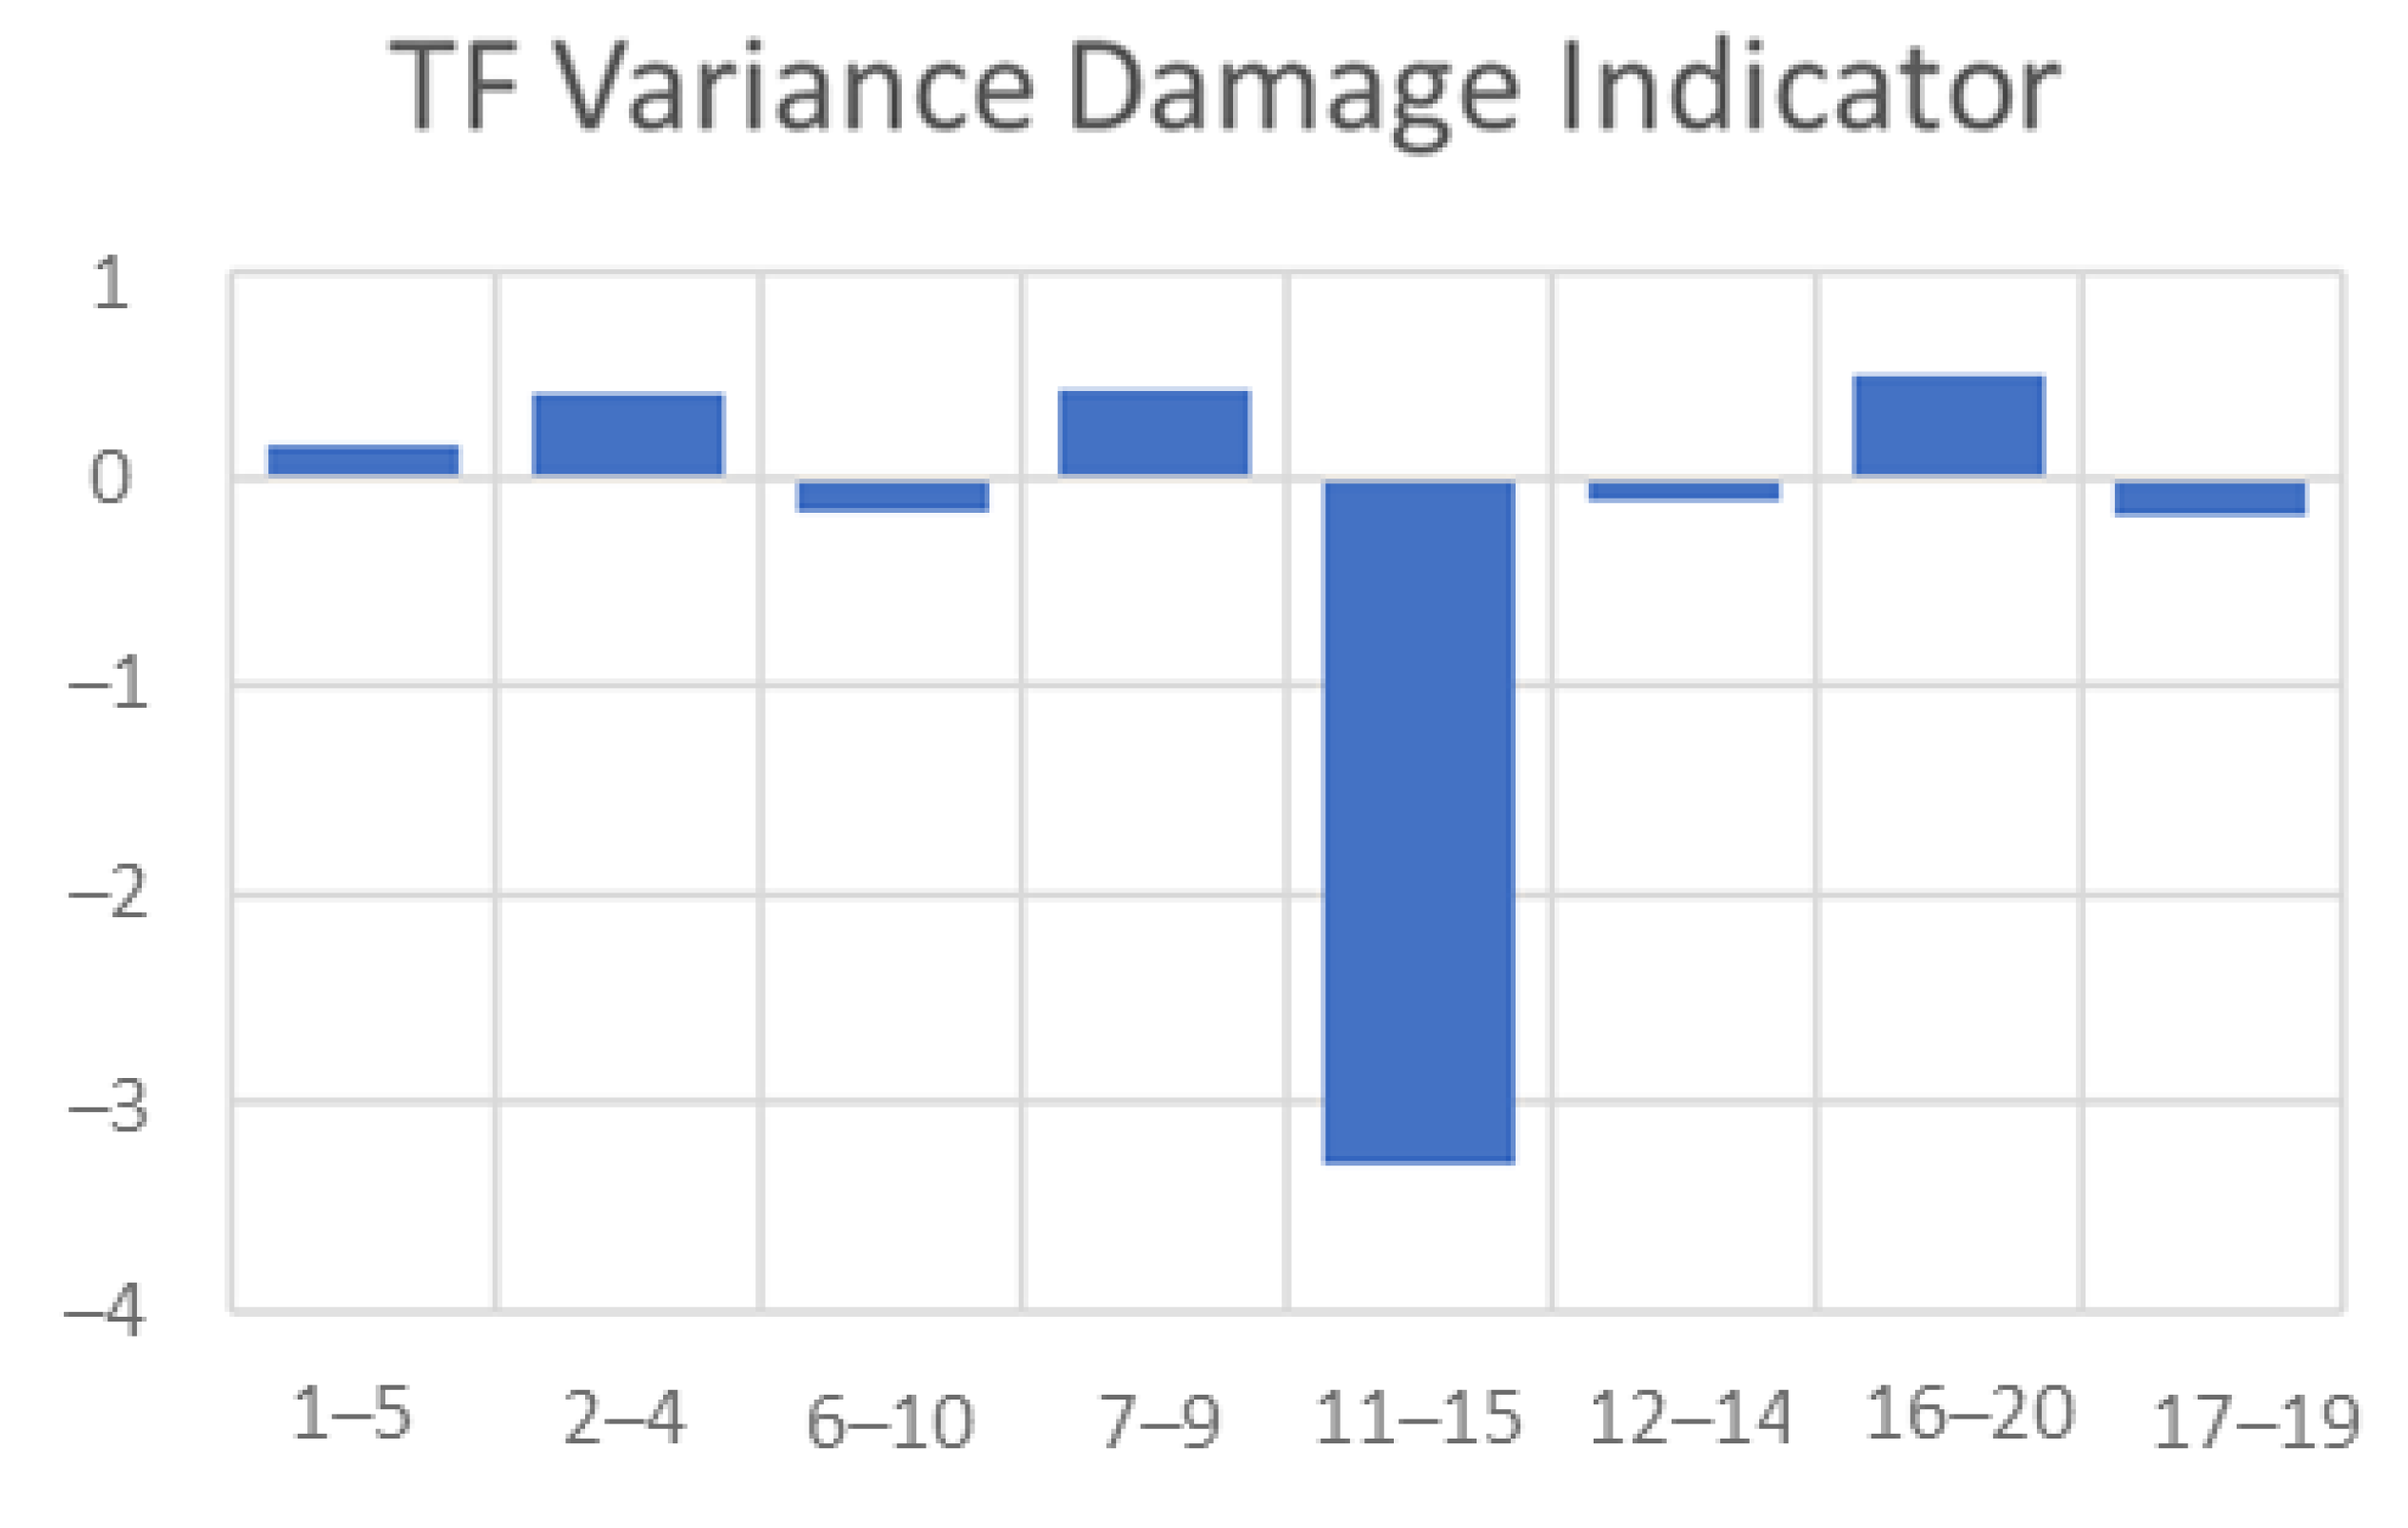
| TF | The displacements or velocities at several locations of the structure for the same input are needed. | A ratio of two displacements or velocities has to be made, and a damage indicator is calculated from this ratio. | A large number of sensors or heavy processes are needed. | Bonding steel plate | >20% |
| Impact | >5 J | ||||
| WT | Vibration output in the time domain. | The general vibration of the structure is needed, and the time domain signal should be divided into several sub-signals to compare each sub-signal energy. | Extra processing is needed, and the correct choice of wavelets should be made. | Delamination | >0.12% |
| Technique | What Is Needed? | How to? | Drawbacks | Damage | Detected Size |
|---|---|---|---|---|---|
| SFE | Global knowledge of the vibration of the structure to choose the best frequency for the harmonic signal excitation. | Compare damaged and intact structures through distortions in time-domain and phase portraits, sub- and super-harmonics, and damage indicators. | Small peaks can be hidden in the noise in operational detection. | Impact | BVID (>7 J) |
| Delamination | >3% | ||||
| Nonlinear resonance (NLR) and damping | Global knowledge of the vibration of the structure to choose the natural frequencies used for this technique with a harmonic or a sweep signal around these frequencies. | Compare the resonance curves obtained from different amplitudes of excitation for damaged and intact structures. Use nonlinear elastic and dissipative parameters as damage indicators. | A lot of tests have to be performed to obtain the resonance curves (10 in general) for 1 natural frequency. The frequency shift is also influenced by the boundary condition. | Debonding | >8% |
| Fatigue crack | 1st cycle | ||||
| Impact | BVID (10 J and 2400 times 3 J) | ||||
| VAM | Global knowledge of the vibration of the structure to choose the best frequency of excitation for the pumping signal and, in some cases, also for probing one. | Compare the occurrence of super-harmonics and sidebands between damaged and intact structures. Damage indicators based on their amplitude are also used. | This method is influenced a lot by the boundary conditions, so special care should be made with VAM. | Impact | BVID (>1.8 J) |
| Crack | |||||
| Nonlinear Damping (NLD) | Time-frequency domain signal is needed in order to perform the CWT. | Extract the instantaneous amplitude and phase of the response to calculate the instantaneous damping. Compare the variation of it between intact and damaged structures. | Post-processing techniques (CWT) have to be used to obtain the instantaneous parameters, which are necessary for the damping calculation. | Delamination | >32% |
| Fatigue crack | 2nd cycle |
Disclaimer/Publisher’s Note: The statements, opinions and data contained in all publications are solely those of the individual author(s) and contributor(s) and not of MDPI and/or the editor(s). MDPI and/or the editor(s) disclaim responsibility for any injury to people or property resulting from any ideas, methods, instructions or products referred to in the content. |
© 2024 by the authors. Licensee MDPI, Basel, Switzerland. This article is an open access article distributed under the terms and conditions of the Creative Commons Attribution (CC BY) license (https://creativecommons.org/licenses/by/4.0/).
Share and Cite
Dolbachian, L.; Harizi, W.; Aboura, Z. Experimental Linear and Nonlinear Vibration Methods for the Structural Health Monitoring (SHM) of Polymer-Matrix Composites (PMCs): A Literature Review. Vibration 2024, 7, 281-325. https://doi.org/10.3390/vibration7010015
Dolbachian L, Harizi W, Aboura Z. Experimental Linear and Nonlinear Vibration Methods for the Structural Health Monitoring (SHM) of Polymer-Matrix Composites (PMCs): A Literature Review. Vibration. 2024; 7(1):281-325. https://doi.org/10.3390/vibration7010015
Chicago/Turabian StyleDolbachian, Loan, Walid Harizi, and Zoheir Aboura. 2024. "Experimental Linear and Nonlinear Vibration Methods for the Structural Health Monitoring (SHM) of Polymer-Matrix Composites (PMCs): A Literature Review" Vibration 7, no. 1: 281-325. https://doi.org/10.3390/vibration7010015