1. Introduction
Learning how vibration increases blood flow is essential to better understand and optimize the physiological benefits of vibration. Studies have shown that vibration reduces DOMS [
1,
2], increases oxygenation [
3,
4,
5], increases muscle performance [
6,
7,
8], and increases ROM [
9]. It is hypothesized that these benefits of vibration may, in part, be due to increased blood flow. Therefore, knowing how vibration increases flow will lead to better treatment targeted for specific outcomes.
Vibration-based studies vary in the source of application, with many studies utilizing whole-body vibration (WBV) platforms in a standing position, which often perturbates the entire body system, but is often measured for its effects in the lower extremities [
1,
3,
4,
5,
7,
8,
10,
11,
12,
13,
14]. Localized vibration (LV) is targeted vibration to a particular body part or muscle group via a variety of different devices, such as by resting an extremity on a WBV platform [
15] or the back of the thigh on a marketed foot massage device [
6], or through the use of various handheld vibratory devices [
2,
16] including massage guns [
9,
17]. It has been shown that therapeutic vibration to the leg increases blood flow in the popliteal artery [
10,
11,
17] and femoral artery [
12,
13,
14]. It is also clear that blood flow in the lower leg is responsive to other stimuli such as massage [
18,
19] and heat [
20]. However, it is unclear exactly how these stimuli cause an increase in blood flow [
19]. There are several possible mechanisms of increasing arterial flow, which include increasing perfusion pressure through augmented arterial pressure, heart rate, and stroke volume, or by decreasing vascular resistance with vasodilators, many of which are sensitive to histamines [
21]. Various, external mechanical stimuli may use one or several of these mechanisms to increase blood flow.
Physiologically, if a stimulus increases cardiac output or arterial blood pressure then there will be a resultant increase in arterial blood flow. Interestingly, Needs et al. reported that therapeutic LV to the calf caused a significant increase in popliteal blood flow without increasing heart rate or arterial diameter [
17]. This suggests that mechanical stress induced by LV on the limb increases blood flow through localized decreases in peripheral vascular resistance, potentially due to reduced blood viscosity or by vasodilation via mast cell activation in the endothelial lining. Since blood flow is primarily regulated at the level of the arterioles, it is our belief that this histamine-induced dilation of peripheral arterioles is the primary mechanism through which LV (such as the use of a massage gun) increases arterial blood flow. Determining this mechanism will help explain the apparent relationship between vibration frequency and duration to increased blood flow. The understanding of this relationship can then be used to maximize this BF response for personal or clinical massage gun use, to improve BF and possibly enhance recovery.
Antihistamines are used to block histamine receptors in the endothelial lining of capillaries. This leads to less capillary permeability and inflammation, which are commonly a result of allergens entering the blood stream. The effect of antihistamines on blood flow has been studied in response to various conditions such as exercise [
22] and whole-body heating [
23]. Interestingly, Ely et al. reported that during exercise, antihistamines actually increased arterial blood flow, potentially due to the complex regulation of blood flow during exercise [
22]. We hypothesize that at a resting heart rate, subjects taking an antihistamine will experience a blunted increase in blood flow after LV treatment.
Boyden et al. demonstrated that ADGRE2, a member of the adhesion G-protein coupled receptor (AGCPR) family expressed on mast cells, is mechanosensitive and variants of the receptor in patients with vibratory urticaria were particularly sensitive to mast cell activation with vibration [
24]. They hypothesized that the shear force from a vibratory stimulus causes a separation of the alpha subunit from the beta subunit of the ADGRE2 receptor, resulting in a degranulation signal. This in turn leads to a measured increase of histamine in the blood serum [
24]. While it may be uncertain exactly how mechanical stimuli cause mast cell degranulation, it is clear that these stimuli result in an increase of histamine in the blood.
The purpose of this study was to measure the effect of histamine receptor antagonism on resting arterial blood flow after LV therapy, thereby supporting the hypothesis that histamine secretion by mechanically activated mast cells is a primary mechanism through which LV therapy increases arterial blood flow.
2. Materials and Methods
2.1. Participants
Twenty-one subjects (11 males, 10 females) completed this study (mean age 22.1 ± 2.0 years). Male subjects were between the ages of 21 and 25 and had a mean height of 181.3 ± 9.6 cm (167.6 cm to 195.6 cm) and mean weight of 80.7 ± 19.0 kg (61.2 kg to 127.0 kg). Female subjects were between the ages of 18 and 24 and had a mean height of 169.2 ± 7.5 cm (157.5 cm to 180.3 cm) and mean weight of 64.5 ± 9.3 kg (49.9 kg to 83.9 kg). Subjects were recreationally active, which we defined as engaging in a minimum of 30 min of exercise 3 times per week. Qualifying criteria included having no injuries to the lower extremities during the 3 months leading up to joining the study and having no active lower extremity pain or discomfort. Subjects were excluded if they had any prior cardiovascular or vascular disorders, or if they were currently using any blood pressure medication. Subjects were not screened for vibratory urticaria or mast cell disorders. However, the results showed no indication of subjects having any such issues. Subjects who participated in the study did not engage in lower body exercise at least 4 h prior to each treatment, as well as abstaining from caffeine consumption for 24 h before treatment. All participating subjects signed an approved IRB consent form (IRB2022-083) in accordance with the Declaration of Helsinki.
2.2. Procedure
Subjects reported for treatment on 2 different days with a minimum of 24 h between each treatment. Each subject received the same LV treatment condition each day, consisting of 47 Hz vibration for a 10 min duration. To avoid any potential delayed effect of the antihistamine, the treatment order was not randomized. It is possible that this lack of randomization may have led to an unknown effect on the results based on the order of treatments. Prior to the second treatment, participants took 180 mg fexofenadine antihistamine medication one hour before receiving treatment. It was found that the minimum detectable difference of the vibration effect on the antihistamine condition for the mean velocity difference from baseline was 2.02 cm/s.
To start each treatment, subjects were connected to a 3-lead ECG to measure heart rate. The ECG then connected to the GE Logiq S8 ultrasound unit (GE Healthcare, Chicago, IL, USA). Then, to allow subjects’ heart rates to reach a baseline level, they remained in a prone position on a treatment table for 10 min. To avoid unintended muscle contraction to the calf, their ankles were placed on a foam roller, allowing the feet to be relaxed and the knee to be mildly bent. Resting blood flow measurements were then taken, followed by 10 min of LV treatment at 47 Hz to the calf area using a Hypervolt percussion massage gun (Hyperice, Irvine, CA, USA). During the LV treatment, the massage gun was moved over the gastrocnemius and soleus muscles at an even tempo of about three seconds (proximal–distal–proximal) with no extra pressure other than the weight of the device.
Figure 1 depicts the time points of each blood flow measurement post vibration, with time 0 being immediately after the treatment ended. In total, 13 measurements were taken; immediately after LV was completed, and then once every minute for 5 min, and finally 7 measurements every 2 min until 19 min post-LV.
2.3. Measurements and Analysis
The popliteal blood flow was measured distally from the knee using a GE Logiq S8 ultrasound. A 9 L transducer set at 10.5 Mhz in vascular mode was used to measure the blood flow. Previous studies have used similar methods for measuring arterial blood flow [
12,
14], and ultrasound blood flow measurements have been shown to be reliable [
25]. The transducer was placed on the popliteal area, and using brightness and color-flow modes, internal landmarks were identified including the femoral condyles and proximal tibia, along with the bifurcation of the anterior tibial artery. Measurements were taken 1 to 2 cm proximal to the bifurcation. Once the location for the measurement had been established, the skin was marked with a “permanent” soft-tipped marker to aid in quickly identifying the same location for subsequent measurements. (Marks were darkened on subsequent visits, as needed). The long-axis view of the artery was visualized, with near and far intima-media layers clearly observed. We recorded a tri-phasic cine-loop of at least 4 s and corrected with a standard insonation angle of 60°. Outcome measures included heart rate (bpm), mean blood velocity (cm/s), peak blood velocity (cm/s), arterial diameter (cm), and volume flow (mL/min). Five cardiac cycles were used to determine mean velocity and volume flow. Arterial diameter was measured from the inner border of the near vessel wall, intima-media, to the inner border of the far intima-media during the diastole of the synchronized ECG waveform. Volume flow was then calculated by internal software using the diameter measurement. Measurements were repeated according to the same methods at specified time intervals. Velocity and volume flow measurements are reported as the difference from baseline values. This allowed for a comparison of treatments within the same subject. All participants completed the study within one week of starting.
Hypervolt states that the highest frequency of the gun is 53 Hz at level 3. Using an omega HHT41 digital stroboscope (Omega Stamford, CT), we determined that the actual highest frequency of the Hypervolt gun was 47 Hz. We also verified that the Hypervolt massage gun head had a measured amplitude of 2.56 cm and a weight of 1.14 kg.
Volume flow (VF), mean velocity (MV), and arterial diameter were the only measurements used for statistical analysis. Changes in heart rate were so minimal that they were not analyzed. Arterial diameter was initially analyzed but was found to have insignificant changes, so it was not included in further analysis. The change from baseline data for MV and VF across all twenty-one subjects was averaged for both control and antihistamine conditions. VF is a function of MV and arterial diameter, and the average changes from the baseline results were so similar to MV that only MV was used for statistical analysis. Cell means mixed models were used to account for both within-subject and between-subject variability, and contrasts were created to perform t-tests of interest. First, the vibration effect pre to post was tested in both the antihistamine and control conditions for MV. Next, the average vibration effect was taken over all time periods post-vibration and compared between the two conditions for MV.
We performed four statistical tests. Analyzing the vibration effect pre to post for both control and antihistamine conditions for MV requires 2 tests. The comparison of the vibration effect pre–post and averaged across all time points requires 2 more tests, resulting in 4 tests in total. Since multiple tests can artificially increase the significance level (α), we used a Bonferroni correction, resulting in a critical t-value of ±2.41 to maintain a family alpha level of 0.05.
3. Results
Table 1 shows the t-values of the pre–post effect of vibration for MV and each condition, as well as the comparison of the average effect of the two conditions.
Figure 2 shows the data distributions for MV difference from baseline immediately post-LV for control and antihistamine conditions (left), as well as the average MV difference across all time points post-LV for each condition.
This reveals that mean blood velocity was not significantly raised post-vibration after subjects had received antihistamine medication, but supports our previous finding that 47 Hz 10 min LV significantly increased MV in the control condition. It also shows that the effect of the antihistamine, immediately post-LV and averaged over 19 min post-LV, significantly decreased blood flow compared to the control condition.
Table 2 shows the heart rate and diameter for each subject pre- and post-LV, averaged over the control and antihistamine conditions. These data show that the vibration effect on these two outcome measures was small and inconsistent between subjects in this study population. The correlation between HR and popliteal diameter had an R2 value of 0.033. This shows that there is no direct relationship between the two measures.
Figure 3 and
Figure 4 show the comparison of the two conditions (control and antihistamine) over time for MV and VF, respectively, averaged across all 21 subjects. The raw standard deviations for those averages are also plotted.
These figures depict the effect of antihistamines on blood flow after the LV treatment has concluded.
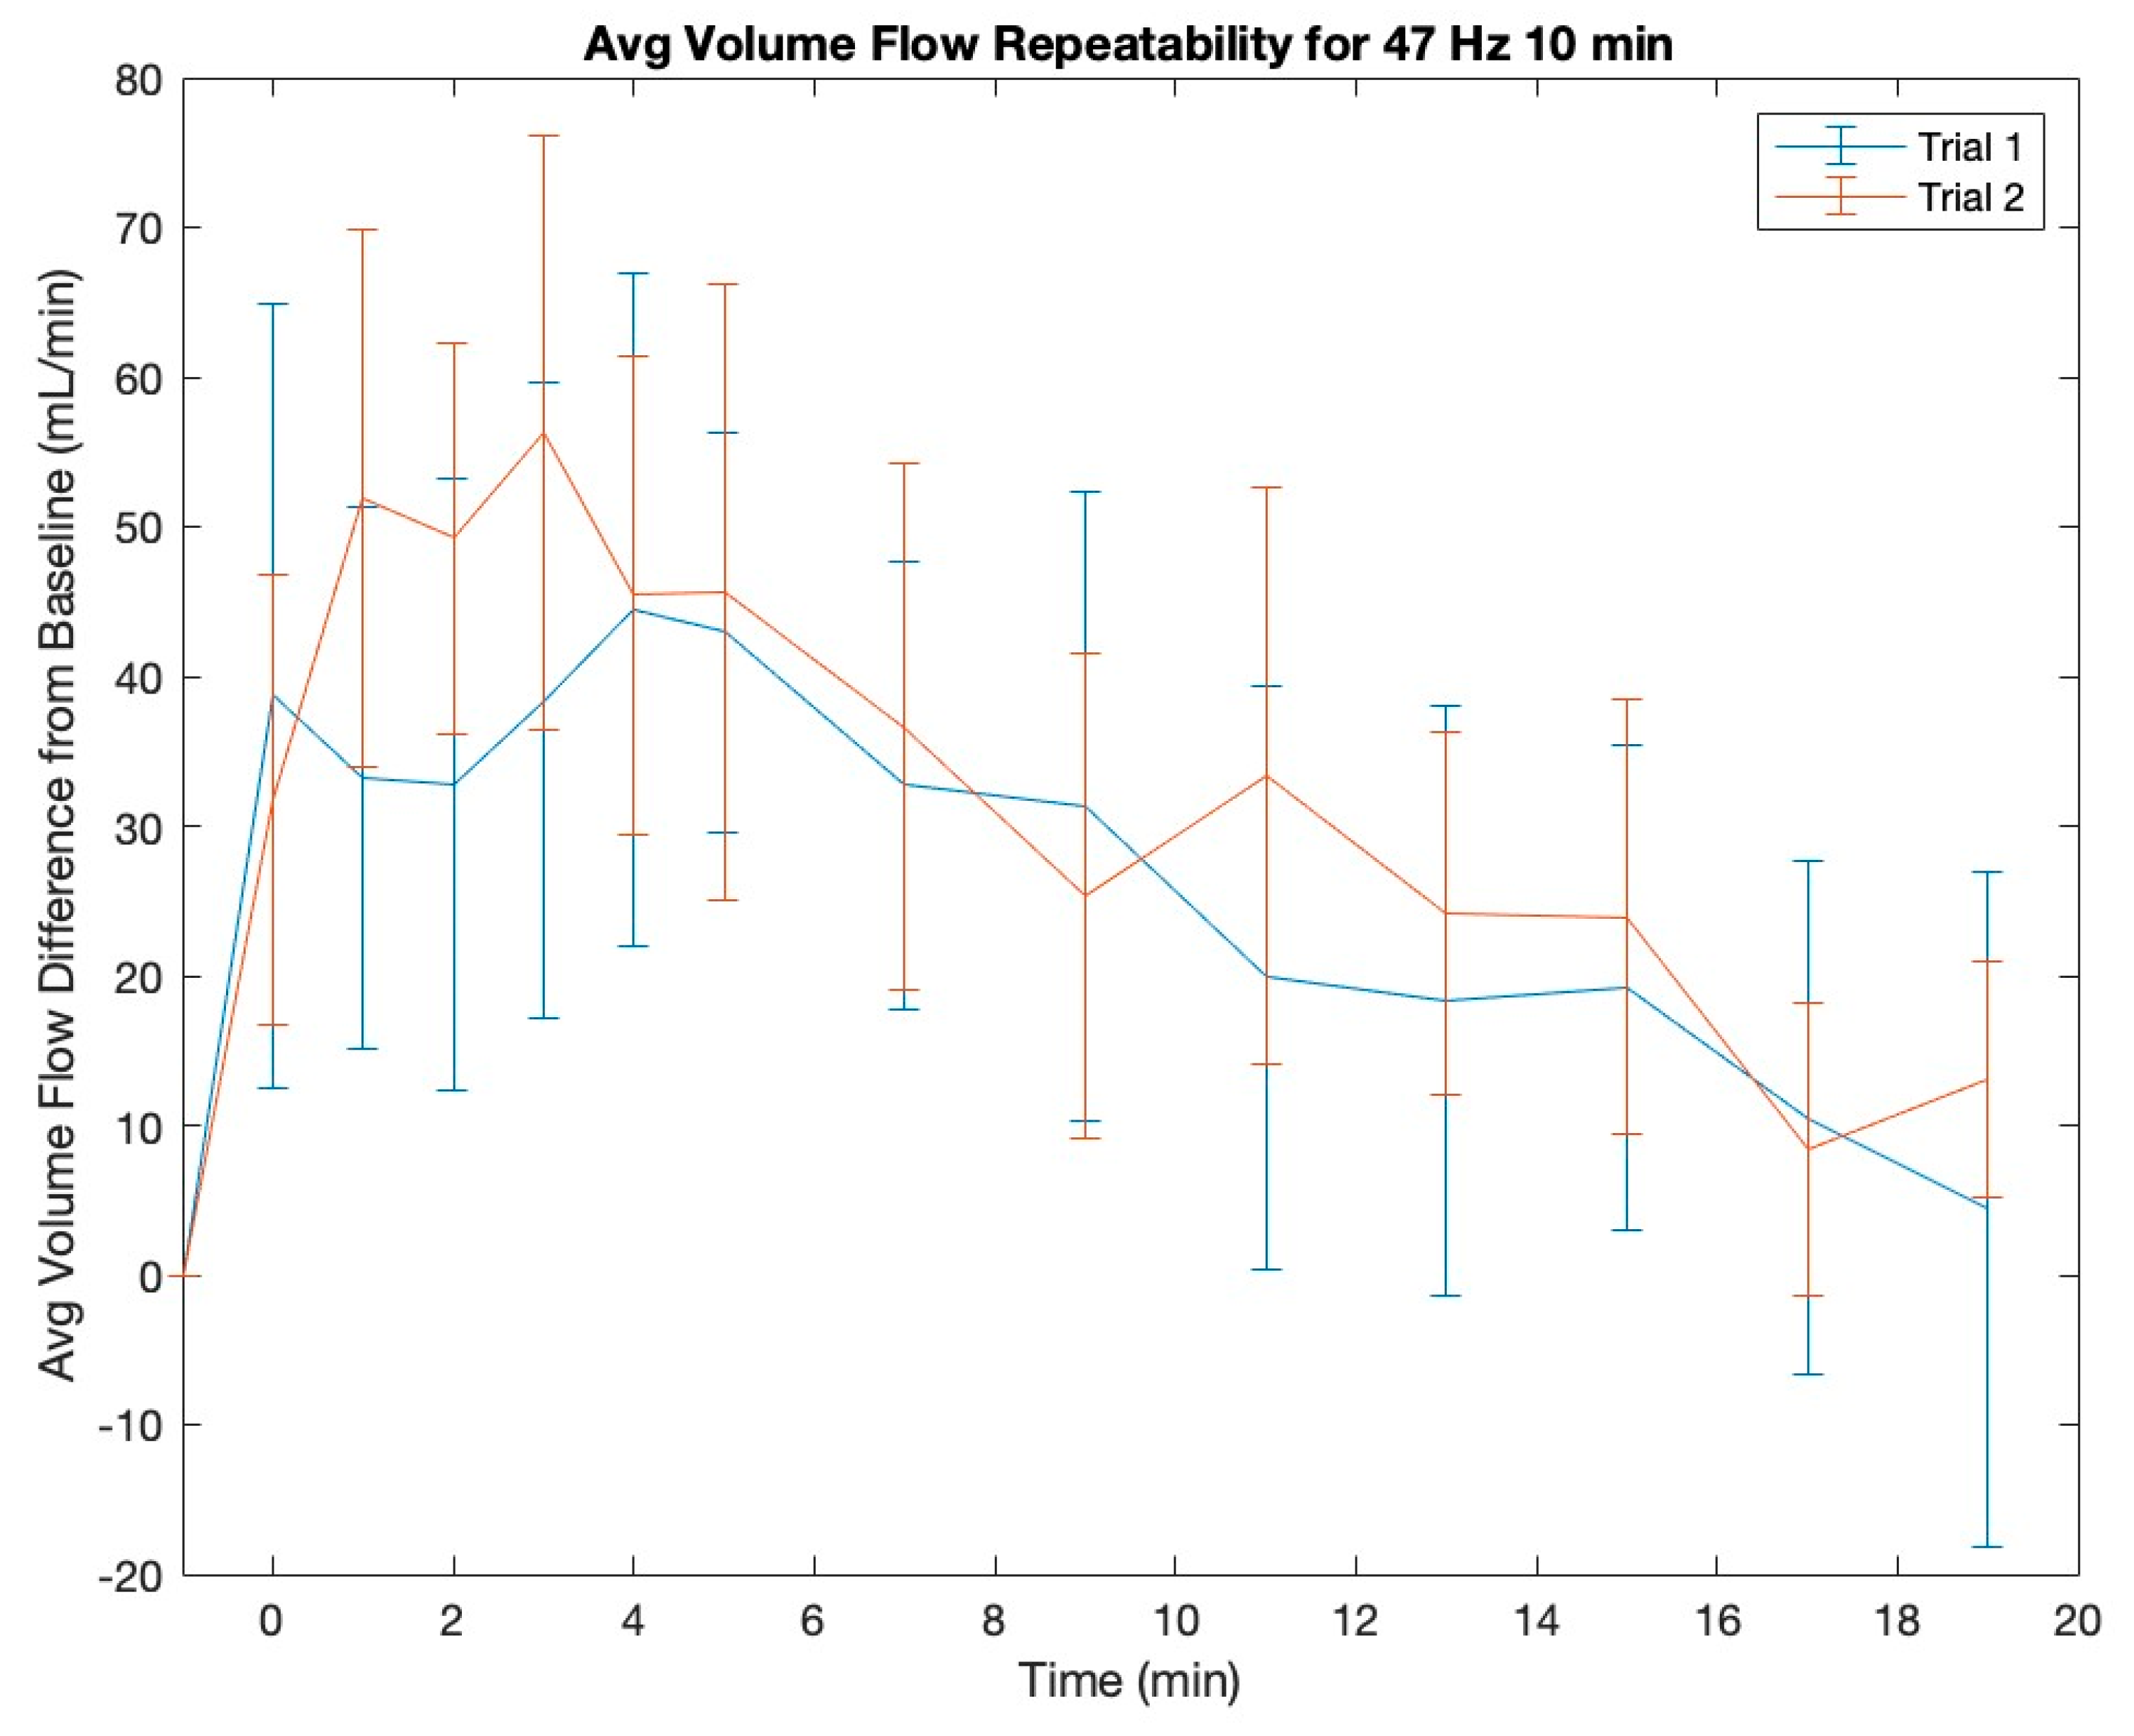
To investigate the repeatability of the vibration effect, we also compared the average control condition with the MV and VF results for 47 Hz 10 min in our previous study [
17]. Plots of the two trials for both MV and VF are shown in
Figure 5 and
Figure 6, respectively. To compare these results, we performed two tests, analyzing the average effect of the vibration over all time points, and found that the differences between our previous results and these results were not significant. The critical t-value for these tests was ±2.093 and the measured t-value for MV was 1.084 and for VF 1.080.
4. Discussion
The intake of an antihistamine blunts the blood flow response in the popliteal artery following 10 min of LV to the calf area. The difference between the peak increase of the control and the antihistamine is 2.31 cm/s for MV and 35.62 mL/min for VF, suggesting that histamines released during LV therapy are blocked when antihistamine medication is taken. It is likely that one of the primary mechanisms for increased blood flow following LV is mediated through histamine release.
Halliwill et al. performed a study where subjects were given 540 mg of fexofenadine and 300 mg of ranitidine to block 90% of histamine receptors and exercise-induced blood flow changes were measured [
22]. Our study used only 1/3 the dose of fexofenadine and still found a significant effect on blood flow from histamine antagonism. Again, despite blocking less than 90% of histamines, this suggests that the mechanical stimulus of LV increases histamine signaling in the blood stream.
Based on the results of our previous study, it is interesting to note that the frequency and duration of LV exposure play a role in changing levels of blood flow. Higher frequencies (up to 47 Hz) and longer durations (up to 10 min) resulted in greater changes to blood flow [
17]. This, combined with our current results, implies that frequency and duration may have an impact on histamine signaling. This may be due to mechano-sensing mast cells that are responsible for releasing histamines into the blood [
26].
Boyden et al. conducted a study on patients who suffered from vibratory urticaria, a skin disease where small amounts of vibration or friction can cause hives to break out. In their study, it was found that certain patients with vibratory urticaria had a genetic mutation in the ADGRE2 receptor (part of the AGPCR family) expressed on their skin mast cells [
24]. A mutation in ADGRE2 receptors in patients with vibratory urticaria resulted in both an increase in degranulation and a reduced threshold for vibration to cause mast cell degranulation and histamine release compared to non-mutated ADGRE2 [
24,
26]. However, non-mutant ADGRE2 receptors also responded to mechanical signals in healthy cells but required more vibration to elicit a response [
26]. The time-course of increased blood flow follows similar kinetics to that of serum histamine and mast cell degranulation in response to vibration challenge, as demonstrated by Boyden et al. [
24]. These data suggest that histamine plays an important role, and that mast cell activation may be the source of histamines in response to LV treatment. The exact vibration characteristics and thresholds, as well as in vivo factors that mediate the separation of the subunits of ADGRE2 to trigger signaling, are not well understood. However, it is likely that a high force and frequency of vibration signals causes the alpha and beta subunits to separate, resulting in mast cell degranulation [
24]. The results of the study conducted by Boyden showed that patients with the missense in ADGRE2 had higher levels of histamine in serum than those without, after a vortex vibration challenge on the arm. This suggests that the mutated ADGRE2 receptor has a lower threshold of activation.
This result was confirmed by Naranjo et al., in their study that investigated the effects of varying vibration frequency on mast cell activation. This study tested a range of frequencies from 8.33 Hz (500 rpm) to 33.3 Hz (2000 rpm) for 20 min on both mutated and non-mutated mast cells in vitro. They found that non-mutated mast cells showed an increase in granulation percentage from 10% to 14% when the frequency was changed from 25 Hz to 33 Hz [
26]. This reflects the data collected from our previous study, which showed an increase in blood flow as frequency increased [
17].
Therefore, we hypothesize that mast cell mechanical activation is force-dependent and that greater amounts of force result in a larger amount of mast cells being activated in the deeper tissue. This hypothesis explains the impact of frequency on mast cell activation and histamine release. According to accepted guidelines for reporting vibration interventions, the equation for peak acceleration as a function of vibration frequency is given in Equation (1) [
27]. Equation (2) is the equation for force due to an accelerating mass:
The mass of the massage gun head (m) and the distance (d) traveled by the head are constant. The distance (d) is constant because the device head does not bounce off the soft tissue, meaning it is always in contact with the skin. Any variations in the distance due to resonant vibrations would be negligible. This means that the peak force exerted by the massage gun is inversely proportional to the frequency (f) squared. Therefore, the peak force (F) of the massage gun can be expressed in terms of frequency (f) as
This shows that the force of the massage gun is proportional to the frequency squared, which is supported by our previous results [
17] and Naranjo [
26]. This hypothesis could potentially explain the significance of vibration displacement, as well. If frequency remains constant between two devices but one device has a longer ‘throw’, resulting in a larger displacement, that device will exert a greater force and may activate a greater number of mast cells that are deeper in the tissue. Prior studies of mast cell responsiveness to vibratory stimuli have primarily focused on cutaneous mast cells in the vibratory urticaria. In this setting, the vibratory challenge applied to the forearm and mast cell activation generally caused localized erythema, likely due to the dilatation of the capillaries. However, these challenges used a laboratory vortex, which likely stimulates superficial mast cells rather than mast cells deeper in the tissue, as we would expect with LV stimulation. In addition, the vortex vibration was applied to the anterior forearm, where the deeper muscular tissue does not have an abundance of mast cells. In the present study, the vibration was applied with greater displacement into an area where mast cells are present in the deeper loose connective tissues around the synovial joint and cartilage of the knee, where they reside close to blood vessels and nerves [
28]. Here, the mast cell activation caused by vibration may be sufficient to cause localized effects on the vasculature, but not sufficient to cause systemic effects.
Further research is needed to validate this mechanism of vibration-induced blood flow by measuring the response of mast cells in the skin and deeper tissue. Also, the population of this study was limited to recreationally active, healthy young adults, and further testing on a wider population is needed to determine the efficacy of this therapy. It is also important to note that the increase in MV and VF due to LV is minimal compared to increases caused by light exercise or increased heart rate. Further research is required to determine the extent, if any, of therapeutic benefit existing from LV treatment.
Other mechanisms that we believe are unlikely to primarily cause an increase in blood flow due to LV include the shear thinning of the blood and muscle activation. Shin et al. performed a study measuring the blood flow resistance of a red blood cell suspension in Dextran-40 in a microchannel under various transverse vibration frequencies. They found that at very low flow rates (<0.01 mL/min), increasing the vibration frequency from 0 Hz to 30 Hz significantly decreased the blood flow resistance. However, at flow rates greater than 1 mL/min, the change in blood flow resistance was insignificant with a changing vibration frequency up to 70 Hz [
29]. The lowest measured resting flow rate of this study was over 2000 mL/min. Based on the results of Shin et al., the transverse vibration applied via LV would not significantly change the blood flow resistance, suggesting that blood thinning is not a primary mechanism of increasing blood velocity [
29]. Finally, there may be local muscle activation caused by the LV therapy, but not enough to cause an increase in heart rate. Since the 1960s, the application of higher frequency LV (150–200 Hz) has been noted to have an effect on the tonic vibration reflex (TVR), which in turn helps to produce muscle contraction [
30]. Earlier studies have reported the potential application of LV to be useful in the treatment of muscle spasticity and the facilitation of muscle contraction in paretic muscles [
31]. Further analyses of effective vibrational frequency have noted that muscle contractions are best induced in the frequency range of 100–150 Hz due to a combination of the harmonic synchronization of motor units decreasing while subharmonic synchronization increases [
32]. Frequencies beyond 150 Hz are not considered beneficial for facilitating contraction and become uncomfortable, while frequencies below 100 Hz have mixed results but appear to not have an appreciable effect on muscle contraction [
32,
33].

 ,
, 


