Bunch Length Measurement Employing Cherenkov Radiation from a Thin Silica Aerogel
by
Ken-ichi Nanbu
, 
Yuki Saito
,
Hirotoshi Saito
,
Shigeru Kashiwagi
,
Fujio Hinode
*,
Toshiya Muto
and
Hiroyuki Hama
Research Center for Electron Photon Science, Tohoku University, Sendai 982-0826, Japan
*
Author to whom correspondence should be addressed.
Particles 2018, 1(1), 305-314; https://doi.org/10.3390/particles1010025
Submission received: 24 October 2018
/
Revised: 4 December 2018
/
Accepted: 7 December 2018
/
Published: 11 December 2018
(This article belongs to the Special Issue Superradiances from Ultra Short Electron Bunch Beam)
Abstract
:The temporal profile measurement for ultra-short electron bunches is one of the key issues for accelerator-based coherent light sources. A bunch length measurement system using Cherenkov radiation (CR) is under development at the Research Center for Electron Photon Science, Tohoku University. This system allows for the real-time diagnostics of electron bunches. The system comprises a thin silica aerogel as the Cherenkov radiator, a specially designed optical transport line, and a high-speed streak camera. The electron bunch length can be obtained by measuring the time spread of the CR from the electrons passing through the radiator medium using the streak camera. In this paper, we describe the novel bunch length measurement system using CR, discuss the expected time resolution of the system, and finally present the measurement results.
1. Introduction
R&D work on a coherent terahertz light source using ultra-short electron bunches has been conducted at the accelerator test facility t-ACTS, Tohoku University [1]. To obtain the intense coherent radiation in the terahertz frequency region, it is necessary to generate an electron bunch with a length of a few hundred fs or less. Applying the velocity bunching method to the accelerating structure makes it possible to generate such a short bunch using a compact and simple apparatus. In the velocity bunching scheme, an electron bunch with a velocity slightly lower than the phase velocity of the RF field in the accelerating structure is injected to the accelerating structure with the so-called “RF zero-cross” phase for velocity modulation [2]. As a result, this modulation causes a bunch rotation while accelerating the entire bunch because of the phase slip. To realize a short bunch length, it is important to manipulate the initial energy spread of the injected beam to be small. For this purpose, we developed a specially designed RF gun [3]. According to the tracking simulation by General Particle Tracer (GPT), a short bunch length of less than 100 fs can be expected. Coherent radiation has been used widely to measure such short electron bunch lengths. Various radiation processes, such as synchrotron radiation (SR), transition radiation (TR), Cherenkov radiation (CR), diffraction radiation (DR), and Smith–Purcell radiation (SPR) from short electron bunches can be utilized as a coherent radiation source for beam diagnosis [4,5,6,7]. In particular, coherent SPR is considered especially useful as a monitor that can measure the beam non-destructively like DR. The FACET facility reported measurement results of a bunch length of 350 fs using SPR [8]. When measuring the bunch length with coherent radiation, it is important to obtain the radiation spectrum accurately over the necessary wavelength range. Other methods of measuring the ultra-short bunch length offer excellent accuracy, e.g., 60 fs using EO sampling or 10–20 fs using the transverse deflecting structure [9,10,11]. However, these methods require more space to be installed in the beamline, along with a considerable budget. As an easier way to obtain moderate resolution with a single shot, the measurement of optical transition radiation (OTR) has been performed at t-ACTS using a streak camera. Among currently available streak cameras, Hamamatsu FESCA-100 has the fastest sweep rate (of 10 ps/frame), and its time resolution is approximately 100 fs depending on the wavelength of the incident light [12]. However, to realize this high resolution, it is necessary to strictly limit the wavelength and bandwidth of the light incident on the streak camera. This leads to another problem in that the measurable light quantity becomes quite insufficient. In fact, in our previous measurements of OTR using the FESCA-200 streak camera, the amount of light was insufficient compared to the noise level, making it difficult to measure the light with a sweep time lower than 50 ps. As a result, the measured bunch length was rather large—more than 400 fs—and limited by the resolution due to insufficient light quantity.
Under such circumstances, we have developed a measurement system with a modest time resolution of ~100 fs for ultra-short electron bunches using CR from a thin silica aerogel that is much brighter than OTR. The use of silica aerogels for CR has a long history and is widely used in particle detectors for nuclear and high-energy physics [13]. There have also been some attempts to apply it to beam diagnosis in particle accelerators. For example, the PITZ group reported a simulation result reaching a time resolution of about 0.02 ps [14]. The rest of this paper is organized as follows. Section 2 describes the measurement system for the bunch length. Section 3 presents the estimated time resolution for this system. Finally, the measurement results are presented and discussed in Section 4 and Section 5, respectively.
2. The Bunch Length Measurement System
Figure 1 shows a schematic of the transport of CR for bunch length measurement. The generated CR is transported to a streak camera located outside the shield through an optical path length of approximately 10 m. As given by Equation (1), the Cherenkov angle θc is inversely proportional to the particle velocity β and the refractive index n(ω).
For example, a typical optical glass has a refractive index of approximately 1.5, which corresponds to a Cherenkov angle of 48°. In the case of such a large divergence angle, it is extremely difficult in practice to extract CR from the vacuum chamber. Therefore, the refractive index of the radiator must be sufficiently low. Certain compressed gases can be considered candidates for low refractive index radiators; however, complicated instrumentations are needed to introduce them into the beam line where an ultra-high vacuum is usually required. Hence, a thin hydrophobic silica aerogel was selected as a radiator, with an ultra-low refractive index (n = 1.05), developed at Chiba University [15]. The hydrophobic silica aerogel has properties suitable for the Cherenkov radiator, i.e., it has a high transparency and ease of manufacture when it comes to small thin plates. In addition, the hydrophobic silica aerogel has a characteristic that its refractive index does not change between air and vacuum. In silica aerogels, reducing the refractive index corresponds to extremely low density and in turn reduces the mechanical strength. Moreover, the number of emitted photons is expected to be less than that when a high refractive index is employed. Based on a comprehensive consideration including previous results, a silica aerogel having a refractive index of 1.05 and a thickness of 1 mm was selected for the bunch length measurement. According to the Frank–Tamm formula [16,17], the expected number of photons for CR with this silica aerogel is 5.4 photons/electron, which is almost 3000 times larger than OTR for the same wavelength range from 400 to 850 nm, enabling us to restrict the bandwidth and thereby improve the performance of the streak camera.
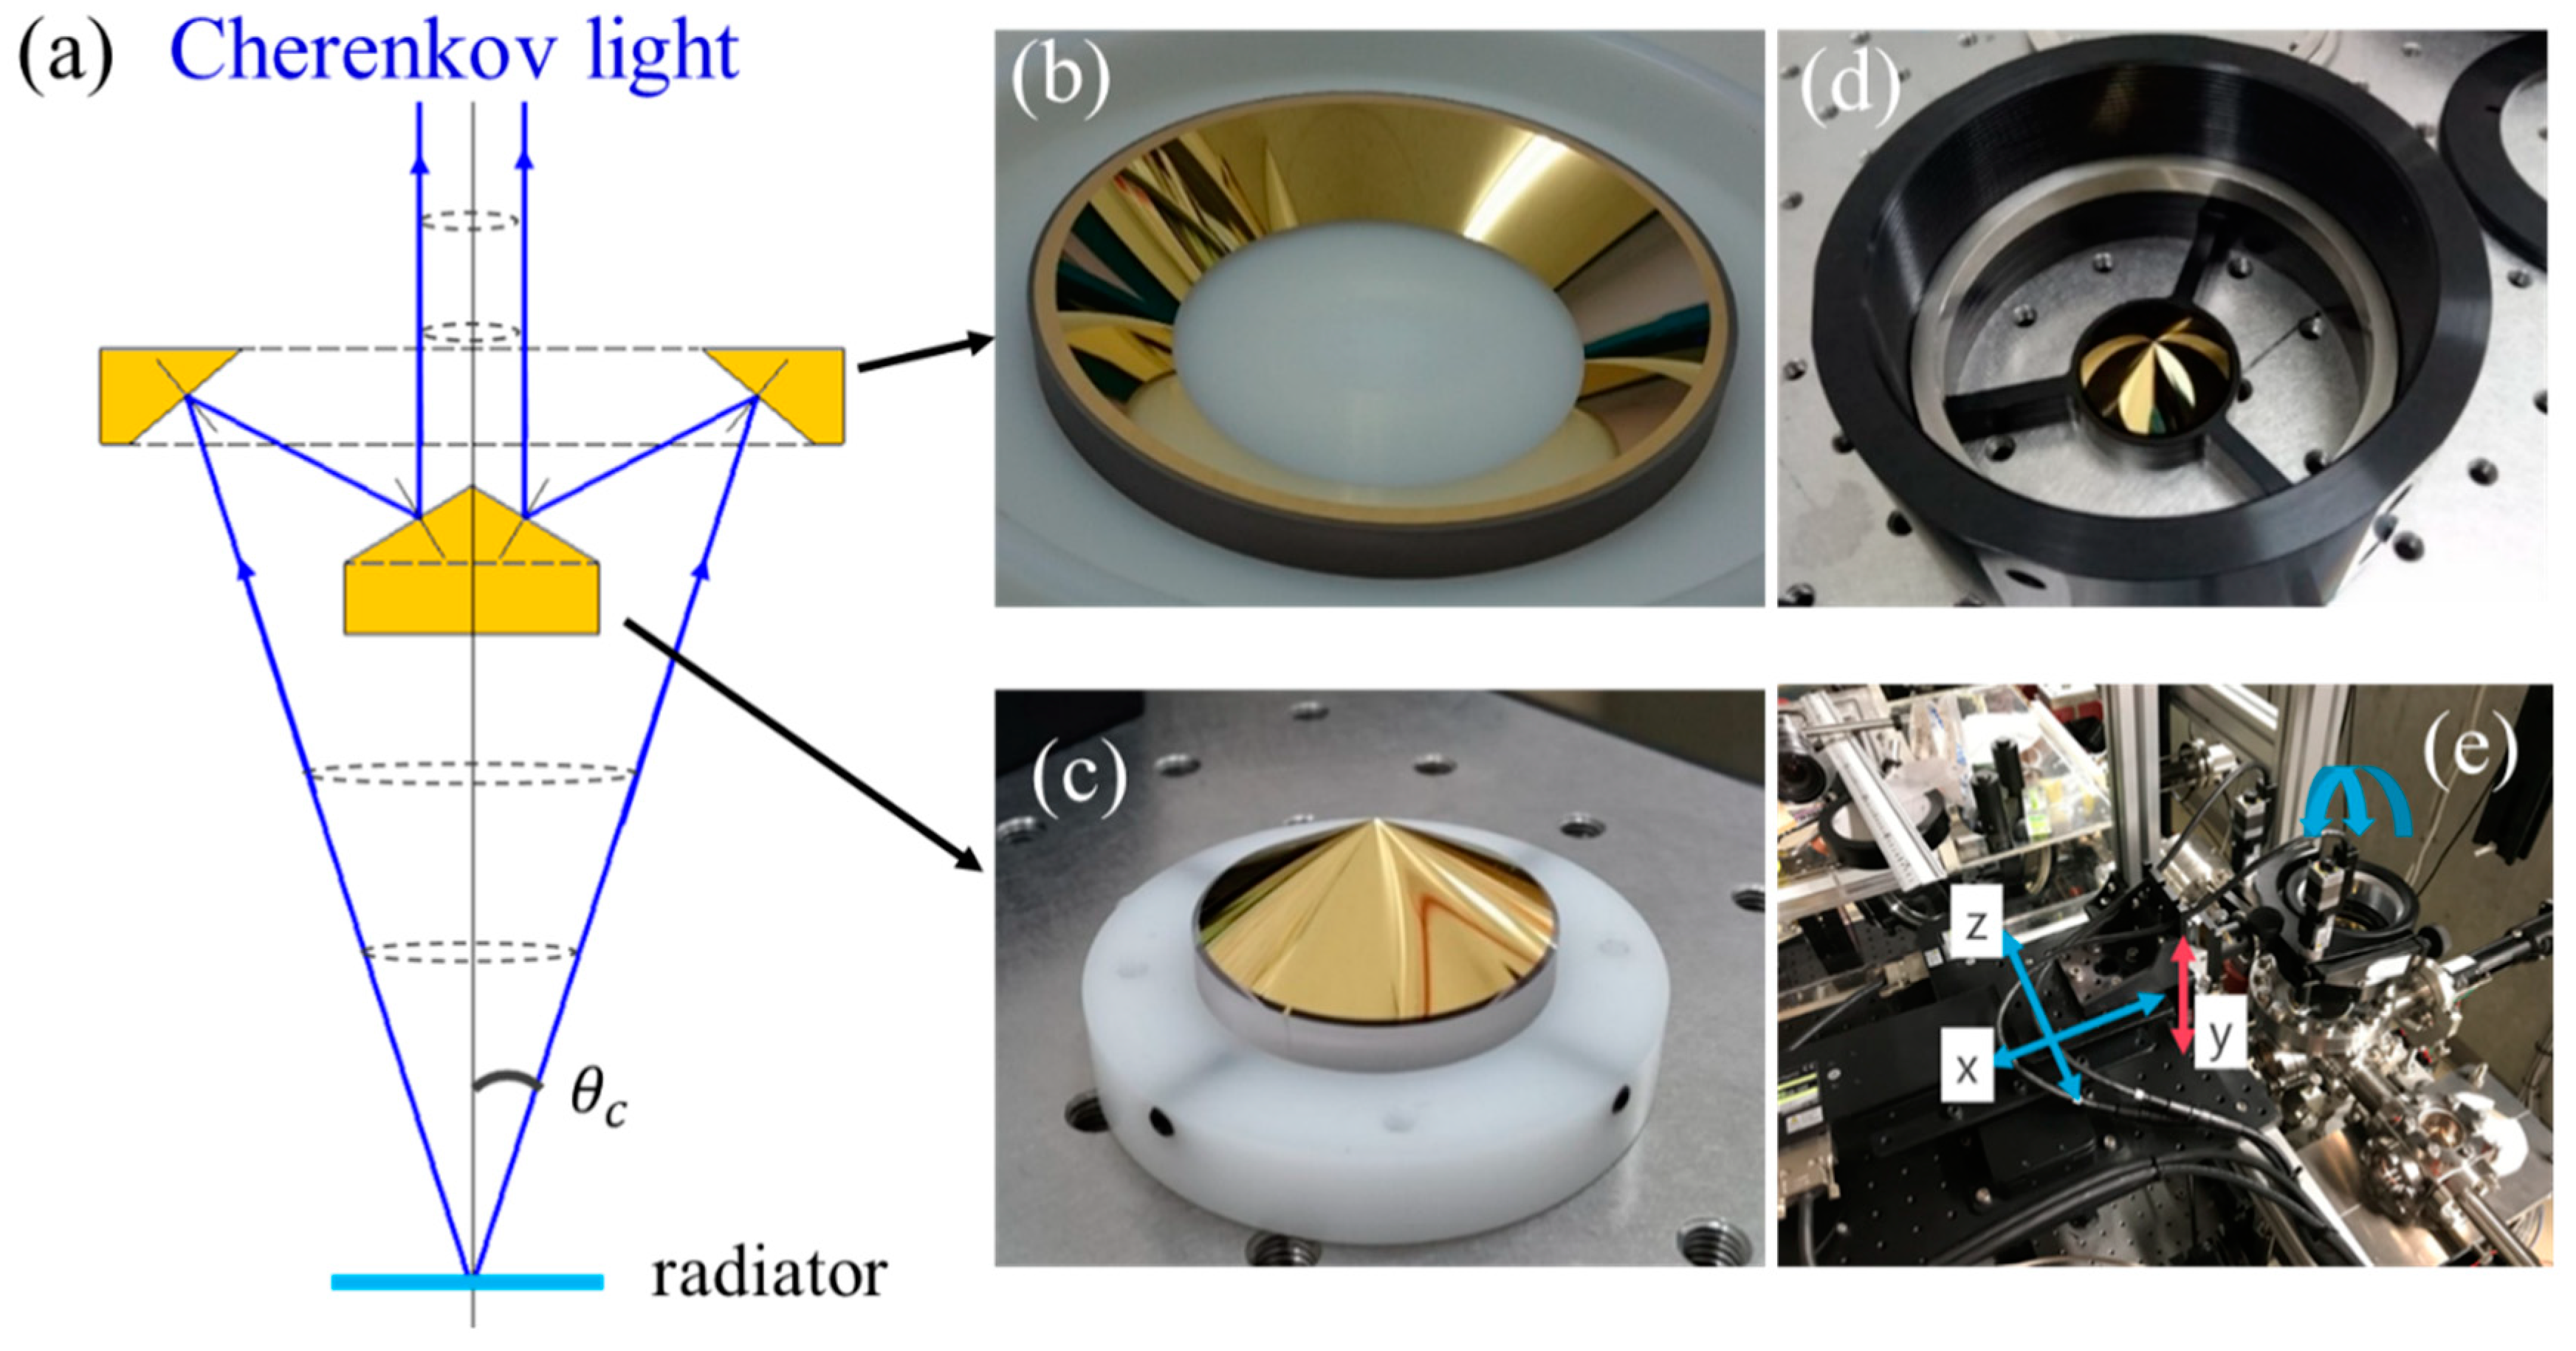
For a silica aerogel with a refractive index of 1.05, the corresponding Cherenkov angle is 18°. By choosing a very low refractive index, the opening angle could be reduced to a rather small value. However, this angle is still too large to transport light over a distance of approximately 10 m. Therefore, we developed a special optical system that converts a diverging light into a parallel ray by combining two mirrors, namely axicon and inverted-axicon mirrors (an AIA mirror system), as shown in Figure 2. The outer diameters of the axicon and inverted-axicon mirrors are 34.2 mm and 100 mm, respectively, and their reflection angles are 58.768° and 49.904°, respectively. The mirror surface is plated with gold, but no protective coating is applied.
The mirrors are mounted on a mirror holder, which ensures the precise positioning of the mirrors, as shown in Figure 2d, and the holder can be further adjusted using a linear actuator with a pulse motor in order to align the optical axis of the AIA mirror with the center axis of the emitted CR, as shown in Figure 2e. The measured light pulse duration usually depends on the path length inside the radiator medium when the light pulse is observed in a plane perpendicular to the direction of the movement of the electrons. However, we observe the light pulse from the thin silica aerogel exclusively along the Cherenkov angle, based on a far-field approximation where the wavefront of each wave emitted from different positions coincides. By limiting the bandwidth of the observed light, we can neglect the dispersion of the refractive index of the radiator. Thus, the bunch length measured along the Cherenkov axis was assumed to depend less on the radiator thickness. In the actual experiments, a correction lens was required to compensate for the opening angle due to the deviation in the refractive index of the radiator and the window for CR extraction. In addition to the characteristic that CR is much brighter than OTR, a sufficient quantity of light can be retained by employing the AIA mirror system, which can transport almost the entire CR to the streak camera. As a result, it is possible to introduce an optical filter to suppress the temporal spread due to the wavelength dispersion generated in air and in the optical elements. Table 1 lists the electron beam parameters for the measurements described in the following section.
3. Expected Time Resolution of the Measurement System
The measured temporal bunch profile includes the time spread generated in the measurement system, which includes the following three contributions.
Here, σstreak is due to the finite resolution of the streak camera, σCD is a chromatic dispersion in the optical transport line, and σOP is the time spread due to the optical path difference in the transport line including the effect of the finite transverse size of the electron beam. By subtracting σE in Equation (2) from the observed bunch length σobs, the actual bunch length can be obtained as follows.
The finite resolution of the streak camera, σstreak, is estimated as follows. The light incident on the streak camera generates photoelectrons, which are deflected by the time-varying transverse electric field. The electrons then enter a micro-channel plate (MCP). After the multiplication by the MCP, the electrons are converted to light again, and finally its image on the phosphor screen is observed using the CCD camera. Thus, the time information of the incident light is converted to spatial information in the streak camera. Now, there are two major components of the time spread generated in the streak camera. The first one is the time spread related to the slit width, which restricts the incident light, and the other one is due to the intrinsic resolution of the streak tube. The total time spread is given by the quadratic sum of these components and can roughly be estimated by measuring the streak image of the white light while changing the slit width without the deflecting field. Table 2 lists the estimated results of the time spread due to the streak camera. In the case of a minimum sweep time of 20 ps, the measured width of the streak image reaches 98 fs (rms) for a slit width of 20 µm.
Next, a 3D ray trace simulation was developed to estimate the time spread σOP due to the optical path difference in the transport line and the finite size of the electron bunch. In this simulation, the length of the electron bunch was set to zero and only the time spread in the optical transport line was evaluated. First, electrons were generated based on the measured values of the beam sizes and emittances, listed in Table 1. The electrons were then converted into photons, which were transported to the streak camera. The number of generated electrons was 10,000. Finally, the standard deviation was taken from the distribution of the total arrival time difference to obtain the time spread σOP. As the streak camera is arranged such that its observation axis is orthogonal to the wavefront of CR, the thickness of the radiator has no effect on the time spread. However, it can be increased by varying the beam size and/or beam emittance due to Coulomb scattering in the radiator medium. The Coulomb scattering angle when a medium with a refractive index of 1.05 is irradiated by an electron beam with beam energy of 30 MeV is only 3% compared to the angle of CR. Therefore, the influence of Coulomb scattering inside the radiator can be neglected. As a result, a time spread (σOP) of 182 fs was obtained from the simulation.
The third source of the time spread is due to chromatic dispersion. As the number of emitted photons is inversely proportional to the square of the wavelength, from this point of view, it is advantageous to detect light in the short-wavelength region. However, when measuring ultra-short electron bunches, it is necessary to consider the increase in the pulse width due to the chromatic dispersion in the measurement system, where CR passes through air and quartz (viewport). As the refractive index changes steeply in the shorter wavelength region, the time spread takes a higher value in this region, and to suppress the time spread, the wavelength should be restricted. Therefore, it is necessary to carefully estimate the number of detected photons when determining the target wavelength region. The refractive index of the medium depends on the wavelength. As such, the arrival time difference from the radiator to the streak camera varies with the wavelength. The transit time from the radiator to the streak camera, t(λ), is calculated using Equation (4) as follows.
where , dAir, (λ), and nAir(λ) are the thickness of the quartz (viewport), the pass length in air, and the refractive indices of quartz and air, respectively. The chromatic dispersion at each wavelength was evaluated from the frequency distribution of the transit time. The CR intensity at each wavelength was obtained using the Frank–Tamm formula. The transport efficiency of the measurement system was obtained based on the data sheet of each optical element. The total number of photons to be detected can be calculated by multiplying the generated photon number with the transport efficiency including the detection efficiency of the streak camera. Figure 3a shows the estimated number of photons per one microbunch of 4 pC to be detected by the streak camera as a function of the CR wavelength. The dip seen in the number of photons near 500 nm is due to the reflection characteristics of the mirror used in the transport line. Based on the estimated number of photons, the temporal spread of the CR pulse was evaluated for each optical filter, namely a 550 ± 25 nm bandpass filter (BPF) and a longpass filter (LPF) with cut-on wavelengths of 600, 700, and 800 nm, to be installed in the transmission line, as listed in Table 3. If a 550 nm BPF is employed to restrict the wavelength region, the expected time spread is 39 fs, as shown in Figure 3b, whereas the estimated number of photons to be detected is approximately 1 million. According to previous measurements based on the OTR, the estimated σCD and the number of photons were 240 fs and 6.6 × 10⁴, respectively. Thus, despite the fact that the number of photons can be increased to 15 times that of the previous OTR measurements, the time spread is expected to be significantly suppressed to one sixth of that.
4. Experiment and Results
A beam test was conducted at t-ACTS. Regarding beam tuning in the transverse plane, a screen monitor that can be inserted at the position of the Cherenkov radiator was used to minimize the beam size (see image in Figure 1). For the longitudinal direction, the CTR in the terahertz region from a movable metal foil inserted in the vicinity of the radiator was detected using a pyroelectric detector, and subsequently, beam tuning was performed to maximize the signal intensity. The CR emitted from the silica aerogel with a thickness of 1 mm was measured using the streak camera FESCA-200. Unfortunately, employing a sweep rate of 20 ps/frame was problematic. Therefore, the measurement was performed with a sweep rate of 50 ps/frame. The slit width in the vertical direction was varied in the range of 0.01–0.06 mm to check its dependence as mentioned before. The trigger inputted to the streak camera needs to be synchronized with an RF of 2856 MHz. Therefore, the trigger was generated using a prescaled RF signal. The jitter in the generated trigger was measured to be 7 ps (rms) using the oscilloscope Tektronix DSA8300 equipped with a sampling module 80E04. When the signal distribution was at the edge of the sweep region due to the jitter, the data were excluded from the analysis. Figure 4 shows an example of the image on the phosphor screen of the streak camera. Only the CR signal within a range of 400 pixels was projected onto the time axis, and the bunch length was evaluated by applying the Gaussian function to the histogram. For the 30 shot samples thus obtained, the average of the widths of the Gaussian distributions was defined as the bunch length, and the standard deviation thereof was defined as its error.
As listed in Table 2, when a higher time resolution is required for the measurement, it is necessary to narrow the width of the vertical slit. Figure 5 shows the effect of the slit width on the measured bunch length. A 700 nm LPF was used for the measurement. As mentioned above, the actual bunch length was obtained by subtracting the time spread due to the contributions, given in Equation (2), from the observed time spread. The data of the various slit widths were averaged, and the bunch length was finally obtained as 238 ± 68 fs.
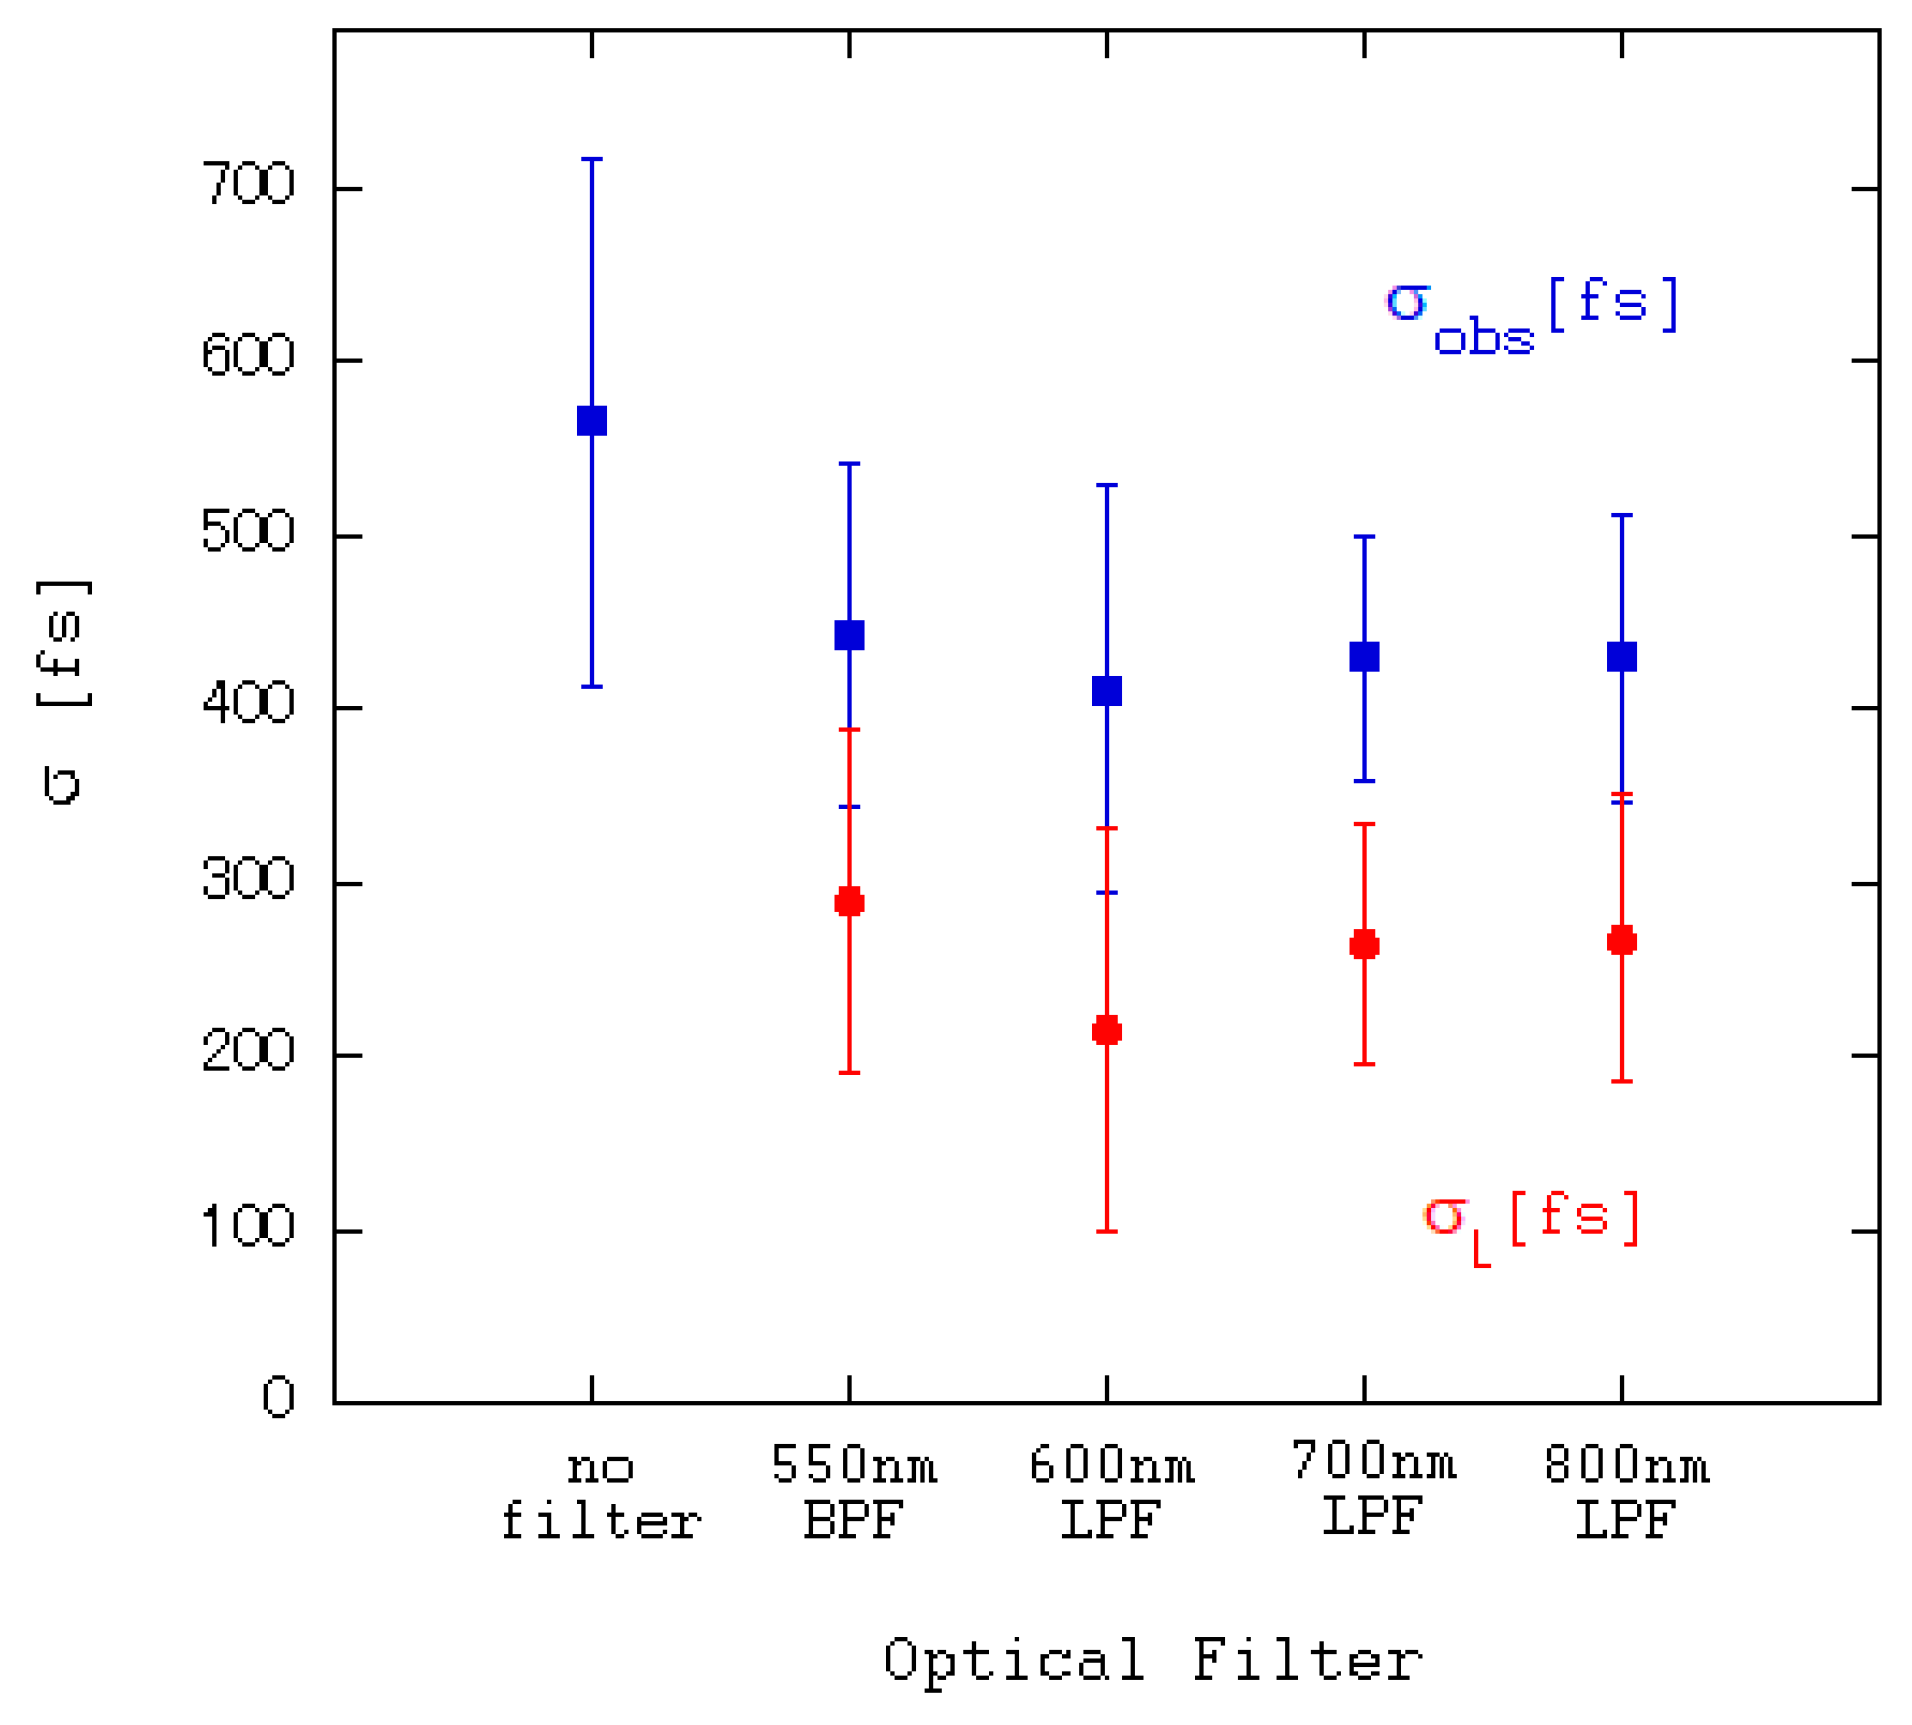
In general, the limitation of the wavelength of the radiation restricts its energy because of the uncertainty principle, so the time spread cannot be lower than a certain value (“transform-limited pulse”). Hence, the time spread, when the wavelength dispersion is limited by the BPF, is given by the sum of two contributions: due to the uncertainty principle and the chromatic dispersion in the transport line. However, in our current situation, the contribution of chromatic dispersion is dominant at wavelengths lower than ~800 nm. Therefore, it is still useful to suppress it using the BPF. We confirmed whether the influence of wavelength dispersion can be reduced using an optical filter as expected. Figure 6 shows the results of the measured bunch length for optical filters, namely 550 ± 25 nm BPF and 600, 700, and 800 nm LPF, where the peak value of the optical pulse is adjusted using an ND filter so that the light amount in the measurement using each filter is largely the same. In any case, similar bunch lengths were obtained, with an average value of 255 ± 104 fs.
According to the results of the tracking simulation with GPT, the minimum bunch length should be approximately 80 fs. Furthermore, as a very short bunch length (of approximately 100 fs) was suggested in the previous measurement based on the CSR spectrum obtained by the interferometer, the measured values of 238 and 255 fs seem to be considerably greater than our expectation. A possible reason of this discrepancy is discussed in the next section.
5. Discussion
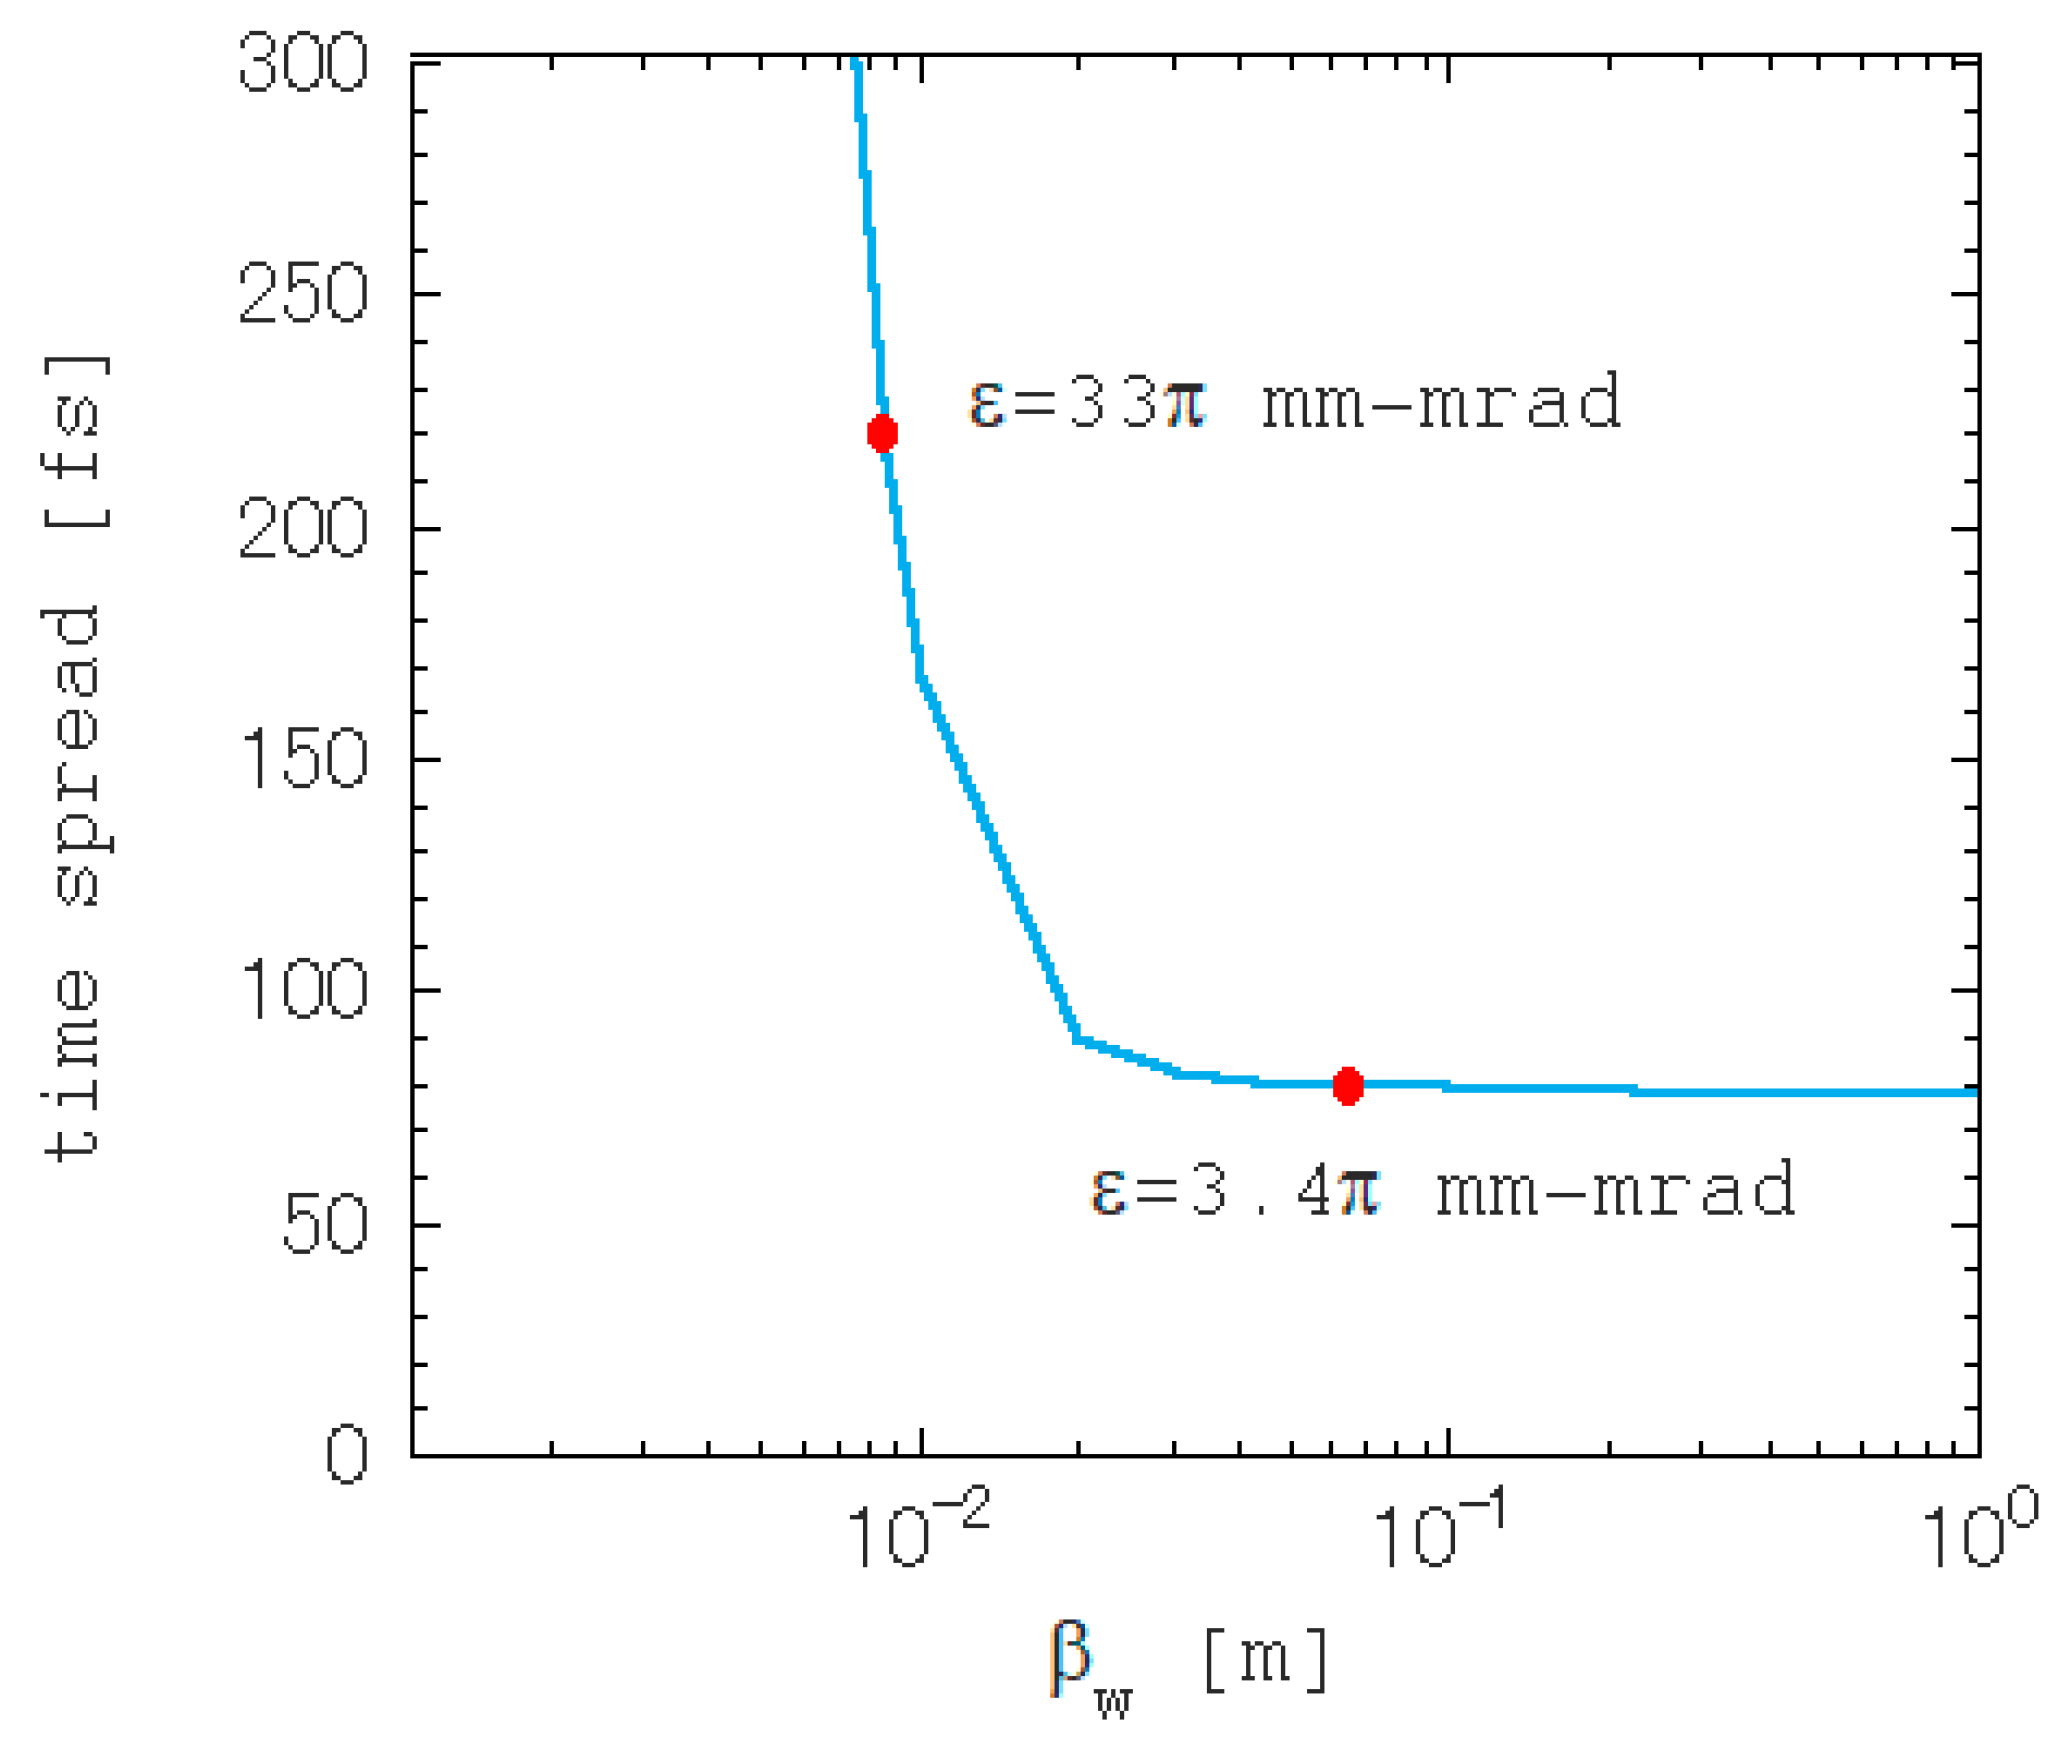
To investigate the reason currently limiting the resolution, the effect of beam focusing on the measured bunch length was obtained using the 3D ray trace calculation. In this analysis, the beam size was fixed to 70 µm at the radiator position. Moreover, the emittances in the horizontal and vertical planes were assumed the same. Thus, if the beam has a larger emittance, it corresponds to a lower beta function, implying that the beam has a greater angular divergence. Figure 7 shows the expected variation in the time spread for the beta function at the radiator position.
The higher angular divergence was found to cause a greater time spread in the temporal profile of the measured CR. Therefore, it is important to realize a lower emittance, or at least, the beam must be focused appropriately. If the vertical emittance is reduced to the same level as that of the horizontal one, a time spread of approximately 80 fs can be expected. The electron bunches are usually accelerated by the accelerating structure at nearly the crest phase for an efficient acceleration. However, in the velocity bunching scheme, the electron bunches enter the accelerating structure at the so-called RF-zero cross phase and experience a nonlinear transverse electric field at the entrance of the accelerating structure, thereby increasing the emittance. Because of the technicality in the fabrication of the coupling cell of the accelerating structure, it is inferred that the symmetry is broken between the horizontal and vertical directions, leading to a significant difference in the emittances. Although the velocity bunching scheme in the accelerating structure is a simple and easy method to obtain a short electron bunch, it is inevitable that the emittance increases somewhat. However, for other methods of short-bunch generation, such as a chicane bunch compressor, this system using CR measurement readily provides significantly improved resolution compared to OTR for the temporal profile measurement of ultra-short electron bunches.
6. Conclusions
We developed a real-time bunch length measurement system using CR for ultra-short electron bunches with a streak camera. To utilize the CR for bunch length measurement, we employed a hydrophobic silica aerogel and developed an AIA mirror system. CR is much brighter than optical transition radiation, by approximately 3 orders in our case, thus enabling the use of the streak camera, FESCA-200, with a fast sweep rate of 20 ps, even with a small bunch charge of about 4 pC. Furthermore, filters can be employed to restrict to the narrow bandwidth, thus significantly suppressing the time spread due to chromatic dispersion. Employing the AIA mirror system to transport the whole Cherenkov ring to the streak camera, we measured a bunch length of approximately 250 fs and demonstrated an improvement to the temporal resolution by a factor of approximately two, comparing with the OTR measurement. Although the result of the test measurement with a sweep time of 50 ps was three times greater than the naive simulation result obtained using the GPT code, the expected time resolution can be further improved to approximately 130 fs by reducing the vertical emittance to the same level as that of the horizontal one. Bunch length measurements in the time domain using silica aerogel have been proposed previously; however, most of these measurements were performed with the bunch length in the picosecond range. Therefore, the technique presented here can serve as a basis for improved measurements of ultra-short electron bunches using CR.
Author Contributions
Conceptualization, methodology, and project administration: K.-i.N. and H.H.; simulation software and data analysis: Y.S.; validation: S.K. and T.M.; beam test: Y.S, K.-i.N., S.K., H.S., and F.H.; writing—original draft preparation: Y.S.; writing—review and editing: K.-i.N. and F.H.; supervision: H.H.; funding acquisition: K.-i.N. and H.H.
Funding
This work was supported by JSPS KAKENHI Grant Numbers JP15K13394 and JP15K17486.
Acknowledgments
We greatly appreciate Makoto Tabata of Chiba University for providing the thin hydrophobic silica aerogel as the Cherenkov radiator.
Conflicts of Interest
The authors declare no conflict of interest.
References
- Hama, H.; Kawai, M.; Kashiwagi, S.; Hinode, F.; Miyahara, F.; Nanbu, K.; Muto, T.; Tanaka, Y.; Li, X.; Huang, N.Y. Test-accelerators as coherent terahertz source program (t-ACTS) at Tohoku University. Energy Procedia 2011, 9, 391–397. [Google Scholar] [CrossRef]
- Serafini, L.; Ferrario, M. Velocity bunching in photo-injectors. AIP Conf. Proc. 2001, 581, 87–106. [Google Scholar] [Green Version]
- Kashiwagi, S.; Nagasawa, S.; Hinode, F.; Muto, T.; Saito, H.; Abe, T.; Nanbu, K.; Nagasawa, I.; Takahashi, K.; Tokoku, C.; et al. Proof-of-principle experiment of velocity bunching for ultra-short electron pulse production. Energy Procedia 2016, 89, 346–352. [Google Scholar] [CrossRef]
- Ishi, K.; Shibata, Y.; Takahashi, T.; Mishiro, H.; Ohsaka, T.; Ikezawa, M.; Kondo, Y.; Nakazato, T.; Urasawa, S.; Niimura, N.; et al. Spectrum of coherent synchrotron radiation in the far-infrared region. Phys. Rev. A 1991, 43, 5597–5604. [Google Scholar] [CrossRef] [PubMed]
- Shibata, Y.; Takahashi, T.; Kanai, T.; Ishi, K.; Ikezawa, M.; Ohkuma, J.; Okuda, S.; Okada, T. Diagnostics of an electron beam of a linear accelerator using coherent transition radiation. Phys. Rev. E 1994, 50, 1479–1484. [Google Scholar] [CrossRef]
- Tikhoplav, R.; Knyazik, A.; Rosenzweig, J.B.; Ruelas, M. Electron beam diagnostics using coherent Cherenkov radiation in aerogel. AIP Conf. Proc. 2009, 1086, 610–615. [Google Scholar]
- Shibata, Y.; Hasebe, S.; Ishi, K.; Takahashi, T.; Ohsaka, T.; Ikezawa, M.; Nakazato, T.; Oyamada, M.; Urasawa, S.; Yamakawa, T.; et al. Observation of coherent diffraction radiation from bunched electrons passing through a circular aperture in the millimeter- and submillimeter-wavelength regions. Phys. Rev. E 1995, 52, 6787–6794. [Google Scholar] [CrossRef]
- Andrews, H.L.; Taheri, F.B.; Barros, J.; Bartolini, R.; Bharadwaj, V.; Clarke, C.; Delerue, N.; Doucas, G.; Fuster-Martinez, N.; Vieille-Grosjean, M.; et al. Reconstruction of the time profile of 20.35 GeV, subpicosecond long electron bunches by means of coherent Smith-Purcell radiation. Phys. Rev. Spec. Top. Accel. Beams 2014, 17, 052802. [Google Scholar] [CrossRef] [Green Version]
- Berden, G.; Gillespie, W.A.; Jamison, S.P.; Knabbe, E.-A.; MacLeod, A.M.; van der Meer, A.F.G.; Phillips, P.J.; Schlarb, H.; Schmidt, B.; Schmüser, P.; et al. Benchmarking of electro-optic monitors for femtosecond electron bunches. Phys. Rev. Lett. 2007, 99, 164801. [Google Scholar] [CrossRef] [PubMed]
- Röhrs, M.; Gerth, C.; Huening, M.; Schlarb, H. Energy-time correlation measurements using a vertically deflecting rf structure. In Proceedings of the EPAC, Edinburgh, UK, 26–30 June 2006; pp. 80–82. [Google Scholar]
- Schietinger, T.; Pedrozzi, M.; Aiba, M.; Arsov, V.; Bettoni, S.; Beutner, B.; Calvi, M.; Craievich, P.; Dehler, M.; Frei, F.; et al. Commissioning experience and beam physics measurements at the SwissFEL Injector Test Facility. Phys. Rev. Accel. Beams 2016, 19, 100702. [Google Scholar] [CrossRef]
- FESCA-100 Femtosecond streak camera. Available online: https://www.hamamatsu.com/jp/en/product /type/C11853-01/index.html (accessed on 10 Dec. 2018).
- Danilyuk, A.F.; Kononov, S.A.; Kravchenko, E.A.; Onuchin, A.P. Aerogel Cherenkov detectors in colliding beam experiments. Physics-Uspekhi 2015, 58, 503–511. [Google Scholar] [CrossRef]
- Bahr, J.; Djordjadze, V.; Lipka, D.; Onuchin, A.; Stephan, F. Silica aerogel radiators for bunch length measurements. Nucl. Instrum. Methods A 2005, 538, 597–607. [Google Scholar] [CrossRef] [Green Version]
- Tabata, M.; Adachi, I.; Kawai, H.; Sumiyoshi, T.; Yokogawa, H. Hydrophobic silica aerogel production at KEK. Nucl. Instrum. Methods A 2012, 668, 64–70. [Google Scholar] [CrossRef] [Green Version]
- Tamm, I.E.; Frank, I.M. Coherent radiation of fast electrons in a medium. Dokl. Akad. Nauk SSSR 1937, 14, 107–112. [Google Scholar]
- Frank, I.M. Vavilov-Cherenkov radiation for electric and magnetic multipoles. Physics-Uspekhi 1984, 27, 772–785. [Google Scholar] [CrossRef]
Figure 1.
Schematic of the transportation of Cherenkov radiation (CR).

Figure 2.
(a) Schematic of the AIA mirror system designed to convert the diverging CR into a parallel ray. (b,c) Images of the inverted-axicon and axicon mirrors. (d) Image of the mirror holder for precise alignment between the two mirrors. (e) Image of the installed AIA mirror system. Its position and angles can be adjusted via linear actuators with pulse motors.

Figure 3.
Expected number of photons to be detected by the streak camera: (a) without optical filter; (b) with 550 ± 25 nm BPF. The estimated time spread due to chromatic dispersion is also shown in (b).
Figure 3.
Expected number of photons to be detected by the streak camera: (a) without optical filter; (b) with 550 ± 25 nm BPF. The estimated time spread due to chromatic dispersion is also shown in (b).

Figure 4.
Streak image of the CR on the phosphor screen. The width of the temporal direction is derived by Gaussian fitting to the projected profile within a region of interest (ROI) of 400 pixels.
Figure 4.
Streak image of the CR on the phosphor screen. The width of the temporal direction is derived by Gaussian fitting to the projected profile within a region of interest (ROI) of 400 pixels.

Figure 5.
Result of the measured bunch length for 700 nm LPF as a function of the slit width. The square plots indicate the observed raw time spread, and the circles indicate the final bunch length.
Figure 5.
Result of the measured bunch length for 700 nm LPF as a function of the slit width. The square plots indicate the observed raw time spread, and the circles indicate the final bunch length.

Figure 6.
Measured bunch length for some optical filters.

Figure 7.
Expected time spread as a function of the beta function, where the same emittance is assumed in the horizontal and vertical planes. The plots show the corresponding emittances for the beta functions.
Figure 7.
Expected time spread as a function of the beta function, where the same emittance is assumed in the horizontal and vertical planes. The plots show the corresponding emittances for the beta functions.


Table 1.
Electron beam parameters.
| Macropulse duration | ~2.0 μs |
| Number of bunches | ~ 5700 bunches/macropulse |
| Natural emittance | 3.4/33π mm-mrad (hor./ver.) |
| Beam energy | 22 ~ 30 MeV |
| Bunch charge | ~ 4 pC |
| Beam size @radiator position | 70/77 µm (hor./ver.) |
Table 2.
Estimated time spread due to the streak camera.
| Measurement Range | Sweep Rate [ps/frame] | Temporal Resolution [fs/channel] | Injection Slit Width [μm] | σstreak [fs] |
|---|---|---|---|---|
| 50 ps | 53.99 | 52.7 | 0 | 248 |
| 20 | 267 | |||
| 40 | 317 | |||
| 20 ps | 19.9 | 19.5 | 0 | 91 |
| 20 | 98 | |||
| 40 | 117 |
Table 3.
Estimated results of chromatic dispersion and number of photons.
| Measuring Condition | Number of Photons [photons/microbunch (4 pC)] | σCD [fs] |
|---|---|---|
| 550 nm BPF | 96.7 × 10⁴ | 39 |
| 600 nm LPF | 139.2 × 10⁴ | 91 |
| 700 nm LPF | 38.7 × 10⁴ | 51 |
| 800 nm LPF | 6.6 × 10⁴ | 28 |
© 2018 by the authors. Licensee MDPI, Basel, Switzerland. This article is an open access article distributed under the terms and conditions of the Creative Commons Attribution (CC BY) license (http://creativecommons.org/licenses/by/4.0/).
Share and Cite
MDPI and ACS Style
Nanbu, K.-i.; Saito, Y.; Saito, H.; Kashiwagi, S.; Hinode, F.; Muto, T.; Hama, H. Bunch Length Measurement Employing Cherenkov Radiation from a Thin Silica Aerogel. Particles 2018, 1, 305-314. https://doi.org/10.3390/particles1010025
AMA Style
Nanbu K-i, Saito Y, Saito H, Kashiwagi S, Hinode F, Muto T, Hama H. Bunch Length Measurement Employing Cherenkov Radiation from a Thin Silica Aerogel. Particles. 2018; 1(1):305-314. https://doi.org/10.3390/particles1010025
Chicago/Turabian StyleNanbu, Ken-ichi, Yuki Saito, Hirotoshi Saito, Shigeru Kashiwagi, Fujio Hinode, Toshiya Muto, and Hiroyuki Hama. 2018. "Bunch Length Measurement Employing Cherenkov Radiation from a Thin Silica Aerogel" Particles 1, no. 1: 305-314. https://doi.org/10.3390/particles1010025