Article

Effective Surface Structure Changes and Characteristics of Activated Carbon with the Simple Introduction of Oxygen Functional Groups by Using Radiation Energy

1
Division of Energy Engineering, Daejin University, Pocheon 11159, Republic of Korea
2
Hydrogen &C1 Gas Research Center, Korea Research Institute of Chemical Technology (KRICT), Daejeon 34114, Republic of Korea
*
Authors to whom correspondence should be addressed.
Surfaces 2024, 7(1), 12-25; https://doi.org/10.3390/surfaces7010002
Submission received: 16 October 2023 / Revised: 19 December 2023 / Accepted: 21 December 2023 / Published: 22 December 2023

Abstract

:
In recent years, research has aimed to enhance the environmental friendliness of activated carbon by modifying its surface properties to effectively capture specific harmful gases. This study’s primary goal is to swiftly introduce oxygen functional groups to activated carbon surfaces using microwave and plasma techniques and evaluate their characteristics. In the microwave method, we varied nitric acid concentrations and treatment durations for surface modification. Additionally, plasma treatment was used to introduce oxygen functional groups for comparative purposes. Surface characteristics were assessed through SEM, BET, XPS, and FT-IR analyses. The results indicate that in the microwave method, the quantity of oxygen functional groups increased with longer reaction times. Specifically, the sample treated for 20 min with 8 moles of nitric acid displayed an oxygen content of 14.11 at%, and higher nitric acid concentrations led to a reduced specific surface area. In the case of plasma treatment, higher oxygen flow rates resulted in an O1s content of 17.1 at%, and an increase in oxygen flow rate introduced more oxygen functional groups but decreased the specific surface area.

1. Introduction

Volatile Organic Compounds (VOCs) are recognized as a significant contributor to environmental pollution, emanating from diverse industrial processes [1]. Possessing intrinsic harmful properties, VOCs, when present in the atmosphere alongside nitrogen compounds, can catalyze photochemical reactions, leading to secondary pollution such as ozone formation [2,3]. Various methodologies have been used for VOC removal, encompassing thermal combustion, catalysis, adsorption, recovery, absorption, and biological filtration [4]. Among these, adsorption stands out as a highly efficient technique due to its simplicity and low energy consumption. Activated carbon is widely utilized in industries for adsorbing detrimental gases such as VOCs, leveraging its porous carbonaceous structure with a substantial internal surface area and numerous micropores, making it suitable for applications in air purification and solvent recovery.
One prominent application of activated carbons is in air purification systems. The exceptional adsorption capabilities of activated carbons enable them to effectively capture and remove airborne pollutants, odors, and harmful gases. This makes them an essential component in air filtration technologies, contributing to improved indoor air quality [5]. Activated carbons are also extensively used in solvent recovery processes. Their ability to adsorb and recover solvents from gaseous or liquid mixtures makes them integral to industries where solvent recycling is crucial for cost-effectiveness and environmental sustainability [6]. Moreover, activated carbons play a pivotal role in water treatment applications. Their porous structure allows for the effective removal of impurities, organic contaminants, and even certain heavy metals from water sources. This makes them valuable in ensuring access to clean and potable water [7]. Beyond environmental applications, activated carbons are utilized in various medical and pharmaceutical processes. Their adsorption properties make them valuable in the purification of pharmaceutical products, the removal of toxins from bodily fluids, and even in certain medical treatments [8]. In the realm of energy storage, activated carbons serve as key components in supercapacitors and batteries. Their high surface area provides ample space for the adsorption and storage of ions, contributing to enhanced energy storage capacities [9].
Recent studies have focused on enhancing the adsorption capacity of activated carbon by introducing functional groups onto its surface through various modification processes [10,11]. Oxygen functional groups enable the modulation of the surface properties of activated carbon, allowing for selective adsorption of substances. The introduction of oxygen functionality enhances the chemical interactions between substances. Consequently, research exploring the effective introduction of oxygen functional groups on activated carbon surfaces has gained attention, aiming to improve air purification and VOC removal technologies. Within this realm of research, various methods for introducing oxygen functional groups on the surface of activated carbon are being explored. There is a growing focus on methods that effectively impart fine surface adjustments and introduce diverse oxygen-active functionalities. Oxygen-containing functional groups, including carboxyl, lactone, phenol, carbonyl, pyrone, chromene, quinone, and ether groups, are known to augment the gas adsorption capacity of activated carbon [12]. The effectiveness of surface-modified activated carbon in adsorbing VOCs and similar harmful gases primarily depends on factors such as pore size, pore volume, and the characteristics of the introduced surface functional groups. Surface modification of activated carbon for improved VOC adsorption is categorized into wet and dry methods [13]. Wet methods involve chemical treatments with solutions like H3PO4, ZnCl2, NaOH, and KOH [14,15], while dry methods encompass gas-phase treatments under oxidative or inert atmospheres, such as gas-phase oxidation, electroplating [16], fluorination [17], and plasma treatments [18,19]. However, wet methods often entail prolonged reaction times and pose secondary environmental concerns during post-treatment washing processes, limiting their applicability in continuous processes [20]. In addressing these limitations, this study uses microwave-assisted surface modification, utilizing microwave energy to induce rapid dipole rotation and ionic conduction [21,22]. This approach enables the efficient introduction of surface functional groups to both the surface and interior of the sample, reaching elevated temperatures within seconds. Dry methods, particularly plasma surface modification, are extensively utilized for introducing functional groups onto activated carbon surfaces. Plasma treatment is a straightforward process that creates active sites on the material’s surface, offering the ability to introduce various functional groups rapidly, depending on the type and quantity of gas introduced [23]. Notably, the use of oxygen gas results in oxygen functional groups (C-OX) forming on the surface, while nitrogen gas introduces nitrogen-based functional groups (C-NX and N-C-O) [24,25,26]. Plasma is recognized as a powerful tool for introducing functional groups by generating various compounds in a high-energy gas state and introducing them onto surfaces. Surface treatment using plasma introduces atoms and radicals such as oxygen and nitrogen onto the surface of activated carbon, forming new compounds and enhancing the functionality of activated carbon [27]. This treatment induces the coupling of polymers, creating a finely porous structure on the surface, allowing for the increased adsorption of various compounds [28]. Microwaves are also a useful means of improving the surface of materials. Microwave energy effectively penetrates the interior of substances, inducing high power and efficient thermochemical reactions [29]. Through this process, proteins, cells, organic substances, etc., on the surface of activated carbon can be removed, or atoms such as oxygen and nitrogen can be introduced to enhance the surface characteristics of activated carbon [30]. Additionally, microwaves provide selective specificity for various substances, making them effective for the introduction of specific compounds.
The primary objective of this research is to efficiently introduce oxygen functional groups to activated carbon surfaces using microwave and plasma radiation methods and analyze the resulting characteristics. For the microwave method, variations in nitric acid concentration and treatment duration were used, while plasma treatment with oxygen gas was performed for comparison. These methods facilitated the introduction of oxygen functional groups to the activated carbon surface, and subsequent changes in surface properties, specific surface area, surface pore morphology, and adsorption characteristics under various conditions were analyzed and discussed. The introduction of surface functional groups using plasma and microwave radiation offers high precision and efficiency compared to conventional methods. This research explores the applicability of these techniques in the environmental protection and gas adsorption fields. Through such studies, we anticipate a contribution to the development of highly efficient functionalized activated carbon and its industrial applications in the future.

2. Materials and Methods

In this experimental study, palm-based granular activated carbon (Handok Carbon Co., Ltd., Hwaseong-si, Republic of Korea) of 12 × 40 mesh (0.42 to 1.70 mm) size, containing 1400 mg of iodine, was used. For the surface treatment of activated carbon using the microwave method, nitric acid (Samchun Chemicals, 60.0%) was utilized, while ultra-high purity oxygen gas (purity: 99.999%) was used for the surface treatment using the plasma method.
To introduce surface functional groups on the activated carbon, a vacuum plasma apparatus (FEMTO SCIENCE, Model: Covance, Hwaseong-si, Republic of Korea) was used. Two grams of activated carbon were evenly spread in a Petri dish and introduced into the plasma equipment. Initially, it underwent a 10 min treatment under an oxygen atmosphere, followed by shaking to ensure even Plasma treatment. Subsequently, another 10 min surface modification was performed, with variations in flow rates set at 50, 100, 150, and 200 cc/min. The output settings of the plasma equipment were kept constant at 150 W and 50 KHz.
A microwave reactor was used for the introduction of functional groups on the activated carbon surface. One hundred milliliters of nitric acid and 2 g of activated carbon were placed in a specially designed bottle, and a reflux device was connected. Microwave energy at 1000 W was applied for 10 and 20 min at concentrations of 1, 2, 4, and 8 M. After reflux, the surface-modified activated carbon underwent filtration using a vacuum pump, with washing continuing until its pH reached 7. Subsequently, the surface-modified activated carbon was dried for over 2 h in a vacuum oven at 80 °C.
The surface state and microstructure changes of the surface-modified activated carbon were observed using a scanning electron microscope (SEM, SU3900, Hitachi Co., Tokyo, Japan). Surface characteristics, including specific surface area, pore volume, and pore size, were compared using the Brunauer, Emmett, and Teller (BET, Micromeritics Instrument Co., ASAP-2020, Norcross, GA, USA) method. The adsorption data of samples were obtained in a relative pressure, P/Po, range of 10–5 to 1. The surface area of micropores was determined using the t-plot method. The t-plot method uses the carbon black STSA equation to calculate the external surface area including medium and large pores from the slope in each range. Then, it calculates the surface area of micropores by subtracting the external specific surface area from the BET-specific surface area. The micropore volume was calculated using the intercept of the t-plot line. The total pore volume (Vt) and the pore size distribution (PSD) were calculated using the nonlocal density functional theory (NLDFT). The average pore width was derived by assuming a cylindrical morphology of pores based on the BET surface area and pore volume, wherein d = 4Vt/SBET.
Fourier Transform Infrared Spectroscopy (FT-IR, solariX XR™ system, Bruker Daltonics, Billerica, MA, USA) was used to examine the chemical composition, distribution, density of specific elements, and the presence of hydrophilic oxygen functional groups on the surface of the powder-activated carbon. For a more detailed analysis of chemical groups, X-ray photoelectron spectroscopy (XPS, NEXSA, ThermoFisher Scientific, Waltham, MA, USA) was utilized.

3. Results and Discussion

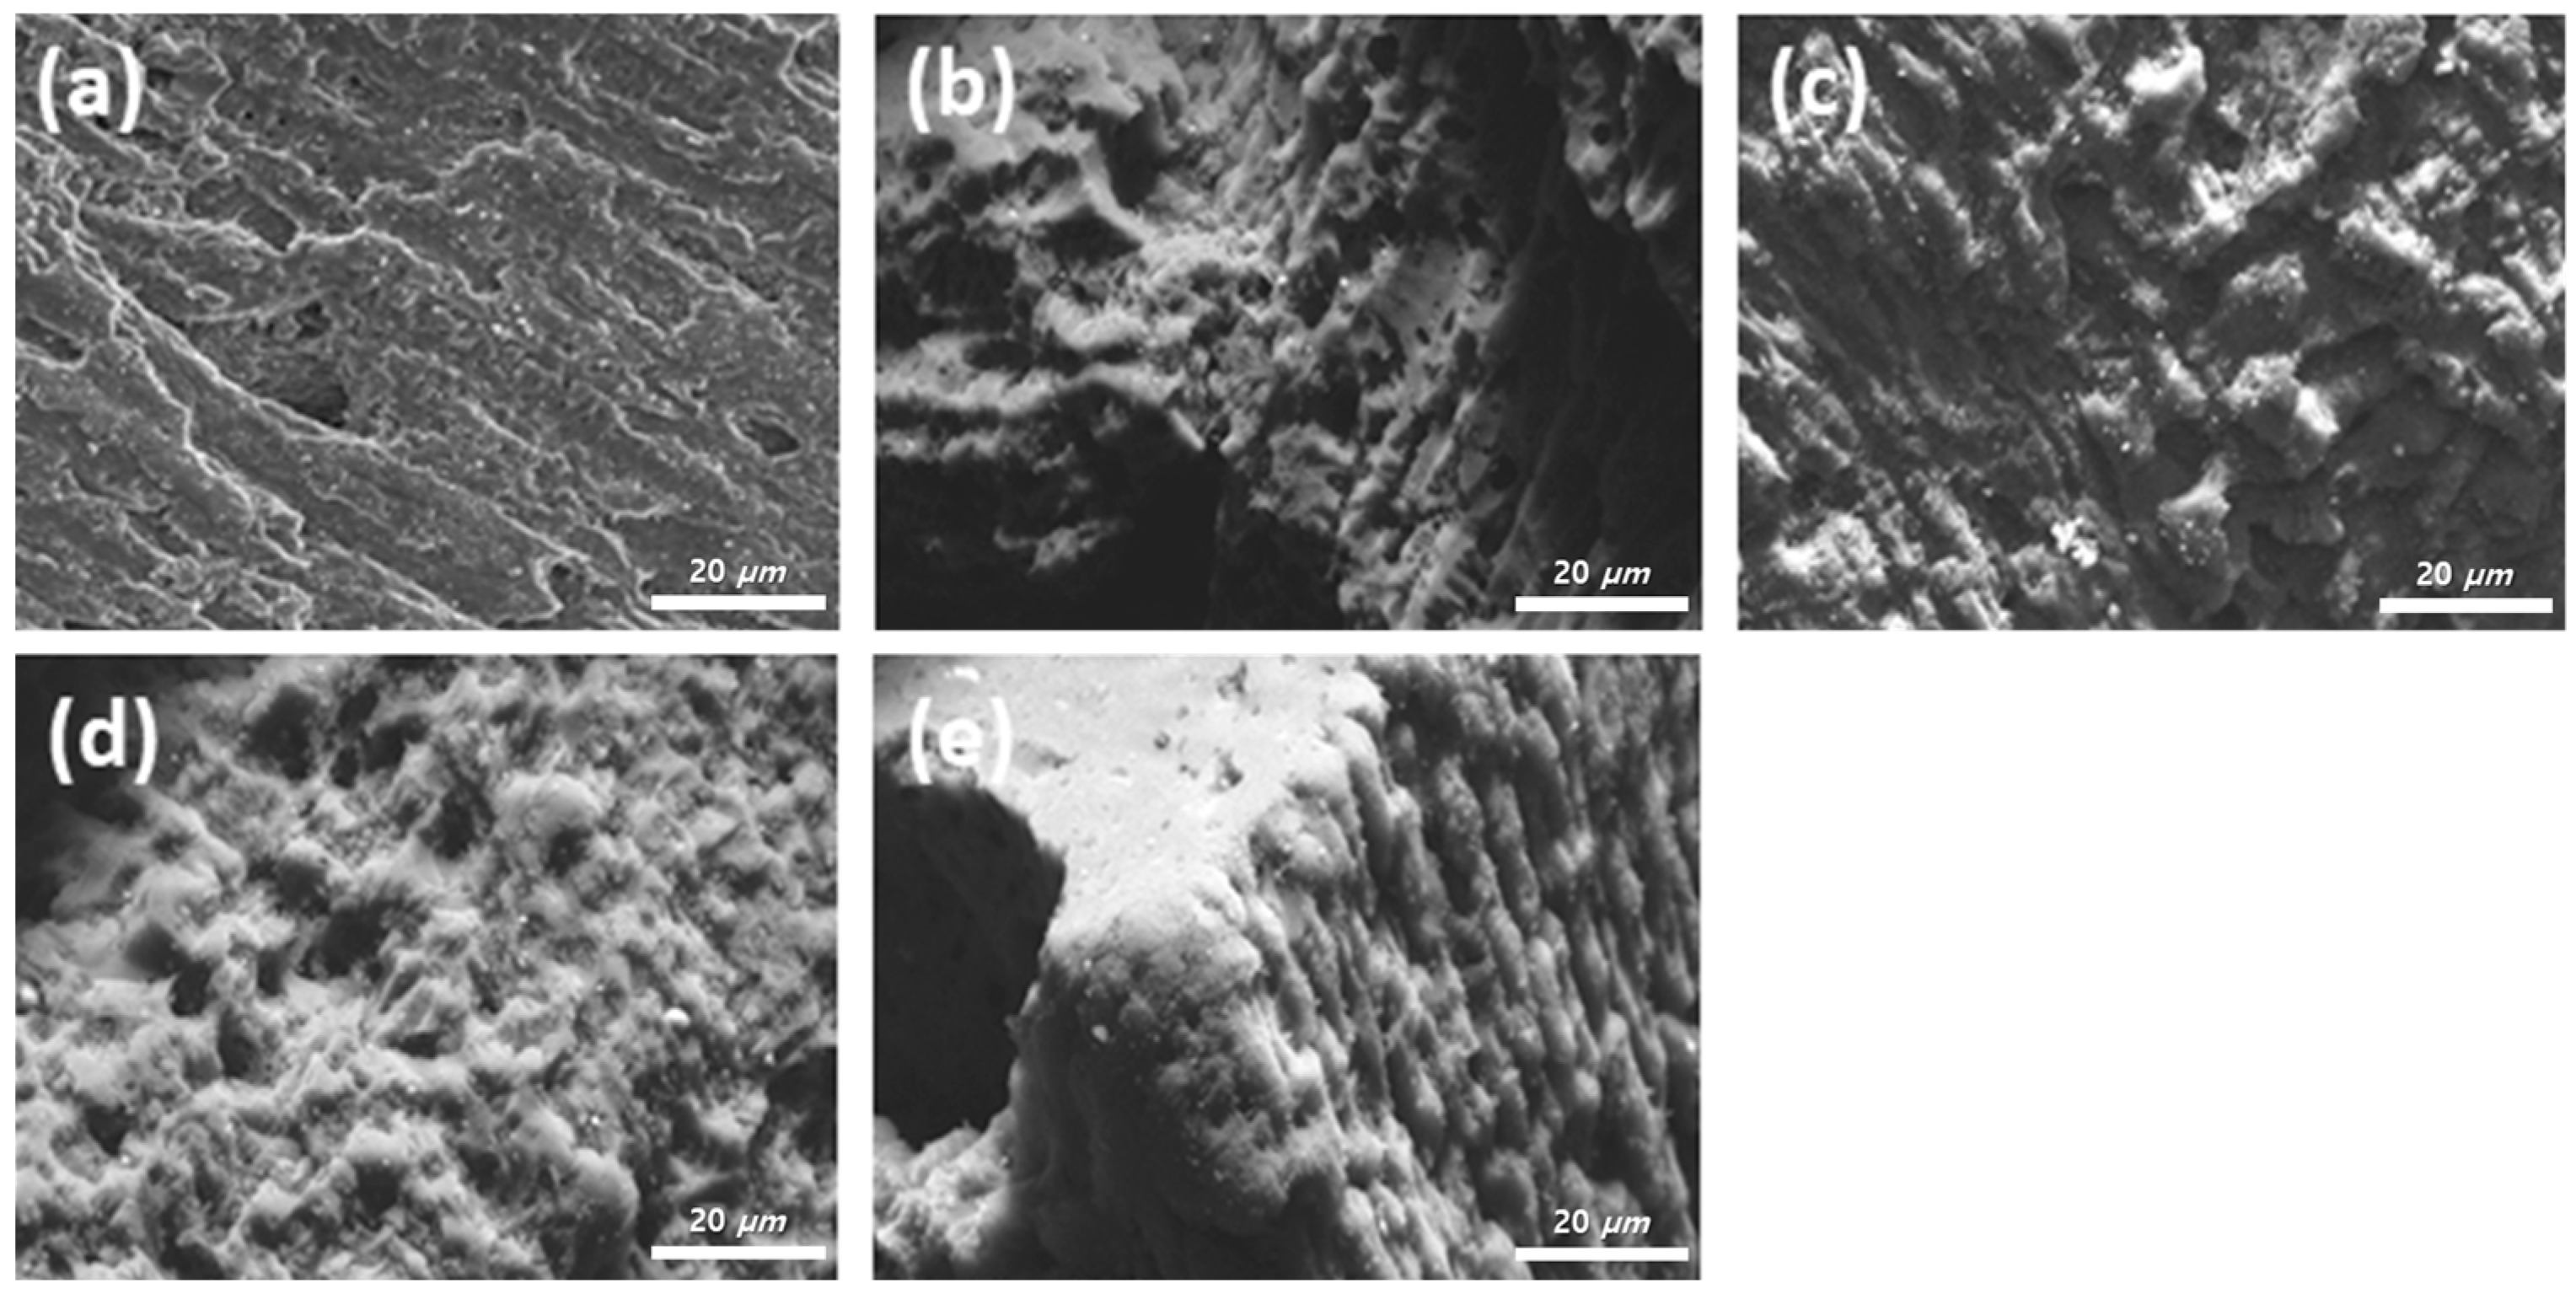
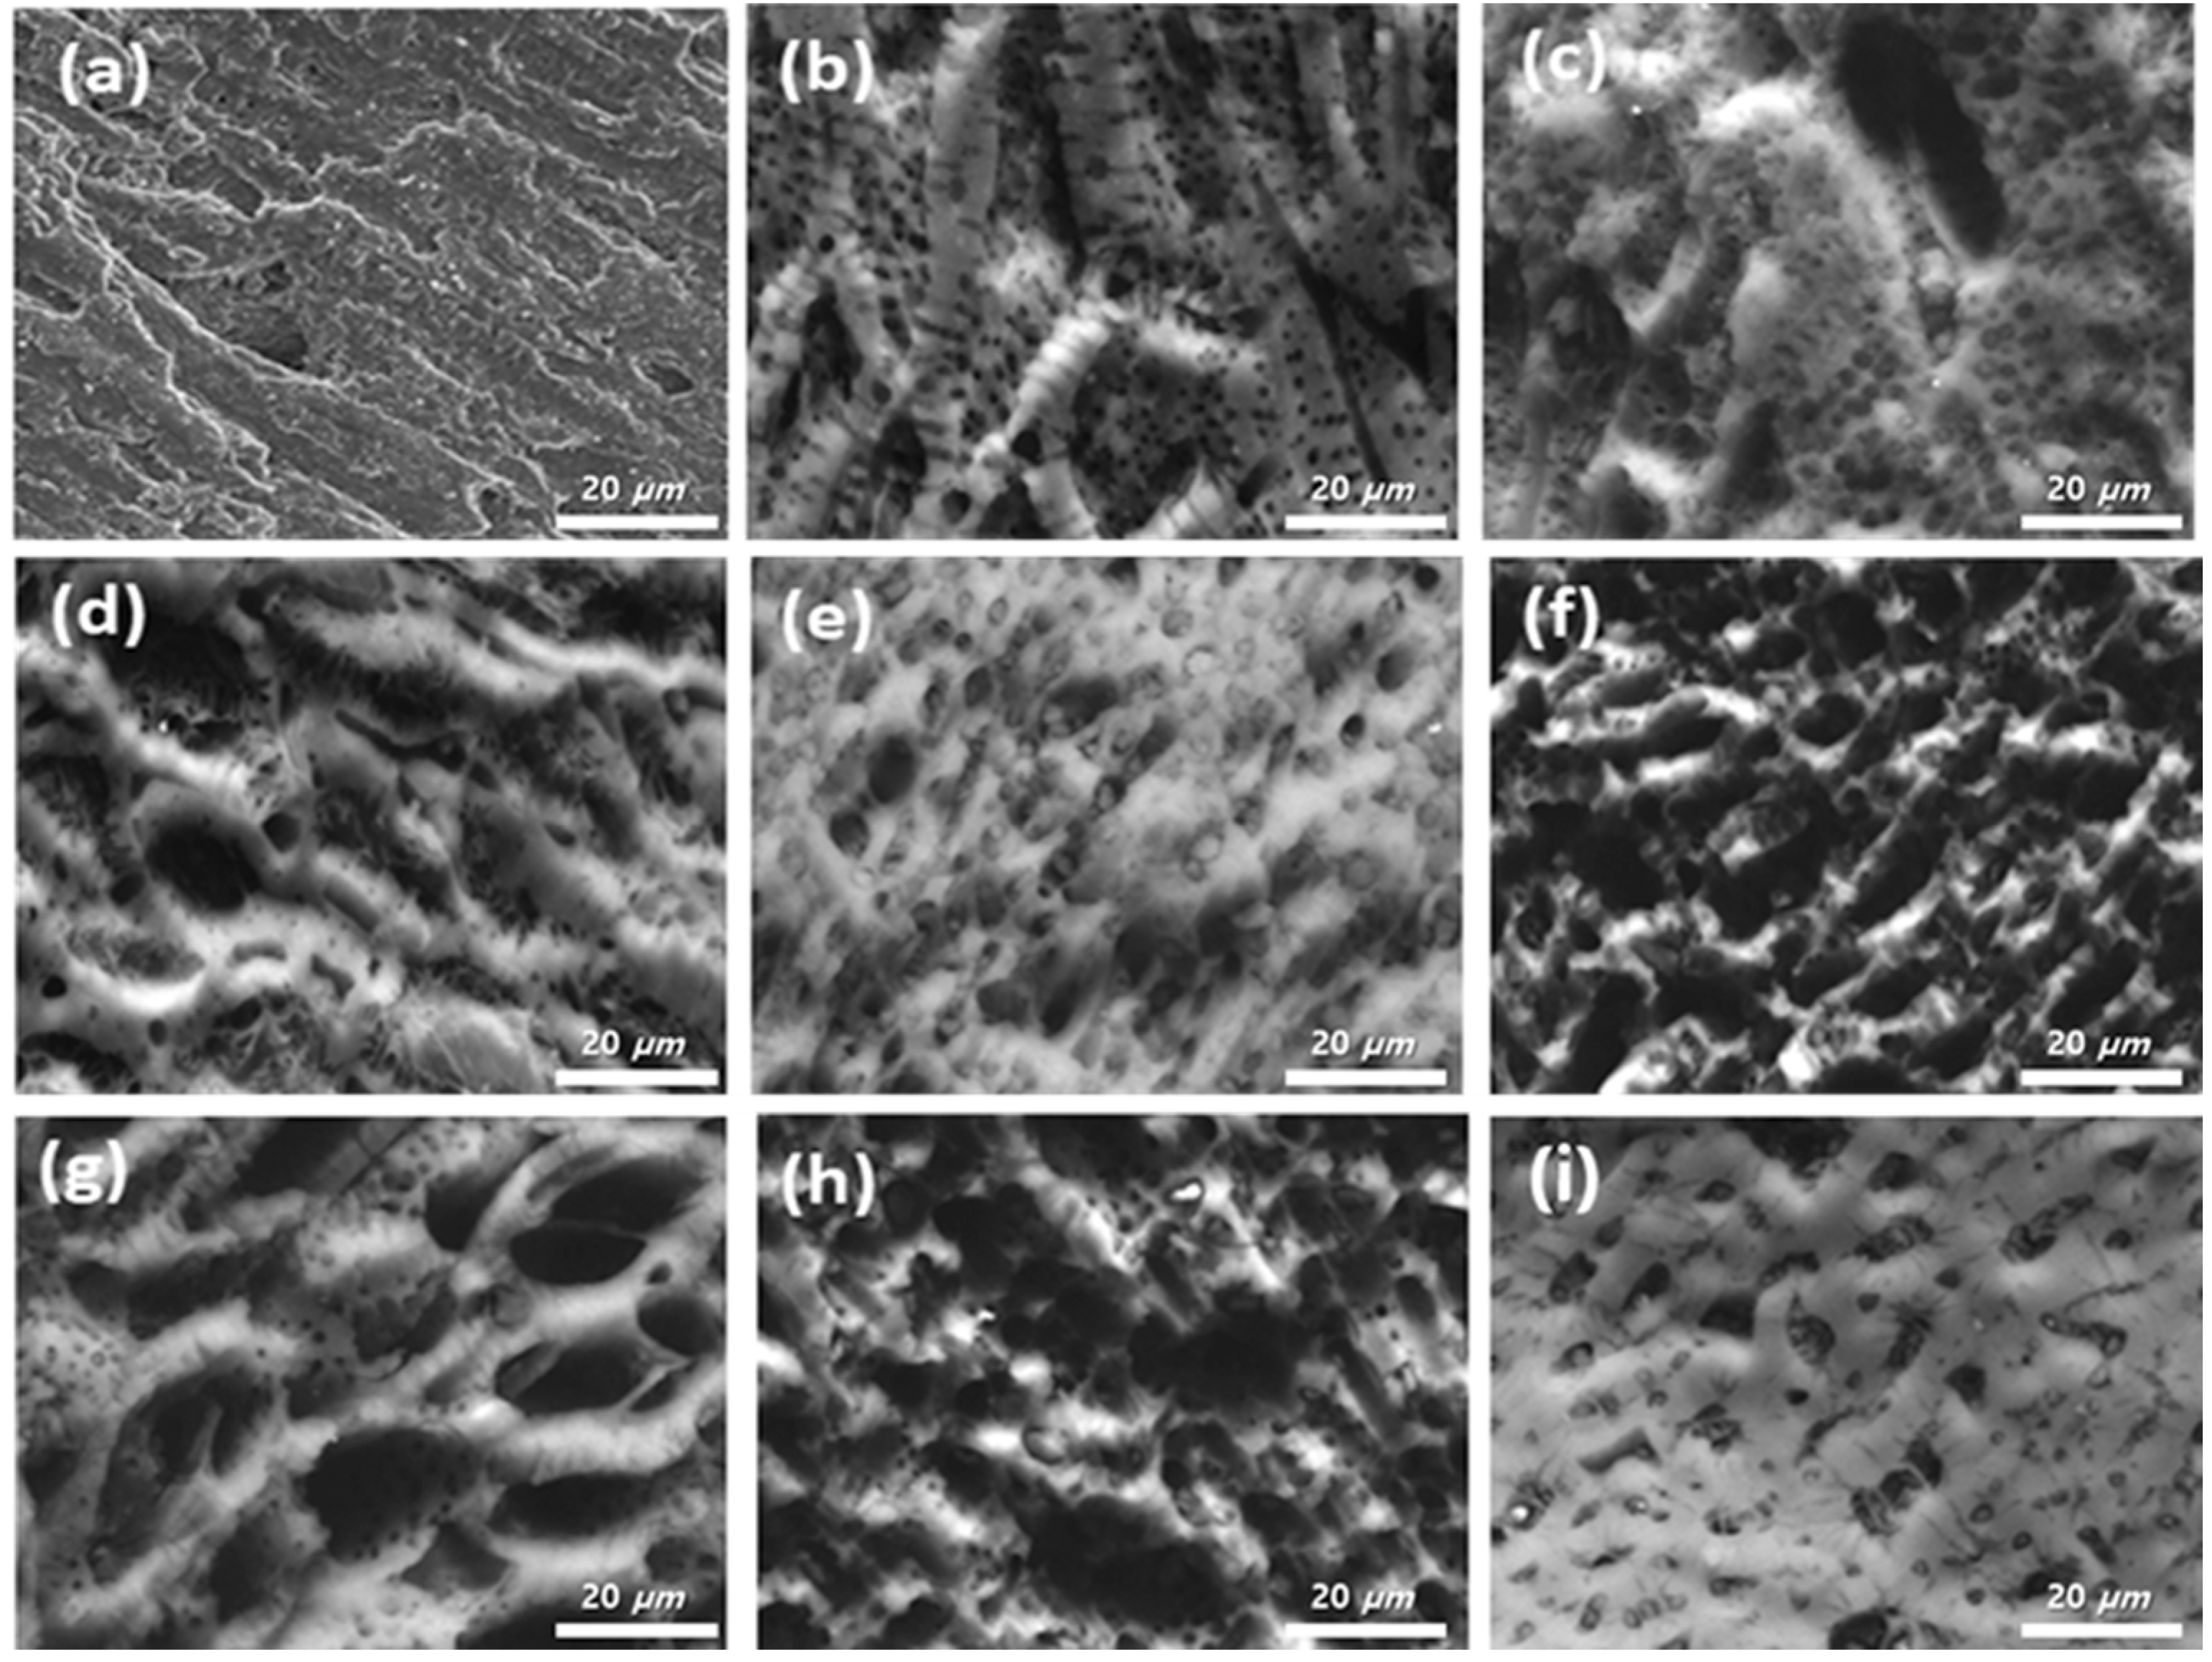
3.1. Surface Characteristic Analysis

To observe the structural differences in activated carbon modified using the plasma and microwave methods, the surface was analyzed using SEM, and the results are presented in Figure 1 and Figure 2. The surface of activated carbon treated with plasma is shown in Figure 1. The experiments were conducted at different oxygen flow rates of 50, 100, 150, and 200 cc/min, and it was observed that there was little change in the surface of activated carbon with varying flow rates.
The surface of activated carbon modified with nitric acid using microwaves is depicted in Figure 2. When treated with 1 M nitric acid, there was no significant difference between 10 min and 20 min of microwave treatment. However, as the concentration of nitric acid increased, a noticeable change in the surface structure of activated carbon was observed. Surface modifications at concentrations of 2 M or higher resulted in evident structural changes on the activated carbon surface, especially at 8 M, and clear structural changes were observed over time. This phenomenon is attributed to surface etching due to the concentration of nitric acid and longer reaction times. Depending on the degree of etching, the activated carbon surface exhibited a smoother transformation. It is assumed that such changes would also influence the specific surface area and pore structure of activated carbon with varying nitric acid concentrations and treatment times. To gain a clearer insight into the pore structure characteristics, BET analysis was conducted.

3.2. Specific Surface Area Analysis According to Plasma and Microwave Radiation Surface Modification Method

To examine the pore structure of plasma and microwave radiation-treated activated carbon, BET analysis was performed to determine specific surface area, pore volume, and pore size. The IUPAC-standard adsorption isotherm type was examined, and all the surface-treated activated carbons exhibited Type I isotherms. Type I isotherms indicate the presence of many micropores below 2 nm involved in adsorption [31]. For the plasma-treated samples, results are shown in Figure 3 and Table 1. While there were no significant changes in the surface according to SEM analysis for plasma-treated activated carbon, specific conditions led to an increase in specific surface area. Generally, the specific surface area of activated carbon decreased from 1562 m2/g to 1503 m2/g as the oxygen gas treatment flow rate increased. However, in the case of 50 cc/min, both specific surface area and pore volume increased, likely due to the complex pore structure formed because of the introduction of various oxygen functional groups. Additionally, the average pore size decreased to 1.78 nm for this specific sample. In other samples, the specific surface area generally decreased beyond a certain flow rate, which is attributed to the introduction of oxygen functional groups.
For the microwave-treated activated carbon, the surface characteristics with varying concentrations and times are presented in Figure 4 and Table 2. As the concentration of nitric acid increased from 1 M to 2 M, 4 M, and 8 M and the reaction time extended from 10 min to 20 min, the specific surface area of activated carbon decreased from 1562 m2/g to a minimum of 1347 m2/g. The pore volume also decreased from 0.89 cm3/g to 0.79 cm3/g. Notably, activated carbon treated at 8 M for 20 min rapidly decreased to 1347 m2/g, and both the total pore volume and micropore volume reduced to 0.79 cm3/g and 0.77 cm3/g, respectively, which is consistent with the SEM results. In cases where specific surface area increased compared to raw material, this can be attributed to the effects of increased pore formation and the introduction of functional groups.
The overall pore volume of untreated activated carbon was observed to be higher than that of radiation-treated activated carbon. Consequently, improved specific surface areas were observed under certain conditions. This phenomenon is attributed to the effect of plasma treatment, where high-energy oxygen radicals generated from oxygen molecules under the influence of high energy during plasma treatment etch the surface of activated carbon, creating smaller-sized pores [32].
The oxygen functional groups introduced on the surface of activated carbon exhibit a relatively higher electronegativity than carbon, resulting in a negative charge [33]. Additionally, due to the high electronegativity of oxygen atoms, carbon atoms in most carbon compounds, such as VOCs, tend to carry a relatively positive charge, acting as weak Lewis acids [32]. Consequently, it is known that oxygen functional groups and VOC molecules form chemical bonds through electrostatic interactions, making them advantageous for various adsorbent applications [34].
The PSD data of the activated carbon samples were meticulously compared, as illustrated in Figure 5. The samples exhibited the development of micropores and mesopores within the range of 0.5–50 nm. Micropores with pore width peaks at 0.5 to 2 nm, along with mesopores exhibiting a large peak at 5 to 10 nm, contribute to gas molecule adsorption, playing a crucial role in the harmful gas application. The pore structure was mostly reduced depending on the degree of surface chemical treatment, but it was confirmed that the micropores did not collapse to the extent of losing the adsorption properties.

3.3. Surface Element Analysis of Activated Carbon

The FT-IR spectra of activated carbon surface modified using microwave and plasma methods are shown in Figure 6 and Figure 7. For the activated carbon surface modified using the plasma method, common peak values around 776 cm−1, 1489 cm−1, 2850 cm−1, and 2910 cm−1 were observed in all samples, indicating the inherent structure of activated carbon, as depicted in Figure 6. These bands are related to C=C, C-H, and C=C functional groups. Additionally, for the activated carbon treated with plasma at different oxygen flow rates, strong peaks were observed around 1041 cm−1 (C-O), 1312 cm−1 (COO-), and 1572 cm−1 (C=O), which are attributed to oxygen functional groups generated by the plasma effect and vary according to the oxygen flow rate.
In the case of activated carbon surface modified using the microwave method, common bands at 2962 cm−1, 1625 cm−1, 2320 cm−1, and 1000 cm−1 were observed, as indicated in Figure 7. These bands are related to -CH, C=C aromatic stretching, hydrogen-bonded OH, and C-O functional groups. It was found that activated carbon treated with microwaves for 10 min and 20 min exhibited hydrophilic oxygen functional groups. The FT-IR results suggest that the surfaces of activated carbon treated with microwave and plasma methods have introduced oxygen functional groups that are conducive to adsorbing harmful gases. Furthermore, the extent of introduction of these functional groups varies depending on the specific conditions of treatment.

3.4. Surface Element Analysis of Activated Carbon

XPS analysis was conducted to identify the elements present on the surface of radiation-treated activated carbon, and the results are presented in Figure 8 and Figure 9 and Table 3. For activated carbon surface-treated using the microwave method, it was observed that as the concentration of nitric acid solution increased and the reaction time extended, more hydrophilic oxygen elements were introduced, as evident from the O1s peak in Table 3 Generally, the composition of oxygen species, as differentiated by the binding energies of the O1s peak, can be categorized into C-O (532.5 eV) and H-O-C (534.4 eV). It is known that as the overall elemental content increases, the ratio of these oxygen species also increases. When comparing with the raw sample, clear differences can be observed. In the case of the raw sample, the oxygen content is 4.87 at%, while the activated carbon surface treated with the highest nitric acid concentration of 8 M for 20 min shows an increase in oxygen content up to 14.11 at%. This result suggests that the introduction of various oxygen species to the activated carbon surface occurred due to the high nitric acid concentration and extended reaction time.
For activated carbon surface-treated with the plasma method, it was found that as the oxygen gas flow rate increased from 50 to 200 cc/min, the oxygen content, as confirmed by the O1s value, significantly increased from 4.97 at% to 37.25 at%. This outcome is attributed to the ionization of oxygen atoms during the plasma reaction, which, as the flow rate increased, maintained a saturated state, and introduced various oxygen species to the activated carbon surface. However, it is worth noting that in some conditions (100 and 200 cc/min), there was a reduction in the oxygen content. This is believed to be a phenomenon resulting from the strong plasma energy causing ionized oxygen atoms to repetitively introduce and detach from the activated carbon surface. Additionally, we observed an additional N1s peak in plasma-treated activated carbon. This is attributed to the pre-treatment process with nitrogen gas, during which some nitrogen molecules are adsorbed onto the activated carbon surface, introducing nitrogen functional groups.
The combined findings from FT-IR and XPS analyses offer a holistic view of the complex dynamics governing functional groups and elemental composition throughout the surface modification process. The nuanced impact of microwave and plasma treatments on activated carbon surfaces becomes evident as these conditions intricately shape the nature and abundance of oxygen species. This detailed exploration enhances our comprehension of the precisely tailored functionalization of activated carbon surfaces, elucidating the pivotal role of specific treatment conditions in achieving desired surface properties. Such insights hold significant implications for optimizing applications related to gas adsorption and environmental remediation, where the fine-tuning of surface characteristics plays a crucial role in enhancing material performance.

4. Conclusions

In this study, we investigated the surface modification of conventional powdered activated carbon using plasma and microwave treatment methods to examine the surface changes and the attachment of oxygen functional groups to the activated carbon.
1.
The plasma surface treatment method demonstrated the effective introduction of oxygen functional groups onto the activated carbon surface, depending on the variation in oxygen flow rates. However, contrary to expectations, when the oxygen flow rate was increased, an irregular introduction of oxygen functional groups onto the activated carbon surface was observed. These results are presumed to be a consequence of the repetitive influx and detachment of ionized oxygen atoms on the activated carbon surface induced by strong plasma energy.
2.
The microwave treatment method shows a decrease in specific surface area and total pore volume of activated carbon with prolonged surface chemical reaction time or higher concentrations of nitric acid. These results are attributed to the etching effect induced by the high concentration of nitric acid solution and intense microwave energy, leading to the surface modification of activated carbon. Additionally, the introduction of oxygen functional groups contributes to the phenomenon of pore blockage on the activated carbon surface.
3.
The oxygen functional groups introduced onto the activated carbon surface in this manner exhibit a higher electronegativity compared to carbon, resulting in a negative charge. Additionally, carbon atoms in most hydrocarbon compounds, such as VOCs, tend to carry a positive charge when encountering oxygen atoms with high electronegativity. Consequently, oxygen functional groups and VOC molecules are anticipated to form chemical bonds through electrostatic interactions, contributing to the adsorption process.
In the future, as further research results are obtained for activated carbon modified using these radiation methods, it is expected that these materials will find applications in various industries for the effective adsorption and removal of harmful gases generated in several industrial settings.

Author Contributions

Conceptualization and methodology, B.C.B. and Y.R.K.; formal analysis, S.Y.Y.; data curation, S.Y.Y. and B.C.B.; writing—original draft, S.Y.Y.; writing—review and editing, B.C.B. All authors have read and agreed to the published version of the manuscript.

Funding

Carbon Cluster Construction Project [20012870], Development of pitch-based impregnated activated carbon from petroleum residues and waste PET with a specific surface area over 2000 m2g for removing hydrogen fluoride gas in the semiconductor etching process.

Data Availability Statement

The data that support the findings of this study are available from the corresponding author upon reasonable request.

Acknowledgments

This research was supported by the Korea Evaluation Institute of Industrial Technology (KEIT).

Conflicts of Interest

The authors declare no conflict of interest.

References

  1. Li, X.; Zhang, L.; Yang, Z.; Wang, P.; Yan, Y.; Ran, J. Adsorption materials for volatile organic compounds (VOCs) and the key factors for VOCs adsorption process: A review. Separ. Purif. Technol. 2020, 235, 116213. [Google Scholar] [CrossRef]
  2. Li, L.; Suain, L.; Junxin, L. Surface modification of coconut shell based activated carbon for the improvement of hydrophobic VOC removal. J. Hazard. Mater. 2011, 192, 683–690. [Google Scholar] [CrossRef] [PubMed]
  3. Zhou, L.; Ma, C.; Horlyck, J.; Liu, R.; Yun, J. Development of pharmaceutical VOCs elimination by catalytic processes in China. Catalysts 2020, 10, 668. [Google Scholar] [CrossRef]
  4. Bai, B.C.; Lee, H.U.; Lee, C.W.; Lee, Y.S.; Im, J.S. N2 plasma treatment on activated carbon fibers for toxic gas removal: Mechanism study by electrochemical investigation. Chem. Engin. J. 2016, 306, 260–268. [Google Scholar] [CrossRef]
  5. Ao, C.H.; Lee, S.C. Indoor air purification by photocatalyst TiO2 immobilized on an activated carbon filter installed in an air cleaner. Chem. Engin. Sci. 2005, 60, 103–109. [Google Scholar] [CrossRef]
  6. Isinkaralar, K.; Turkyilmaz, A. Simultaneous adsorption of selected VOCs in the gas environment by low-cost adsorbent from Ricinus communis. Carbon Lett. 2022, 32, 1781–1789. [Google Scholar] [CrossRef]
  7. Sivaranjanee, R.; Kumar, P.S.; Rangasamy, G. A critical review on biochar for environmental applications. Carbon Lett. 2023, 33, 1407–1432. [Google Scholar] [CrossRef]
  8. Kocaman, S. Evaluation of adsorption characteristics of new-generation CNT-based adsorbents: Characterization, modeling, mechanism, and equilibrium study. Carbon Lett. 2023, 33, 883–897. [Google Scholar] [CrossRef]
  9. Rajeshkumar, L.; Ramesh, M.; Bhuvaneswari, V.; Balaji, D. Carbon nano-materials (CNMs) derived from biomass for energy storage applications: A review. Carbon Lett. 2023, 33, 661–690. [Google Scholar] [CrossRef]
  10. Kang, H.J.; Yang, S.Y.; Kim, T.M.; Kim, Y.R. A study on the improvement of hydrophilic properties of activated carbon surface by nitric acid treatment. J. Korean Appl. Sci. Technol. 2021, 38, 1241–1248. [Google Scholar]
  11. Vold, M.J. The effect of adsorption on the van der waals interaction of spherical colloidal particles. J. Colloid Sci. 1961, 16, 1–12. [Google Scholar] [CrossRef]
  12. Huang, C.C.; Li, H.S.; Chen, C.H. Effect of surface acidic oxides of activated carbon on adsorption of ammonia. J. Hazard. Mater. 2008, 159, 523–527. [Google Scholar] [CrossRef] [PubMed]
  13. Jiang, L.; Jia, Z.; Xu, X.; Chen, Y.; Peng, W.; Zhang, J.; Wang, H.; Li, S.; Wen, J. Preparation of antimicrobial activated carbon fiber by loading with silver nanoparticles. Colloids Surf. A 2022, 633, 127868. [Google Scholar] [CrossRef]
  14. Valdés, H.; Sánchez-Polo, M.; Rivera-Utrilla, J.; Zaror, C.A. Effect of ozone treatment on surface properties of activated carbon. Langmuir 2002, 18, 2111–2116. [Google Scholar] [CrossRef]
  15. Rodrigues, C.C.; Moraes Jr, D.; Nóbrega, S.W.; Barboza, M.G. Ammonia adsorption in a fixed bed of activated carbon. Bioresour. Technol. 2007, 98, 886–891. [Google Scholar] [CrossRef] [PubMed]
  16. Kim, D.Y.; Park, J.H.; Hwang, J. Inactivation and filtration of bioaerosols using carbon fiber ionizer assisted activated carbon fiber filter. Part. Aerosol Res. 2010, 6, 185–192. [Google Scholar]
  17. Kim, M.J.; Jung, M.J.; Kim, M.I.; Choi, S.S.; Lee, Y.S. Adsorption characteristics of toluene gas using fluorinated phenol-based activated carbons. Appl. Chem. Eng. 2015, 26, 587–592. [Google Scholar] [CrossRef]
  18. Khasri, A.; Bello, O.S.; Ahmad, M.A. Mesoporous activated carbon from pentace species sawdust via microwave-induced KOH activation: Optimization and methylene blue adsorption. Res. Chem. Intermed. 2018, 44, 5737–5757. [Google Scholar] [CrossRef]
  19. Park, S.J.; Kim, B.J. Influence of oxygen plasma treatment on hydrogen chloride removal of activated carbon fibers. J. Colloid Interface Sci. 2004, 275, 590–595. [Google Scholar] [CrossRef]
  20. Lee, J.H.; Kim, J.G.; Yang, H.C.; Kim, J.H.; Lee, J.K. Adsorption characteristics of sulfur dioxide on pellet type zeolites. Korean Chem. Eng. Res. 2003, 41, 129–133. [Google Scholar]
  21. Guo, J.; Lua, A.C. Preparation of activated carbons from oil-palm-stone chars by microwave-induced carbon dioxide activation. Carbon 2000, 38, 1985–1993. [Google Scholar] [CrossRef]
  22. Liu, Q.S.; Zheng, T.; Li, N.; Wang, P.; Abulikemu, G. Modification of bamboo-based activated carbon using microwave radiation and its effects on the adsorption of methylene blue. Appl. Surf. Sci. 2010, 256, 3309–3315. [Google Scholar] [CrossRef]
  23. Lee, D.; Hong, S.H.; Paek, K.H.; Ju, W.T. Adsorbability enhancement of activated carbon by dielectric barrier discharge plasma treatment. Surf. Coat. Technol. 2005, 200, 2277–2282. [Google Scholar] [CrossRef]
  24. Ortiz Ortega, E.; Hosseini, S.; Martinez-Chapa, O.S.; Madou, M.J. Aging of plasma-activated carbon surfaces: Challenges and opportunities. Appl. Surf. Sci. 2021, 565, 150362. [Google Scholar] [CrossRef]
  25. Yin, C.Y.; Aroua, M.K.; Daud, W.M.A.W. Review of modifications of activated carbon for enhancing contaminant uptakes from aqueous solutions. Separ. Purif. Technol. 2007, 52, 403–415. [Google Scholar] [CrossRef]
  26. Shafeeyan, M.S.; Daud, W.M.A.W.; Houshmand, A.; Shamiri, A. A review on surface modification of activated carbon for carbon dioxide adsorption. J. Anal. Appl. Pyrolysis. 2010, 89, 143–151. [Google Scholar] [CrossRef]
  27. Lim, C.; Kwak, C.H.; Jeong, S.G.; Kim, D.; Lee, Y.S. Enhanced CO2 adsorption of activated carbon with simultaneous surface etching and functionalization by nitrogen plasma treatment. Carbon Lett. 2023, 33, 139–145. [Google Scholar] [CrossRef]
  28. Wu, J.; Xu, F.; Li, S.; Ma, P.; Zhang, X.; Liu, Q.; Fu, R.; Wu, D. Porous polymers as multifunctional material platforms toward task-specific applications. Adv. Mater. 2019, 31, 1802922. [Google Scholar] [CrossRef] [PubMed]
  29. Hesas, R.H.; Wan Daud, W.M.A.; Sahu, J.N.; Arami-Niya, A. The effects of a microwave heating method on the production of activated carbon from agricultural waste: A review. J. Anal. Appl. Pyrolysis 2013, 100, 1–11. [Google Scholar] [CrossRef]
  30. Biniak, S.; Szymański, G.; Siedlewski, J.; Świątkowski, A. The characterization of activated carbons with oxygen and nitrogen surface groups. Carbon 1997, 35, 1799–1810. [Google Scholar] [CrossRef]
  31. Jung, M.J.; Yu, H.R.; Lee, D.; Lee, Y.S. Effect of boric acid treatment on the electrochemical properties of the phenol-based Activated carbon. Appl. Chem. Engin. 2013, 24, 201–207. [Google Scholar]
  32. Yu, H.R.; Cho, S.; Bai, B.C.; Yi, K.B.; Lee, Y.S. Effects of fluorination on carbon molecular sieves for CH4/CO2 gas separation behavior. Int. J. Greenh. Gas Control. 2012, 10, 278–284. [Google Scholar] [CrossRef]
  33. Tian, Y.; Zhang, X.; Wang, Y.; Cui, Z.; Tang, J. SF6 abatement in a packed bed plasma reactor: Role of zirconia size and optimization using RSM. J. Ind. Eng. Chem. 2021, 94, 205–216. [Google Scholar] [CrossRef]
  34. Sugiyama, H.; Hattori, Y. Selective and enhanced CO2 adsorption on fluorinated activated carbon fibers. Chem. Phys. Lett. 2020, 758, 137909. [Google Scholar] [CrossRef]
Figure 1. SEM images of samples after plasma treatment: (a) Raw, (b) 50, (c) 100, (d) 150, (e) 200 cc/min.
Surfaces 07 00002 g001
Figure 2. SEM images of samples after microwave treatment: (a) Raw, (b) 1 M 10 min, (c) 1 M 20 min, (d) 2 M 10 min, (e) 2 M 20 min, (f) 4 M 10 min, (g) 4 M 20 min, (h) 8 M 10 min, (i) 8 M 20 min.
Surfaces 07 00002 g002
Figure 3. Nitrogen isotherms of the plasma-treated activated carbon.
Surfaces 07 00002 g003
Figure 4. Nitrogen isotherms of the microwave-treated activated carbon; (a) treated 10 min, (b) treated 20 min.
Surfaces 07 00002 g004
Figure 5. Pore size distribution of the plasma-treated and microwave-treated activated carbon; (a) plasma-treated, (b) microwave- 10 min and (c) treated 20 min.
Surfaces 07 00002 g005
Figure 6. FT-IR difference spectra of activated carbon with different oxygen gas flows during plasma treatment.
Surfaces 07 00002 g006
Figure 7. FT-IR difference spectra of activated carbon with different times and concentrations during microwave treatment; (a) treated 10 min, (b) treated 20 min.
Surfaces 07 00002 g007
Figure 8. Elemental analysis by XPS survey spectrum for plasma treatment.
Surfaces 07 00002 g008
Figure 9. XPS survey spectrum of the microwave-treated activated carbon; (a) treated 10 min, (b) treated 20 min.
Surfaces 07 00002 g009
Table 1. BET surface properties of plasma-treated activated carbon.
SampleSBET
(m2/g)
Total Pore Volume
(cm3/g)
Micropore Volume
(cm3/g)
Average Pore Diameter (nm)
Raw15620.890.7291.85
50 cc/min16390.860.701.78
100 cc/min15460.810.671.81
150 cc/min15900.830.711.80
200 cc/min15030.790.641.79
Table 2. BET surface properties of microwave-treated activated carbon.
SampleSbet (m2/g)Total Pore Volume
(cm2/g)
Micropore Volume
(cm2/g)
Average Pore
Diameter (nm)
RAW15620.890.681.85
1 M 10 min15420.820.671.85
2 M 10 min16280.840.721.86
4 M 10 min15730.830.691.87
8 M 10 min15270.830.681.91
1 M 20 min16080.870.711.86
2 M 20 min15270.820.671.86
4 M 20 min15310.810.681.89
8 M 20 min13470.770.611.93
Table 3. XPS elemental composition of samples.
Sample NameXPS Peaks
C1sO1sN1s
Raw94.824.760.41
Microwave1 M10 min92.517.49-
20 min90.469.54-
2 M10 min89.8910.41-
20 min90.489.53-
4 M10 min90.279.73-
20 min88.7911.21-
8 M10 min86.4713.53-
20 min85.8914.11-
Plasma50 cc/min64.0834.141.78
100 cc/min71.5126.971.51
150 cc/min60.6435.643.22
200 cc/min77.0621.241.69
Disclaimer/Publisher’s Note: The statements, opinions and data contained in all publications are solely those of the individual author(s) and contributor(s) and not of MDPI and/or the editor(s). MDPI and/or the editor(s) disclaim responsibility for any injury to people or property resulting from any ideas, methods, instructions or products referred to in the content.

