
Preparation of Adsorbent from Mechanochemical Reaction-Based Waste Seashell with Sodium Oxalate and Its Application in Pb Ion Adsorption


Division of Marine Biosciences, Graduate School of Fisheries Sciences, Hokkaido University, Minato 3-1-1, Hakodate 041-8611, Japan
Surfaces 2024, 7(2), 208-224; https://doi.org/10.3390/surfaces7020014
Submission received: 31 January 2024
/
Revised: 15 March 2024
/
Accepted: 28 March 2024
/
Published: 30 March 2024
(This article belongs to the Collection Featured Articles for Surfaces)
Abstract
:Waste seashell (scallop shell)-based adsorbent was prepared via mechanochemical reaction with sodium oxalate using ball milling. The oxalate-modified seashell-based adsorbents (OS) were prepared by varying the molar ratio of calcium and oxalate to 0.5, 1, and 2. Sodium oxalate was used as the aqueous solution in ball milling. Lead ion adsorption was conducted with the prepared adsorbent. The adsorption behavior of lead ions was investigated in terms of adsorption kinetics and adsorption equilibrium. The time course of the amount of Pb adsorbed agreed well with Langmuir rate equation. The adsorption equilibrium relationship of OS adsorbent and Pb agreed well with the Langmuir adsorption isotherm. Increasing with the molar ratio, the saturated amount of Pb adsorbed increased slightly from 5.45 × 10⁻³ to 6.23 × 10⁻³ mol/g. Under the present experimental conditions, the maximum equilibrium adsorption was 5.93 × 10⁻³ mol/g, which is greater than that reported in the literature.
1. Introduction
Mechanochemical reactions using ball milling have the advantage that the new surface created when solid particles are ground is a highly reactive surface, and new bonding states can be easily formed when ions or substances with double bonds are present. However, it is also very difficult to control the reaction. Mechanochemical reactions using ball milling are used in various fields, for example, metal recovery operations [1], synthesis of metal oxide nanoparticles [2], synthesis of antimicrobial materials [3], pharmaceutical synthesis [4], extraction operations [5,6], synthesis of catalytic materials [7,8], and production of functional nanoparticle materials [9,10].
On the other hand, the removal of harmful toxic heavy metal ions dissolved in water has long been an issue closely related to our daily lives, especially for the preservation of the aquatic environment, the safety of drinking water, and the protection of human health, and it continues to attract interest [11]. Various methods are used to remove heavy metal ions from aquatic environments, including chemical precipitation [12], ion exchange resins [13], membrane technology [14], coagulation precipitation [15], electrochemical methods [16], and adsorption. The removal of heavy metal ions is accomplished by using various procedures at the appropriate location and timing, as there is no one-size-fits-all solution.
Among these methods, the separation process by adsorption is used in various fields. Adsorption is widely used because of its simplicity and ease of continuous operation. In recent years, various adsorbents have been developed using inexpensive bio-materials and waste materials. Among them, there have been many reports on the use of waste shells as adsorbents for the recovery of heavy metal ions. The main component of shells is calcium carbonate. Calcium carbonate as a mineral is inexhaustible on the earth and is widely used in various industries. On the other hand, discarded shells are one of the environmental problems that are generated in large quantities as fishery waste. For example, in Hokkaido, Japan, the total amount of fishery waste in 2021 was 1 million tons, of which 300,000 tons were shells, accounting for 30%. Effective utilization of these discarded shells is one of the most important issues.
Several studies on the adsorption of heavy metal ions using shells have been reported such as adsorption of Pb and Cu ions using shells (Anadara inaequivalvis) [17], adsorption of Pb, Ni, and Zn using an adsorbent combined pervious concrete and seashell [18], removal of Sr ions from aqueous solution using clam shell (Donax trunculus) [19], adsorption of Pb ions using mussel shell-based adsorbent [20], removal of Cu, Co, and Pb ions using calcined snail shell (Solamen Vaillanti) [21], adsorption of Ni ions on sea shells of Mehdia [22], development of adsorbent combined cement and shells [23], adsorption of Cu, Cd, and Pb ions using calcined golden apple snail shell [24], adsorption of Cu, Zn, Cd, and Ni ions using discarded shells from canning industry [25], adsorption of Cu and Cd ions using indigenous shells (Mactra aequisulcata) [26], and so on. In addition, the following studies have been reported on the application of mechanochemical reactions by ball milling of discarded shells, for example, preparation of nanosized calcium carbonate powder from mollusk shells [27], preparation of high pure calcite powders from oyster shells by combination of mechanochemical and hydrothermal treatments [28], and so on. However, there are very few reports on the preparation of adsorbents based on waste shells and adsorption experiments using mechanochemical reaction by ball milling, mainly for use as adsorbents.
The author attempted to modify carboxyl groups on the surface of waste shells with an aqueous solution of sodium oxalate, a dicarboxylic acid. It was expected that one of the two carboxyl groups would bind to the reactive surface created by grinding. In this study, the influence on the adsorption behavior of lead ions on shell particles prepared by changing the molar ratio (calcium/oxalate ions) during preparation was experimentally investigated in terms of adsorption rate and adsorption equilibrium relationship. The influence of preparation conditions (molar ratio, calcium/oxalate ion) on lead ion adsorption was experimentally investigated especially in terms of the adsorption kinetics and the adsorption equilibrium relationship.
2. Materials and Methods
2.1. Materials
2.1.1. Scallop Shell
Waste scallop shells (Patinopecten yessoensis) were obtained from commercial markets in Hakodate city, Hokkaido prefecture, Japan.
2.1.2. Chemicals
Sodium oxalate and nitric acid solution (60 wt.%) were purchased from Kanto Chemical Co. Inc. (Tokyo, Japan). Lead (II) nitrate, nitric acid, sodium hydroxide, and potassium bromide were purchased from Fujifilm Wako Pure Chemical Co. (Osaka, Japan). Nitric acid and sodium hydroxide were used to adjust the pH of the adsorption system. All purchased chemicals were used without further purification.
2.2. Preparation of Adsorbent
Preparation of the adsorbent was conducted by grinding in a ball mill pod. The amount of sodium oxalate substance added to 10 g of shells (Ca ion content 0.092 mol) was varied from 0.05, 0.1, and 0.2 mol, and 100 mL of distilled water was added for grinding by ball milling. In most cases, milling was carried out at a speed of 120 rpm and a milling time of 24 h. The pod used for grinding was 500 mL in volume (outer diameter 10 cm, height 10.5 cm, made of alumina, Takishin Co., Tokyo, Japan), and the mill balls (2 cm in diameter and made of alumina, Hira Co., Ltd., Tokyo, Japan). The ball mill stand was used as AV-1 (ASAHI-RIKA SEISAKUSHO Co., Ltd., Chiba, Japan). After milling was stopped, the contents of the pods were removed into a 1000 mL beaker, and particles adhering to the balls were washed into the beaker with distilled water using a washing bottle. The inner wall of the pod was also washed into the beaker with distilled water using a washing bottle. The suspension solution was separated by centrifugation (3000× g rpm, 10 min). The collected particles were transferred to a 500 mL beaker, to which 500 mL of distilled water was added and stirred for 10 min using a magnetic stirrer. The particles were then transferred to a 500 mL beaker, 500 mL of distilled water was added, and the beaker was stirred for 10 min using a magnetic stirrer. The particles were washed twice (three times in total). The particles were then collected by centrifugation and dried in a dryer (60 °C). After drying, the particles were dispersed using an agate mortar, placed in polystyrene containers, and the containers were further stored in desiccators. The calcium ion concentration in scallop shells (0.092 mol/g shell) was determined in a previous study [29]. The molar ratios of calcium ions to sodium oxalate are approximately 0.5, 1.0, and 2.0, and the adsorbents prepared at these molar ratios will be referred to as OS0.5, OS1.0, and OS2.0, respectively.
2.3. Characterization of OS Adsorbent
2.3.1. Scanning Electron Microscopy Image
The particle morphology was observed using a scanning electron microscopy (SEM, JSM6010LA, JEOL Ltd., Tokyo, Japan).
2.3.2. Measurement of Particle Size Distribution
The particle size distribution was measured using a laser particle size analyzer (HORIBA LA-300, Kyoto, Japan).
2.3.3. Measurement of X-ray Diffraction Pattern
The X-ray diffraction (XDR) pattern was recorded using an X-ray diffractometer (XRD, MiniFlex, Rigaku Co., Tokyo, Japan).
2.3.4. FT-IR Measurement
IR spectra of adsorbents were conducted using a Fourier transform infrared spectrometer (FT/IR-4600AC, JASCO Co., Tokyo, Japan). Samples for the measurements were prepared by the tablet method using KBr. KBr was added to the sample (the adsorbent) to make it about 0.5–1.0%, and the powder was mixed well. After fine grinding, pellet discs of 3 mm were made using a pellet forming die. The tablet discs were inserted into the sample chamber for measurement.
2.4. Procedure of Adsorption Experiment
All adsorption experiments (adsorption rate and adsorption equilibrium) were performed in a batch mode. A desired amount of adsorbent was taken in an Erlenmeyer flask, to which a desired amount of distilled water was added. The solution was stirred (300 rpm) with a magnetic stirrer for 10 min. Then, the flask was set in a glass bell vacuum chamber, and the suspension was depressurized with an aspirator to degas the surface of the adsorbent for 3 min. The pH of the solution was adjusted by adding HCl or NaOH aqueous solution and stirring using a magnetic stirrer in a 30 °C water bath. The adsorption experiment was then started by adding the required amount of lead nitrate solution to achieve the prescribed initial Pb ion concentration. The initial pH of the liquid phase was prepared to be in the range of 4.95–5.05.
After the required adsorption time, the adsorbent was separated from the liquid phase by filtration using a membrane filter (average pore size 0.8 and 0.45 μm, cellulose acetate, Advantec Toyo, Tokyo, Japan). The solution including adsorbents was first filtered by a membrane filter (0.8 μm), and then the filtrate was filtered again by a membrane filter (0.45 μm). Since suction filtration using a 0.45 diameter filter from the beginning caused clogging, filtration was initially performed using a 0.8 μm diameter membrane filter. The filter with a 0.8 μm diameter of was washed with distilled water while suctioning with adsorbent particles still on it, and then placed in a dryer to dry (50 °C). The filter was then placed in a dryer for FT-IR measurement of the adsorbent after adsorption. Most experiments were repeated twice. The repeatability of the experimental results has been confirmed.
The equilibrium pH of the liquid phase was measured with a pH meter (model 920A, ThermoOrion, Beverly, MA, USA). The concentration of Pb ions in the liquid phase was measured using an atomic absorption spectrophotometer (AAnalyst 200, Perkin Elmer, Waltham, MA, USA). The amount of Pb adsorbed was calculated from the mass balance expressed by the following equations.
where Xt [mol/g] and Xe [mol/g] are the amount adsorbed at time t and equilibrium amount adsorbed, Ct [mol/L] and Ce [mol/L] are the liquid phase concentration at time t and equilibrium concentration, Ci [mol/L] is the initial concentration of the liquid phase, V [L] is the liquid volume, and m [g] is the mass of the adsorbent, respectively.
Xt = (Ci − Ct)V/m
Xe = (Ci − Ce)V/m
3. Results and Discussion
3.1. Characterization of OS Adsorbent
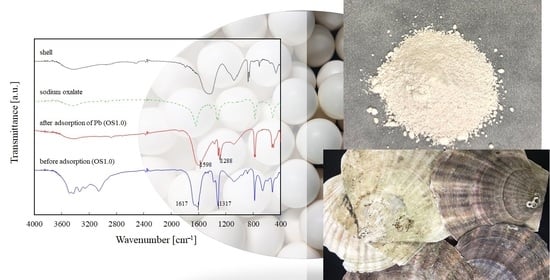
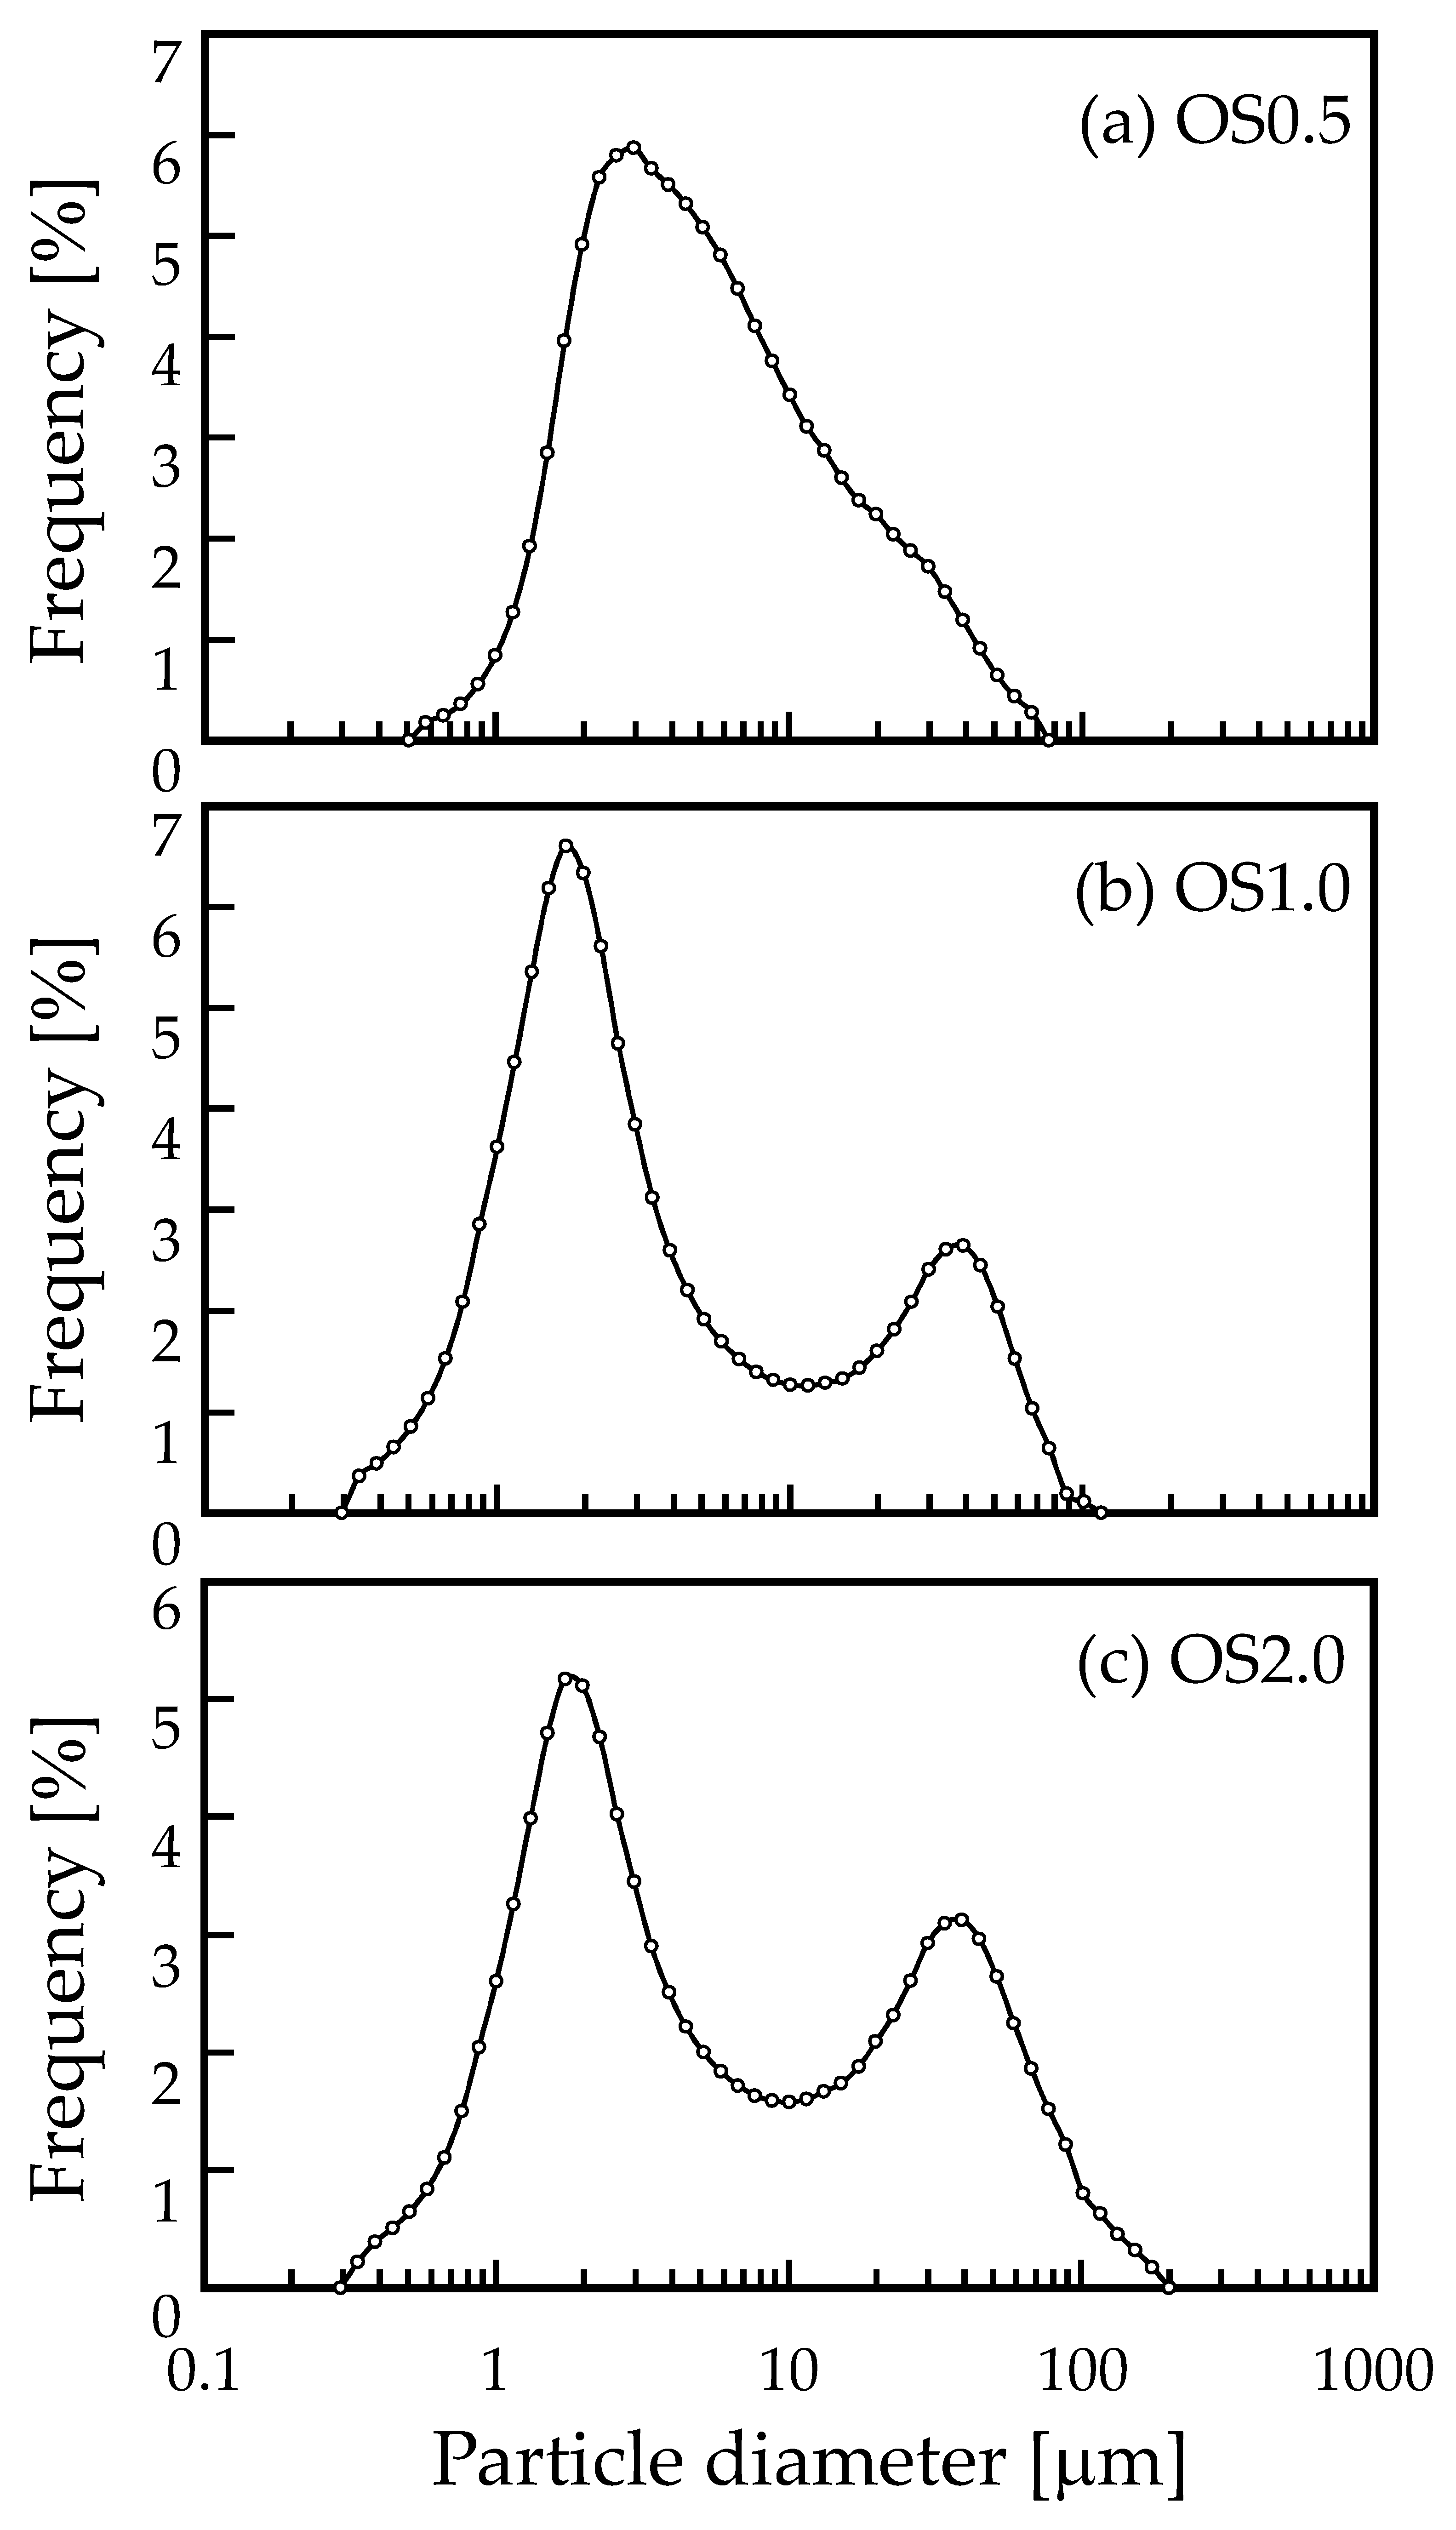
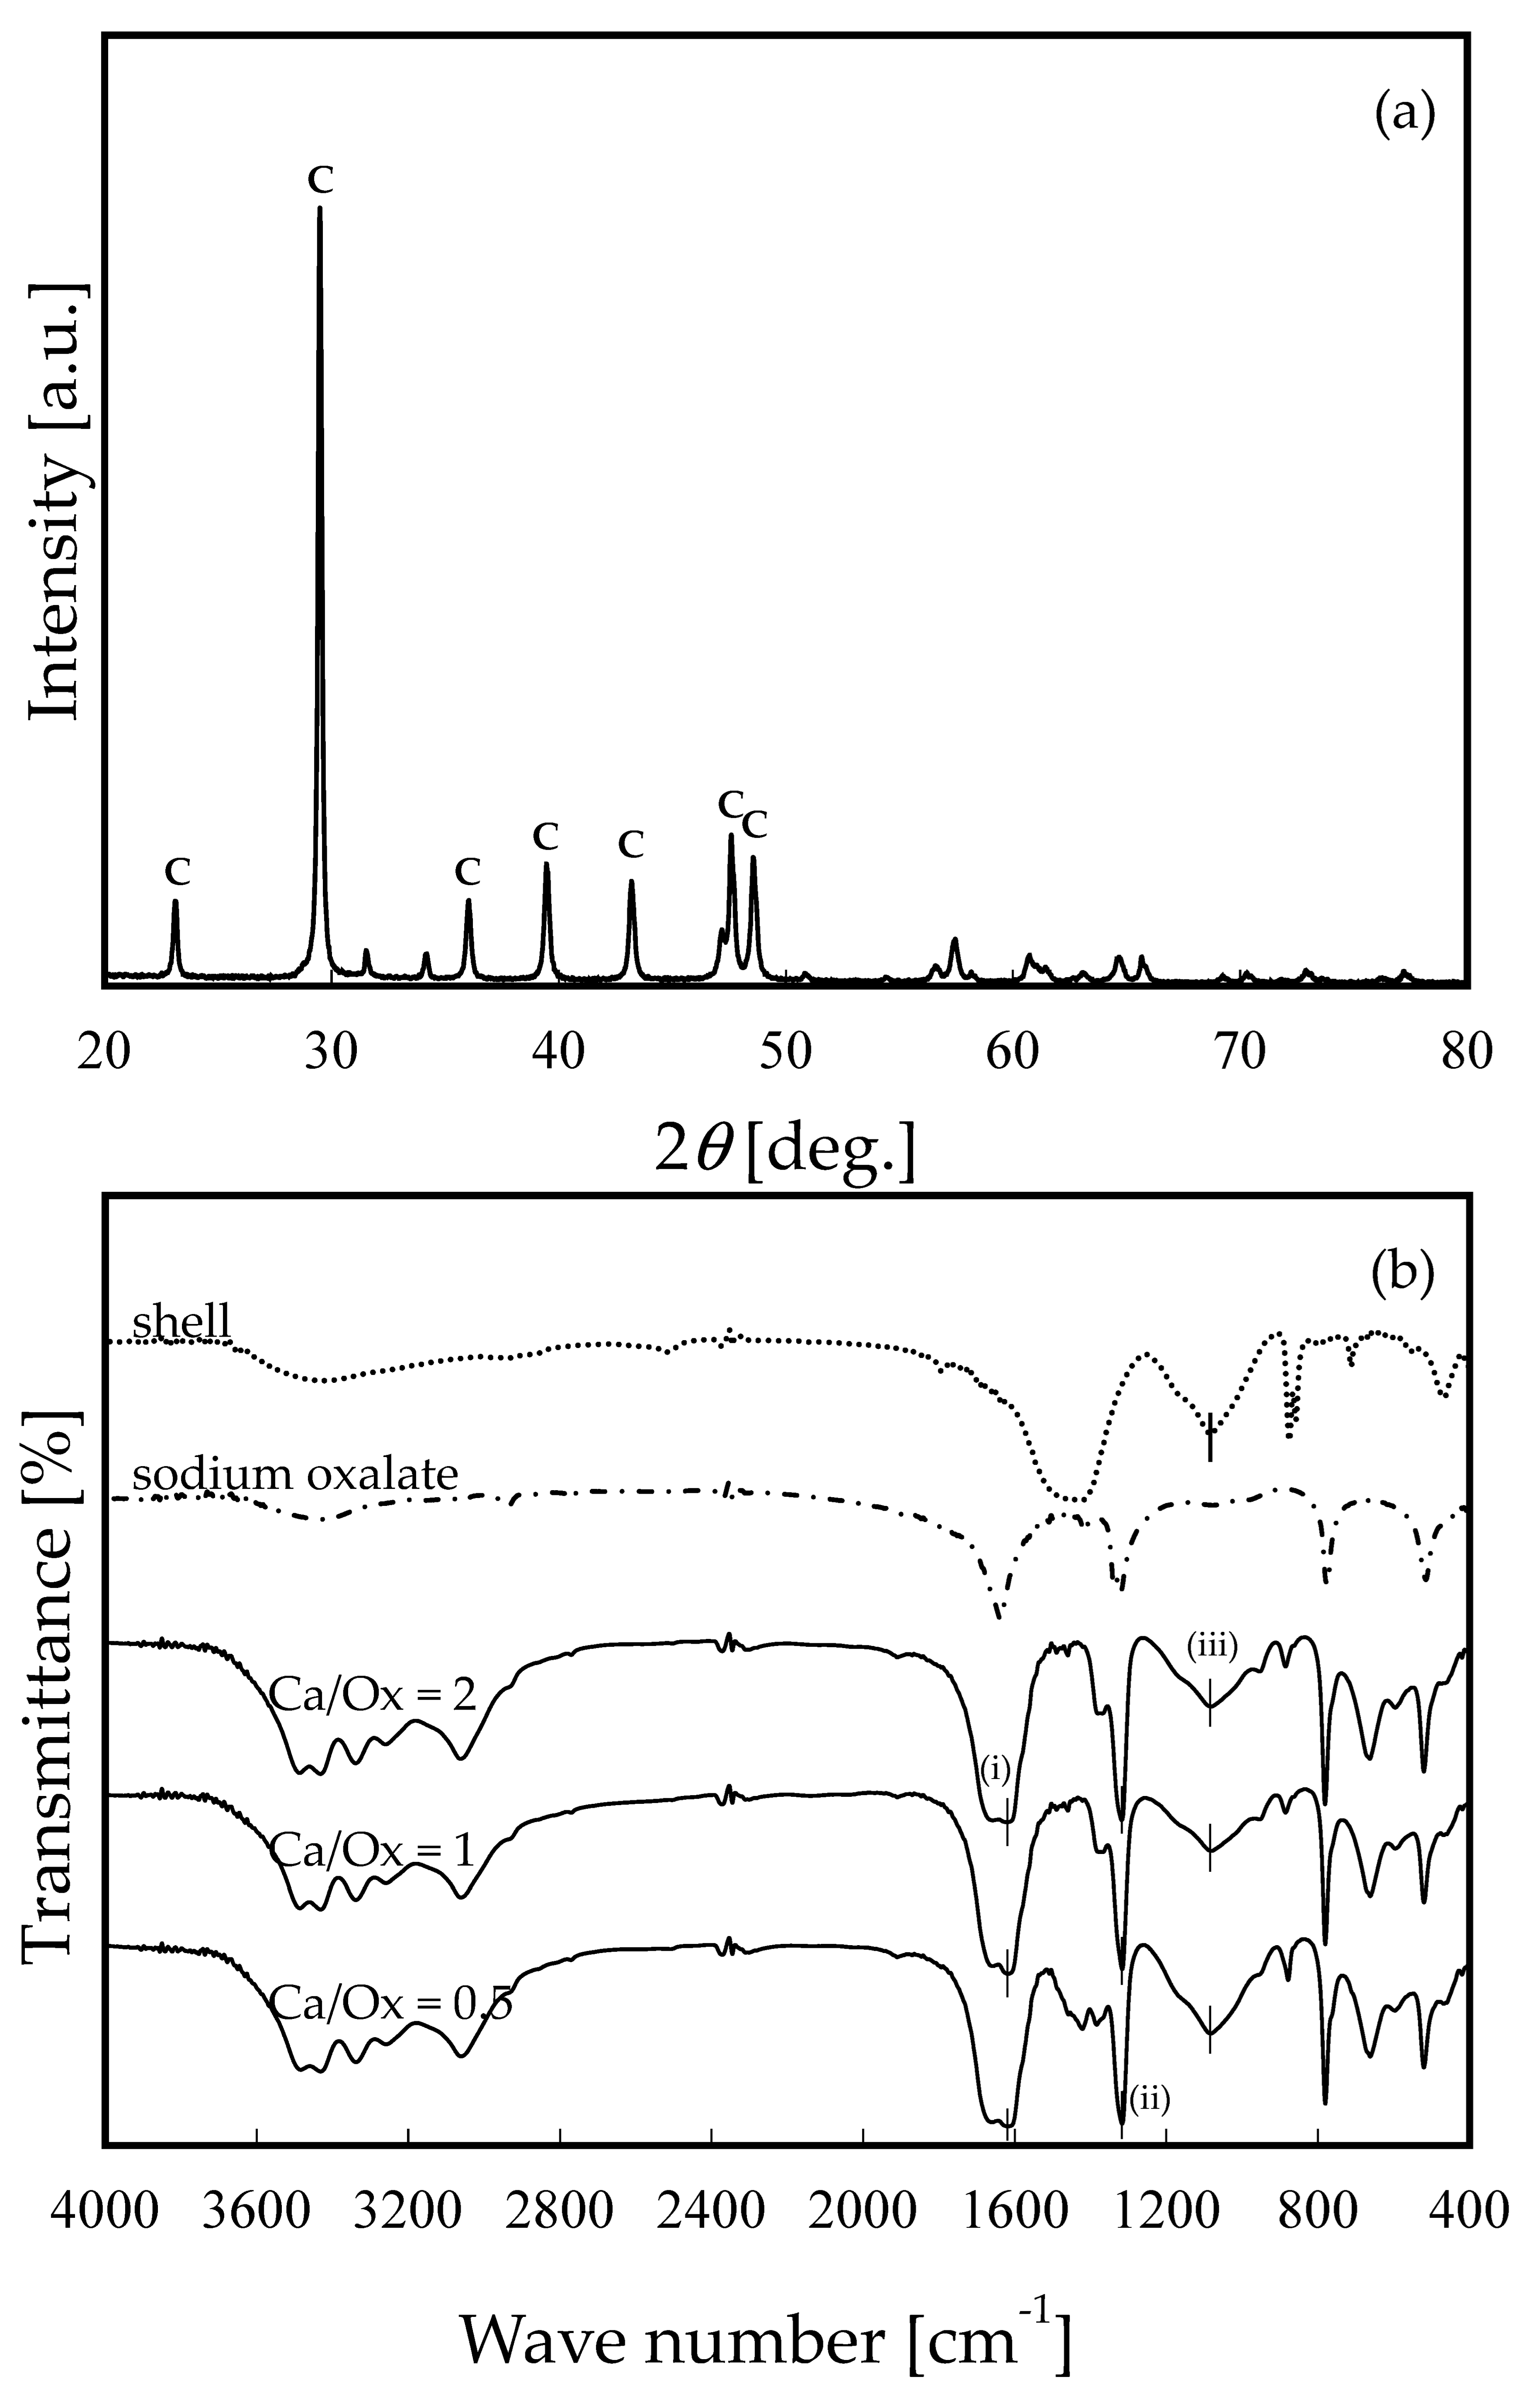
Figure 1 shows SEM images of the OS adsorbent. On the morphological observation by SEM image, most of the OS adsorbent particles were recognized as rectangular in shape. They were found to be partially aggregated. Their surface was also found to be non-porous. Figure 2 shows the size distribution of the OS adsorbent particles. Only OS0.5 had one peak (about 3 μm), while two peaks (about 2 and 40 μm) were observed for OS1.0 and OS2.0. Under the OS1.0 and OS2.0 preparation conditions, more aggregates are considered to have formed than in the case of OS0.5. The aggregation occurred as the amount of sodium oxalate added increased, but it is unclear how the variation in the sodium oxalate concentration was affected. The specific surface area based on volume was calculated at the same time as the measurement of the particle size distribution by data processing. According to these calculations, these values were 1.78 × 10⁴, 3.10 × 10⁴, and 2.45 × 104 cm2/cm3 for OS0.5, OS1.0, and OS2.0, respectively. Based on the average value of the reported scallop shell density (2.53 g/cm3) [30,31], the specific surface areas of the OS adsorbents were estimated as 0.703, 1.22, and 0.966 m2/g for OS0.5, OS1.0, and OS2.0, respectively. These values were considered to be relatively small. Figure 3a shows a typical result of XRD pattern of OS1.0. The XRD patterns of OS0.5 and OS2.0 were mostly the same as that of OS1.0, so the data are not shown. The letter C in Figure 3a indicates the characteristic peak of calcite (JCPDF: 01-078-4614, 04-008-0788). Other characteristic peaks were not observed. No other morphs were observed in the mechanochemical reaction via the addition of sodium oxalate in this study. The XRD pattern was the same as that of crushed shells. Figure 3b shows the FT-IR spectrum of a waste shell-based adsorbent prepared by ball milling. The FT-IR spectra of the shells (top row) and the reagent sodium oxalate (second from the top) are shown together as reference spectra. The FT-IR spectra of the prepared adsorbents are shown in the third, fourth, and fifth rows of the same figure. The horizontal axis is the wave number and the vertical axis is the transmittance (arbitrary unit). The characteristic absorption peak common to shell and adsorbent OS is 1080(iii), and the characteristic absorption peaks common to sodium oxalate and adsorbent OS are 1317(ii) and 1617(i).
The FT-IR spectra of the crushed shell particles were in good agreement with the measured results of Wang et al. (2021) and Giordano et al. (2022) [20,32]. In addition, the FT-IR spectrum of sodium oxalate was in good agreement with the IR spectra in the databases (AIST, NIST, and SpectraBase). Lu et al. (2015) reported that the peak at 1082 cm−1 indicated the internal vibrational mode of the carbonate ions in shell powders. [27]. Islam et al. (2013) observed the absorption peak at 1082 cm−1 related to CO32− in shell powders [33,34]. Leukel et al. (2018) reported that the ball-milled amorphous calcium carbonate showed the symmetric stretching vibrational mode, which was observed at 1071 cm−1 in the FI-IR spectrum and 1081 cm−1 in Raman spectrum [35]. Ouyang et al. (2003) reported that the main antisymmetric carbonyl stretching band (COO−) specific to the oxalate family occurs at 1618 cm−1, and the secondary carbonyl stretching band, the metal carboxylate stretching band, occurs at 1317 cm−1 [36]. Parekh et al. reported that the peak at 1613 cm−1 indicates the presence of more than one C=O bond [37].
Based on previous studies of the absorption peaks mentioned above, it can be inferred that the peak at 1080 is derived from scallop shells, and that the absorption peaks at 1316 and 1617 are carboxyl groups derived from sodium oxalate. In other words, the possibility is suggested that sodium oxalate-derived carboxyl groups on the surface of the shell particles are modified by our preparation method. This also suggests that a mechanochemical reaction occurred by ball milling.
It has been already reported that crushed shell particles alone have the ability to adsorb heavy metal ions. In this study, we experimentally investigated the adsorption capacity of the OS adsorbent prepared in this study by conducting actual adsorption experiments. In the next section, we report on the adsorption behavior of lead ions on the OS adsorbent prepared in this study, especially the adsorption rate and adsorption equilibrium relationship.
3.2. Adsorption Kinetics of Pb Ions onto OS Adsorbents
The adsorption rate experiments were conducted to investigate the adsorption kinetics of Pb ions onto OS adsorbents. Figure 4 shows the time course of the change in the amount of Pb adsorbed for the prepared adsorbents OS0.5, OS1.0, and OS2.0, respectively. The measurement points shown in Figure 4a–c are very close to each other, and we have deliberately presented them as separate graphs because we believe that superimposing these graphs would be very difficult to read. In addition, the result of the time course of the amount of Pb adsorbed using non-modified shell particles (control) is also shown in Figure 4b. The experimental conditions were the liquid volume of 100 mL, the initial Pb ion concentration of ca. 3 × 10⁻³ mol/L, and the OS adsorbent mass of ca. 0.02 g, respectively. At the beginning of each adsorption experiment, the pH values of the liquid phase were prepared in the range of 4.95–5.05, and the pH values of the liquid phase at each measurement time were in the range of 4.57–4.7. In all adsorption rate experiments, as shown in Figure 4, the adsorption equilibrium was reached in 180 min. As described later, the initial concentration of ca. 3 × 10⁻³ mol/L is a relatively large value for the initial concentration in this study, judging from the equilibrium concentration. In the case of the initial concentration being set lower than 3 × 10⁻³ mol/L, the adsorption equilibrium was also reached in 180 min (data are not shown). In the case of using non-modified shell particles, the equilibrium amount of Pb adsorbed was lower than that using OS adsorbents, resulting in the amount adsorbed being 0.11 times of that of OS adsorbents. This difference in the amount adsorbed might be caused by the fact that that OS adsorbents have modified adsorption sites that are negatively charged. On the other hand, the shell particles that are only pulverized also have the adsorption sites negatively charged; however, the number of the adsorption sites was lower than that of OS adsorbents.
The results of the FT-IR measurements shown in Figure 3b suggest that the carboxyl groups modified on the surface of the prepared OS adsorbent were modified by mechanochemical reactions in the ball mill grinding field. The majority of the carboxyl groups are expected to be negatively charged based on the pH of the liquid phase in these adsorption rate experiments. Therefore, it is most likely that the adsorption sites for Pb ions are modified carboxyl groups on the surface of the OS adsorbents. Since a plateau region of the amount of Pb ions adsorbed was observed in the range of 180–600 min from the results of the adsorption rate experiment (Figure 4a–c), the Langmuir-type adsorption rate equation was attempted to be applied to the experimental results. The Langmuir-type adsorption rate equation is expressed by the following equation.
where ka [L/(mol min)] and kd [min−1] represent the adsorption rate constant and the desorption rate constant of the Langmuir rate equation (Equation (3)). By fitting of the data shown in Figure 4a–c to Equation (3), ka, kd, and Xe were determined from a least-squares regression. In this calculation of the least-squares regression, the values of ka, kd, and Xe were determined by giving the average values of the liquid phase concentrations at times 90, 180, and 600 min as the values of Ce in Equation (3). The values are 1.84 × 10⁻³ mol/L, 1.75 × 10⁻³ mol/L, and 1.75 × 10⁻³ mol/L for OS0.5, OS1.0, and OS2.0, respectively. The values determined by the least-squares regression by using Equation (3) are shown in the upper part of Table 1. Table 1 also shows the coefficient of determination R2. The solid curves in Figure 4a–c are calculated values using Equation (3), with the adsorption rate constants determined by the least-squares regression. It can be confirmed that the calculation values are in good agreement with the experimental values. The coefficient of determination, R2, is greater than 0.994 for OS0.5, OS1.0, and OS2.0 adsorbents, which confirms good agreement between the experimental and calculated values. On the other hand, the results obtained using non-modified shell particles did not agree well with the Langmuir rate model. The values of adsorption rate constants, ka, for each adsorbent were not significantly different, but the value of desorption rate constant, kd, for OS0.5 was the largest, while those values for OS1.0 and OS2.0 were almost the same. This tendency will be mentioned again in the explanation of the adsorption equilibrium relationship described below.
Xt = Xe [1 − exp(−(kaCe + kd)t)]
3.3. Adsorption Equilibrium Relationship between Pb Ions and Surface of OS Adsorbents
Figure 5 shows the adsorption isotherms obtained for each adsorbent (OS0.5, OS1.0, and OS2.0), that is, the relationship between the equilibrium concentration and the equilibrium number of Pb ions adsorbed. The horizontal axis is the equilibrium concentration, Ce [mol/L], and the vertical axis is the equilibrium number of Pb ions adsorbed, Xe [mol/g]. In the equilibrium concentration range of approximately 0.6 × 10⁻³ mol/L or higher, a plateau region can be observed where the saturated adsorption amount seems to have been reached experimentally. Judging from the fact that the experimentally obtained adsorption isotherm profiles and the adsorption rate profiles were also well explained by the Langmuir-type adsorption rate equation, it is safe to assume that the adsorption equilibrium relationship is also followed by Langmuir-type isotherm. Langmuir adsorption isotherm is expressed by the following equation.
where, K and Xs represent the equilibrium adsorption constant and the saturated amount of Pb ions adsorbed, respectively. By fitting of the data shown in Figure 5 to Equation (4), the adsorption parameters, K and Xs can be determined by using a least squares regression. The estimated values of the Langmuir’s adsorption parameters, K and Xs, are summarized in the lower part of Table 1. The coefficient of determination, R2, was slightly lower than in the case of fitting to the velocity equation, with 0.960 being the lowest value. The solid curves in Figure 5a–c correspond to the calculated values calculated by using the determined adsorption parameters, K and Xs. As seen in Figure 5a–c, the experimental and calculated values are in very good agreement for the adsorbents, OS0.5, OS1.0, and OS2.0. Table 1 showed that the saturated adsorption volume, Xs, increases with increasing molar ratio in the preparation of the adsorbent. By plotting the molar ratio on the horizontal axis and the saturated amount adsorbed, Xs, on the vertical axis, a linear relationship was obtained, and the equation of the linear relationship was determined by a least square regression is as follows (graph not shown).
Xe = KXsCe/(1 + KCe)
Xs = 5.14×10⁻⁴ (molar ratio) + 5.21×10⁻³ (R2 = 0.997)
The coefficient of determination is very high at 0.997, indicating that a very good linear relationship is obtained in the range where the preparation was conducted. The maximum molar ratio of 2:1 employed for the preparation in this study would have been within the range in which the carboxyl group modification would not reach the saturated state. It can be seen that the saturated adsorption value estimated from the model, as well as the experimental value, shows an adsorption value of ca. 5–6 × 10⁻³ mol/g. Wang et al. (2021) reported that the amount of Pb2+ adsorbed was in the range of 1.9 × 10⁻⁴–3.0 × 10⁻⁴ mol/g in pH 5.5–6.5 using calcined mussel shell-based adsorbent [20]. Tang et al. (2022) reported that the maximum amount of Pb2+ adsorbed was 8.0 × 10⁻⁴ mol/g using Fe–Mn oxide-modified biochar [38]. Ariffin et al. (2017) prepared hydroxyapatite from bulk shells for lead ion adsorption and reported that the adsorption equilibrium relationship followed the Langmuir-type and the saturated adsorption capacity was 74.63 mg/g (3.6 × 10⁻⁴ mol/g) [39]. Harripersadth et al. (2020) carried out the adsorption of Pb2+ using eggshell and reported that the removal efficiency of Pb was constant (100% removal) in the range of pH 3–7, the equilibrium adsorption isotherm was well fitted to the Langmuir adsorption model, and the maximum adsorption density of Pb was 277 mg/g (1.33 × 10⁻³ mol/g) [40]. Okolo et al. (2020) performed Pb ion adsorption using adsorbents prepared from Africa elemi seed (AES), mucuna shell (MS), and oyster shell (OS) that were surface modified with phosphoric acid and showed a maximum adsorption of 4.83 × 10⁻⁴ mol/g at 100 mg of adsorbent for all adsorbents [41]. Many previous studies have reported that the adsorption equilibrium relationship for lead ion adsorption on shell-based adsorbents can be explained by the Langmuir-type. The number of Pb ions adsorbed confirmed in this study is considerably larger than that of reported waste shell-based adsorbents and biosorbents made of other materials.
The adsorption equilibrium constant can be regarded as a value that indicates the adsorption strength between the adsorbent and the adsorption sites. The adsorption equilibrium constant is defined as the ratio of the adsorption rate constant to the desorption rate constant (ka/kd) for the Langmuir adsorption equilibrium. The adsorption site of the adsorbent prepared in this study is likely to be a carboxyl group, and when the liquid phase equilibrium pH is almost the same, the state of the carboxyl group is also almost the same, and the strength of the binding force between the adsorption site (carboxyl group) and the Pb ions can be considered to be almost the same regardless of the adsorbent preparation conditions However, the adsorption strength of the Pb ions is almost the same regardless of the adsorbent preparation conditions. However, the value of the adsorption equilibrium constant determined by fitting to Equation (4) increases with increasing molar ratio in the preparation. The ratio of the adsorption rate constant to the desorption rate constant (ka/kd) is shown in the adsorption rate parameter orchid. The values are almost equal to the values of the adsorption equilibrium constants determined from adsorption equilibrium experiments. The fact that the values of the adsorption equilibrium constants derived from different experiments are equal suggests that the adsorption mechanism (Langmuir-type adsorption) is not misinterpreted. However, it is very difficult to interpret the fact that the value of the adsorption equilibrium constant increases with the increase of the molar ratio during the preparation. We believe that further detailed studies are needed.
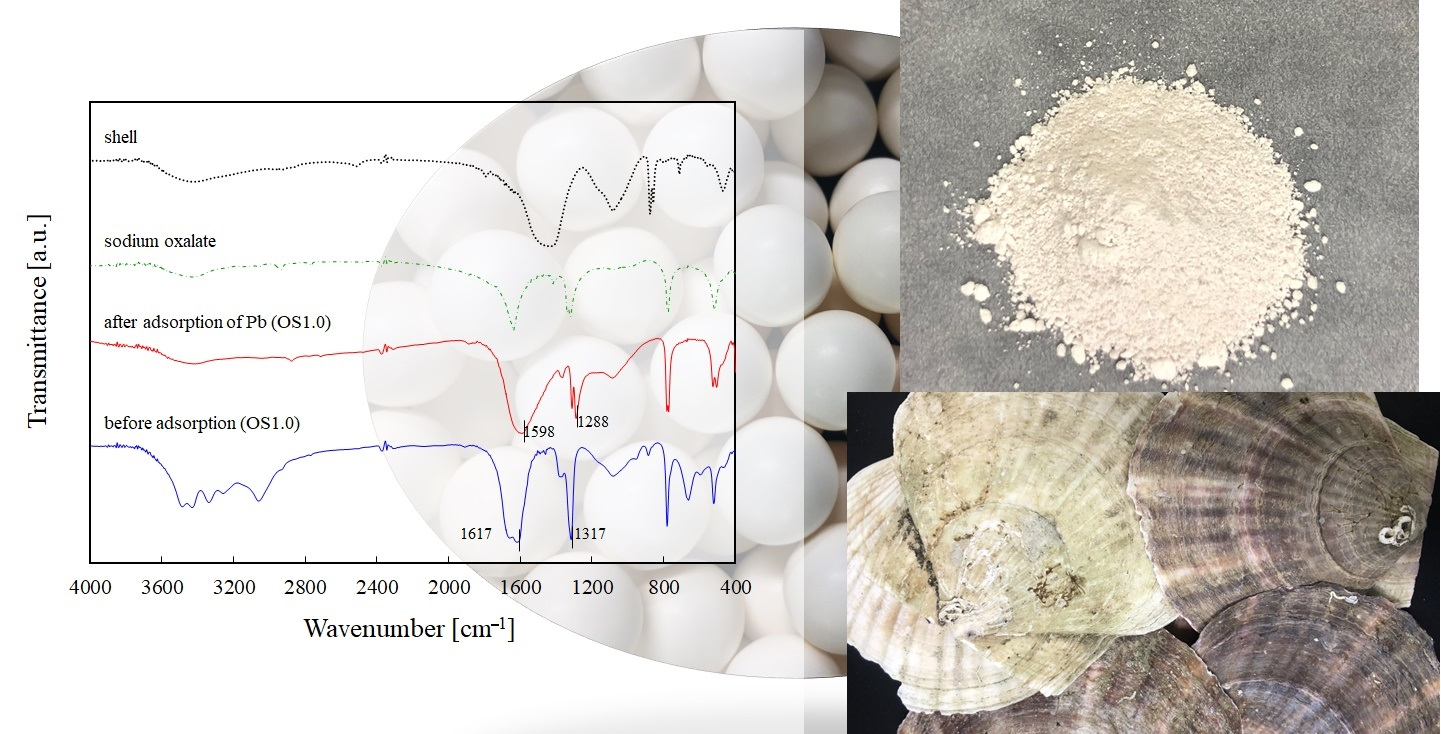
Figure 6 shows a typical example of the comparison of FT-IR spectra of the adsorbents prepared in this study before and after adsorption of Pb ions. OS1.0 is shown as an example adsorbent. The second chart from the bottom is the FT-IR spectrum of the adsorbent after adsorption of Pb ions, and the others are shown for comparison and are the same data as the spectrum shown in Figure 3b. Figure 6 shows that the absorption peak at wave number 1617 cm−1 has shifted to 1598 cm−1, and similarly, the absorption peak at wave number 1317 cm−1 has shifted to wave number 1288 cm−1. The shift widths of both absorption peak shifts are the same at a wave number of 29 cm−1. This phenomenon of shifting of the IR absorption peak of the functional group considered to be the adsorption site when heavy metal ions are adsorbed on the adsorbent has often been reported. Feng et al. (2009) reported that the absorption peak indicating the OH of the adsorbent after Cu(II) adsorption shifted from wave number of 3400 cm−1 to 3449 cm−1 using biosorbent chemically modified with citrus peel [42]. Petrović et al. (2016) performed lead ion adsorption experiments using corn silk (Zea mays L.) as an adsorbent and reported that after Pb ion adsorption, the peak representing the OH group of the adsorbent shifted from 3287 cm−1 to 3331 cm−1 [43]. Ezeonuegbu et al. (2021) conducted Ni and Pb ion adsorption experiments using sugarcane bagasse as an adsorbent and reported a shift of all six peaks, including a shift of the absorption peak wave number indicating the carboxyl groups from 1602 cm−1 to 1636 cm−1 [44]. Zhang et al. (2018) conducted Cd adsorption experiments using plant (Solidago canadensis) stems as a biosorbent and reported a shift in the absorption peak indicating phenolic group OH [45]. In the case of this study, the absorption peaks at wave numbers of 1617 cm−1 and 1317 cm−1 are peaks involving carboxyl groups, and it can be assumed that Pb ions are probably adsorbed with carboxyl groups derived from sodium oxalate modified on the shell surface.
4. Conclusions
The carboxyl groups on the surface of waste scallop shell particles were modified by a mechanochemical reaction using ball milling with sodium oxalate. The carboxyl group modification was confirmed by FT-IR spectra. Comparison of the FT-IR spectra of the adsorbent particles before and after adsorption confirmed that lead ions were adsorbed on the particle surface, as the absorption peak, which can be considered as originating from the carboxyl group was shifted after adsorption.
The adsorption behavior was well explained by the Langmuir-type model in terms of both adsorption rate and adsorption equilibrium relationship. As the molar ratio in the preparation increased, the saturated adsorption amount estimated by the model also increased slightly from 5.45 × 10⁻³ mol/g (OS0.5) to 6.23 × 10⁻³ mol/g (OS1.0). It was also found to be about 8.9 times larger than the equilibrium adsorption amount when unmodified shells were used. The adsorption equilibrium constant also increased with increasing molar ratio in the preparation.
Further studies are required to clarify why this trend is observed, since the adsorption strength of the adsorbate and adsorbate seat is considered to be constant once the substance is determined. Experimental investigations are also needed to determine whether similar results can be obtained with other dicarboxylates.
Funding
Part of this study was financially supported by the South Hokkaido Science Promotion Foundation.
Data Availability Statement
Data will be made available on request.
Acknowledgments
The author gratefully acknowledges financial support provided by The South Hokkaido Science Promotion Foundation for a part of this study. The author gratefully appreciates Dr. Shiro Takahashi, Hokkaido Industrial Technology Center, for his technical support regarding SEM and XRD instruments. Author also appreciates Dr. Harumi Matsui, National Institute of of Technology, Hakodate Colloege for her technical guidance about measurement by FT-IR instrument. The author also appreciates Shinra Yoshida and Mizuki Ohsako, former students of the Department of Marine Bioresources Chemistry, Faculty of Fisheries, Hokkaido University, for their help and efforts in the experiments.
Conflicts of Interest
The author declares no known competing financial interests or personal relationships that could have appeared to influence the work reported in this paper.
Nomenclature
| Ce | equilibrium concentration of Pb ions [mol/m3] |
| Ci | initial concentration of of Pb ions [mol/m3] |
| Ct | concentration of Pb ions at time, t [mol/m3] |
| K | equilibrium adsorption constant defined in Equation (4) [m3/mol] |
| ka | adsorption rate constant defined in Equation (3) [m3/(mol min)] |
| kd | desorption rate constant defined in Equation (3) [min−1] |
| m | mass of adsorbent [kg] |
| t | time [min] |
| Xe | equilibrium amount of Pb ions adsorbed [mol/kg] |
| Xs | saturated amount of Pb ions adsorbed defined in Equation (4) [mol/kg] |
| Xt | amount of Pb ions adsorbed at time, t [mol/kg] |
| V | volume of liquid [m3] |
References
- Ou, Z.; Li, J.; Wang, Z. Application of mechanochemistry to metal recovery from second-hand resources: A technical overview. Environ. Sci. Process. Impacts 2015, 17, 1522–1530. [Google Scholar] [CrossRef]
- Tsuzuki, T. Mechanochemical synthesis of metal oxide nanoparticles. Commun. Chem. 2021, 4, 143. [Google Scholar] [CrossRef]
- Dubadi, R.; Huang, S.D.; Jaroniec, M. Mechanochemical synthesis of nanoparticles for potential antimicrobial applications. Materials 2023, 16, 1460. [Google Scholar] [CrossRef]
- Alrbaihat, M. A review of solid state mechanochemistry for drug synthesis and modification. AIP Conf. Proc. 2023, 2834, 030019. [Google Scholar]
- Wu, K.; Ju, T.; Deng, Y.; Xi, J. Mechanochemical assisted extraction: A novel, efficient, eco-friendly technology. Trends Food Sci. Technol. 2017, 66, 166–175. [Google Scholar] [CrossRef]
- Fan, L.; Fan, W.; Mei, Y.; Liu, L.; Li, L.; Wang, Z.; Yang, L. Mechanochemical assisted extraction as a green approach in preparation of bioactive components extraction from natural products—A review. Trends Food Sci. Technol. 2022, 129, 98–110. [Google Scholar] [CrossRef]
- Amrute, A.P.; De Bellis, J.; Felderhoff, M.; Schüth, F. Mechanochemical Synthesis of Catalytic Materials. Chem. Eur. J. 2021, 27, 6819–6847. [Google Scholar] [CrossRef]
- Hu, Y.; Li, B.; Yu, C.; Fang, H.; Li, Z. Mechanochemical preparation of single atom catalysts for versatile catalytic applications: A perspective review. Mater. Today 2023, 63, 288–312. [Google Scholar] [CrossRef]
- Seyedi, M.; Haratian, S.; Khaki, J.V. Mechanochemical Synthesis of Fe2O3 Nanoparticles. Procedia Mater. Sci. 2015, 11, 309–313. [Google Scholar] [CrossRef]
- Molla, A.; Youk, J.H. Mechanochemical synthesis of graphitic carbon nitride/graphene oxide nanocomposites for dye sorption. Dye. Pigment. 2023, 220, 111725. [Google Scholar] [CrossRef]
- Tamjidi, S.; Ameri, A. A review of the application of sea material shells as low cost and effective bio-adsorbent for removal of heavy metals from wastewater. Environ. Sci. Pollut. Res. 2020, 27, 31105–31119. [Google Scholar] [CrossRef]
- AbiD, B.A.; BrbootI, M.M.; Al-ShuwaikI, N.M. Removal of heavy metals using chemicals precipitation. Eng. Technol. J. 2011, 29, 595–612. [Google Scholar] [CrossRef]
- Al-Enezi, G.; Hamoda, M.F.; Fawzi, N. Ion exchange extraction of heavy metals from wastewater sludges. J. Environ. Sci. Health Part A 2011, 39, 455–464. [Google Scholar] [CrossRef]
- Birniwa, A.H.; Habibu, S.; Abdullahi, S.S.; Mohammad, R.E.A.; Hussaini, A.; Magaji, H.; Al-Dhawi, B.N.S.; Noor, A.; Jagaba, A.H. Membrane technologies for heavy metals removal from water and wastewater: A mini review. Case Stud. Chem. Environ. Eng. 2024, 9, 100538. [Google Scholar] [CrossRef]
- Sun, Y.; Zhou, S.; Pan, S.-Y.; Zhu, S.; Yu, Y.; Zheng, H. Performance evaluation and optimization of flocculation process for removing heavy metal. Chem. Eng. J. 2019, 385, 123911. [Google Scholar] [CrossRef]
- Yang, L.; Hu, W.; Chang, Z.; Liu, T.; Fang, D.; Shao, P.; Shi, H.; Luo, X. Electrochemical recovery and high value-added reutilization of heavy metal ions from wastewater: Recent advances and future trends. Environ. Int. 2021, 152, 106512. [Google Scholar] [CrossRef]
- Bozbaş, S.K.; Boz, Y. Low-cost biosorbent: Anadara inaequivalvis shells for removal of Pb(II) and Cu(II) from aqueous solution. Process. Saf. Environ. Prot. 2016, 103, 144–152. [Google Scholar] [CrossRef]
- Khankhaje, E.; Kim, T.; Jang, H.; Rafieizonooz, M. Laboratory evaluation of heavy metal removal from stormwater runoff by pervious concrete pavement containing seashell and oil palm kernel shell. Constr. Build. Mater. 2023, 400, 132648. [Google Scholar] [CrossRef]
- Bulut, A.; Yusan, S.; Aytas, S.; Sert, S. The use of sea shell (Donax trunculus) powder to remove Sr(II) ions from aqueous solutions. Water Sci. Technol. 2018, 78, 827–836. [Google Scholar] [CrossRef] [PubMed]
- Wang, Q.; Jiang, F.; Ouyang, X.-K.; Yang, L.-Y.; Wang, Y. Adsorption of Pb(II) from Aqueous Solution by Mussel Shell-Based Adsorbent: Preparation, Characterization, and Adsorption Performance. Materials 2021, 14, 741. [Google Scholar] [CrossRef] [PubMed]
- Esmaeili, H.; Tamjidi, S.; Abed, M. Removal of Cu(II), Co(II) and Pb(II) from synthetic and real wastewater using calcified Solamen Vaillanti snail shell. Desalination Water Treat. 2020, 174, 324–335. [Google Scholar] [CrossRef]
- Allaoui, M.; Berradi, M.; Bensalah, J.; Es-Sahbany, H.; Dagdag, O.; Ibn Ahmed, S. Study of the adsorption of nickel ions on the sea shells of Mehdia: Kinetic and thermodynamic study and mathematical modelling of experimental data. Mater. Today Proc. 2021, 45, 7494–7500. [Google Scholar] [CrossRef]
- Li, T.; Xin, R.; Wang, D.; Yuan, L.; Wu, D.; Wu, X. Research Progress on the Applications of Seashell Adsorption Behaviors in Cement-Based Materials. Buildings 2023, 13, 1289. [Google Scholar] [CrossRef]
- Ketwong, C.; Trisupakitti, S.; Nausri, C.; Senajuk, W. Removal of heavy metal from synthetic wastewater using calcined golden apple snail shells. Naresuan Univ. J. Sci. Technol. 2018, 26, 61–70. [Google Scholar] [CrossRef]
- Pérez, B.F.; Espina, J.A.; Fernández González, M.L.Á. Adsorption of Heavy Metals Ions from Mining Metallurgical Tailings Leachate Using a Shell-Based Adsorbent: Characterization, Kinetics and Isotherm Studies. Materials 2022, 15, 5315. [Google Scholar] [CrossRef]
- Rehan, U.S.M.; Zahir, E.; Asghar, M.A. A prudent approach for the removal of copper (II) and cadmium (II) ions from aqueous solutions using indigenous Mactra aequisulcata shells. J. Serbian Chem. Soc. 2021, 86, 767–780. [Google Scholar] [CrossRef]
- Lu, J.; Lu, Z.; Li, X.; Xu, H.; Li, X. Recycling of shell wastes into nanosized calcium carbonate powders with different phase compositions. J. Clean. Prod. 2015, 92, 223–229. [Google Scholar] [CrossRef]
- Lu, J.; Cong, X.; Li, Y.; Hao, Y.; Wang, C. Scalable recycling of oyster shells into high purity calcite powders by the mechanochemical and hydrothermal treatments. J. Clean. Prod. 2018, 172, 1978–1985. [Google Scholar] [CrossRef]
- Kurosaki, Y. Graduate School of Fisheries Sciences. Master’s Thesis, Hokkaido University, Hokkaido, Japan, 2021. (In Japanese). [Google Scholar]
- Sugata, N.; Watanabe, S. Poous Concrete with Crashed Scallop Shell; Japan Society of Civil Engineers: Tokyo, Japan, 2007; Volume 64, p. E-6. (In Japanese) [Google Scholar]
- Kobayashi, K.; Nakafusa, S.; Matsumoto, K.; Kobayashi, N.; Morii, T.; Saka, E. Fundamental Study on Strength Oriperties and Particle Breakage of the Scallop Shell, Laboratory Technical Report (Tobishima Corporation). 2013; Volume 62, pp. 75–76. Available online: https://www.tobishima.co.jp/laboratory/technique/pdf/62/gihou_62-2013-15.pdf (accessed on 30 January 2024). (In Japanese).
- Giordano, L.; Ferraro, L.; Caroppo, C.; Rubino, F.; Buonocunto, F.; Maddalena, P. A method for bivalve shells characterization by FT-IR photoacoustic spectroscopy as a tool for environmental studies. MethodsX 2022, 9, 101672. [Google Scholar] [CrossRef] [PubMed]
- Islam, K.N.; Bin Abu Bakar, M.Z.; Ali, M.E.; Bin Hussein, M.Z.; Noordin, M.M.; Loqman, M.Y.; Miah, G.; Wahid, H.; Hashim, U. A novel method for the synthesis of calcium carbonate (aragonite) nanoparticles from cockle shells. Powder Technol. 2013, 235, 70–75. [Google Scholar] [CrossRef]
- Islam, K.N.; Bin Abu Bakar, Z.; Noordin, M.M.; Bin Hussein, M.Z.; Rahman, N.S.B.A.; Ali, E. Characterisation of calcium carbonate and its polymorphs from cockle shells (Anadara granosa). Powder Technol. 2011, 213, 188–191. [Google Scholar] [CrossRef]
- Leukel, S.; Panthöfer, M.; Mondeshki, M.; Kieslich, G.; Wu, Y.; Krautwurst, N.; Tremel, W. Tremel, Mechanochemical access to defect-stabilized amorphous calcium carbonate. Chem. Mater. 2018, 30, 6040–6052. [Google Scholar] [CrossRef]
- Ouyang, J.-M.; Duan, L.; Tieke, B. Effects of carboxylic acids on the crystal growth of calcium oxalate nanoparticles in lecithin-water liposome systems. Langmuir 2003, 19, 8980–8985. [Google Scholar] [CrossRef]
- Parekh, B.B.; Vyas, P.M.; Vasant, S.R.; Joshi, M.J. Thermal, FT–IR and dielectric studies of gel grown sodium oxalate single crystals. Bull. Mater. Sci. 2008, 31, 143–147. [Google Scholar] [CrossRef]
- Tang, S.-F.; Zhou, H.; Tan, W.-T.; Huang, J.-G.; Zeng, P.; Gu, J.-F.; Liao, B.-H. Adsorption characteristics and mechanisms of Fe-Mn oxide modified biochar for Pb(II) in wastewater. Int. J. Environ. Res. Public Health 2022, 19, 8420. [Google Scholar] [CrossRef] [PubMed]
- Ariffin, M.M.; Yatim, N.I.; Hamzah, S. Synthesis and charaterization of hydroxyapatite from bulk seashells and its potential usage as lead ions adsorbent. Malays. J. Anal. Sci. 2017, 21, 571–584. [Google Scholar] [CrossRef]
- Harripersadth, C.; Musonge, P.; Isa, Y.M.; Morales, M.G.; Sayago, A. The application of eggshells and sugarcane bagasse as potential biomaterials in the removal of heavy metals from aqueous solutions. S. Afr. J. Chem. Eng. 2020, 34, 142–150. [Google Scholar] [CrossRef]
- Okolo, B.I.; Oke, E.O.; Agu, C.M.; Adeyi, O.; Nwoso-Obieogu, K.; Akatobi, K.N. Adsorption of lead(II) from aqueous solution using Africa elemi seed, mucuna shell and oyster shell as adsorbents and optimization using Box–Behnken design. Appl. Water Sci. 2020, 10, 201. [Google Scholar] [CrossRef]
- Feng, N.-C.; Guo, X.-Y.; Liang, S. Kinetic and thermodynamic studies on biosorption of Cu(II) by chemically modified orange peel. Trans. Nonferrous Met. Soc. China 2009, 19, 1365–1370. [Google Scholar] [CrossRef]
- Petrović, M.; Šoštarić, T.; Stojanović, M.; Milojković, J.; Mihajlović, M.; Stanojević, M.; Stanković, S. Removal of Pb2+ ions by raw corn silk (Zea mays L.) as a novel biosorbent. J. Taiwan Inst. Chem. Eng. 2016, 58, 407–416. [Google Scholar] [CrossRef]
- Ezeonuegbu, B.A.; Machido, D.A.; Whong, C.M.; Japhet, W.S.; Alexiou, A.; Elazab, S.T.; Qusty, N.; Yaro, C.A.; Batiha, G.E.-S. Agricultural waste of sugarcane bagasse as efficient adsorbent for lead and nickel removal from untreated wastewater: Biosorption, equilibrium isotherms, kinetics and desorption studies. Biotechnol. Rep. 2021, 30, e00614. [Google Scholar] [CrossRef]
- Zhang, J.-W.; Bi, F.-Z.; Wang, Q.-J.; Wang, W.-L.; Liu, B.; Lutts, S.; Wei, W.; Zhao, Y.-P.; Wang, G.-X.; Han, R.-M. Characteristics and influencing factors of cadmium biosorption by the stem powder of the invasive plant species Solidago canadensis. Ecol. Eng. 2018, 121, 12–18. [Google Scholar] [CrossRef]
Figure 1.
SEM images of the OS adsorbents: OS0.5 (a,b), OS1.0 (c,d), and OS2.0 (e,f).
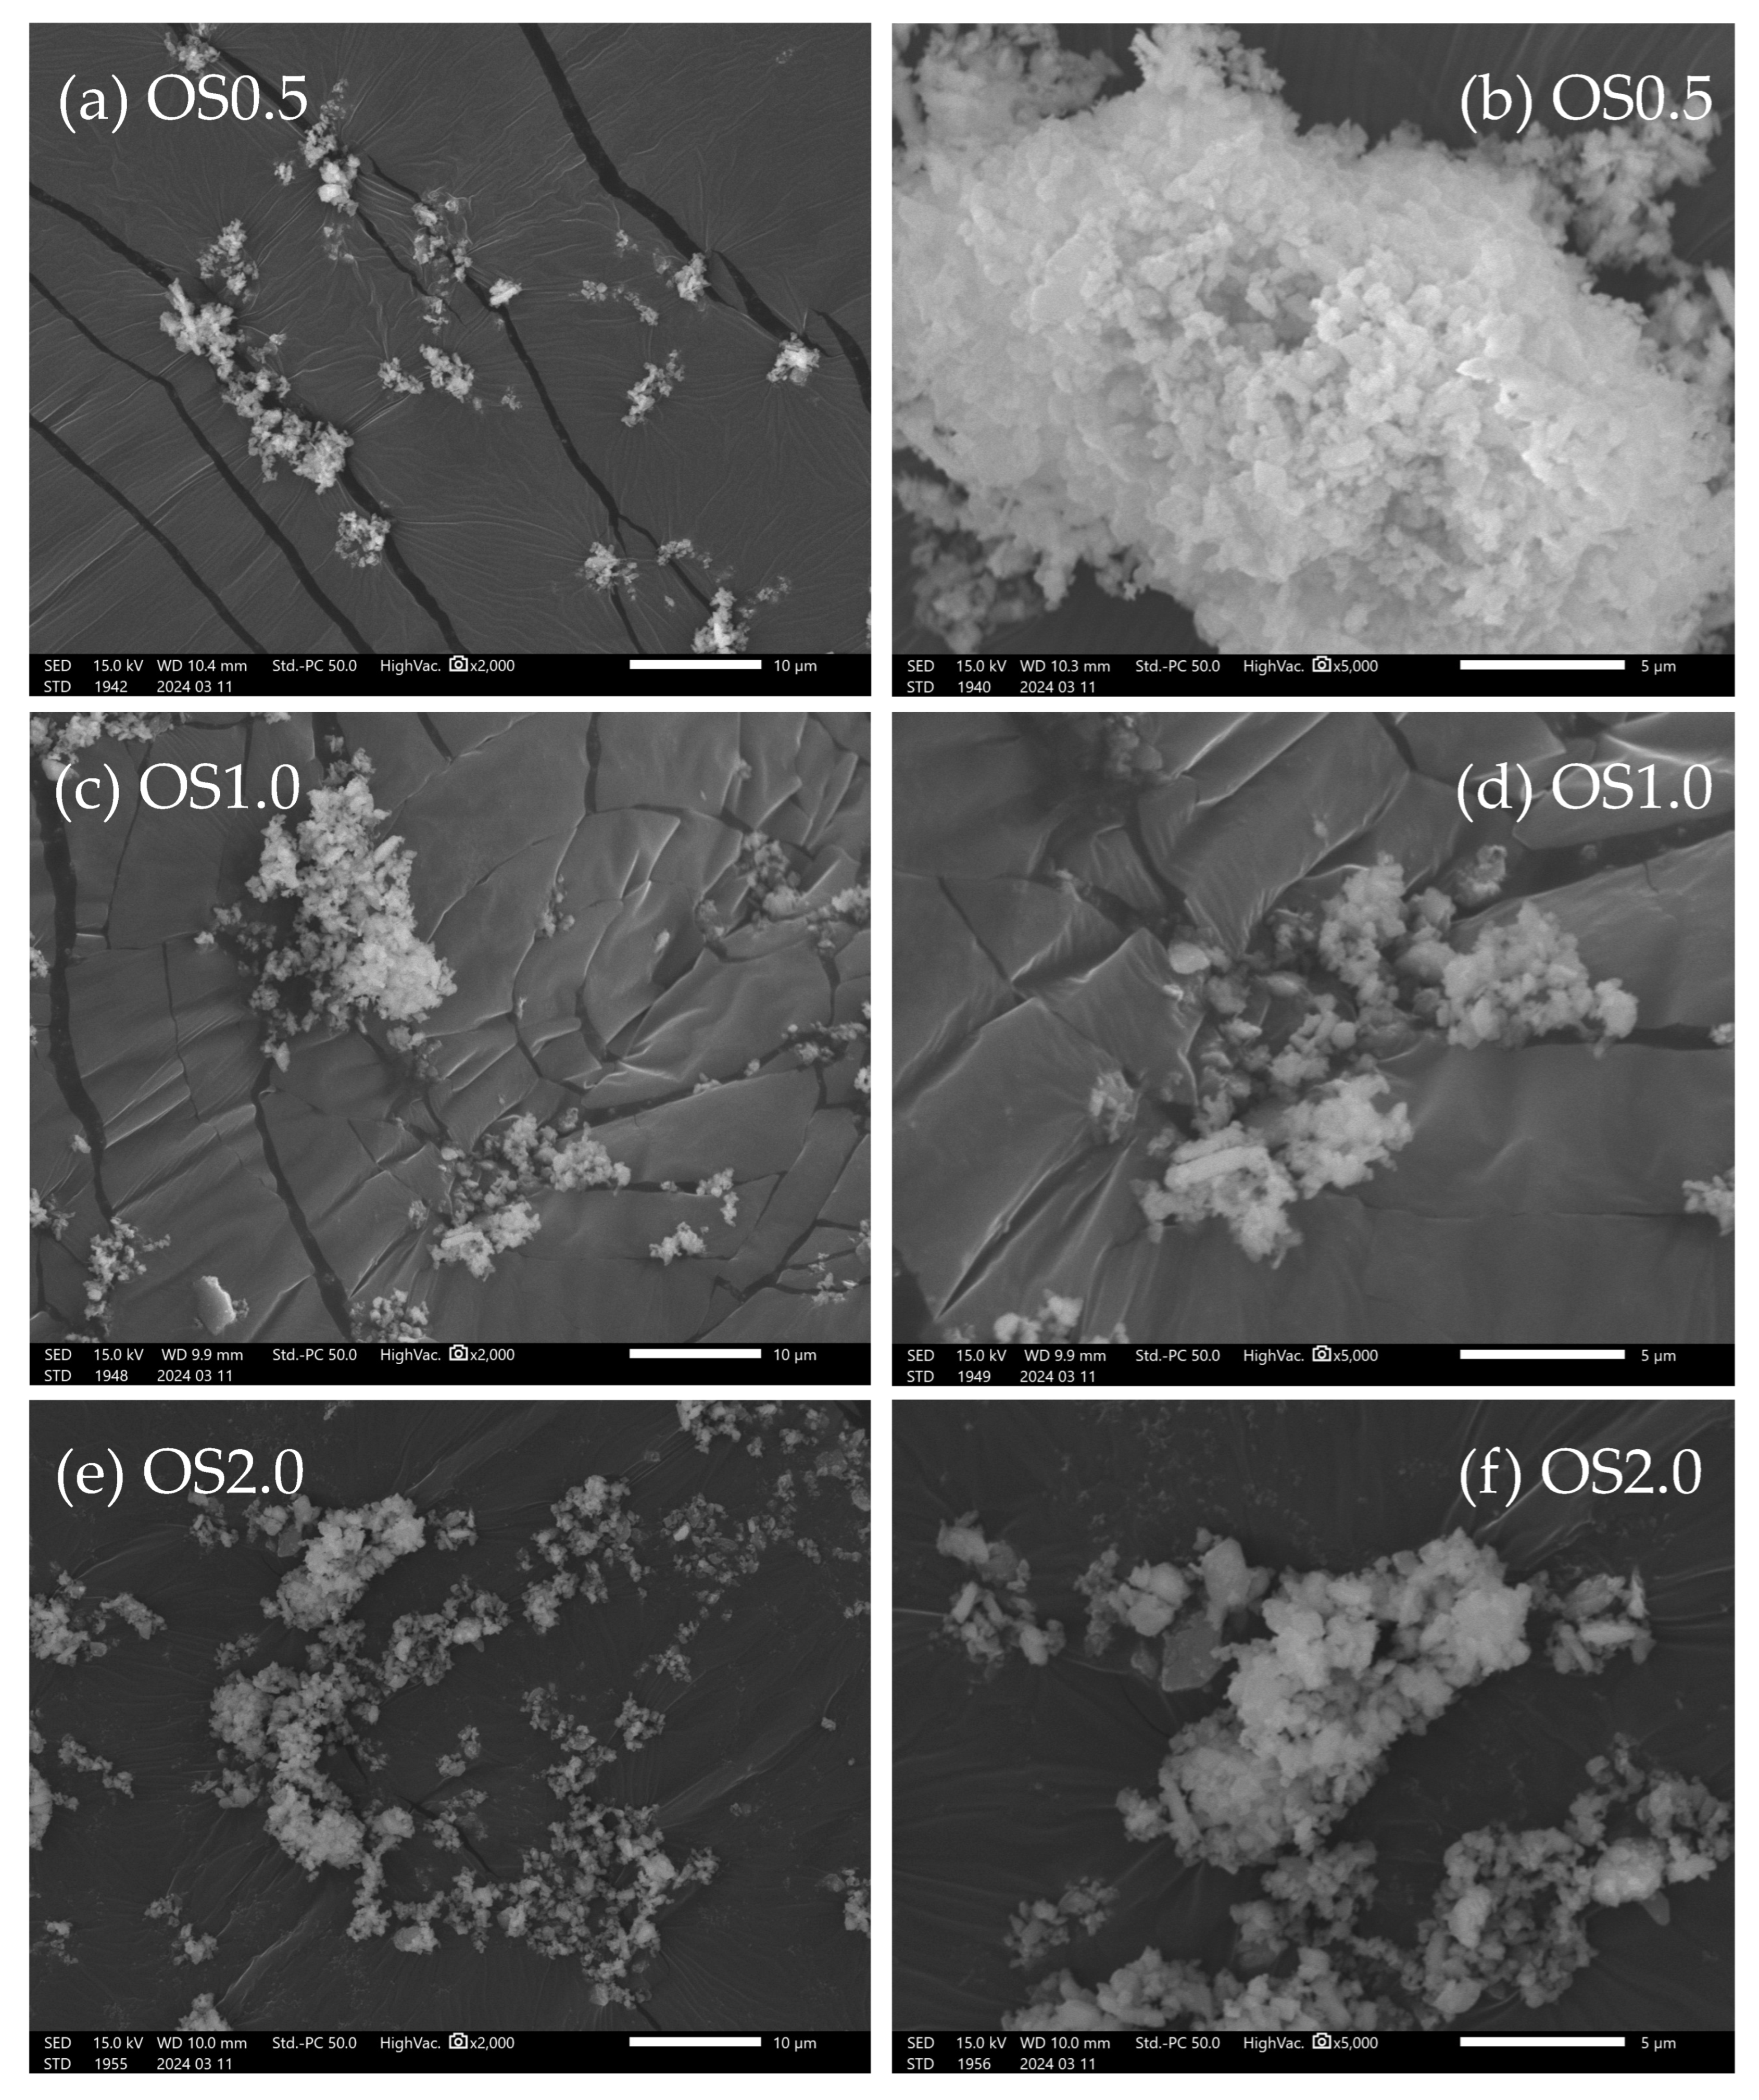
Figure 2.
Particle size distribution of (a) OS0.5, (b) OS1.0, and (c) OS2.0 adsorbents.

Figure 3.
(a) XRD pattern of OS1.0. The character C corresponds to the characteristic peak of calcite (JCPDF: 01-078-4614, 04-008-0788). (b) FT-IR spectra of the prepared adsorbent particles with varying molar ratio before adsorption experiments.
Figure 3.
(a) XRD pattern of OS1.0. The character C corresponds to the characteristic peak of calcite (JCPDF: 01-078-4614, 04-008-0788). (b) FT-IR spectra of the prepared adsorbent particles with varying molar ratio before adsorption experiments.

Figure 4.
Time course of the amount adsorbed of Pb onto (a) OS0.5, (b) OS1.0, and (c) OS2.0 adsorbents. The solid curves in the figures were the calculated values using adsorption kinetic parameters determined by fitting of the data to Langmuir adsorption rate equation expressed by Equation (3). The triangle symbol corresponds to the amount adsorbed of Pb onto a non-modified shell particles (control).
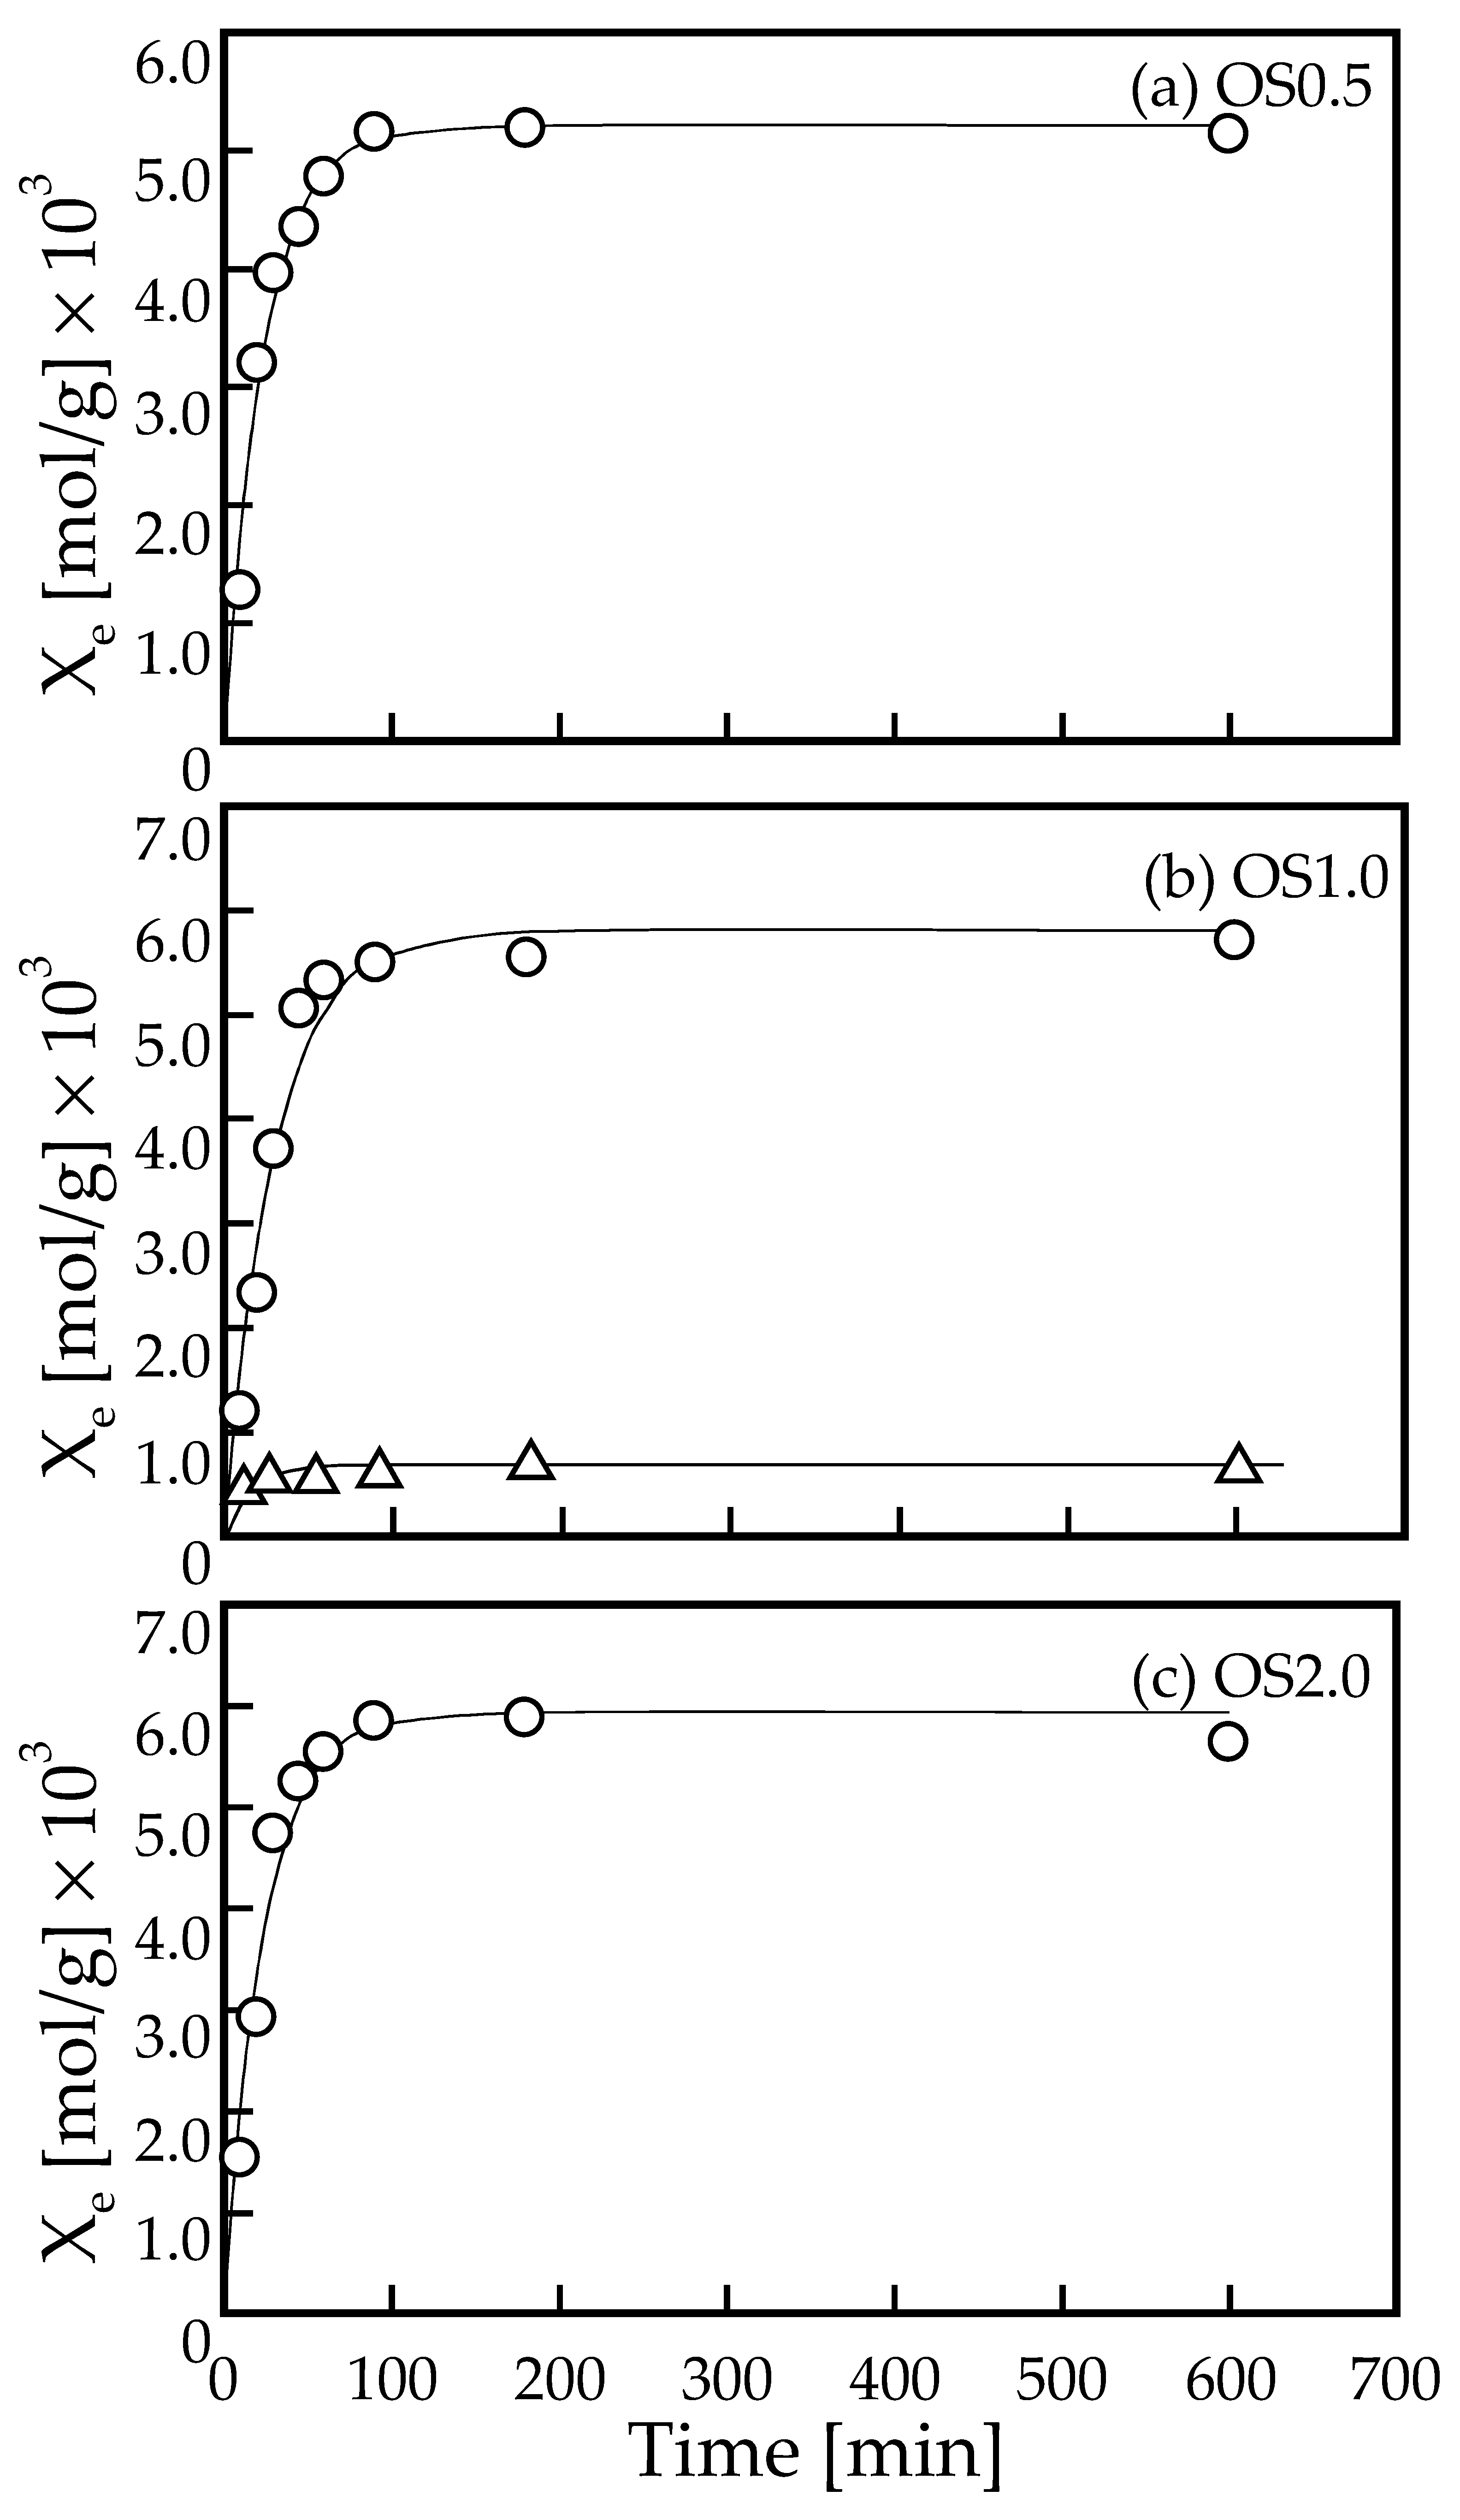
Figure 5.
The adsorption equilibrium relationships of (a) OS0.5, (b) OS1.0, and (c) OS2.0 adsorbents and Pb, respectively. The solid curves in the figures were the calculated values using adsorption parameters determined by fitting of the data to Langmuir adsorption isotherm expressed by Equation (4).

Figure 6.
Comparison of FT-IR spectra of before and after the adsorption of lead ions for OS1.0.


Table 1.
Adsorption parameters determined from Equations (3) and (4).
| Langmuir Adsorption Kinetics Parameters | |||||
|---|---|---|---|---|---|
| ka [L/(mol min)] | kd [min−1] | Xe [mol/g] | ka/kd [L/mol] | R2 | |
| OS0.5 | 22.48 | 6.99 × 10⁻⁴ | 5.21 × 10⁻³ | 3.21 × 10⁴ | 0.997 |
| OS1.0 | 18.78 | 3.50 × 10⁻⁴ | 5.80 × 10⁻³ | 5.36 × 10⁴ | 0.994 |
| OS2.0 | 23.43 | 3.51 × 10⁻⁴ | 5.93 × 10⁻³ | 6.67 × 10⁴ | 0.995 |
| shell (control) | 12.54 | 8.99 × 10⁻⁴ | 6.60 × 10⁻³ | 1.40 × 10⁴ | 0.579 |
| Langmuir isotherm parameters | |||||
| K [L/mol] | Xs [mol/g] | R2 | |||
| OS0.5 | 3.45 × 10⁴ | 5.45 × 10⁻³ | 0.991 | ||
| OS1.0 | 5.39 × 10⁴ | 5.75 × 10⁻³ | 0.961 | ||
| OS2.0 | 6.29 × 10⁴ | 6.23 × 10⁻³ | 0.960 | ||
Disclaimer/Publisher’s Note: The statements, opinions and data contained in all publications are solely those of the individual author(s) and contributor(s) and not of MDPI and/or the editor(s). MDPI and/or the editor(s) disclaim responsibility for any injury to people or property resulting from any ideas, methods, instructions or products referred to in the content. |
© 2024 by the author. Licensee MDPI, Basel, Switzerland. This article is an open access article distributed under the terms and conditions of the Creative Commons Attribution (CC BY) license (https://creativecommons.org/licenses/by/4.0/).
Share and Cite
MDPI and ACS Style
Maruyama, H. Preparation of Adsorbent from Mechanochemical Reaction-Based Waste Seashell with Sodium Oxalate and Its Application in Pb Ion Adsorption. Surfaces 2024, 7, 208-224. https://doi.org/10.3390/surfaces7020014
AMA Style
Maruyama H. Preparation of Adsorbent from Mechanochemical Reaction-Based Waste Seashell with Sodium Oxalate and Its Application in Pb Ion Adsorption. Surfaces. 2024; 7(2):208-224. https://doi.org/10.3390/surfaces7020014
Chicago/Turabian StyleMaruyama, Hideo. 2024. "Preparation of Adsorbent from Mechanochemical Reaction-Based Waste Seashell with Sodium Oxalate and Its Application in Pb Ion Adsorption" Surfaces 7, no. 2: 208-224. https://doi.org/10.3390/surfaces7020014