The Acoustic Environment of York Minster’s Chapter House


1
Department of Theatre, Film, Television and Interactive Media, University of York, York YO10 5GB, UK
2
Instituto Universitario de Arquitectura y Ciencias de la Construcción, Escuela Técnica Superior de Arquitectura, Universidad de Sevilla, 41012 Seville, Spain
*
Author to whom correspondence should be addressed.
Acoustics 2020, 2(1), 13-36; https://doi.org/10.3390/acoustics2010003
Submission received: 13 December 2019
/
Revised: 18 January 2020
/
Accepted: 27 January 2020
/
Published: 30 January 2020
(This article belongs to the Special Issue Historical Acoustics: Relationships between People and Sound over Time)
Abstract
:York Minster is the largest medieval Gothic cathedral in Northern Europe, renowned for its magnificent architecture and its stained glass windows. Both acoustic measurements and simulation techniques have been used to analyse the acoustic environment of its Chapter House, which dates from the 13th-century and features an octagonal geometry with Gothic Decorated stone walls replete of geometric patterns and enormous stained glass windows, covered by a decorated wooden vault. Measured and simulated room impulse responses served to better understand how their architectural features work together to create its highly reverberant acoustic field. The authors start by analysing its acoustic characteristics in relation to its original purpose as a meeting place of the cathedral’s Chapter, and end by reflecting on its modern use for a variety of cultural events, such as concerts and exhibitions. This work is part of the “Cathedral Acoustics” project, funded by the EC through the Marie-Sklodowska-Curie scheme.
1. Introduction
Research on the acoustics of heritage sites allows us, firstly, to understand and preserve the acoustic behaviour of spaces threatened by the passage of time, or modified by human intervention, by capturing the acoustic information digitally in the form of room impulse responses (RIR). Secondly, research in the field furthers our understanding on how acoustic conditions have changed over time, opening up discussions on what such changes might have meant to our ancestors and their experience of such sites.
This paper focuses on assessing the acoustics of the Chapter House of the Cathedral and Metropolitical Church of St Peter in York, better known as the York Minster. York Minster is the largest medieval Gothic cathedral in Northern Europe, renowned for its outstanding architecture. Its Chapter House is an independent venue attached to the north transept of the cathedral, in which a great variety of events are held on a regular basis. The York Minster’s Chapter House is considered a remarkable piece of architecture itself and its acoustics a major feature of its character.
This work provides new data about the acoustics of the York Minster’s Chapter House, that can be used to preserve its acoustic field as well as be used as a starting point for further research on more specific aspects of the sonic environment. This research contributes to the existing literature on acoustics of cathedrals and heritage buildings, using this space as a representative example of polygonal-shaped English Chapter Houses to better understand how their proportions, verticality, rich decoration and hard finishing materials work together to create their reverberant acoustic field.
The experimental study of the acoustics of the Chapter House was conducted following the well-established methodology outlined in ISO 3382-part 1 [1], as well as additional guidelines developed for churches and cathedrals [2,3]. As in previous studies on cathedral acoustics [4,5,6], a thorough analysis of the acoustic behaviour of the space was conducted through the acoustic parameter values derived from the measured RIR, registered at a set of positions which reflected the wide diversity of uses of the site.
The sound reflection pattern in polygonal-shaped rooms is always a challenge because of the unwanted echoes, low frequency colouration, and non-diffusion conditions commonly found in those spaces [7]. The octagonal shape of the Chapter House, which has multiple parallel walls, is one of those shapes. Therefore, a careful inspection of the reflection pattern and the early arriving energy at each reception point has been conducted. The reflection pattern and the sound decay curves derived from the measured RIR has been analysed in previous studies of cathedrals, as their rich architectural features and complex forms sometimes give rise to particular acoustic phenomena such as coupled spaces or singular patterns of early reflections [8,9].
In addition to capturing RIR on site, the study of the Chapter House utilised computer modelling to further our understanding of the space and its use. Three-dimensional reconstruction and acoustic simulation techniques present a powerful tool to recreate the acoustic field within a space, helping us to deepen the analysis of its acoustic behaviour, while also offering the opportunity to acoustically experience sites that no longer exist through the process of auralisation [10,11]. Simulation software tools based on geometrical acoustics (GA) algorithms have been also successfully used in similar buildings before for a great variety of purposes, for instance to explore different intervention options and adapt their acoustics to a specific use [12] and to assess how their acoustics change in an occupied state [13]. In this particular case, working with the model of the Chapter House allowed the research team to analyse in detail the influence of the polygonal-shape of the room on the early reflection pattern. Such analysis was done by considering the different configurations of the space depending on its uses. Furthermore, simulations were used to give an insight on the acoustics of the Chapter House in its original state, before any restoration work or intervention was made.
Carrying the on-site acoustic measurements prior to the simulation work is crucial to the validation of the acoustic model created, first, to represent the current state of the building, and then, modified as required. However, it is important to acknowledge that the main challenges in research on acoustic simulations of heritage sites are the uncertainties on the acoustic properties of historical materials, the modelling of certain sound sources and the inherent limitations of the geometrical acoustic theory itself in which the simulation software tools are based on [14].
2. The York Minster’s Chapter House
2.1. Overview of its Construction Process and Architectural Description
York Minster’s history dates back to the year 627, when a wooden church dedicated to St Peter was built [15]. The construction of the medieval cathedral first began around 1225, with the construction of the transept on the foundations of the Norman cathedral, which was demolished in stages as Gothic additions were made [16]. Its constructive evolution continued throughout more than 250 years, until the north and south towers were built. The Minster was consecrated in 1472, a few years before its completion [17]. The cathedral of York is considered one of the finest medieval buildings in Europe, representing almost every stage of the Gothic style of architecture from 1230 to 1475 and having the highest proportion of medieval stained glass of any European cathedral [18]. Not surprisingly, the York Minster is one of the most-visited buildings in Britain [19].
The Chapter House has a polygonal shape, which is a peculiarity of English thirteenth-century architecture, not found in any other place in Europe (with few exceptions such as the Chapter House in Elgin cathedral (octagonal shape, 1270) in Scotland). There is evidence for 25 polygonal Chapter Houses in England, but more than half of them no longer exist [20]. There is no certainty as to the reasons behind the popularity of the polygonal form, although previous research has linked the choice of shape to acoustics [21,22], as a way to avoid the “intolerable resonance” of the rectangular chapter houses [23]. Nevertheless, Wickham [23] also stated, “the resonance of some of the polygonal houses, both of those with central pillars and of those without them, is also intolerable”, and suggested that the polygonal shape emerged to serve its original purpose as a meeting place where all canons were considered equals, intended to avoid the dean sitting at the head as in the traditional rectangular Chapter Houses. Nevertheless, it seems more plausible that their shape, decoration and proportions derived from the tendency in English architecture around the year 1300 of “compiling designs for full-scale buildings or parts of buildings out of enlargements of the microarchitecture from the portals of thirteenth-century French cathedrals” [24], where the wall-framework structure, the geometric uniformity and the use of large windows had a profoundly visual value, being a prestigious architectural statement by the cathedral’s canons.
Regardless of the reasons behind the octagonal shape of the York Chapter House, its architecture is remarkable, having no central pillar supporting the vaulting ceiling, which is instead supported by a spire-like timber roof structure. It is considered, along with the octagon in Ely Cathedral, one of the masterpieces of English medieval carpentry [25]. Although there is a lack of documentary proof related to the construction of the Chapter House [26], some evidence suggest that its construction process was completed around the last two decades of the 13th century [15]. Work started right after the current transepts were erected, and it was completed before the current nave was built. The space is built in Early Decorated Gothic style, so-called geometric style (1250–90) in English architecture, being designed to promote verticality and with the clear purpose of creating visual impact. The York Minster’s Chapter House took the Westminster Chapter House as a source of inspiration, being the one in Westminster designed not only for the Chapter meetings but also to be used by Henry III [27], fact that also may explain its exuberance.
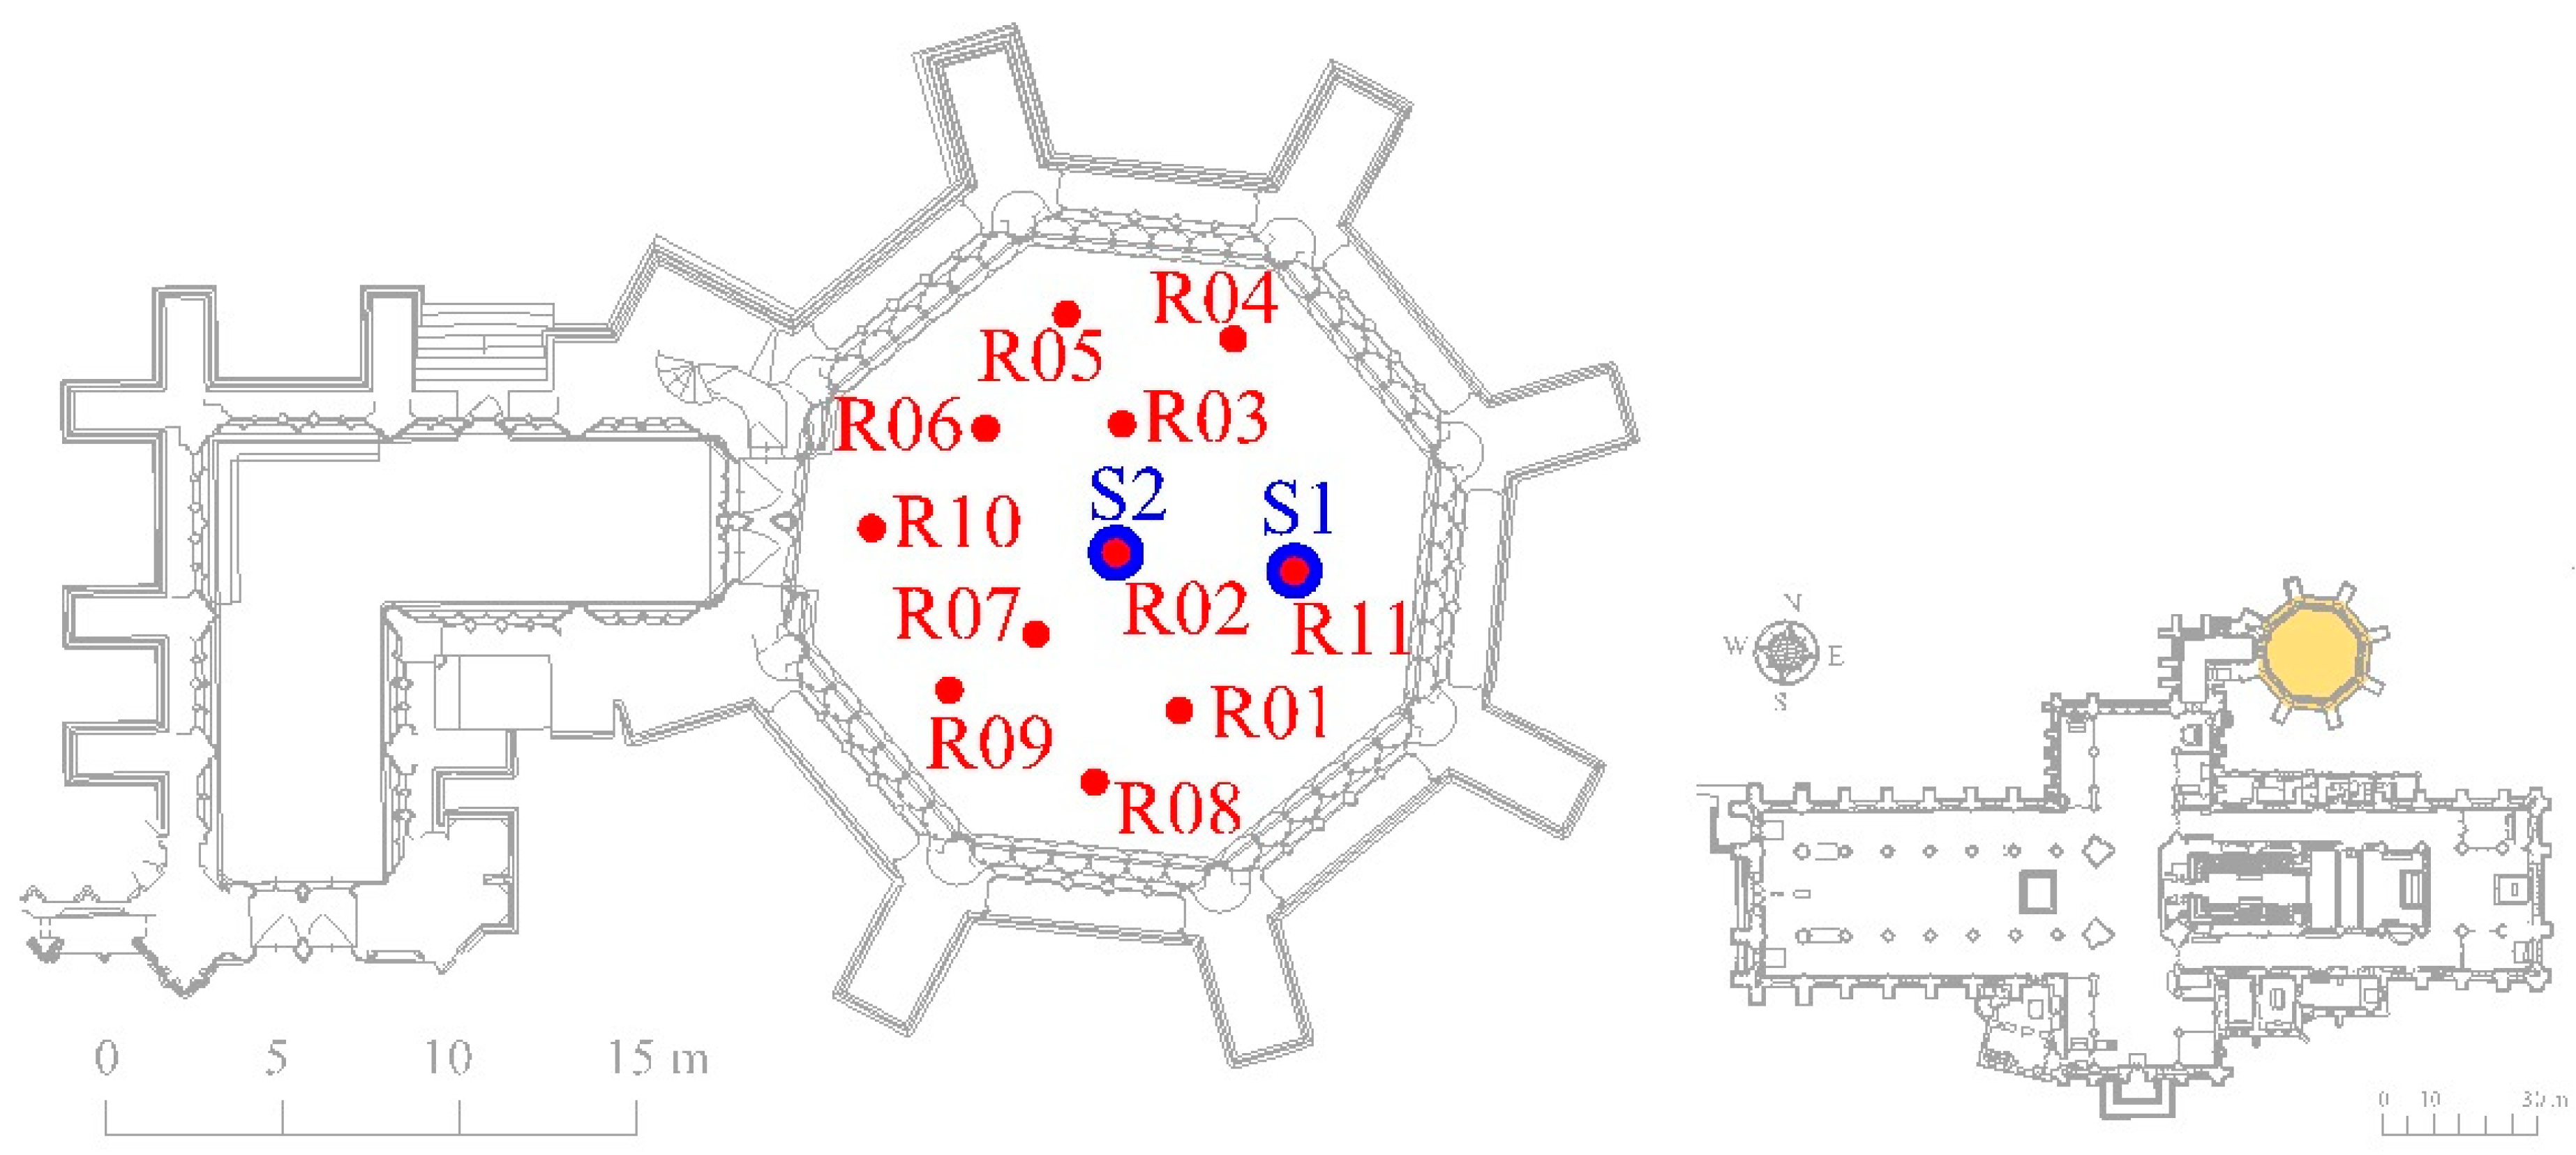
As can be seen in the floor plan included in Figure 1, the ground layout of the Chapter House is a quasi-regular octagon. It is annexed to the cathedral in its north transept through an L-shaped vestibule, also built in the Early Decorated style. The building is perfect in proportions, being about as high as its axis is long. For more details about its dimensions see Table 1.
The Chapter House is accessed by the west-side of the octagon (see Figure 1), through a rounded archway divided by a pillar with a statue of The Virgin and Child [28]. The oak doors at each side of the entrance date from the 13th century, and their original ironwork rich decoration is still visible [29].
The current polychrome Minton tiled floor (see Figure 2) is a result of the restoration of 1843-1845. There is no feasible trace of medieval floor in the Chapter House, which is thought to have been made of stone [30], although it is also possible that the decorative pattern tiles that still survive at the Westminster Chapter House once existed at York [16]. Eighteenth century views show an evenly paved floor, consisting of rectangular tiles with no visible decorative pattern [31].
Seven of the Chapter House’s sides have a uniform design (the eighth side is the entrance). The lower part of the room is organised as a peripteral colonnade, in which a constant pattern of black Purbeck marble columns separates the canon stalls, 6 in each side (apparently, the six stalls on the East side were designated for the Dean and dignitaries [30]). The stalls are covered by limestone canopies which are highly decorated with a variety of forms and carves, from humorous faces to animals, which were originally coloured [30]. The upper part of the canopies forms a passage surrounding the room in front of the windows, with the exception of the doorway. Magnificent stained glasses (framed by limestone clusters of shafts or nerves) dominate the upper space. On the access side, the limestone tabernacle over the door contained coloured figures (possibly of Christ and the 12 Apostles) lost by the 17th century [32], and the blind limestone window above had a series of polychromy medieval wall paintings, removed during restoration in 1840 [33].
In the exterior, the structure of the Chapter House is reinforced by buttresses on the octagon corners. Inwardly, these buttresses become pillars on which the structure of the vault rests. The current ribbed vault, divided into sixteen segments, is a fine plaster and lath work dated from 1797, when the 14th century wood ceiling panels were replaced due to deterioration [31]. The original panels (some now stored in the Minster’s crypt) were decorated with paintings of kings and bishops and the bosses were covered with silver [34], filling the spaces outside the hexadecagon. The entire ceiling was again restored in 1976 when the current decoration was applied.
2.2. A Singular Space for A Variety of Uses
As any other Chapter House, this space was constructed to provide a large and decorous place to host the regular meetings of the Chapter for the daily business of the cathedral. Forty-four seats were placed around the space as described in the previous section, a number greater than the canons in York at the time of the construction [16]. For most Chapter meetings at that time, only a minority of the stalls were occupied [26], for example, in 1310 only three canons met in the Chapter House to arrange a date for the election of a new dean [35]. However, it has a long history of being used for events other than Chapter’s meetings, for example, in 1297, when the government of England was York-based, the Parliament of Edward I, king of England, met in the Chapter House in October [36]. The space is still used for the meetings of the Corporate body of the York Minster. The College of Canons (32 canons), use the space regularly. The current Chapter is made up by 9 members, but they do not always meet there. According to Harrison [29], “at the beginning of the 20th century some of the meetings were moved to the Zouche chapel, due to the difficulties to heat the space and because of the echo which every sound made in it produces”. Nowadays, the configuration of the space changes depending on the meeting [37]. Such changes are not only in terms of the location of participants, but also, depending on the occasion, temporary pieces of furniture are used, mainly wooden tables and wooden or leather Victorian-style chairs [20] and the floor is sometimes covered with removable carpets. J. Archuleta, verger at the York Minster, shared some insight on the matter [38],
“sometimes the stone seats around the space are used, perhaps one speaker at a time may stand towards the centre, and other times, there is a table placed in the centre of the Chapter House and modern chairs are used”.
Contemporary uses of the Chapter House go beyond meetings, and include concerts, talks, tours and other social events held on a regular basis. The venue can also be hired to host dinners and drink receptions. L. Power, head of events and learning at the York Minster, set the capacity of the room at about 200 people, and when concerts are taking place it is a regular occurrence for the space to be fully booked [39], which mean approximately 130 spectators. Temporary stages, choir stalls, and audience seats (normally light weight upholstery portable chairs) are used as needed, and ephemeral solutions are sometimes included to meet the acoustic requirements of each use. For example, there is no permanent electroacoustic system installed in the Chapter House, but a portable system is used when needed, according with both Archuleta and Power [38,39].
Figure 3 shows the usual arrangement patterns between performers/sound sources and listeners used in the Chapter House. Figure 3a depicts the “front stage” arrangement; Figure 3b represents what is called “the amphitheatre-like arrangement” [40], and Figure 3c shows the original arrangement, in which the stone stalls are used both for performers and listeners. It is important to bear in mind that these arrangements are very flexible, and the configuration of the space is adapted to the requirements of each event. For instance, the audience area in “a” and “b” could expand to the stalls; in “c” the performers could be moved to any of the others sets of stalls depending on the location occupied by the person talking in each moment during the meeting. Configurations “a” and, occasionally, “b” are typically used for concerts and music events, and configurations “a”, “b” and “c” are used for meetings and talks. Figure 3 does not include the configurations used in events like tours or dinners.
3. Methodology of Analysis
The acoustical study of the Chapter House of the York Minster was based on acoustic measurements and simulation techniques. The room impulse responses (RIR) registered on site serve to assess the objectives acoustic characteristics of the space. Measured RIR are also used as a reference to adjust the acoustic model in order to ensure that the computational model is reliable in its representation of the soundfield, enabling conclusions to be drawn from the simulations as well as making it possible for simulated RIR to be used for auralisations that plausibly represent the acoustic environment of the space under different conditions. Simulation techniques are also utilised to assess the acoustic impact of restoration works, as well as different configurations related to the variety of uses of the Chapter House throughout history.
3.1. Acoustic Measurements in the Chapter House
The complete RIR measurement session involved the entire cathedral, including seven sound source positions selected by considering the architectural characteristics and the variety of uses of the space. Moreover, 65 receiver positions were located throughout the different audience areas. The number of source-receiver combinations characterised was selected in order to have representative data of each of the “subspaces” in the cathedral. This article focuses on the measurements and simulations linked to the Chapter House, and no acoustic information is given about the other subspaces, which will be analysed in future articles.
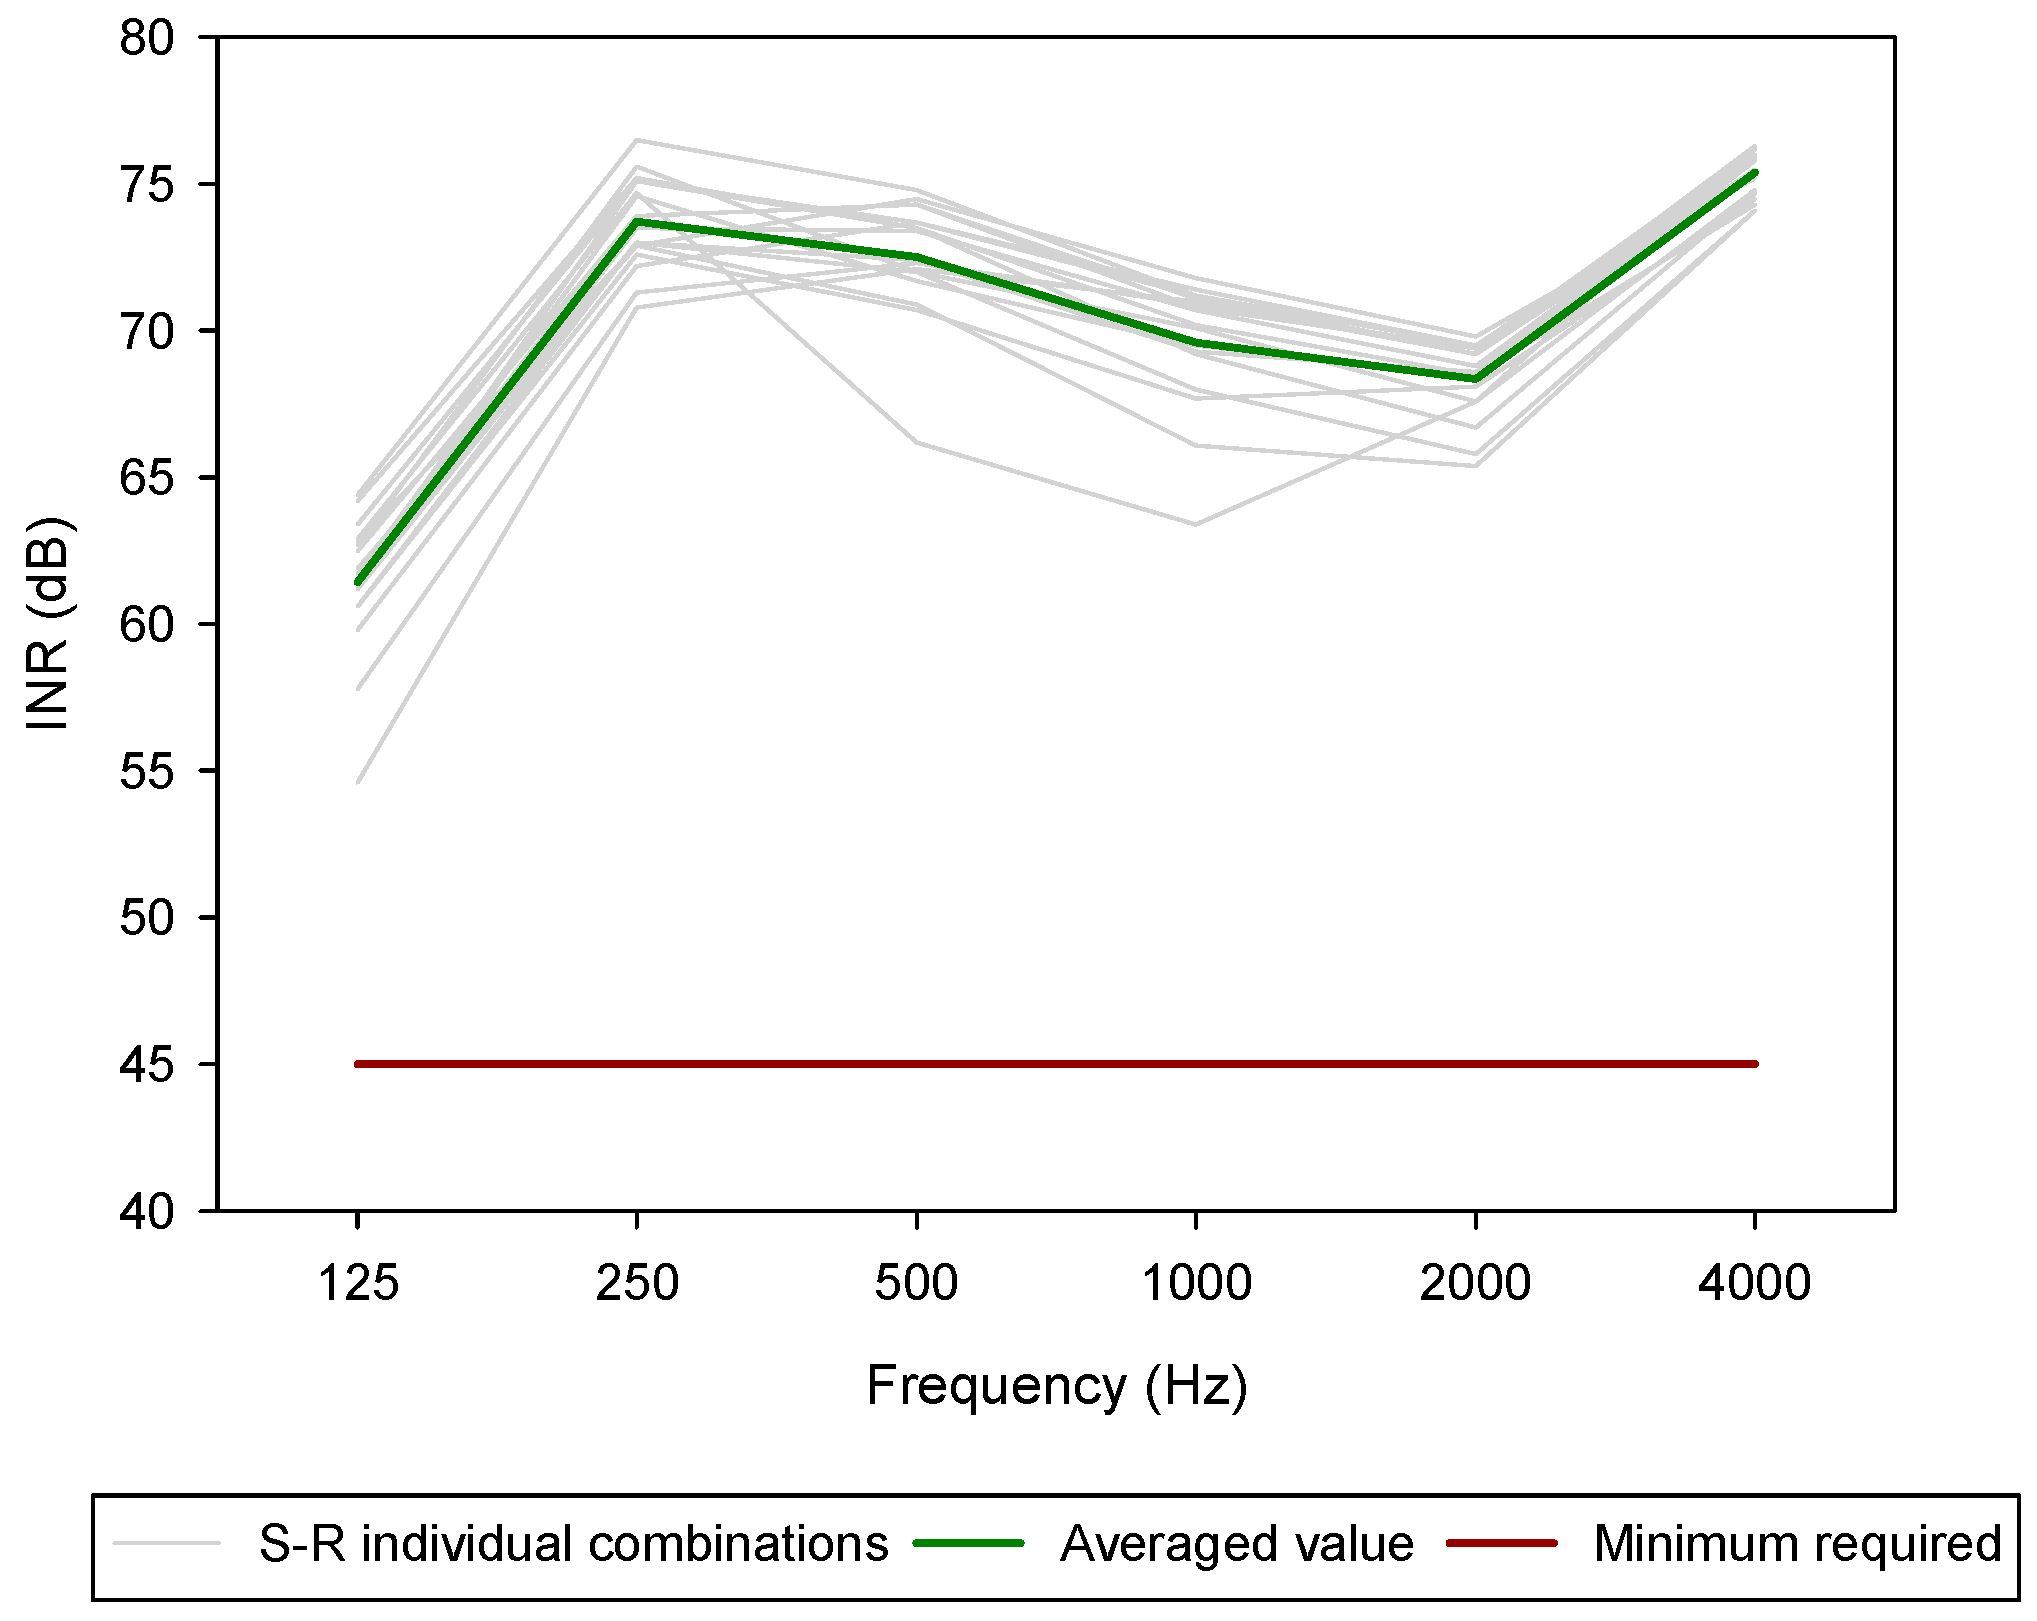
The acoustic measurements were carried out under unoccupied conditions taking ISO3382-1 [1] as a reference, as well as considering the specific guidelines developed for similar buildings [2,3]. The signal utilised was a 24-second-long sine-sweep emitted through a dodecahedral loudspeaker with a frequency response from 50 Hz to 10 kHz (NTi DS3 loudspeaker together with a NTi PA3 power amplifier) at a height of 1.5 m. The level and the duration of the excitation signal were set to ensure a reliable calculation of T30, which means that an impulse-to-noise ratio (INR) higher than 45 dB in all octave bands would be achieved, even in those receivers located at the furthest positions from the source (see Figure 4).
The loudspeaker was placed in two different source positions inside the Chapter House: one on the symmetry axes of the space, in the East side, which is considered a common position for performers during cultural activities (Front stage configuration, Figure 3a) (S1); and another one at the centre of the octagon (Amphitheatre-like configuration, Figure 3b) (S2). Up to 11 receiver positions were distributed throughout the space from where a set of RIR were captured by using a B-format microphone (Soundfield ST450) and a binaural dummy head (Neumann KU 100). Table 2 summarises the source and receiver combinations included in the survey. The exact positions of S1 and S2 and the receiver points can be seen in Figure 1.
The digital audio workstation Pro Tools 12 and MATLAB software were used to capture and process the signals respectively. Then two commercial software tools, WinMLS2004 and IRIS 1.4, were employed for the acoustic analysis of the RIR and the calculation of the acoustic parameters.
Environmental conditions were monitored during the session, registering an average temperature of 18 °C and 60% of relative humidity.
3.2. Acoustic Simulation of the Space
The objective evaluation and validation of the acoustic simulation was based on the comparison of the room acoustic parameters derived from the simulation and those calculated from the RIR registered in the space. The acoustic simulation was carried out with Odeon 14.0, by using the precision algorithm. The IR length and the number of late rays were manually set to 8 ms and 150,000 rays respectively, while the early reflection settings were automatically set (8976 of early rays with a transition order of 2). The geometrical model was imported into the acoustic software from the SketchUp modelling tool, which was used to build the geometrical model.
3.2.1. Acoustic Model
The 3D model was built from architectural plans and laser measurements taken on site, by using the modelling software tool SketchUp. The simplified model was created following the guidelines for geometrical acoustics (GA) algorithms, avoiding overly detailed surfaces and too complex forms [41]. The first significant simplification is the modelling of the highly decorated limestone canopies as a smooth surface and the simplification of the upper passage. To compensate for the limestone area lost with this simplification, the acoustic absorption coefficient assigned to this layer in the acoustic model was slightly increased. This is a common practice when modelling complex buildings, in which rich decorative patterns can make hard surfaces acoustically more absorbent [42]. The scattering coefficient was estimated taking into consideration the surface’s depth variations [43].
The second simplification, is the definition of the limestone nerves that frame the stained glasses. In this regard, three different possibilities were tested: no nerves, 2D nerves and 3D nerves. Omitting the nerves implied an increment of stained glasses surface of about 120 m2 at the expense of the stone surface, so, considering the differences in the acoustic properties between both materials, this option was discarded. Acoustic models including the 2D nerves and 3D nerves were tested in the simulation software. Modelling the nerves in 3D resulted in an increment of 200 m2 of limestone distributed in 1887 planes added to the model including the 2D nerves. After analysing the percentage of surface included in each configuration and considering the costs of the calculation process of each model, the option of including the nerves as 2D surfaces was chosen, and again, the absorption coefficient of the material assigned to the nerves was slightly increased to compensate for the surface lost and the scattering coefficient was estimated accordingly. Figure 5 includes a detail of one of the sides of the octagon were the simplifications described above are shown, including the limestone canopies and the modelling of the limestone nerves considered in the different options.
The final model built for the acoustic simulations, corresponding to option 2 in Figure 5, has 1927 planes and a total surface area of 2024.55 m2.
The characteristics of the finishing materials of the indoor surfaces of the room were determined by visual inspection and by consulting bibliography [16,29,30,31,32,33,34]. The Chapter House includes ceramic tiles for the floor, Magnesian limestone for walls, marble for the columns of the stalls, lath (strips of wood) and plaster for the vaulted ceiling, and last but not least, glass and lead for the stained glasses. The initial frequency-dependent values of the absorption coefficients were assigned based on bibliography and publicly available databases [41,44,45]. The scattering properties were set to account for textures at mid frequencies, in the way that an estimation is made according to the depth of the decoration pattern of that surface as described in the Odeon manual [46].
The simulation model was adjusted through an iterative process in which on-site measurements and computer modelling results were compared [3,47]. The differences found between them are assessed in terms of the just noticeable difference (JND) values for various acoustic parameters [1,48]. The tuning process is based on the initial adjustment of the reverberation time by adapting the acoustic properties of the surfaces which present more uncertainties and which also have a significant surface area in the model, so that a relatively small change has a considerable effect. The absorption coefficients initially assigned to those surfaces are carefully changed until the simulated values of the reverberation time at all frequency bands differ by no more than 5% (1 JND) from those measured on site. Once this primary requirement is achieved, a point-by-point comparison for other parameter values (EDT, TS, C80, D50) is performed considering the complete set of source-receiver (S-R) combinations. In those S-R combinations where major differences are found, a more detailed inspection of the RIR is done, analysing if there are any critical reflections added or missing in the simulation model. Having B-format or spatial RIR is crucial for this stage as it is possible to see where those reflections are coming from and implement local adjustments in the model if necessary. The model is considered adjusted once the differences between measured and simulated values are acceptable for a plausible representation of the real sound field, meaning that the measured and simulated RIR are comparable in shape, and that the measured and simulated values of the acoustic parameters differ by no more than 2 JND (no more than 1 JND in the case of T30) in all the frequency bands [49]. A margin of 1 JND is desirable for all the acoustic parameters, but a margin of 2 JND is accepted taking into consideration all the approximations and limitations inherent to the measurement and simulation procedures. Furthermore, it is important to bear in mind that the calculation of the measured values through the use of different software tools may imply a variation up to 1 JND mainly due to the different algorithms they use to deal with the background noise and the arrival time detection [50].
Two different options have been tested for the adjustment of the acoustic model of the Chapter House. The first option considered the vault as the adjustment surface, since it is the finishing material that presents greater uncertainty in its acoustic behaviour. A relatively wide range of values have been published for plaster and lath works and other comparable materials [41,44,45]. The final value of the absorption coefficient of the vault resulting from the iterative adjustment procedure increased from 0.16 up to 0.24 in the 125 Hz to 4 kHz frequency bands, which is greater than the range estimated by the different authors at mid-high frequencies (0.05 to 0.10). However, this value is in perfect harmony with the results derived from previous measurement campaigns developed in similar buildings [51]. Furthermore, considering that historical plasters have been shown to be more absorptive than modern ones [52] and that the vault has a large air cavity behind, the coefficients obtained seem more than reasonable.
The second option tested was to modify the acoustic properties of the limestone to achieve the adjustment of the model. The iterative process described above was applied, showing that the values of the absorption coefficient initially assigned to the limestone at medium-high frequencies needed to be increased by 0.02 to match the measurements. On hard surfaces such as the limestone, such increment implies a relative change of almost 50%, which a priori seems large considering the polished finishing of the limestone surfaces found in the Chapter House, remarkable for the time of construction. Although the absorption coefficients of the limestone resulting from the iterative process were high for a hard surface [41], similar values have been estimated for comparable materials in historical buildings before [12], and therefore, this option was not discarded. Furthermore, in order to achieve a good match in high frequency, an additional increase of the absorption coefficient assigned to the stained glasses and the vault in the 2 kHz frequency band was required.
Both options were based on reasonable assumptions, and therefore, tested in the simulation software.
After testing both options, it was decided that the first option would be applied, as it resulted in a better reproduction of the early reflection pattern in terms of their intensity which led to a better match between measured and simulated acoustic parameter values. Table 3 summarises the acoustic properties assigned to the finishing surfaces of the simulation model of the York Minster’s Chapter House, and the area which each of them occupies in the model.
The final model is considered adjusted with the spatial averaged values of the acoustic parameters differing by no more than 1 JND except in the 250 Hz frequency band, where the simulated values are significantly overestimated, and in the case of EDT and TS in the 4 kHz band, where the JND is much smaller in absolute values. Regarding the comparison point-by-point, more than 86% of the values match the criteria stated above (difference between measured and simulated values below 2 JND) including all the frequency bands except 250 Hz.
Figure 6 depicts the comparison of the spatially and spectrally averaged values (indicated by subscript “m”) obtained in each source–receiver combination. Following the indications of the ISO 3382-1 [1] T30m, EDTm, TSm, D50m and C80m were calculated by averaging values obtained at 500 Hz and 1 kHz frequency bands and JLFm was calculated by averaging values obtained from 125 Hz to 1 kHz frequency bands. The values corresponding to 1 and 2 JND have also been included in the figure to allow for the study of the margin of variation between the measured and simulated values of the acoustic parameters included in the comparison.
Additionally, when comparing results, it is important to remember that the acoustic simulation is built under the premises of the geometrical acoustic theory, and therefore, can be considered reliable for frequencies higher than four times the Schroeder’s frequency [41], which, in this case, is 64 Hz, meaning that simulated results in the 125 Hz and even in 250 Hz octave bands have to be been taken with caution.
3.2.2. Acoustic Simulation Details
After the calibration process had been completed, the acoustic model was used to conduct a full analysis of the current acoustics of the Chapter House focusing on the early reflection pattern and on the behaviour of the space in the perimeter area of the room to evaluate the influence of its architectural features on sound behaviour. For this purpose, the initial range of source and receiver positions set during the measurement session was expanded, mainly to assess the acoustic behaviour of the space in the area of the limestone stalls, used in the original configuration of the Chapter meetings, shown in Figure 3c. A new source position (S3) was placed in the seat reserved for the Dean (one of the central stalls in the East wall) to represent the position of a speaker and six additional receiver positions (R12-R17) were set in various stone stalls (one in each of the sides of the octagon, excluding both the East side on which the sources are located and the West side of the entrance door) as potential listener positions (see Figure 7).
The model was then modified to investigate the acoustics of the medieval Chapter House in its original state. The aim of this simulation is to offer an insight into the probable acoustical impact that the restoration works may have had on the space. It is always a challenge to try to plausibly reproduce the acoustic environment of a historic building at an earlier time, since there are usually gaps in the information needed to create the acoustic model in terms of the finishing materials used and their acoustic behaviour. In this particular case, for example, there is no trace of the original floor of the Chapter House, and it is not certain how the original ceiling and the painted walls interacted with sound, and therefore, some assumptions have to be made.
The absorption coefficient assigned to those limestone surfaces that were potentially painted (see Section 2) has been reduced (0.01 at low frequency bands and 0.02 in mid-high frequency bands) taking into consideration how the paint finishing affects the acoustic characteristics of similar materials according to the literature [44].
For the 13th century wooden vault, the absorption coefficient was estimated taking as reference the published data on the acoustic behaviour of similar finishes and considering the resulting absorption coefficient after the adjustment procedure in the current construction. Previous acoustic studies on similar buildings revealed an averaged absorption coefficient for wooden vaulted ceilings close to 0.40 [53]. Such absorption coefficients were estimated from previous measurements campaigns in Italian churches [51]. Based on these results and considering the architectural characteristics of the original vault and its decoration at that time, an absorption coefficient of 0.30 at low-mid frequencies and 0.34 at high frequencies has been used in the simulations, which means an increment of approximately 10% with respect to the absorption coefficients assigned to the current vault.
Finally, and even though the current tiled floor dates from the 19th century, no change in the model has been introduced for this surface, since it is known that it was a similar hard surface although presumably with a slightly more irregular and rough finishing, due to the time of construction. Therefore, it is likely that this change did not have a major impact on the acoustics, since its absorption and scattering coefficients are unlikely to have changed significantly.
4. Results and Discussion
The results below are derived from the measured and the simulated B-format RIR, through the observation of the spectral and spatial behaviour of a series of acoustic parameters and the inspection of the reflection patterns found at each reception point. Results has been analysed and discussed in terms of perceived reverberation, clarity of sound and spatial impression, considering the different purposes this space has served through history.
4.1. Acoustics of the York Minster’s Chapter House Today
The most relevant descriptor of the acoustic environment of a room is its reverberation time (T30). The analysis of the decay curves of the measured RIR shows an average value of T30m of 5.4 s. As can be seen in Table 4, similar values are obtained in the lower frequency bands, in which the greatest values of standard deviation are observed, and T30 values significantly decrease at the higher frequency bands, where usually the sound absorption of materials is greater and the air absorption is more pronounced. The Chapter House has a large volume considering its total surface area and it lacks acoustically absorbent finishing materials, which leads to this high level of reverberation more typically found in churches or cathedrals with considerably greater volumes [54]. Its T30 is extremely high for a “meeting room”, since, typically, the recommended reverberation time to achieve adequate speech intelligibility in a conference or a meeting room of a comparable volume is around 1.1 seconds [55]. Its reverberation time is also above the values considered suitable for music reproduction (of around 2 s depending on the type of music), being even slightly above the limits of preferred values for organ music and medieval plainchant (set about 2–4 s) [56,57].
Looking at the Early decay time (EDT), which better assesses the subjective impression of reverberation [58], spatially averaged values are only slightly lower than those obtained for the T30 (Table 4). Nevertheless, SD values obtained for EDT are considerably higher than those obtained for T30 in all frequency bands, which indicates that the perceived reverberation depends on the relative position of the receiver in the room, meaning that the reduced source-receiver distance that certain source-receiver combinations have may emphasise the role of direct sound and the proximity to the surrounding walls may emphasise the contribution of early reflections arriving at certain receiving points. In any case, the room has an averaged EDTm of 5.2 s, which is again above the optimal range suggested for speech (below 1.2 s) and for vocal and organ music in highly reverberant spaces, being 2.1 s and 4.2 s, respectively [57].
The analysis of the energy parameters derived from the measured RIR gives us complementary information about the balance between early and late reflections, or in other words, the clarity of sound in the space [58]. The definition, D50 (-), has been used to assess the clarity of the spoken word; whereas the clarity parameter, C80 (dB), was chosen to analyse the clarity of music. The central time, TS (ms), which is strongly correlated with the decay time and therefore less sensitive to spatial variations [59], is useful to ascertain the clarity of sound in general terms. In Figure 8, the left column shows the spatially averaged values of the acoustic parameters measured for all the source-receiver combinations as a function of frequency. The high TS mean values are indicators of a poor clarity of sound at low-mid frequency bands in the entire audience area. D50 mean values bellow 0.3 up to the 2 kHz band denote a poor clarity of the speech transmission in those bands, and the C80 values of less than 4 dB below 500 Hz are indicative of poor musical clarity especially at low frequencies. The error bars show the spatial dispersion in terms of the standard deviation (SD). It must be noted that they are relatively small, especially for the amphitheatre-like arrangement (S2), remaining mostly below 1 JND. Values of SD significantly exceeding this threshold are only found for the front-stage arrangement (S1) at the 500 Hz frequency band (max variation of 1.57 JND in the case of D50 at 500 Hz). The spectrally averaged values are also included in the figure as a function of the source-receiver distance. It can be seen that, when the source is located in the centre (S2) greater values of D50m and C80m are achieved, since the S-R distance remained below 7 m. As expected, there is a tendency for sound clarity indicators to decrease as the relative distance from the receiver to the sound source increases. However, it must be highlighted that the receivers closest to the side walls have higher C80m and D50m values than those that are at a similar relative S-R distance, but located in a more central area of the room. For instance, D50m and C80m values obtained at R4 when the source is located in S1 (S1-R4 dist = 6.7 m) are 1 JND above of those obtained in R3 (S1-R3 dist = 6.4 m), which means that such difference is perceptible by listeners. This fact may be due to the presence of early reflections nearer to the walls. In any case, the values of the energy parameters denote poor clarity of the sound (D50m < 0.3 and C80m < −2 dB), which indicates that how the sound energy behaves in the space is unfavourable to musical definition, and especially worrying for effective speech transmission, even at the receiver points closest to the source, for both source positions.
Additionally, the Early Lateral Energy Fraction (JLF) parameter is used to assess the spatial impression perceived by listeners in the Chapter House, since it has been demonstrated that it is related to the apparent source width (ASW) [60]. Furthermore, the JLF parameter has been proven to play an important role in the way that music is experienced in this type of building together with the T30 and other factors depending on the music motif [57]. As shown in Figure 9, looking at the spatially averaged results, lower values of JLF are found at low-mid frequencies when the source is located in the centre of the room (S2) than in S1 due to the geometry of the space, although the SD values indicate that it depends on the receiver position. This is relevant since the spatial impression is strongly correlated with the low frequency early-arriving sound [61]. Looking at the results obtained at each S-R combination, it is noted that considerably high values of JLFm (around 0.5, while a typical value for a suitable spatial impression is between 0.2–0.3 [62]) are obtained in those positions located closer to the walls (R4 to R9) with S1. Nevertheless, when considering S2, only R1 and R6 reach comparable values.
Further analysis of the direction of arrival of sound reflections and their relative intensity was conducted with the aim of understanding the specific role of the polygonal shape and specific architectural elements, such as the vault, in the interaction with the sonic events that take place in the Chapter House. For this purpose, 3D sound intensity vectors derived from the measured B-format RIR were inspected by using Iris 1.4 acoustic software. A resolution of 2 ms was set, which constrains the analysis to 500 Hz and above [63]. The time interval window named as “Speech” was used for the representation in Figure 10 and Figure 11, in which the red lines represent the direct sound (arriving at 0–2 ms), and the green and dark blue lines (arriving at 2–50 ms and 50–80 ms, respectively) represent the contribution of the early reflections. The reflections arriving after 80 ms or late reflections are coloured in sky blue.
Figure 10 shows the XY view of the 3D plots in the measured S-R combinations and allow us to observe the direction from which the early reflections, contributing to the clarity of sound, come from at each reception point depending of the position of the sound source. In the plots, the length of each ray represents their level in relation to the intensity of the direct arrival. Note that late reflections have been omitted here for the sake of clarity. It can be observed that, in the front-stage arrangement (S1), there are a considerable number of early rays arriving at those receivers that are at a greater distance from the source, with an attenuation of 5–10 dB relative to the intensity of the direct arrival which likely contribute towards a clearer perception of sound in those positions. Such rays are mainly coming from the closer lateral walls (in the case of R5, R6 and R9) and from the entrance (in the case of R10). Nevertheless, when the source is located in the centre (S2, amphitheatre-like arrangement), S-R distances are shorter and the intensity of the direct sound is higher, so the early reflections in general arrive with a greater attenuation, with the exception of the first reflection coming from the floor. It is only in those receivers closer to the walls (R5, R8 and R10) that a small number of rays approximately 5 dB lower than the direct arrival coming from the back, are found.
Focusing only on the early lateral rays we get information related to the spatial impression. With S1, a significant number of early lateral rays are observed in all the listener positions except in those receiver points located along the symmetry axe of the room (R2, R10), which is in good correlation with the high value of the JLFm parameter obtained for those S-R combinations. Conversely, the intensity plots for S2 show limited lateral energy arriving at those points located in the central part of the space, which corresponds in general to lower values of the early lateral fraction parameter (Figure 9). As an example of this, the full Iris plot calculated for the receiver position R8 with both source positions is shown in Figure 11, which also provides insight into the general distribution of the energy, by including the late arrivals.
It can also be seen in Figure 11 that virtually no early reflections are coming from the upper part of the room (stained glasses and the vault), not even in a significant way when the receiver is located in the centre of the space immediately below the centre of the vault (R2). This lack of early reflections coming from above was expected given the vault’s height (see geometry details in Table 1 and Figure 7). In general, the late energy arriving at all the receiver positions is significant and is coming from all around the space, whilst early energy is mainly coming from below and the horizontal plane, but not from above.
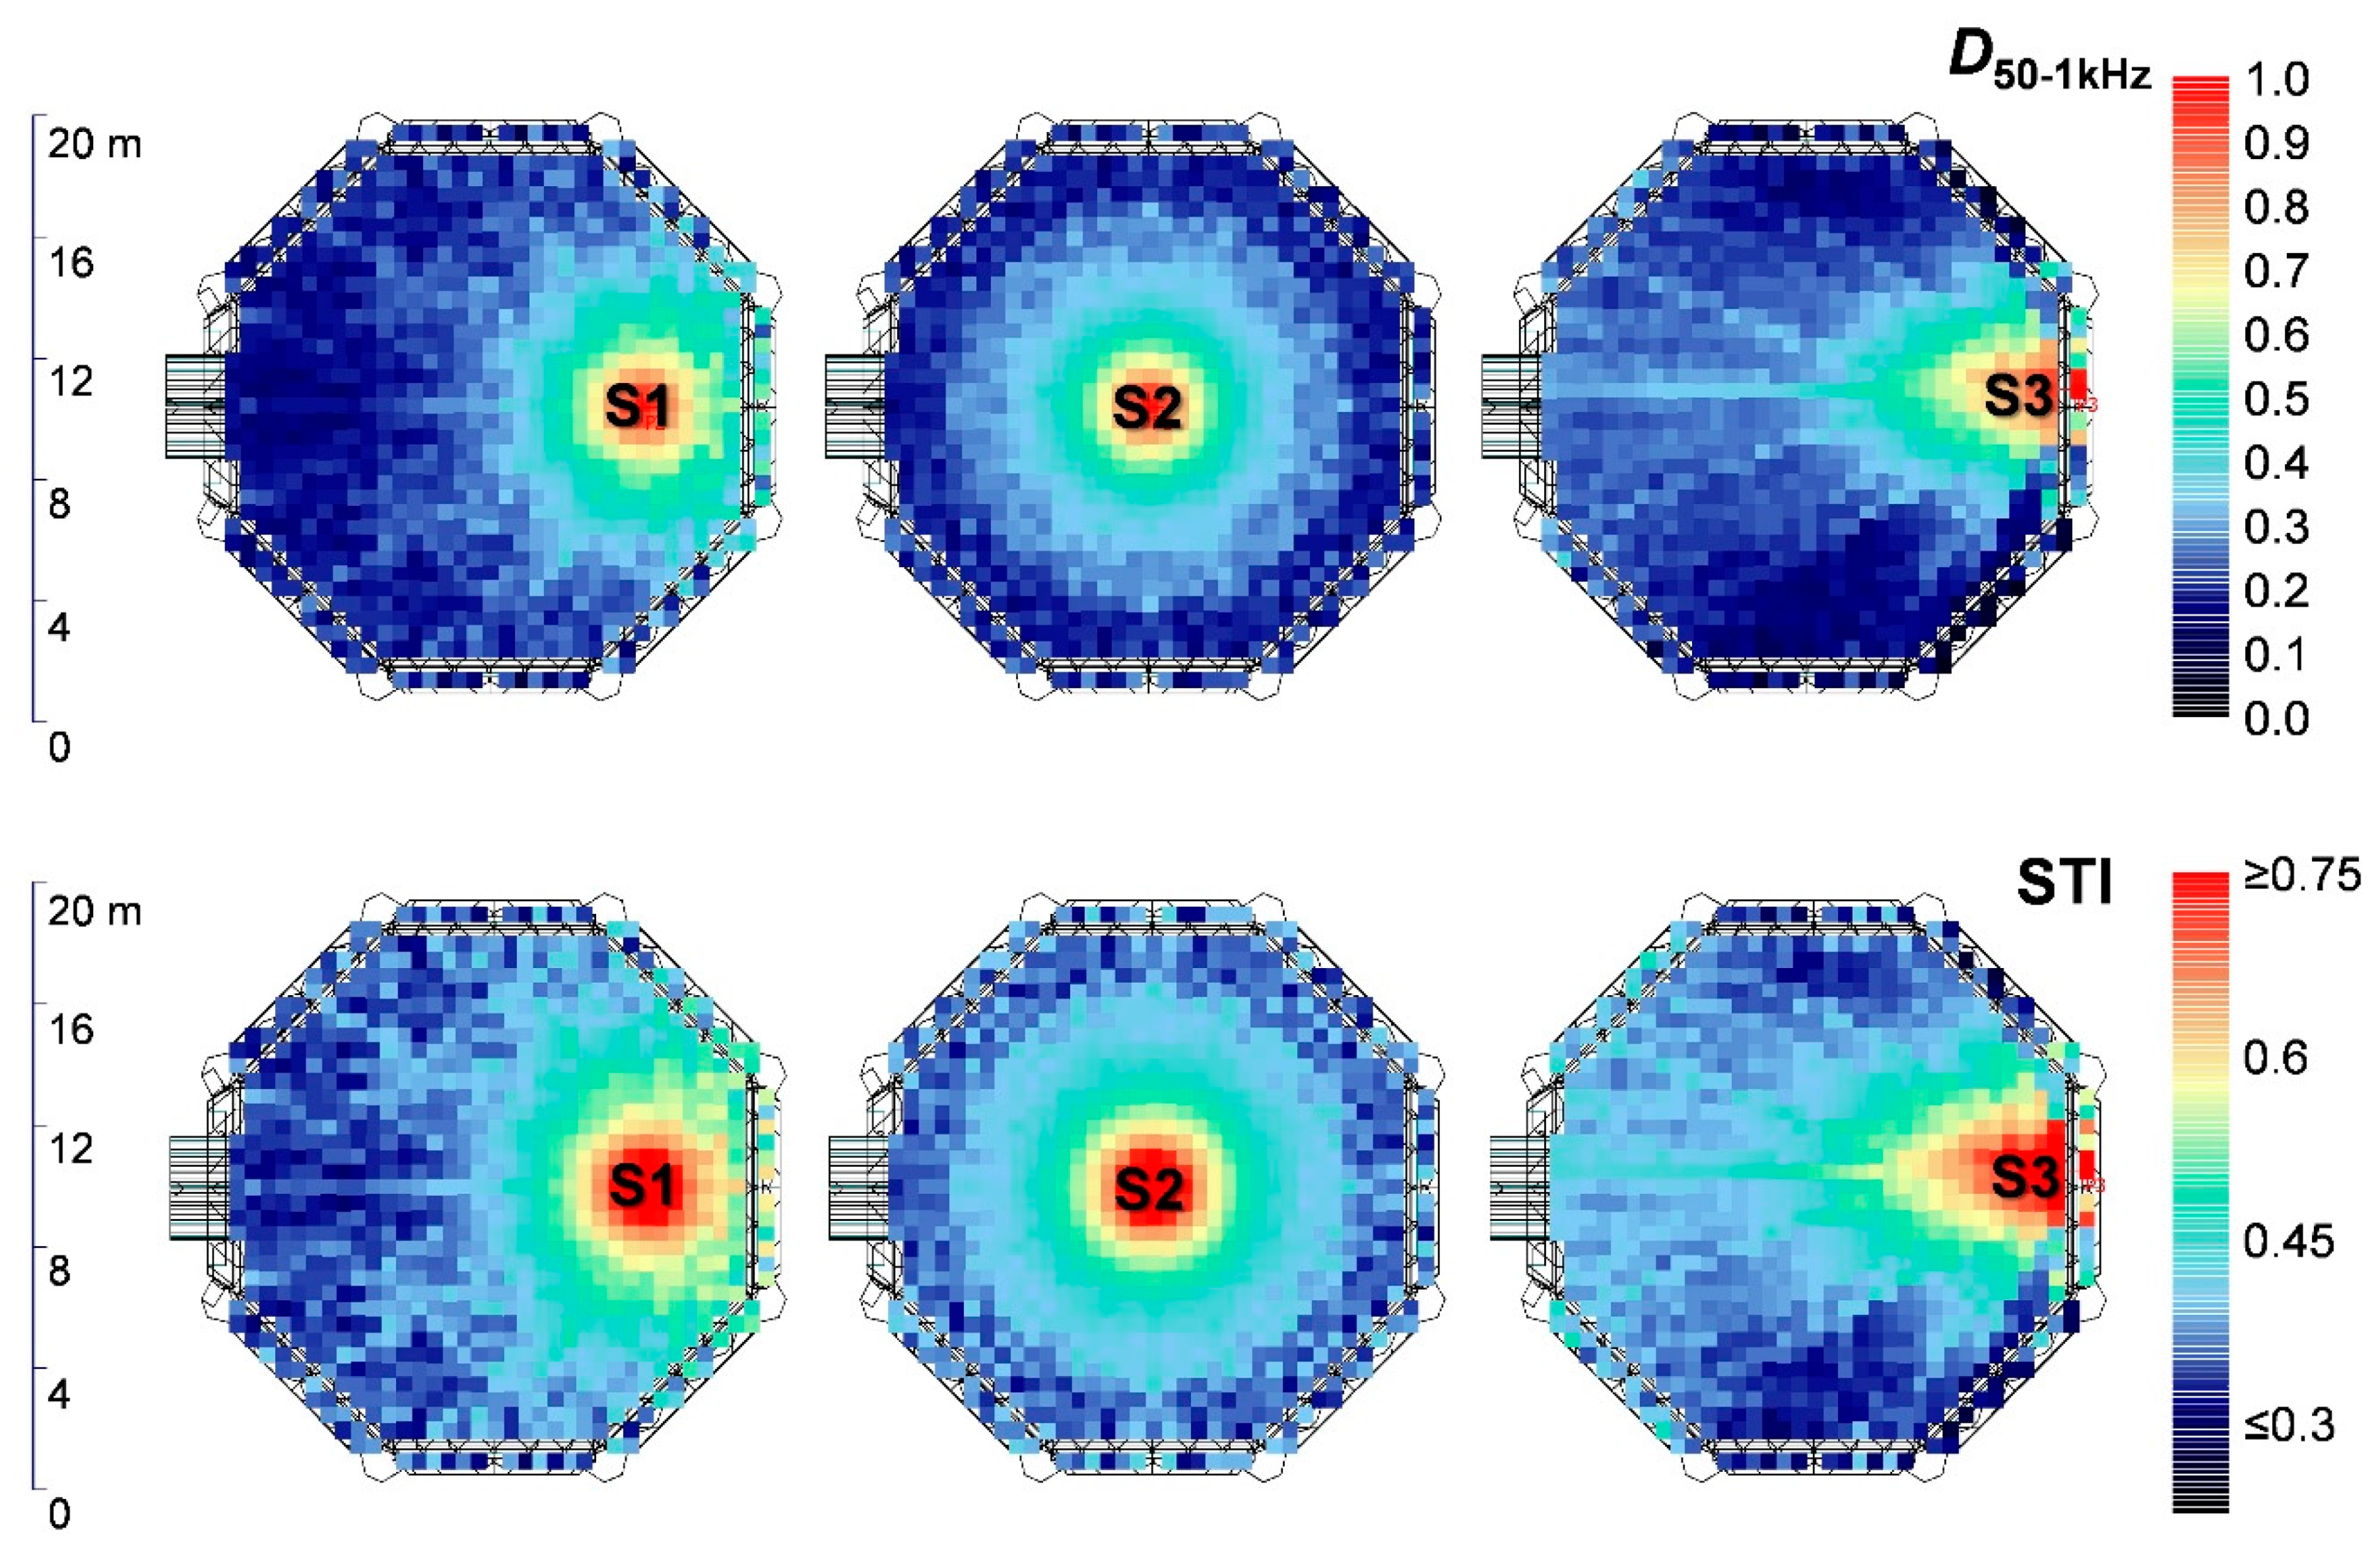
Acoustic simulations were then used to assess in more detail the influence of the architectural features of the space in its function as a meeting place, including its original configuration where the speaker and/or the listeners where sitting in the limestone stalls (Figure 3c). Simulated mappings were generated to analyse the spatial distribution patterns of the acoustic parameters. The horizontal grid for the colour mappings was defined at approximate ear height (1.20 m from the floor in the centre area and 0.6 m from the sitting area of the stalls) were set. Figure 12 shows the simulated mappings of the speech transmission index (STI) and D50 at 1 kHz obtained for the different source positions in the current state. These parameters have been selected in this case since they are indicators of the clarity and intelligibility of the spoken word. When looking at the simulation mappings, no significant improvement in terms of speech intelligibility is observed in the stalls in comparison with the open floor area. In general, values denote “poor” speech intelligibility throughout the audience area with the three source positions analysed. Despite this, it can be seen that some STI and D50 values obtained in a number of receivers located in the stalls are higher than those obtained at points that are at a closer relative distance from the sound source, and this effect can be perceptible when these differences are greater than 1 JND. Furthermore, when the source is located in the stalls (S3), there is a potential lack of direct sound in those stalls located in the adjacent walls to which the sound source is located due to the geometry of the space, and also because of the marble columns, and this is detrimental to intelligibility in that section of the sitting area.
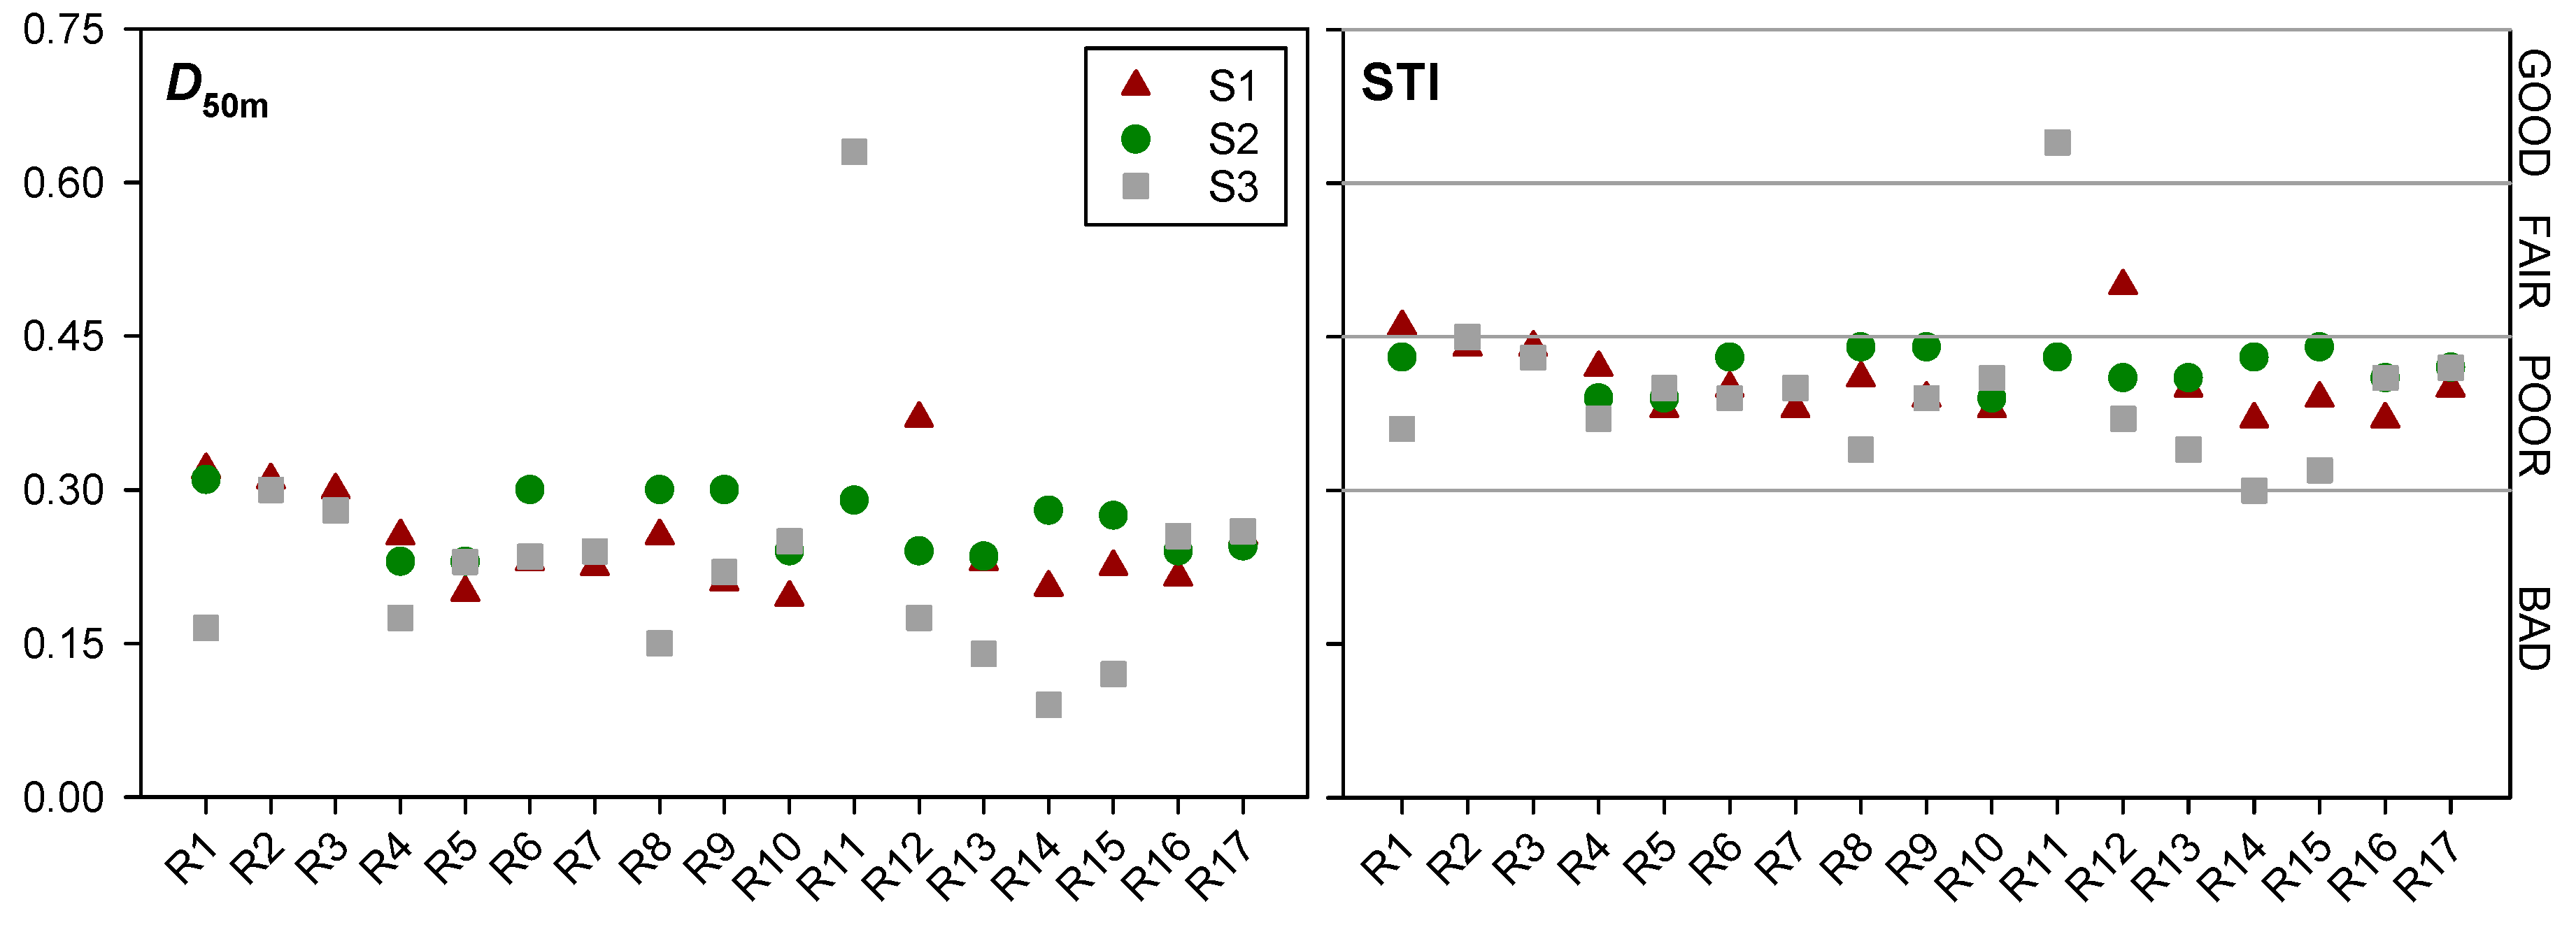
For more details, Figure 13 shows D50m and STI values obtained at each S-R combination, including the receiver positions in the stalls. The results reveal that when the source is in the centre, higher values of D50m and STI are obtained in the stalls, while with S1 and S3 no significant improvement can be seen, and even lower values are obtained. These results demonstrate that, although the early reflection pattern inspection for those receivers located in the stalls shows a group of strong early reflections of 1st and 2nd order arriving before 50 ms (even arriving before 10 ms in the case of those coming from the walls immediately behind the receivers) that reinforce the clarity of the speech in those positions, this reinforcement does not have a significant impact in terms of intelligibility or sound clarity since the reverberant field predominates at that distance from the sound source.
4.2. Acoustics of the York Minster’s Chapter House before any Restoration Work
The Chapter House’s dimensions and geometrical features have remained the same since its construction date. Therefore, the visual inspection of the free path length (FPL) distribution estimated from the ray-tracing process has been used to have an initial notion of the average distance that a ray will travel between successive reflections in the model, which depends on the geometry of the room but not on the acoustic properties of its finishing materials. The FPL of the acoustic model of the Chapter House shows a high probability of the shortest path lengths (below 3 m) but also a significant concentration of the distribution around 19 m, which is clearly determined by the proportions of the room and will have a key influence in the estimation of its reverberation time [64], anticipating a high number of late-arriving energy both before and after any restoration work took place.
The acoustic simulation of the space, under the premises established in Section 3.2.2 gives us an idea of the impact that all the modifications, restorations and conservation interventions throughout its history have had on the acoustics of the space. As the most acoustically relevant modifications took place in the upper parts of the space, it is expected that they caused a significant effect on the late reflections arriving at the listeners, and consequently, in the reverberant field of the Chapter House. Table 5 shows the simulated reverberation time in the hypothesis that has been made about its original state, described in Section 3.2.2.
The results reveal that the medieval Chapter House had a reverberation time considerably shorter (around 1 s) at low and medium frequencies when compared with the reverberation time it has today. In other words, the modifications are estimated to have increased the reverberation time up to 3–4 JND in that frequency range. The replacement of the original wooden vault at the end of the 18th century with the current lath and plaster work is the most influential factor in the noticeable change of the reverberation time. However, it should be considered that a reverberation time of 4.3 s at mid frequencies was still too high for good speech intelligibility and clarity, especially considering the lack of furniture and the low level of attendance that the Chapter meetings had at that time, implying that there would not be significant additional absorption due to the presence of more people.
5. Conclusions
The present paper explores the acoustic characteristics of the Chapter House of the York Minster. Although its acoustics is frequently mentioned in literature on the Minster [21,22,23], there have been no thorough attempts to analyse it in detail or to consider its sound environment as a key element in terms of the relationship between visitors and the space over time.
The first approach used to analyse the acoustic behaviour of the Chapter House is based on the acoustic measurements carried out in the unoccupied space by means of the acoustic parameters that can be derived from the captured room impulse responses. Then, acoustic simulation techniques were used to perform a more detailed analysis of the propagation of sound in the space due to its octagonal shape and its finishing materials, as well as to assess the possible acoustic impact caused by a series of restoration works. These results have been analysed and discussed paying attention to the variety of purposes and diverse uses that this space has had through history.
Despite being designed as a meeting place for the chapter, the acoustic simulation of the Chapter House in its original state, prior to any restoration work, showed a T30m above 4 s. These results suggest that the priority in its design was to create a great visual impact, at the expense of compromising its functionality from the acoustic point of view, since its proportions and finishing materials give rise to a long tail of reverberation that would make clarity and intelligibility of speech unsuitable for meetings.
In order to assess how the architectural features of the Chapter House contribute to the acoustic behaviour of the space and to answer the frequently asked question of whether its acoustic performance is really better in the perimeter than in the centre, the early and late sound energy arriving at the listener were analysed in detail through the measured B-format RIR. Additionally, acoustic simulations were used to ascertain how it works in its original configuration as a meeting place, in which the speaker (S3) and the listeners where setting in the limestone stalls (except the reader at the lectern, possibly placed in S1 or S2 [23]).
The analysis of the sound energy distribution in the Chapter House shows that there is a significant amount of early reflections contributing to the sound clarity due to its octagonal shape. Those early reflections arriving less than 50–80 ms after the direct sound arrive from the lateral walls and stalls closer to the listeners and, to a lesser extent, from the decorated canopies. This contribution is more noticeable in those listener positions closer to the walls, and when the sound source is not located in the centre of the room (S2). The results show higher values of C80m and D50m at those receivers located on the peripheral area and the stalls than at those receivers that are at a similar S-R distance, but located in a more central area of the room. Although a good clarity of sound is not achieved in the peripheral positions with a greater contribution of the early reflections, such increase is above the 1 JND established for each acoustic parameter (C80m and D50m) in low and mid frequencies, which means that relatively more favourable acoustics for speech could be experienced by the listeners located closer to the perimeter, as mentioned by previous sources [65].
The late energy, linked to the reverberant field, is shown to be very significant throughout the entire space, which is unfavourable to speech but contributes to the perception of envelopment. The upper part of the room, including the stained glasses and the vault, play an important role here as they are at a great distance from the listener positions.
These findings suggest that, although the octagonal shape of the York Minster’s Chapter House supports shorter distances between the speaker and the listeners and provides a great number of strong early reflections arriving at the listeners located close to the surrounding walls, its proportions and hard finishing materials result in a large number of late reflections that produce an excessive sound tail which clearly dominates the space and negatively affects speech intelligibility and the perceived clarity of music. Therefore, a priori, and according to the criteria established for concert halls and meeting rooms, we can conclude that the particular shape of this building does not contribute to better acoustics in terms of clarity of sound, but does allow a more balanced spatial distribution of the sound energy, which is shown by a more balanced spatial distribution of C80, D50 and TS values.
At present, the Chapter House has a T30m of 5.4 s, which is notably higher than in its original state, mainly due to the restoration of the vault of the 18th century. The highly reverberant character of the space hinders a clear perception of the sound in the room in the 3 configurations analysed (see Figure 3), which is evidenced by the values obtained from TS, D50 and STI. This condition forces speakers to adapt to the space, speaking with a leisurely pace and projecting their voices, and makes it necessary to use electroacoustic support on certain occasions. With ephemeral interventions intelligibility can be improved, by incorporating acoustically absorbent elements in the room such as carpets and soft pieces of furniture. Of course, the degree of occupation of the room during the different activities will also have an impact in the reverberation they experience, acting as acoustic absorbers in a first place; but they may be also a significant source of noise resulting in the acoustic phenomenon known as cocktail party effect, which is very pronounced in such reverberant rooms. L. Power pointed out this fact very clearly [39],
“It doesn’t take much to any other sound to start competing with you. You don’t need to raise your voice very much to talk in there, but if other people are saying something even quite low, kind of conversation, it can start to build the sound very quickly”.
But today, the York Minster’s Chapter House is not only considered as a meeting place, it is a multipurpose room, where concerts and other cultural and social activities are held regularly.
As a concert room, it could be said that this space is too reverberant to host any vocal or instrumental music concerts, based on the low values obtained for musical clarity indicators, especially at low-medium frequencies (C80m < −4 dB), both in the front-stage arrangement and the amphitheatre-like arrangement. Nevertheless, the unique reverberant atmosphere of the space, which has been described as an “uncontrolled exuberance of sound” [66], is what makes it so special, when combined with its visual majesty. Significantly, some artists have incorporated the architectural features of the space, its symmetry, and its reverberant acoustics to their performances in order to create an experience specially designed for that space, for instance changing the traditional position of the choir in front of the audience and singing around the edge, or singing a solo from the vestibule, among other things [67]. H. Daffern, singer at the Ebor Singers choir, shared her experience in the Chapter House [68],
“I do love performing in the Chapter House…I like the challenge of the singing as a group and not being able to rely in what you hear and the overall sound being quite spectacular, but needs to be the right repertoire in the right space”.
The findings in this article support the idea previously stated by several authors [69] that “acoustics must be considered part of the intangible cultural heritage, not only considering the sound events that take place within the space, but also strictly related to the building itself”.
Furthermore, the acoustic analysis detailed in this paper has the purpose of functioning as a resource for investigations in other disciplines as well as a reference when assessing the acoustics of similar English polygonal Chapter Houses. The acoustic simulation model built for this singular space will be used to generate a set of RIR that will be used for a creative exploration of acoustical heritage [11] and in future virtual reality simulations [70].
Author Contributions
Conceptualization, L.Á.M., M.L. and Á.Á.C.; methodology, L.Á.M. and Á.Á.C.; software, L.Á.M.; validation, L.Á.M., M.L. and Á.Á.C.; formal analysis, L.Á.M.; investigation, L.Á.M., M.L. and Á.Á.C.; resources, L.Á.M.; data curation, L.Á.M.; writing—original draft preparation, L.Á.M.; writing—review and editing, L.Á.M., M.L. and Á.Á.C.; visualization, L.Á.M., M.L. and Á.Á.C.; supervision, L.Á.M. and M.L.; project administration, L.Á.M.; funding acquisition, L.Á.M. and M.L. All authors have read and agreed to the published version of the manuscript.
Funding
This research was funded by the European Union’s Horizon 2020 research and innovation programme under the Marie Skłodowska-Curie grant agreement No. 797586.
Acknowledgments
The authors are very grateful to the Dean and the staff of the cathedral for their collaboration and their assistance during the measurements. Authors very much appreciate the additional project support from the Department of Electronic Engineering AudioLab at the University of York. Thanks to Daniel Protheroe for having made Iris software available for the analysis. Thanks to Richard A. Carter, Claudia Nader and Joe Rees-Jones for the photographs taken, and thanks to Marc Girot, Adi Keltsh and Rene Idrovo for their invaluable help during the measurement session.
Conflicts of Interest
The authors declare no conflict of interest. The funders had no role in the design of the study; in the collection, analyses, or interpretation of data; in the writing of the manuscript, or in the decision to publish the results.
References and Notes
- ISO 3382-1. Acoustics—Measurement of Room Acoustic Parameters. Part 1: Performance Rooms; International Organization for Standardization: Geneva, Switzerland, 2009. [Google Scholar]
- Martellotta, F.; Cirillo, E.; Carbonari, A.; Ricciardi, P. Guidelines for acoustical measurements in churches. App. Acoust. 2009, 70, 378–88. [Google Scholar] [CrossRef]
- Álvarez-Morales, L.; Zamarreño, T.; Girón, S.; Galindo, M. A methodology for the study of the acoustic environment of Catholic cathedrals: application to the Cathedral of Malaga. Build. Environ. 2014, 72, 102–115. [Google Scholar] [CrossRef]
- Pedrero, A.; Ruiz, R.; Díaz-Chyla, A.; Díaz, C. Acoustical study of Toledo Cathedral according to its liturgical uses. Appl. Acoust. 2014, 85, 23–33. [Google Scholar] [CrossRef]
- Álvarez-Morales, L.; Girón, S.; Galindo, M.; Zamarreño, T. Acoustic environment of Andalusian cathedrals. Build. Environ. 2016, 103, 182–192. [Google Scholar] [CrossRef]
- Postma, B.N.; Katz, B.F. Acoustics of Notre-Dame Cathedral de Paris. In Proceedings of the International Congress on Acoustics (ICA), Buenos Aires, Argentina, 5–9 September 2016; pp. 1–10. [Google Scholar]
- D’Orazio, D.; Garai, M. Acoustic control in octagonal geometry: case study of the Torri dell’acqua auditorium. In Proceedings of the Institute of Acoustics, Dublin, Ireland, 20–22 May 2011. [Google Scholar]
- Anderson, J.S.; Anderson, M.B. Acoustic coupling effects in St Paul’s Cathedral, London. J. Sound Vib. 2000, 236, 209–225. [Google Scholar] [CrossRef]
- Martellotta, F. Identifying acoustical coupling by measurements and prediction-models for St. Peter′s Basilica in Rome. J. Acoust. Soc. Am. 2009, 126, 1175–1186. [Google Scholar] [CrossRef]
- Suárez, R.; Alonso, A.; Sendra, J.J. Archaeoacoustics of intangible cultural heritage: The sound of the Maior Ecclesia of Cluny. J. Cult. Herit. 2016, 19, 567–572. [Google Scholar] [CrossRef]
- Murphy, D.; Shelley, S.; Foteinou, A.; Brereton, J.; Daffern, H. Acoustic Heritage and Audio Creativity: the Creative Application of Sound in the Representation, Understanding and Experience of Past Environments. Internet Archaeol. 2017, 44. [Google Scholar] [CrossRef]
- Alonso, A.; Suárez, R.; Sendra, J.J.; Zamarreño, T. Acoustic evaluation of the cathedral of Seville as a concert hall and proposals for improving the acoustic quality perceived by listeners. J. Build. Perform. Simu. 2014, 7, 360–78. [Google Scholar] [CrossRef]
- Alvarez-Morales, L.; Martellotta, F. A geometrical acoustic simulation of the effect of occupancy and source position in historical churches. Appl. Acoust. 2015, 91, 47–58. [Google Scholar] [CrossRef]
- Vorländer, M. Computer simulations in room acoustics: Concepts and uncertainties. J. Acoust. Soc. Am. 2013, 133, 1203. [Google Scholar] [CrossRef] [PubMed]
- Ditchfield, P.H. The Cathedrals of Great Britain. Their History and Architecture; J.M. Dent & Company: London, UK, 1902. [Google Scholar]
- Brown, S. York Minster: An Architectural History, c. 1220-1500: "Our Magnificent Fabrick"; Royal Commission on Historical Monuments: Swindon, UK, 2003. [Google Scholar]
- The Medieval Minster: History of York. Available online: www.historyofyork.org.uk (accessed on 12 December 2019).
- Brown, S. Stained Glass at York Minster; Scala publishers: London, UK, 2017. [Google Scholar]
- Association of Leading Visitor Attractions. Available online: https://www.alva.org.uk/details.cfm?p=423 (accessed on 10 December 2019).
- Bond, F. The Cathedrals of England and Wales; Jeremy Mills Publishing: Huddersfield, UK, 2007. [Google Scholar]
- Zukowsky, J. The Polygonal Chapter House: Architecture and Society in Gothic Britain. PhD Thesis, State University of New York, Binghamton, NY, USA, 1977; pp. 40–41. [Google Scholar]
- Available online: http://www.historyfish.net/abbeys/abbeyparts/livingquarters2.html (accessed on 10 December 2019).
- Wickham, W.A. Some notes on chapter-houses part 1 and part 2. Trans. Hist. Soc. Lancs. Ches. 1912, 64, 142–247. [Google Scholar]
- Gajewski, A.; Opacic, Z. The Year 1300 and the Creation of a New European Architecture; Brepols Publishers NV: Turnhout, Belgium, 2008. [Google Scholar]
- Hewitt, C. English Cathedral Carpentry; Wayland Ltd.: London, UK, 1974. [Google Scholar]
- Morgan, C. A Life of St Katherine of Alexandria in the Chapter-House of York Minster. J. Br. Archaeol. Soc. 2009, 162, 146–178. [Google Scholar] [CrossRef]
- Rodwell, W.; Mortimer, R. Westminster Abbey Chapter House: The History, Art and Architecture of ’a Chapter House Beyond Compare’; Society of Antiquaries of London: London, UK, 2010. [Google Scholar]
- Winkles, H.; Garland, R.; Moule, T. Winkles’s Architectural and Picturesque Illustrations of the Cathedral Churches of England and Wales; Royal Exchange, and Charles Tilt, Fleet Street; Effingham Wilson: London, UK, 1836; Volume 2. [Google Scholar]
- Harrison, F. York Minster, 1st ed.; Methuen & Co Ltd.: London, UK, 1927. [Google Scholar]
- Harrison, F. The Painted Glass of York: An Account of the Medieval Glass of the Minster and the Parish Churches; Society for Promoting Christian knowledge, SPKC: London, UK, 1927. [Google Scholar]
- Halfpenny, J. Gothic Ornaments in the Cathedral Church of York; J. Todd & Sons: Harrogate, UK, 1975; (Plate No 102). [Google Scholar]
- Drake, F. Eboracum: The History and Antiquities of the City of York, from Its Origin to This Time; T. Wilson and R. Spence: York, UK, 1788. [Google Scholar]
- Norton, C. Annual Report 1996: The Medieval Paintings in the Chapter House; Friends of York Minster: York, UK, 1996; pp. 34–51. [Google Scholar]
- Clutton-Brock, A. The Cathedral Church of York: A Description of Its Fabric and a Brief History of the Archi-Episcopal; G. Bell & Sons: London, UK, 1899. [Google Scholar]
- ’Collegiate Churches: York (Including York Minster)’, A History of the County of York. Available online: http://www.british-history.ac.uk/vch/yorks/vol3/pp375-386 (accessed on 19 November 2019).
- Medieval York: York in Political History’, in A History of the County of York: the City of York. Available online: http://www.british-history.ac.uk/vch/yorks/city-of-york/pp25-29 (accessed on 18 November 2019).
- Coldstream, N. York Chapter House. J. Br. Archaeol. Soc. 1972, 35, 15–23. [Google Scholar] [CrossRef]
- Jason Archuleta (University of York, York, UK), interviewed 11 October 2019.
- Lisa Power (University of York, York, UK), interviewed 22 October 2019.
- Handbook for Sound Engineers, 4th ed.; Taylor & Francis: New York, NY, USA, 2013.
- Vorländer, M. Auralization; Springer: Berlin, Germany, 2008. [Google Scholar]
- Martellotta, F.; Álvarez-Morales, L. Virtual acoustic reconstruction of the church of Gesù in Rome: A comparison between different design options. Proceedings of Forum Acusticum 2014, Krakow, Poland, 07–12 September 2014. [Google Scholar]
- Cox, T.J.; Dalenback, B.I.; D’Antonio, P.; Embrechts, J.J.; Jeon, J.Y.; Mommertz, E.; Vorländer, M. A tutorial on scattering and diffusion coefficients for room acoustic surfaces. Acta. Acust. united Ac. 2006, 92, 1–5. [Google Scholar]
- Cox, T.J.; D’antonio, P. D’Antonio: Acoustic Absorbers and Diffusers: Theory, Design and Application; Spon Press: London, UK, 2004. [Google Scholar]
- Dalenbäck, B.I.L. CATT-Acoustic v9 Powered by TUCT Users’ Manual; CATT: Gothenburg, Sweeden, 2011. [Google Scholar]
- ODEON Room Acoustics Software User’s Manual Version 15 Published in November 2019. Available online: https://odeon.dk/download/Version15/OdeonManual.pdf (accessed on 10 December 2019).
- Postma, B.N.; Katz, B.F. Creation and calibration method of acoustical models for historic virtual reality auralizations. Virtual Real. 2015, 19, 161–80. [Google Scholar] [CrossRef]
- Martellotta, F. The just noticeable difference of center time and clarity index in large reverberant spaces. J. Acoust. Soc. Am. 2010, 128, 654–663. [Google Scholar] [CrossRef]
- Bork, I. A comparison of room simulation software-the 2nd round robin on room acoustical computer simulation. Acta. Acust. United Ac. 2000, 86, 943–956. [Google Scholar]
- Álvarez-Morales, L.; Galindo, M.; Girón, S.; Zamarreño, T.; Cibrián, R.M. Acoustic characterisation by using different room acoustics software tools: A comparative study. Acta. Acust. United Ac. 2016, 102, 578–591. [Google Scholar]
- Cirillo, E.; Martellotta, F. Worship, Acoustics, and Architecture; Multi Science Publishing Company Limited: Brentwood, UK, 2006. [Google Scholar]
- Sü Gül, Z. Acoustical Impact of Architectonics and Material Features in the Lifespan of Two Monumental Sacred Structures. Acoustics 2019, 1, 493–516. [Google Scholar] [CrossRef] [Green Version]
- Cirillo, E.; Martellotta, F. Sull’applicabilità della formula di sabine nelle chiese romaniche. In Proceedings of the Associazione Italiana di Acustica, 29° Convegno Nazionale, Ferrara, Italy, 12–14 June 2002. [Google Scholar]
- Girón, S.; Álvarez-Morales, L.; Zamarreño, T. Church acoustics: A state-of-the-art review after several decades of research. J. Sound. Vib. 2014, 411, 378–408. [Google Scholar] [CrossRef]
- Harris, C.M. Handbook of Noise Control; McGraw Hill: New York, NY, USA, 1997. [Google Scholar]
- Barron, M. Subjective study of British concert halls. Acustica 1998, 66, 2–14. [Google Scholar]
- Martellotta, F. Subjective study of preferred listening conditions in Italian Catholic churches. J. Sound. Vib. 2008, 317, 378–99. [Google Scholar] [CrossRef]
- Rossing, T. Springer Handbook of Acoustics; Springer: New York, NY, USA, 2007. [Google Scholar]
- Bradley, J.S. Review of objective room acoustics measures and future needs. Appl. Acoust. 2011, 72, 713–720. [Google Scholar] [CrossRef]
- Barron, M. The subjective effects of first reflections in concert halls-The need for lateral reflections. J. Sound. Vib. 1971, 15, 475–494. [Google Scholar] [CrossRef]
- Barron, M. Spatial impression due to early lateral reflection in concert halls: the derivation of a physical measure. J. Sound Vib. 1981, 77, 211–232. [Google Scholar] [CrossRef]
- Giménez, A.; Cibrián, R.M.; Cerdá, S.; Girón, S.; Zamarreño, T. Mismatches between objective parameters and measured perception assessment in room acoustics: A holistic approach. Build. Environ. 2014, 74, 119–131. [Google Scholar] [CrossRef] [Green Version]
- Iris software, Iris.co.nz. Available online: http://www.iris.co.nz/ (accessed on 10 December 2019).
- Ŝumarac-Pavlović, D.; Mijić, M. An insight into the influence of geometrical features of rooms on their acoustic response based on free path length distribution. Acta. Acust. United Ac. 2007, 93, 1012–1026. [Google Scholar]
- Available online: https://www.independent.co.uk/commercial/visityork/step-into-the-pulpit-at-york-minster-9077425.html (accessed on 12 December 2019).
- Wheaton, N.S. A Journal of a Residence During Several Months in London: Including Excursions Through Various Parts of England; and a Short Tour in France and Scotland; in the Years 1823 and 1824. Available online: https://archive.org/details/journalofresiden00whea/page/n5/mode/2up (accessed on 10 December 2019).
- Available online: https://www.eborsingers.org/ (accessed on 10 December 2019).
- Helena Daffern (University of York, York, UK), interviewed 22 October 2019.
- Elicio, L.; Martellotta, F. Acoustics as a cultural heritage: The case of Orthodox churches and of the “Russian church” in Bari. J. Cult. Herit. 2015, 16, 912–917. [Google Scholar] [CrossRef]
- Available online: ttps://vpcp.chass.ncsu.edu/ (accessed on 10 December 2019).
Figure 1.
Floor plan of the York Minster’s Chapter House with the source (S) and receiver (R) positions set for the acoustic measurements. The complete floor plan of the Minster is included for showing its location.
Figure 1.
Floor plan of the York Minster’s Chapter House with the source (S) and receiver (R) positions set for the acoustic measurements. The complete floor plan of the Minster is included for showing its location.

Figure 2.
York Minster’s Chapter House interior views: looking to the West side (left) and looking to the East side (right).
Figure 2.
York Minster’s Chapter House interior views: looking to the West side (left) and looking to the East side (right).

Figure 3.
Examples of some typical configurations of the Chapter House: (a) front stage arrangement; (b) amphitheatre-like arrangement; and (c) original surrounding arrangement.
Figure 3.
Examples of some typical configurations of the Chapter House: (a) front stage arrangement; (b) amphitheatre-like arrangement; and (c) original surrounding arrangement.

Figure 4.
Impulse-to-noise ratio (INR) measured values obtained at each source-receiver combination characterised in the York Minster’s Chapter House (grey lines) and the spatially averaged values (green line). The minimum value of INR required for a reliable calculation of T30 is also shown (red line).

Figure 5.
Acoustic model of the York Minster’s Chapter House. Detail of the simplifications including the limestone canopies and the three options tested for the limestone clusters of shafts or nerves framing the stained glasses.
Figure 5.
Acoustic model of the York Minster’s Chapter House. Detail of the simplifications including the limestone canopies and the three options tested for the limestone clusters of shafts or nerves framing the stained glasses.

Figure 6.
Measured and simulated values of several acoustic parameters (from top to bottom: EDT, TS, C80, and D50): Spectral behaviour of the spatially averaged values (left column) and spectrally averaged values obtained at each source-receiver combination (right column). The values corresponding to 1 and 2 JND have been also included.

Figure 7.
York Minster’s Chapter House simulation model views.

Figure 8.
Spatially averaged values of the acoustic parameters as a function of frequency (left column)., and mid values as a function of source-receiver distance (right column).
Figure 8.
Spatially averaged values of the acoustic parameters as a function of frequency (left column)., and mid values as a function of source-receiver distance (right column).

Figure 9.
Spatially averaged values of the acoustic parameters as a function of frequency (left column)., and mid values as a function of source-receiver distance (right column).
Figure 9.
Spatially averaged values of the acoustic parameters as a function of frequency (left column)., and mid values as a function of source-receiver distance (right column).

Figure 10.
Representation of the early energy arriving at the receiver points (Iris plots, 2D XY plane, level range set to 40 dB with the direct sound level individually set as a reference (0dB)): front stage arrangement (left); and amphitheatre-like arrangement (right).
Figure 10.
Representation of the early energy arriving at the receiver points (Iris plots, 2D XY plane, level range set to 40 dB with the direct sound level individually set as a reference (0dB)): front stage arrangement (left); and amphitheatre-like arrangement (right).

Figure 11.
Representation of early and late energy arriving at selected S-R combinations (2D Iris plots, XY plane (upper row) and YZ plane (lower row), level range set to 40 dB with the direct sound level individually set as a reference (0 dB)).
Figure 11.
Representation of early and late energy arriving at selected S-R combinations (2D Iris plots, XY plane (upper row) and YZ plane (lower row), level range set to 40 dB with the direct sound level individually set as a reference (0 dB)).

Figure 12.
Simulated mappings of the D50 at 1 kHz (upper row) and STI (lower row) obtained for the different source positions. York Minster’s Chapter House in its current state.
Figure 12.
Simulated mappings of the D50 at 1 kHz (upper row) and STI (lower row) obtained for the different source positions. York Minster’s Chapter House in its current state.

Figure 13.
D50m and STI results derived from the simulated RIR simulation at each source-receiver combination. York Minster’s Chapter House in its current state.
Figure 13.
D50m and STI results derived from the simulated RIR simulation at each source-receiver combination. York Minster’s Chapter House in its current state.


Table 1.
Geometrical data of the York Minster’s Chapter House.
| Approximate Interior Volume | Max Interior Height | Max Interior Length | Octagon Side’s Length | Approximate Interior Floor Surface |
|---|---|---|---|---|
| 5280 m3 | 20.3 m | 19.2 m a | 6.95 m | 240 m2 |
a Measured glass to glass.
Table 2.
Summary of the source-receiver combinations included in the survey.
| Source position ID | S1 | S2 |
| Num. Rec. points | 10 | 8 |
| Receiver points ID | R01 – R10 | R01, R04 – R06, R08 – R11 |
Table 3.
Acoustic properties of the materials used in the simulation model of the York Minster’s Chapter House, and the area which each of them occupies in the model.
Table 3.
Acoustic properties of the materials used in the simulation model of the York Minster’s Chapter House, and the area which each of them occupies in the model.
| Absorption Coefficients | Scatt. Coef | Area (m2) | ||||||
|---|---|---|---|---|---|---|---|---|
| Frequency (Hz) | 125 | 250 | 500 | 1 k | 2 k | 4 k | 707 | - |
| Limestone walls and seats | 0.02 | 0.02 | 0.03 | 0.04 | 0.05 | 0.05 | 0.05 | 686.8 |
| Stained glasses | 0.25 | 0.20 | 0.14 | 0.10 | 0.05 | 0.05 | 0.15 | 384.0 |
| Lath and plaster vault1 | 0.16 | 0.16 | 0.16 | 0.17 | 0.24 | 0.24 | 0.35 | 321.0 |
| Tiled Floor | 0.01 | 0.01 | 0.01 | 0.02 | 0.02 | 0.02 | 0.05 | 240.0 |
| Limestone nerves2 | 0.03 | 0.04 | 0.05 | 0.05 | 0.065 | 0.065 | 0.15 | 131.0 |
| Limestone canopies2 | 0.03 | 0.04 | 0.05 | 0.05 | 0.065 | 0.065 | 0.45 | 139.4 |
| Marble columns | 0.01 | 0.01 | 0.01 | 0.02 | 0.02 | 0.02 | 0.35 | 113.6 |
| Wooden doors | 0.14 | 0.10 | 0.06 | 0.08 | 0.10 | 0.10 | 0.20 | 8.8 |
1 Derived from tuning process; 2 initial values raised up to compensate for the simplifications of the model.
Table 4.
Reverberation time (T30) and Early decay time (EDT) values1 measured under unoccupied conditions at the York Minster’s Chapter House, together with their standard deviation (SD).
Table 4.
Reverberation time (T30) and Early decay time (EDT) values1 measured under unoccupied conditions at the York Minster’s Chapter House, together with their standard deviation (SD).
| Frequency Band (Hz) | 125 | 250 | 500 | 1 k | 2k | 4 k |
|---|---|---|---|---|---|---|
| T30 (s) | 5.00 | 5.17 | 5.56 | 5.24 | 4.19 | 2.82 |
| SDT30 | 0.13 | 0.13 | 0.06 | 0.05 | 0.03 | 0.02 |
| EDT (s) | 4.97 | 4.94 | 5.45 | 5.04 | 3.92 | 2.36 |
| SDEDT | 0.53 | 0.49 | 0.30 | 0.17 | 0.10 | 0.06 |
1 spatially averaged including all the source-receiver combinations characterised.
Table 5.
A comparison of the reverberation time of the York Minster’s Chapter House in its current state (T30-CS) and the estimation in its original state (T30-M). Simulated values and differences in terms of JND.
Table 5.
A comparison of the reverberation time of the York Minster’s Chapter House in its current state (T30-CS) and the estimation in its original state (T30-M). Simulated values and differences in terms of JND.
| Frequency Band (Hz) | 125 | 250 | 500 | 1k | 2k | 4k |
|---|---|---|---|---|---|---|
| T30-M (s) | 3.90 | 4.16 | 4.34 | 4.31 | 3.75 | 2.65 |
| T30-M vs. T30-CS (s) | –1.10 | –1.01 | –1.22 | –0.93 | –0.44 | –0.17 |
| T30-M vs. T30-CS (JND) | –4.40 | –3.91 | –4.39 | –3.55 | –2.10 | –1.21 |
© 2020 by the authors. Licensee MDPI, Basel, Switzerland. This article is an open access article distributed under the terms and conditions of the Creative Commons Attribution (CC BY) license (http://creativecommons.org/licenses/by/4.0/).
Share and Cite
MDPI and ACS Style
Álvarez-Morales, L.; Lopez, M.; Álvarez-Corbacho, Á. The Acoustic Environment of York Minster’s Chapter House. Acoustics 2020, 2, 13-36. https://doi.org/10.3390/acoustics2010003
AMA Style
Álvarez-Morales L, Lopez M, Álvarez-Corbacho Á. The Acoustic Environment of York Minster’s Chapter House. Acoustics. 2020; 2(1):13-36. https://doi.org/10.3390/acoustics2010003
Chicago/Turabian StyleÁlvarez-Morales, Lidia, Mariana Lopez, and Ángel Álvarez-Corbacho. 2020. "The Acoustic Environment of York Minster’s Chapter House" Acoustics 2, no. 1: 13-36. https://doi.org/10.3390/acoustics2010003