Laws of Spatially Structured Population Dynamics on a Lattice


1
Department of Mathematics, University of California Irvine, Irvine, CA 92617, USA
2
Department of Population Health and Disease Prevention, Program in Public Health Susan and Henry Samueli College of Health Sciences, University of California Irvine, Irvine, CA 92697, USA
*
Author to whom correspondence should be addressed.
Physics 2022, 4(3), 812-832; https://doi.org/10.3390/physics4030052
Submission received: 14 April 2022
/
Revised: 6 June 2022
/
Accepted: 14 June 2022
/
Published: 22 July 2022
(This article belongs to the Special Issue Dedication to Professor Michael Tribelsky: 50 Years in Physics)
Abstract
:We consider spatial population dynamics on a lattice, following a type of a contact (birth–death) stochastic process. We show that simple mathematical approximations for the density of cells can be obtained in a variety of scenarios. In the case of a homogeneous cell population, we derive the cellular density for a two-dimensional (2D) spatial lattice with an arbitrary number of neighbors, including the von Neumann, Moore, and hexagonal lattice. We then turn our attention to evolutionary dynamics, where mutant cells of different properties can be generated. For disadvantageous mutants, we derive an approximation for the equilibrium density representing the selection–mutation balance. For neutral and advantageous mutants, we show that simple scaling (power) laws for the numbers of mutants in expanding populations hold in 2D and 3D, under both flat (planar) and range population expansion. These models have relevance for studies in ecology and evolutionary biology, as well as biomedical applications including the dynamics of drug-resistant mutants in cancer and bacterial biofilms.
1. Introduction
Before we begin describing some of our attempts to derive a number of mathematical laws for biological population dynamics, one of the authors (N.L.K.) would like to express her eternal gratitude to Michael Tribelsky, who was her teacher in the Physics Department, Moscow State University, at the beginning of the 1990s. Without his advice and guidance, N.L.K. would not be what she is now. Tribelsky’s relentless optimism (often disguised) has taught her to overcome whatever difficulties life has posed. N.L.K. always follows Tribelsky’s principle that problems (in life, as well as in science) must be addressed at the same pace, and not faster, than they are thrown at you (“Прoблемы нужнo решать пo мере их пoступления”). Tribelsky’s “special course”, delivered to the theoreticians from the Low Temperature Division, opened up a universe of diverse phenomena that are, at the same time, fascinating and amenable to understanding. He helped instill the sense of wonder at the beauty of the surrounding world, and this has stayed with N.L.K. no matter what subject matter she happened to focus on, from language evolution to virus dynamics.
Much has been said about the existence of laws in biology. Physicists in particular often feel that some beautiful (and, hopefully, simple) formal relations must exist to help us navigate the complexities of life. In this paper, we look for universal biological laws in the area of population dynamics, which is an area relevant for studies in ecology and evolutionary biology. A rich literature exists about the evolutionary dynamics of mutant spread and invasion, investigating aspects such as fixation probabilities and fixation times of different kinds of mutants in constant populations [1,2], as well as mutant dynamics in growing populations [3,4,5], where mathematical approaches were motivated by the famous Luria–Delbruck experiments [6]. Traditionally, much of this work has focused on well-mixed (non-spatial), homogeneous populations. In a wide array of biological scenarios, however, cells and organisms evolve in more complex settings, such as in spatially structured habitats (bacterial biofilms, cells in tissues and tumors) and within heterogeneous population structures (such as stem and more differentiated cells in tissues [7] or bacteria with different degrees of specialization in biofilms [8,9]). In the last 15 years, theoretical work has extended our understanding of mutant emergence in spatially structured populations [10,11,12,13,14,15,16,17,18]. An excess of mutational jackpot events was observed in spatial compared to well-mixed systems; such events result from mutations arising at the surface of expanding, spatially structured populations, surfing at the edge of range expansions, and appearing as mutant “bubbles” or “slices”. These jackpot events have been implicated in the finding that the average number of neutral mutants when the total population reaches a given threshold size is significantly larger in spatial compared to non-spatial settings [18]. Further work by our group [19] showed that the evolutionary dynamics of mutants in spatially structured, expanding populations are characterized by additional complexities.
In general, spatial population dynamics are significantly more complex compared to the mass-action dynamics, and analytical approximations are not easily derived. In this paper, we describe two examples where our group has been successful in obtaining analytical approximations for laws of spatial dynamics: (a) steady-state density in space; (b) scaling laws for the number of mutants in expanding populations.
(a) Analytical approximations for steady-state density. In [20], we considered the phenomenon of range expansion, the process in biology by which a species spreads to new areas. We derived a numerical methodology that allowed for efficient computations of the number of individuals as the species expands its range in space. In addition, we found approximations for the steady-state density of populations, or the core density of expanding colonies, in several cases, such as the von Neumann and Moore neighborhoods on a square lattice and for a honeycomb neighborhood on a hexagonal lattice; see Table 1. For the same death-to-birth ratio, the grid is more packed under the Moore neighborhood, because of the availability of more neighbors per site. As a consequence, the equilibrium density corresponding to the Moore neighborhood is higher and closer to that of mass-action. A general formula that provides an approximation for the steady-state density as a function of the number of neighbors is also given (Table 1). In this paper, we provide a novel mathematical derivation of these laws, which generalizes to any neighborhood size (Section 3).
(b) Laws of disadvantageous, neutral, and advantageous mutant spread in different geometries. In [19], we studied the evolutionary dynamics of disadvantageous, neutral, and advantageous mutants in spatially expanding populations, where the growing front was characterized by different symmetries in two dimensions (2D) and 3D; see Table 2. In particular, while disadvantageous mutants grow linearly with N (and differences among different cases are more subtle), neutral mutants grow as a decreasing power of N as we go from a 2D flat front (which is essentially a 1D growth), to a 2D and 3D range. There are always fewer neutral or advantageous mutants in the mass-action (exponentially growing) case compared to any spatially restricted growth. Here (Section 4 and Section 5), we provide a derivation of these laws, which follows [19].
In the case of disadvantageous mutants, the number of mutants always scales with the first power of N. In addition to this scaling law, for the case of disadvantageous mutants, we also derive an approximate expression for the number of mutants in quasi-steady-state, given that the number of wild-type cells is N:
see Section 4.1 for details and Section 2 for definitions (this expression is valid for a 2D von Neumann grid, and can be generalized to other cases). We show that the proportion of mutants at selection–mutation balance is higher for spatially distributed systems compared to well-mixed systems at equilibrium.
2. General Setup and Agent-Based Modeling of Population Dynamics
In order to describe the spatial growth and turnover of cells, as well as the population dynamics of species, we use a continuous-time Markov process, which is a generalization of the usual birth–death process and a type of a contact process. We assume that individuals of one or two different types exist, which we call “wild-type” and “mutant” individuals (to reflect the versatility of these models, we use both “individuals” and “cells” to refer to the biological agents under consideration). At the core of the description is a lattice that specifies possible locations of cells. This can be viewed as a geometric network, where each node is connected with its neighbors. The state space consists of different locations of the cells of the two types on the lattice. Cells are characterized by division and death rate parameters, which are denoted by and for the division and death rates of the wild-type cells and and for division and death rates of mutants. In the case where only one type of cell is considered, the notation is simply L and D for the two rates.
Each of the nodes can either be empty or contain one cell of either type. During an infinitesimally small time increment, , a given wild-type cell can attempt a division with probability and death with probability . If division is attempted, then an offspring is placed in one of the neighboring locations, chosen randomly and uniformly; division only happens if the chosen node is empty. The offspring cell is wild-type with probability and mutant with probability u, where is the mutation rate. Mutant cells divide and die according to similar rules, except in the models considered here, we always assume that an offspring of a mutant cell is a mutant cell.
A number of biological phenomena can be studied by slight modifications of this process. To study the growth laws in the absence [20] or presence [19] of mutants, we assume an infinitely large grid. To study the quasi-steady-state (which describes, e.g., the turnover of cells in homeostasis), we make the grid finite and impose relevant boundary conditions.
For numerical explorations of these processes, agent-based modeling (ABM) is often used; see, e.g., [21,22,23]. For example, consider a two-dimensional ABM on a square grid with individuals of two types. A spot on the grid can be empty or can contain a cell, which is either wild-type or mutant. At each time step, the grid is randomly sampled N times, where N is the total number of cells currently in the system. If the sampled cell is wild-type, the cell attempts division (described below) with a probability proportional to or dies with a probability proportional to . When reproduction is attempted, a target spot is chosen randomly among the nearest neighbors of the cell. A neighborhood may contain, e.g., cells (the von Neumann neighborhood) or neighbors (the Moore neighborhood). If that spot is empty, the offspring cell is placed there. If it is already filled, the division event is aborted. (This modeling choice represents the assumption that the probability of divisions is reduced under more crowded conditions. This is similar to the logistic growth term often used in deterministic models.) The offspring cell is assigned wild-type with probability , and it is a mutant with probability u. If the sampled spot contains a mutant cell, the same processes occur. Attempted division occurs with a probability , and the cell dies with a probability . Initial and boundary conditions are determined by the specific geometric setting investigated. For 2D spatial simulations, an square or an rectangular domain could be considered. At the boundaries of the domain, a spot is assumed to have fewer neighbors, i.e., more division events will fail. The process starts with a single wild-type cell, placed, e.g., in the center of the grid. Simulations always stop before the boundary of the grid is reached.
In what follows below, we derive some approximations of important observables from these types of dynamics, which have a clear biological meaning. We discuss both single-type populations and the co-dynamics of wild-type and mutant individuals.
3. Analytical Approximations for Steady-State Density (A Single Type)
In this Section, we consider populations consisting of only a single cell type with division and death rates L and and no mutations ().
Equilibrium Density in Space: An Analytical Method
The process of range expansion (colonization) is one of the basic types of biological dynamics, whereby a species grows and spreads outwards, occupying new territories. Spatial modeling of this process is naturally implemented as a stochastic ABM of the type described above, with individuals (in this case, of only a single type) occupying nodes on a rectangular grid, births and deaths occurring probabilistically, and individuals only reproducing onto un-occupied neighboring spots. This approach is known to be computationally expensive. In [20], we derived a set of efficient computational tools, which were shown to be in good agreement with the underlying stochastic process of spatial expansion. As part of the method development, we were able to obtain approximate expressions for the quasi-steady-state (core) density of the individuals for different types of grids. In [20], we provided the density formula for the contact process:
where and is the number of neighbors. Equation (2) was derived for several cases of , but no general derivation that would work for a given was supplied. Here, we present such a derivation, starting with and generalizing to any .
In 1D, with only neighbors, Equation (2) gives
which, although a slight overestimation of the density, provides a good approximation. To derive this formula, consider a 1D ABM of the type described above. At the equilibrium, denote by the probability that a cell is located next to an existing cell and by the probability that a cell is located next to an existing empty spot. These two quantities can be estimated numerically.
A 1D realization of the population at a fixed moment of time can be viewed as a Markov chain with states , where state 0 corresponds to the absence of a cell at a given spot and state 1 denotes the presence of a cell at a given spot. The transition probability matrix is given by
where is the probability that there is a cell on the right of a cell, is the probability that the spot on the right of a cell is empty, is the probability that there is a cell on the right of an empty spot, and is the probability that an empty spot is on the right of an empty spot. The steady-state probability distribution of this process is , where is the probability that a given spot contains a cell. This can be found as the eigenvector corresponding to the unit eigenvalue and is given by
This quantity (given the numerically calculated and ) is a very good approximation of the actual (numerical) density. Another way to derive this connection between and is as follows:
where the left-hand side is the probability to have a cell at a given point, the first term on the right assumes that there is a cell to the left of that point () and, then, the given point contains a cell with probability , and the second term on the right assumes that there is no cell to the left of that point () and, then the given point contains a cell with probability . Solving this for gives expression (4).
Now, suppose that a cell is located at a given location. Then, a cell is located to the right of it (which we call the focal location) with probability . We have, after a single update of the contact process:
The first term on the right assumes that there was no cell at the focal location (), but a cell on its left was chosen (probability ) that divided to its right () or that a cell on its right exists (probability ), was chosen (), and divided to its left (). The second term assumes that there was a cell at the focal location () and it did not die . The equality follows from the assumption of having an equilibrium.
Similarly, we can assume that there is no cell at a given location, then to its right (the focal location), the probability to have a cell, , satisfies:
The first term on the right assumes that there was no cell at the focal location (), but a cell on its right exists (probability ), was chosen (), and divided to its left (). The second term assumes that there was a cell at the focal location () and it did not die .
This analysis easily generalizes to other systems (including higher dimensionalities), where the number of neighbors is given by . Instead of Equations (6) and (7), we have
Solving this system, we obtain
Substitution into Equation (4) (which holds in these systems because Equation (5) remains valid in these systems) yields Equation (2).
Figure 1 plots the quasi-equilibrium density approximated by Equation (2) as a function of for two finite values of corresponding to the von Neumann and Moore neighborhoods. Figure 1a compares them with the well-known mass-action result, showing that higher connectivity of the underlying network corresponds to a higher density of the cells. Figure 1b and Figure 1c compare the results with numerical simulations, demonstrating that Equation (2) provides a very good approximation. We notice that the approximation works better at higher densities, compared to lower ones. In the derivation, we assumed that the state of a given position on the lattice only depends on its immediate neighbor, and not on other, more distant, sites. This assumption becomes less valid at low densities, because macroscopic structures with strong correlations over distances form. Therefore, the approximation becomes worse as the death rate approaches the division rate.
4. Disadvantageous Mutants and Selection–Mutation Balance in Spatial Models
In the remainder of the paper, we consider two types of individuals, wild-type and mutants. This Section deals with disadvantageous mutants (defined below), while Section 5 focuses on neutral and advantageous mutants. We start with an Ordinary Differential Equation (ODE) formulation.
4.1. A Basic ODE Formulation
Let us denote the wild-type population as and the mutant population as . Suppose that mutations happen at the rate u, and . Then, the competition dynamics of cells in a mass-action system can be formulated as follows:
where is the carrying capacity. This system illustrates differences in the behavior of advantageous and disadvantageous mutants. If
then the globally stable solution is , , that is the mutant excludes the wild-type and takes over. In this case, we say that the mutant is advantageous. If the inequality above is reversed, the mutants are disadvantageous and the so-called selection–mutation balance is reached, where mutants and wild-type cells coexist. This happens because the (stronger) wild-type cells produce mutants at a nonzero rate u, but the latter cannot take over and remains at a fraction of the population. For simplicity, let us assume that the mutation rate is low:
Then, we can say that the mutants are disadvantageous if
and then, the equilibrium solution is given by
where we neglected terms of the order , while the number of mutants is
where we neglected terms of the order .
Below, we calculate the equilibrium densities of disadvantageous mutants and (advantageous) wild-type cells in a spatially distributed system at steady-state. This will also correspond to the densities in the core of an expanding system away from the advancing front.
4.2. A Spatial Description: Equations for the Densities
We restrict our description to a 2D square grid, with the von Neumann neighborhood (that is, each location has four nearest neighbors); the methodology is generalizable to the Moore neighborhood (eight neighbors). We use a method similar to that of [20]. Two random variables describe the state of the stochastic system at each spatial location, x: describes wild-type cells, such that
and describes mutant cells, such that
Note that and cannot be equal to one simultaneously; an empty spot corresponds to . We assume that wild-type cells have division and death rates and and mutant cells have division and death rates and . Wild-type cells mutate with probability u, and no back mutations are considered.
Denote the expectation of and by
where we assumed that the expected values do not depend on spatial location, since we are interested in spatially homogeneous equilibrium solutions. We have
where the product is nonzero only if location x is empty, and the summation goes over all the neighbors of point x, which reproduce into location x at rates and if they are wild-type or mutant, respectively. The superscript in the notation , refers to the quantity at a location, k, neighboring the focal location, x.
Let us consider the von Neumann neighborhood (). In the right-hand side of Equation (15), the terms are the summation having the form
and in Equation (16), there are also terms of the form
In the expressions above, we have , because either or is zero at location , and the three types of dyads are defined as follows:
- is the probability to have two wild-type cells at two neighboring locations;
- is the probability to have a wild-type cell and a mutant at two neighboring locations;
- is the probability to have two mutant cells at two neighboring locations.
Figure 2a illustrates these three configurations. In terms of these correlations, Equations (15) and (16) can be rewritten as
The correlations for the three dyads that appear in these equations require their own equations to close the system. Let us derive an equation for W. We have
where we assume that one of the points in the dyad contains a wild-type cell (term ), while the other point is empty (term ), and that one of its neighbors (location ) contains a wild-type cell, which reproduces faithfully into point x at rate . Note that either of the two points could be empty, which results in the multiplier of two in the first term on the right-hand side. Similarly, either of the dyad’s locations can experience cell death, resulting in the negative rate . In order to calculate the average, we need to consider terms
Note that here and below, the operation of averaging makes the expression independent of the actual location x. Further, the superscripts and do not refer to any specific neighbor of x, but to any neighbor of x; in particular, location may be the same as or different than location . In the case when the two locations are different, the correlation (21) is presented in Figure 2b, on the left.
In the equations for and , the following expressions appear in addition to Equation (21):
These correlations are shown in Figure 2b, center and right. Therefore, denoting by a and b either or , we evaluate the average of the form
which corresponds to a dyad with one of the locations (location x) empty and the other (location ), containing type “a”, while a neighbor of x (location ) contains type “b”. First, let us assume that location is different from location . Under von Neumann neighborhoods, this implies that and are not each other’s neighbors because on a square grid, there could not be a non-degenerate triangle with diameter 1 or less. expression (22) is equal to
The expression in the denominator is calculated as follows:
Depending on the types at location x, the expressions in the numerator of Equation (23) can be of two types:
and they are calculated in (17) and (18), respectively.
Next, we assume that location is the same as . Then, if types “a” and “b” in expression (22) are different, then we obtain . If the types are the same, then we obtain expression (17) or (18). To summarize, expressions of type (22) are given as follows:
The equation for W is then given by
Similarly, the other two equations can be derived:
4.3. Selection–Mutation Balance Solution
Solving these equations in the steady-state exactly is difficult, but if the mutation rate , we can find the approximate solution. We start by setting and obtaining the steady-state solution. Apart from the trivial solution and a negative solution, there are two symmetric solutions where only one type survives (competitive exclusion). We use the one where the wild-type excludes mutants:
where the superscript corresponds to the zeroth order in the expansion in terms of small u. Note that, as expected, the expression for coincides with the one given in Table 1 for von Neumann grid (). We then look for the first correction by substituting
inserting in the system of five equations, keeping only the first order of expansion in u, and solving for . We obtain
This is the equilibrium solution corresponding to mutation–selection balance in the presence of spatial interactions. This approach is valid as long as the wild-type is advantageous (inequality (12)). In the opposite scenario, this solution is unstable, and the system converges to the mutants excluding the wild-type.
Under selection–mutation balance, of interest is the equilibrium proportion of mutants in the system given by
It is instructive to compare this quantity with the equilibrium proportion of mutants in a mass-action system, , Equation (14):
We have
In other words, the relative contents of mutants (in proportion to the wild-types) are higher in spatially distributed systems compared to mass-action systems at equilibrium. This result resembles our recent analysis presented in [24], where we showed that the mean number of disadvantageous mutants is higher in fragmented populations compared to well-mixed populations. A comparison with non-equilibrium, growing, well-mixed populations is presented in [19] and not discussed here.
4.4. Applications and Comparison with Computations
The result in Equation (29) is applicable to two relevant scenarios.
- Quasi-equilibrium density in finite populations. If simulations are continued until a finite grid is filled, the population reaches a quasi-equilibrium state where wild-type and disadvantageous mutant cells coexist. For a 2D square grid under a von Neumann neighborhood, the density of the mutants is approximated by in Equation (28), while the density of wild-types is given by , Equation (27). The total numbers of mutant and wild-type cells are obtained by multiplying the quantities and by the total number of grid points, respectively. Note that this scenario is not interesting in the case of advantageous or neutral mutants, as the entire population will eventually consist of mutant cells.
- Number of mutants in spatially expanding populations. Simulating a growing population (on a large grid where the boundaries are not reached), we can ask how the number of disadvantageous mutants scales with the total number of cells, N. Since the core of the expanding colony is in quasi-equilibrium, Equation (29) shows that the number of mutants grows as the first power of N. Results for the scaling laws for neutral and advantageous mutants are discussed in the next Section.
The expected number of mutants predicted theoretically was compared with the results of numerical simulations. This was done in the following way. At size N, the number of mutants (in the von Neumann case) is predicted to be ; see Equation (29). Solving the equation = const, we can obtain the pairs of mutant kinetic rates corresponding to a predicted given number of mutants in a system of size N. Figure 3a shows the predicted number of mutant as a contour plot. The closer to the “neutrality” line (see inequality (12)), the larger the predicted number of mutants. The solution of equation is shown in Figure 3b and for five points from the solution set, the predicted number of mutants (given by ) is compared with the numerically obtained mean (plotted together with the standard deviation, Figure 3c. We can see that for larger mutant division rates, the deviation from the theory becomes significant. Figure 3d shows a histogram of the numbers of mutants for the parameters corresponding to the fifth point. One can see that the distribution has a long tail and a very large standard deviation. This is the consequence of macroscopic structures (“slices”) that cannot be handled by the present, local, method.
5. Laws of Neutral and Advantageous Mutant Spread in Different Geometries
In the previous Section, we showed that (under the assumption of small mutation rates) the number of disadvantageous mutants in a spatially growing population scales with the total number of cells, as . If cells are advantageous or disadvantageous, they obey different scaling laws [19]. In this Section we present simple derivations for those laws in different geometries.
5.1. Derivation of the Growth Laws
Below, we consider several scenarios that differ by the dimensionality of the grid (2D or 3D) and by the direction of growth (planar growth vs. range expansion; see Table 2.
5.1.1. Two-Dimensional Flat Front
Let us first assume that the death rate of cells is equal to zero. Consider cells growing along the surface of a cylinder of width W. This represents a one-directional growth process, where during each generation, we assume that W new cells appear, and the the total population is given by , where represents the number of layers. The value of is proportional to the number of generations, and thus to the physical time, t:
The following calculation estimates the growth law of mutants. Every time a new layer (of width W) is added, the mean number of new mutations is given by . Suppose that mutants are neutral. Then, each such mutation will give rise to an array of daughter mutant cells of width 1; see Figure 4. The length of this array is given by , where i is the layer at which the mutation occurred. Therefore, the total expected number of neutral mutants is a cylinder of length given by
where we assumed . Note that in this derivation, we assumed that the number of mutants is small compared to the total population, and individual mutant clones do not interact. In a more precise calculation, the number of wild-type cells in each layer is smaller than W because of the existence of mutants, and thus, the rate of new mutant production is smaller than . We, however, assume that , such that the number of mutants is relatively small.
Note that the number of neutral mutants decreases with W; see Figure 5; the largest number of mutants is achieved in the case of , a one-dimensional expanding array of cells.
Next, let us consider advantageous mutants. In this case, each new mutant gives rise to a triangular clone. In the first layer, the width of the clone is 1; in the next layer it is ; in the kth layer, it is , where parameter measures the advantage of the mutants (with corresponding to neutral mutants). Therefore, we have
where for the approximation, we assumed that . Furthermore, for this simple calculation to be valid, we need to assume that the wedges created by mutants do not come close to the cylinder’s width, W, that is . In particular, Equation (31) can be valid for small values of , but only for mutants that are neutral for practical purposes ().
Note that when N is fixed, the total number of cell divisions that the system has undergone is also fixed. The number of mutants however is vastly different depending on the spatial configuration. It is the highest for (one row of cells) and decreases drastically with the width of the cylinder. This is consistent with the notion that spatial restrictions result in a heightened number of mutants, the 1D space () being the most spatially restrictive system. The reason for this is that in 1D, a mutant, once created, blocks the whole range of expansion and prevents wild-type cells from reproducing. The wider the front, the weaker this effect. Further, we note that in the special case where , mutant advantage does not play a role, and the number of advantageous, neutral, and even disadvantageous mutants is given by the same formula, Equation (30).
In the derivations above, a zero death rate of cells was assumed. This means that the colony spreads as a solid mass, where all of the spots in the core are occupied. Including a nonzero death rate does not change the geometric argument presented here, because the only difference now is that the expanding population is “porous”, such that the same number of cells occupies a larger number of spots on the grid. Therefore, adding a nonzero death rate does not alter the scaling laws derived here and in the other cases. For this reason, we present calculations assuming a zero death rate. Numerical calculations in Section 5.2 confirm that the scaling laws remain the same in the presence of nonzero death rates.
5.1.2. Two-Dimensional: Circular Range Expansion
Next, we turn to the dynamics of neutral mutants on a circle. Let us suppose that the radius of the circle is R and . The size of the colony increases via surface growth with and
As the range expansion proceeds, the circular layer of radius r will on average give rise to new mutations. Each mutation will result in a wedge expanding outwards. If the new mutation occurred in the layer with radius r, the number of mutating cells in layer r is 1. The number of mutants in the next layer is given by , because under the assumption of mutant neutrality, the fraction of mutants in each new layer of radius (with surface ) should stay constant and equal to . For layer j, the number of mutants is then given by . This gives rise to the following calculation:
(the approximation is valid for ).
For advantageous mutants in a growing 2D circle, the fraction of mutants will grow with each layer:
where we assumed . For this approximation to be valid, the mutant wedges should not exceed the circumference of the colony. Strictly speaking, this results in the condition , that is . For larger values of s, the events where the mutant covers the whole surface of the colony are no longer negligible.
5.1.3. Three-Dimensional Flat Front
In a 3D space, let us first consider a solid cylinder of constant radius , where initially, the cells are situated as a layer at the bottom of the cylinder and proceed to grow by adding layers of size . Each generation contributes new mutants, and as the colony grows to length (and volume ), we have in the neutral case:
which is similar to the 2D flat front expansion. If the mutants are advantageous, then their number will increase from layer to layer, giving rise to conical wedges. This gives rise to the following calculation:
where for the approximation, and the approach is valid as long as the wedge radius is smaller than that of the cylinder, .
5.1.4. Three-Dimensional Range Expansion
Next, we consider a 3D expanding sphere. For a sphere of radius R, we have , and the surface is given by . The size of the colony increases via 3D surface growth with . Each spherical layer of radius r will on average give rise to new mutations. Each mutation will result in a conical wedge expanding outwards. If the new mutation occurred in layer with radius r, the number of mutating cells in layer r is 1. The number of mutants in a layer of radius is given by , because under the assumption of mutant neutrality, the fraction of mutants in each new layer should stay constant (and equal to ). Therefore, we write:
(the approximation is again valid for ).
If the mutant in a growing 3D sphere is advantageous, the fraction in each layer will increase according to the fitness advantage s and stretch from layer to layer in the same way as for the neutral mutants. We therefore have
As before, the approximation holds if . The method assumes that the mutant colony’s size in each layer does not come close to the surface area, which amounts to the inequality .
5.1.5. Exponential (Non-Spatial, Mass-Action) Growth
Finally, for exponentially growing populations, similar formulas could be derived. In particular, for neutral mutants, we have
and for advantageous mutants with advantage (which is the ratio of the net growth rate of mutants and the net growth rate of wild-type cells), we have
see [25], Equation (14c); see also Equation (13) there for a more general formula.
5.2. Comparison with Numerical Simulations
We ran numerical simulations to check the results derived here. Figure 6 and Figure 7, which are described in detail below, illustrate the accuracy and applicability of the approximations derived above. They contain colored lines, which are the results of the numerical simulations, and black “guides for the eye”, which represent power-law functions characterized by the powers predicted by the theory. The figures show that these scaling laws hold over large intervals of N, the population size.
Figure 6 shows results for the case of 2D systems, with flat front expansion presented in Figure 6a and range expansion in Figure 6b. Plotted are the average numbers of mutants (the vertical axis) measured at different population sizes, N (the horizontal axis). Different curves correspond to different parameter values, summarized in Table 3.
To simulate flat front expansion (Figure 6a), ABM simulations were performed in cylindrical geometry, with an rectangular domain of width W. We started with an array of W wild-type cells at the left boundary of the domain and imposed periodic boundary conditions in the transversal direction. In each simulation, the cell population was allowed to grow to a size N, and the number of mutant cells at this size was recorded. Such simulations were performed repeatedly, and the average number of mutants was calculated. Simulation runs, in which the total cell population went extinct due to stochastic effects, were ignored.
Curves (A) and (B) in Figure 6a represent neutral mutants in the absence (A) and in the presence (B) of cell death. The black solid lines are guides for the eye with slope 2 in the log–log plot, representing the quadratic scaling law (see Table 2). Curves (C–G) represent advantageous mutants, and the dashed lines are guides for the eye with slope 3 in the log–log plot, representing the cubic scaling law (see Table 2). The different cases of advantageous mutants include systems with and without cell death, cases where mutants are advantageous by divisions (that is, have a larger division rate and the same death rate, compared with wild-type cells), and cases where mutants are advantageous by deaths (that is, have a smaller death rate and the same division rate, compared with wild-type cells). The cubic scaling law holds at least for part of the N values for all these cases; see [19] for more details.
To simulate range expansion (Figure 6b), we performed simulation on a square grid, starting with a single cell in the middle and letting the population expand outwards. Simulations resulting in population extinction were discarded, and all simulations were stopped before the boundary of the grid was reached. In Figure 6b, curves (A) and (B) again represent neutral mutants without and with cell death (with solid guides to the eye having slope ). The rest of the curves again explore advantageous mutants under different assumptions, with dashed guides for the eye having slope 2. In all cases, the scaling laws in Table 2 are confirmed.
Finally, Figure 7 demonstrates numerical results for 3D expanding colonies (with parameters listed in Table 4). The different cases considered include neutral and advantageous mutants experiencing 3D flat and range expansion, with the advantage realized through differences in division and death rates.
6. Conclusions
In this paper, we reviewed some recent results on the behavior of populations in lattice models. Both homogeneous populations (that is, populations consisting of a single type of individuals) and evolving populations (wild-type and mutants) were considered, and some simple laws derived approximate population densities in different dimensionalities, geometries of growth, and lattice types. The methodologies developed here can be extended to other cases, for example Equation (1) of mutant density was derived for a 2D von Neumann grid, but the methodology can be generalized, e.g., to the Moore lattice and also to 3D systems.
Our results have further practical applications, for example for understanding the dynamics of drug-resistant mutants in solid tumors [26] or the laws of evolution in bacterial biofilms [27].
The laws described in this paper can be viewed as a way to reduce a complex (spatial, stochastic) process to a small number of important observables, such as the mean equilibrium population density or the expected number of mutants. These quantities are shown to obey some simple rules, which relate these observables to the microscopic (kinetic) parameters of the cellular turnover and to system geometry. Having these simple rules can be very useful, if one, for example, fits a stochastic agent-based modeling (ABM) to a set of data: some parameters can be extracted by applying these laws and solving for the unknown quantities.
Aspects of the theory presented here can be tested in biological experiments. Even though lattice models present a certain simplification of reality, the scaling laws of mutant growth (Table 2) are quite versatile, as they have been shown (numerically) to hold in models with different neighborhood structures and over a large variety of assumptions on cells’ kinetic parameters. While some of these laws were tested previously (see, e.g., [18]), others, such as 3D flat and 3D range expansion laws, have not yet been confirmed experimentally.
Having simple laws that connect the macroscopic state with microscopic variables can be useful in interpreting experimental results. The laws in Table 1 describe the equilibrium density of populations of cells undergoing a turnover. By comparing the observed population density in experiments with the theoretical predictions, one could simply deduce the division-to-death ratio of cells growing in a given system. This can provide a useful quantitative measure of cells’ state. In particular, the differences in cellular density can inform one of the changes in kinetic parameters that arise as a consequence of changes in the microenvironment. Examples of relevant experiments include investigations of the effect of various drug treatments on the cellular turnover.
Finally, our techniques can be extended to describing more complex systems. One potential application is deriving spatial laws of the microbial colony dynamics, such as bacteria growing in a microfluidic trap [28,29,30]. Deriving rules of global dynamics of microbial communities from local interaction rules is a task that is similar in spirit to the efforts that were described in the present paper.
Author Contributions
Conceptualization, N.L.K., I.A.R.-B., D.W.; methodology, N.L.K., I.A.R.-B.,
D.W.; software, N.L.K., I.A.R.-B., D.W.; formal analysis, N.L.K., I.A.R.-B., D.W.; investigation, N.L.K.,
I.A.R.-B., D.W.; writing—original draft preparation, N.L.K.; writing—review and editing, N.L.K.,
I.A.R.-B., D.W.; visualization, N.L.K., I.A.R.-B., D.W.; supervision, N.L.K., D.W.; funding acquisition,
N.L.K., D.W. All authors have read and agreed to the published version of the manuscript
Funding
This research was funded by NSF DMS grant number 1812601, by NSF DMS grant number 2152155, NSF MCB grant number 2141650, and by NSF-Simons Center for Multiscale Cell Fate Research.
Data Availability Statement
Not applicable.
Conflicts of Interest
The funders had no role in the design of the study; in the collection, analyses, or interpretation of data; in the writing of the manuscript, or in the decision to publish the results.
References
- Kimura, M. On the probability of fixation of mutant genes in a population. Genetics 1962, 47, 713. [Google Scholar] [CrossRef] [PubMed]
- Patwa, Z.; Wahl, L.M. The fixation probability of beneficial mutations. J. R. Soc. Interface 2008, 5, 1279–1289. [Google Scholar] [CrossRef] [PubMed]
- Kepler, T.B.; Oprea, M. Improved inference of mutation rates: I. An integral representation for the Luria–Delbrück distribution. Theor. Popul. Biol. 2001, 59, 41–48. [Google Scholar] [CrossRef] [PubMed]
- Dewanji, A.; Luebeck, E.; Moolgavkar, S.H. A generalized Luria–Delbrück model. Math. Biosci. 2005, 197, 140–152. [Google Scholar] [CrossRef] [PubMed]
- Komarova, N.L.; Wu, L.; Baldi, P. The fixed-size Luria–Delbruck model with a nonzero death rate. Math. Biosci. 2007, 210, 253–290. [Google Scholar] [CrossRef]
- Zheng, Q. Progress of a half century in the study of the Luria–Delbrück distribution. Math. Biosci. 1999, 162, 1–32. [Google Scholar] [CrossRef]
- Bryder, D.; Rossi, D.J.; Weissman, I.L. Hematopoietic stem cells: The paradigmatic tissue-specific stem cell. Am. J. Pathol. 2006, 169, 338–346. [Google Scholar] [CrossRef]
- Gestel, J.V.; Vlamakis, H.; Kolter, R. Division of labor in biofilms: The ecology of cell differentiation. In Microbial Biofilms; Ghannoum, M., Parsek, M., Whiteley, M., Mukherjee, P.K., Eds.; AMS Press: Washington, DC, USA, 2015; pp. 67–97. [Google Scholar] [CrossRef]
- Webb, J.S.; Givskov, M.; Kjelleberg, S. Bacterial biofilms: Prokaryotic adventures in multicellularity. Curr. Opin. Microbiol. 2003, 6, 578–585. [Google Scholar] [CrossRef]
- Komarova, N.L. Spatial stochastic models for cancer initiation and progression. Bull. Math. Biol. 2006, 68, 1573–1599. [Google Scholar] [CrossRef]
- Durrett, R.; Moseley, S. Spatial Moran models I. Stochastic tunneling in the neutral case. Ann. Appl. Probab. 2015, 25, 104. [Google Scholar] [CrossRef]
- Durrett, R.; Foo, J.; Leder, K. Spatial Moran models, II: Cancer initiation in spatially structured tissue. J. Math. Biol. 2016, 72, 1369–1400. [Google Scholar] [CrossRef] [PubMed]
- Gralka, M.; Hallatschek, O. Environmental heterogeneity can tip the population genetics of range expansions. Elife 2019, 8, e44359. [Google Scholar] [CrossRef] [PubMed]
- Waclaw, B.; Bozic, I.; Pittman, M.E.; Hruban, R.H.; Vogelstein, B.; Nowak, M.A. A spatial model predicts that dispersal and cell turnover limit intratumour heterogeneity. Nature 2015, 525, 261–264. [Google Scholar] [CrossRef] [PubMed]
- Gralka, M.; Stiewe, F.; Farrell, F.; Möbius, W.; Waclaw, B.; Hallatschek, O. Allele surfing promotes microbial adaptation from standing variation. Ecol. Lett. 2016, 19, 889–898. [Google Scholar] [CrossRef] [PubMed]
- Otwinowski, J.; Krug, J. Clonal interference and Muller’s ratchet in spatial habitats. Phys. Biol. 2014, 11, 056003. [Google Scholar] [CrossRef]
- Lavrentovich, M.O.; Wahl, M.E.; Nelson, D.R.; Murray, A.W. Spatially constrained growth enhances conversional meltdown. Biophys. J. 2016, 110, 2800–2808. [Google Scholar] [CrossRef]
- Fusco, D.; Gralka, M.; Kayser, J.; Anderson, A.; Hallatschek, O. Excess of mutational jackpot events in expanding populations revealed by spatial Luria–Delbrück experiments. Nat. Commun. 2016, 7, 12760. [Google Scholar] [CrossRef]
- Wodarz, D.; Komarova, N.L. Mutant Evolution in Spatially Structured and Fragmented Expanding Populations. Genetics 2020, 216, 191–203. [Google Scholar] [CrossRef]
- Rodriguez-Brenes, I.A.; Wodarz, D.; Komarova, N.L. Beyond the pair approximation: Modeling colonization population dynamics. Phys. Rev. E 2020, 101, 032404. [Google Scholar] [CrossRef]
- Gerlee, P.; Anderson, A.R. An evolutionary hybrid cellular automaton model of solid tumour growth. J. Theor. Biol. 2007, 246, 583–603. [Google Scholar] [CrossRef]
- Wodarz, D.; Sun, Z.; Lau, J.W.; Komarova, N.L. Nearest-neighbor interactions, habitat fragmentation, and the persistence of host-pathogen systems. Am. Nat. 2013, 182, E94–E111. [Google Scholar] [CrossRef] [PubMed]
- Komarova, N.L.; Shahriyari, L.; Wodarz, D. Complex role of space in the crossing of fitness valleys by asexual populations. J. R. Soc. Interface 2014, 11, 20140014. [Google Scholar] [CrossRef] [PubMed]
- Kreger, J.; Brown, D.; Komarova, N.L.; Wodarz, D.; Pritchard, J. The role of migration in mutant evolution in fragmented populations. bioRxiv 2021. [Google Scholar] [CrossRef]
- Iwasa, Y.; Nowak, M.A.; Michor, F. Evolution of resistance during clonal expansion. Genetics 2006, 172, 2557–2566. [Google Scholar] [CrossRef]
- Horswell, S.; Matthews, N.; Swanton, C. Cancer heterogeneity and “the struggle for existence”: Diagnostic and analytical challenges. Cancer Lett. 2013, 340, 220–226. [Google Scholar] [CrossRef]
- Banin, E.; Hughes, D.; Kuipers, O.P. Bacterial pathogens, antibiotics and antibiotic resistance. FEMS Microbiol. Rev. 2017, 41, 450–452. [Google Scholar] [CrossRef]
- Karamched, B.; Ott, W.; Timofeyev, I.; Alnahhas, R.; Bennett, M.; Josić, K. Moran model of spatial alignment in microbial colonies. Phys. D Nonlinear Phenom. 2019, 395, 1–6. [Google Scholar] [CrossRef]
- van Vliet, S.; Hauert, C.; Fridberg, K.; Ackermann, M.; Dal Co, A. Global dynamics of microbial communities emerge from local interaction rules. PLoS Comput. Biol. 2022, 18, e1009877. [Google Scholar] [CrossRef]
- Koldaeva, A.; Tsai, H.F.; Shen, A.Q.; Pigolotti, S. Population genetics in microchannels. Proc. Natl. Acad. Sci. USA 2022, 119, e2120821119. [Google Scholar] [CrossRef]
Figure 1.
Quasi-equilibrium density of cells. (a) Equation (2), showing the equilibrium density as a function of for (von Neumann lattice), (Moore lattice), and (mass-action). (b) Comparison of Equation (2) (solid line) with numerically calculated density values (dots) for . The dashed-dotted line represents a higher-order approximation; see [20] for details. (c) Comparison of Equation (2) (solid line) with numerically calculated density values (dots) for . See text for details.

Figure 2.
Steps in the derivation of equations for a two-component system of wild-type and mutant cells. Blue circles denote wild-type, and purple denote mutant cells. (a) Three configurations, whose correlations appear in Equations (19) and (20). (b) Three types of correlations needed for equations for W, I, and M.

Figure 3.
The level of mutants in the spatial (von Neumann) system: analytical approximation and numerical results. (a) The quantity is presented as a contour plot as a function of and , for fixed values of and . Mutants are disadvantageous above the red line (inequality (12)). The contours’ values are specified. (b) Solution of equation as a function of ; the 5 points, used in panel (c), are marked in red and numbered. (c) The comparison of the predicted number of mutants, , (horizontal red line) and simulated number of mutants in the 5 parameter pairs from panel (b). Simulated means and standard deviations are shown (out of runs). (d) For the 5th parameter combination, the numerically obtained histogram of the number of mutants is shown. The rest of the parameters are: , , , and . See text for details.
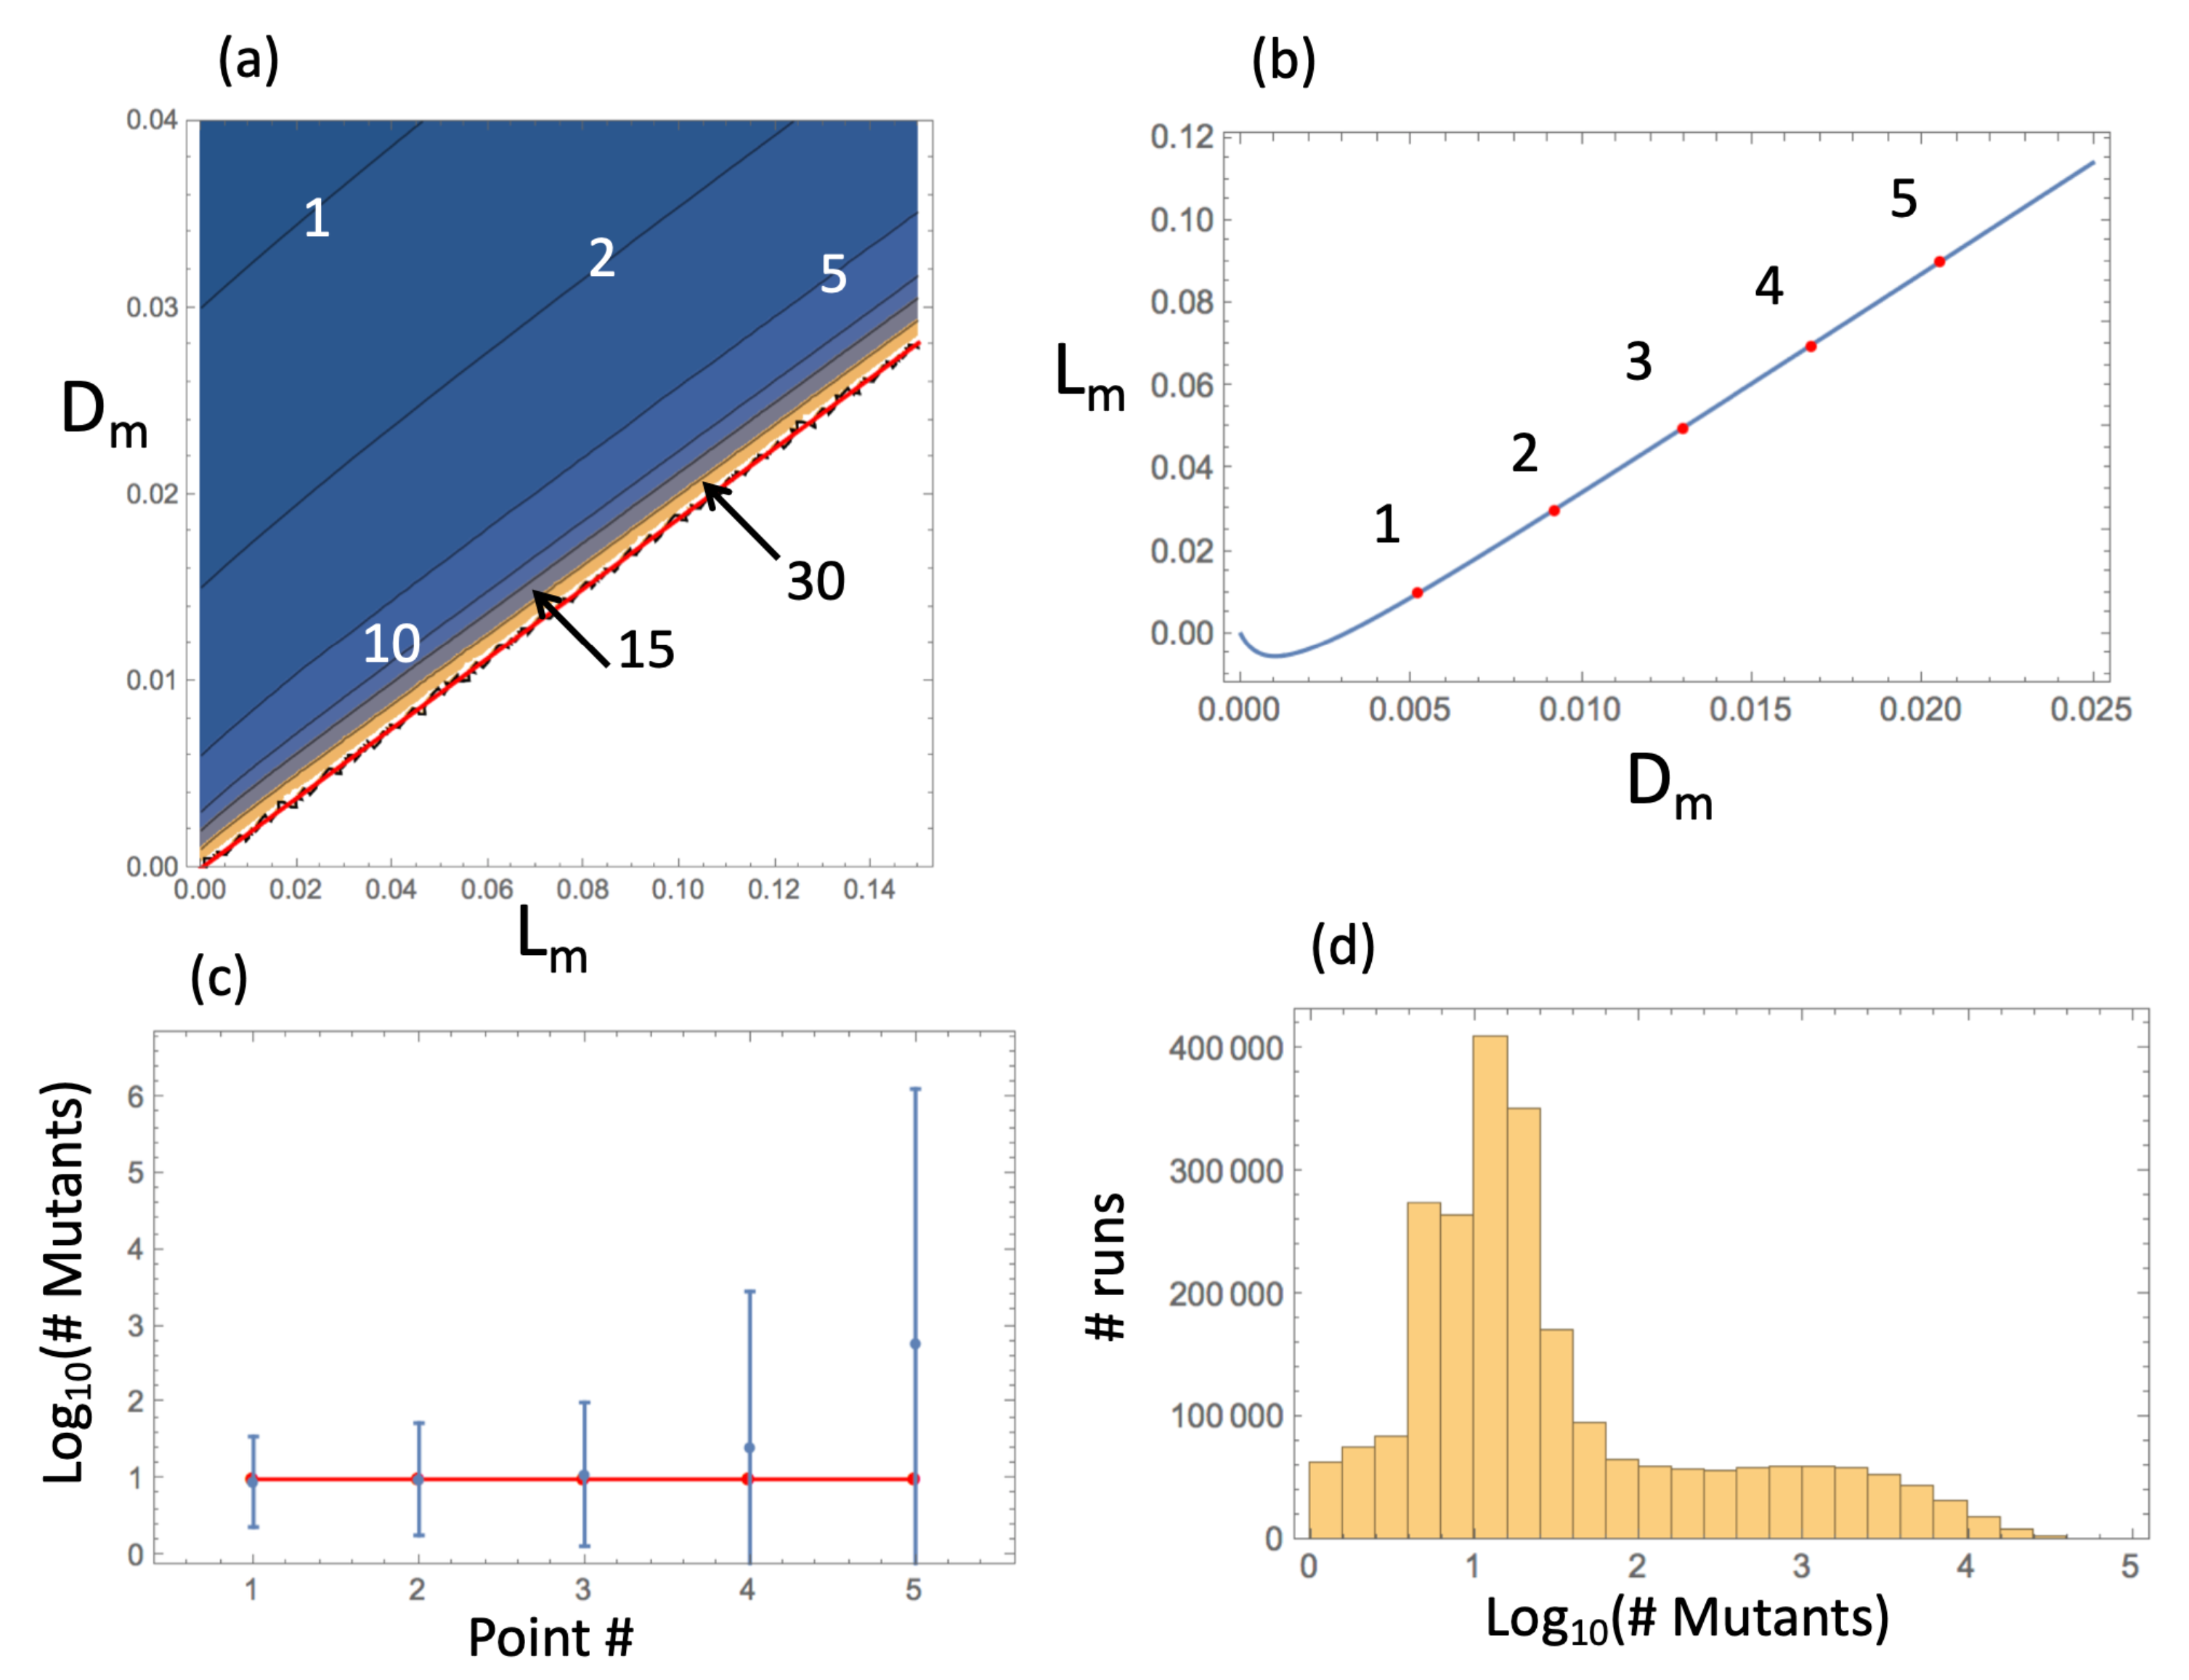
Figure 4.
The conceptual model for mutant number calculations, the case of neutral mutants in a colony growing along the surface of a cylinder (2D flat front). Red circles denote mutants and blue circles wild-type cells.
Figure 4.
The conceptual model for mutant number calculations, the case of neutral mutants in a colony growing along the surface of a cylinder (2D flat front). Red circles denote mutants and blue circles wild-type cells.

Figure 5.
The number of mutants during a 2D flat front expansion decays with the front width. Equation (30) is presented with N = 10,000 and .
Figure 5.
The number of mutants during a 2D flat front expansion decays with the front width. Equation (30) is presented with N = 10,000 and .

Figure 6.
Neutral and advantageous mutants in a 2D colony under (a) a flat front expansion and (b) a range expansion. The number of mutants is plotted as a function of the total population, averaged over 1000 stochastic runs (standard error is too small to see). Cases (A,B) are neutral, and the corresponding solid black lines are guides to the eye, with (a) slope 2 and (b) slope 3/2 in the log–log plot. Cases (C–G) are advantageous, and the dashed lines are guides to the eye with (a) slope 3 and (b) slope 2. Curves (A–G) are described in Table 3. The rest of the parameters are (except G, where ).

Figure 7.
Mutants in the 3D expansion: the average number of mutants is plotted as a function of the total population. (A) Neutral mutants in a range expansion, with the corresponding dotted gray guide to the eye with slope 4/3 in the log–log plot. (B,C) Advantageous mutants in a range expansion, and the solid lines are guides to the eye with slope 2. (D) Neutral mutants in a 3D flat front expansion, and the solid guide to the eye has slope 2. (E,F) Advantageous mutants in a colony with a 3D flat expansion; the dashed guides to the eye have slope 4. Curve parameters are given in Table 4.


Table 1.
Steady-state densities for different types of lattices, as well as the mass-action system and a generalized, -neighbor system; see [20]. Here, , the division-to-death rate ratio. Red dots denote the focal cell and the blue ones stand for its neighbors.
Table 1.
Steady-state densities for different types of lattices, as well as the mass-action system and a generalized, -neighbor system; see [20]. Here, , the division-to-death rate ratio. Red dots denote the focal cell and the blue ones stand for its neighbors.
| Lattice | Geometry | Density |
|---|---|---|
| von Neumann |  | |
| Moore |  | |
| Hexagonal |  | |
| Mass-action |  | |
| neighbors |  |
Table 2.
Mutant scaling laws for expanding populations; see [19]. Here, N is the population size, u is the mutation rate, and . See text for details.
Table 2.
Mutant scaling laws for expanding populations; see [19]. Here, N is the population size, u is the mutation rate, and . See text for details.
| 2D Flat | 2D Range | 3D Flat | 3D Range | Exponential | |
|---|---|---|---|---|---|
| Mutant property |  |  |  |  |  |
| Disadvantageous | |||||
| Neutral | |||||
| Advantageous |
Table 3.
Simulation parameters for Figure 6.
Table 3.
Simulation parameters for Figure 6.
| Curve | Description | ||||
|---|---|---|---|---|---|
| A | Neutral, no death | 0.7 | 0.7 | 0 | 0 |
| B | Neutral, with death | 0.7 | 0.7 | 0.2 | 0.2 |
| C | Adv, no death | 0.7 | 0.9 | 0 | 0 |
| D | Adv, no death, larger advantage | 0.7 | 1.0 | 0 | 0 |
| E | Adv by division, with death | 0.7 | 0.8 | 0.2 | 0.2 |
| F | Adv by death | 0.7 | 0.7 | 0.2 | 0.1 |
| G | Adv by death, wider front | 0.7 | 0.7 | 0.2 | 0.1 |
Table 4.
Simulation parameters for Figure 7.
Table 4.
Simulation parameters for Figure 7.
| Curve | Description | u | ||||
|---|---|---|---|---|---|---|
| A | Neutral, range | 0.7 | 0.7 | 0.1 | 0.1 | |
| B, yellow | Adv by division, range | 0.4 | 0.8 | 0.1 | 0.1 | |
| B, red | Adv by division, range | 0.7 | 0.7 | 0.2 | 0.2 | |
| C | Adv by death, range | 0.7 | 0.7 | 0.2 | 0.1 | |
| D | Neutral, flat | 0.8 | 0.8 | 0.1 | 0.1 | |
| E | Adv by division, flat | 0.4 | 0.8 | 0.1 | 0.1 | |
| F | Adv by death, flat | 0.7 | 0.7 | 0.2 | 0.1 |
Publisher’s Note: MDPI stays neutral with regard to jurisdictional claims in published maps and institutional affiliations. |
© 2022 by the authors. Licensee MDPI, Basel, Switzerland. This article is an open access article distributed under the terms and conditions of the Creative Commons Attribution (CC BY) license (https://creativecommons.org/licenses/by/4.0/).
Share and Cite
MDPI and ACS Style
Komarova, N.L.; Rodriguez-Brenes, I.A.; Wodarz, D. Laws of Spatially Structured Population Dynamics on a Lattice. Physics 2022, 4, 812-832. https://doi.org/10.3390/physics4030052
AMA Style
Komarova NL, Rodriguez-Brenes IA, Wodarz D. Laws of Spatially Structured Population Dynamics on a Lattice. Physics. 2022; 4(3):812-832. https://doi.org/10.3390/physics4030052
Chicago/Turabian StyleKomarova, Natalia L., Ignacio A. Rodriguez-Brenes, and Dominik Wodarz. 2022. "Laws of Spatially Structured Population Dynamics on a Lattice" Physics 4, no. 3: 812-832. https://doi.org/10.3390/physics4030052