Time–Frequency Approach for Cutting Tool Power Signal Separation in Face Milling Operations


1
Centro de Ciencias de la Ingeniería, Universidad Autónoma de Aguascalientes, Av. Universidad 940, Col. Ciudad Universitaria, Aguascalientes 20131, Ags, Mexico
2
Facultad de Ingeniería UAQ, Universidad Autónoma de Querétaro, Cerro de las Campanas S/N, Col. las Campanas, Querétaro 76010, Qro, Mexico
*
Author to whom correspondence should be addressed.
Appl. Mech. 2024, 5(1), 180-191; https://doi.org/10.3390/applmech5010012
Submission received: 16 January 2024
/
Revised: 6 March 2024
/
Accepted: 13 March 2024
/
Published: 18 March 2024
Abstract
:Face milling is among the processes that can produce a high-precision surface finish. Tool condition monitoring and signal processing algorithms are under extensive research to improve production quality and productivity in machining processes. In the present research, the time–frequency analysis technique was applied to the signal obtained from a sensor integrated into the primary AC power circuitry during the milling of steel bars to evaluate its applicability in detecting the current variations associated with the cutting force. The signal acquired from the sensor was processed in the time–frequency domain using wavelet analysis, and the results were compared with the traditional time and frequency analyses. The results showed that the signal variations produced by the cutting force were well localized in the frequency spectra with both approaches. However, the wavelet processing method yielded a poorly defined cutting force signal shape due to the limited resolution inherent in the sub-bands containing the frequencies of interest.
1. Introduction
High-speed machining (HSM) can significantly improve accuracy and precision during the machining process. However, the central issue in HSM is the frequent replacement of the tool due to damage during the cutting process. Tool wear can be measured with direct or indirect methods. In direct tool condition monitoring methods, the cutting tool is removed from the machine and the tool wear is inspected with a microscope. On the other hand, indirect methods utilize various sensor signals and algorithms for feature extraction and estimation of the tool wear.
An advantageous method for the online detection of tool breakage is the power consumption of tool drives, where the AC and DC portions of the spindle motor current can be used to predict tool wear. This approach is reported to have the best signal-to-noise ratio and a linear relation with the tool condition. However, complex signal processing techniques are required in order to separate the necessary components from the entire signal [1]. The industrial revolution, characterized by complete automation, has led to significant advancements in machine monitoring technologies. As machining process indicators, the spindle and motor power are more suitable in industrial environments and offer the same advantages as cutting force and vibration monitoring. The power signal can be acquired easily as the installation does not interrupt the current machine tool structure. It has been reported that the spindle or motor power is proportional to and correlated with the torque and cutting forces, respectively [2,3].
The electric current signal has proved to be the best output parameter to monitor the tool wear in some machining operations [4]. Electric current variations during the machining process, measured with hall sensors at the power input of the machining center, can be used to evaluate the machinability of materials. Increasing the cutting speed results in an increase in the electric current. Similarly, as tool wear increases, more electric current is required in order to maintain the spindle rotation [5]. Estimating the energy consumption in machining processes is a starting point to increase manufacturing energy efficiency. This can be accomplished by modeling the material removal power in milling processes using dynamometers, current, and voltage sensors [6]. The advantage of the direct sensor systems for tool conditioning monitoring is that there is no mechanical interaction between the measuring system and the cutting system, thus not influencing the system’s stiffness, but with the disadvantage that it usually has lower predictability. Although cutting force monitoring usually provides more accurate results, indirect tool condition monitoring is gaining popularity for its little to no interference in the cutting process. However, despite its lower implementation costs, it tends to be less accurate [7]. Ampere and power meters can be connected to the main current cables that feed the spindles of the machine tool. Thus, the consumed energy and environmental effects of the operation can be calculated. The disadvantage of this approach is that the location exists away from the cutting area, with a loss of sensitivity and reliability and reduced reaction time in adaptive control. In contrast, there is no hazard for the sensor that depends on the high temperatures and chip collision being away from the cutting area [8]. The power consumption of axis and spindle servo motors in machining processes has also been studied [3].
The electric current signals provide more evident prediction results when comparing approaches that use accelerometers to measure vibrations during the machining process with those that use power analyzers and inductive clamps. Statistically, their correlation to tool wear is more immune to ambient noise. It is also easier to process the signal since recorded values are more straightforward and with minor fluctuations. Sensor fixture is an additional advantage [9]. Differential electrical power consumption is a better indicator of tool wear than conventional mechanical power methods. In this recording technique, the current required for rotation of the spindle and movement of the head down is nullified, and only the power for the drilling process is recorded [10]. More elaborated techniques can be developed to track the tool condition along various process levels from the measured current values of the machine tool’s spindle and drive motors. Decision criteria are obtained from the electric current trends [11].
Tool breakage and tool wear distort the AC spindle motor current. The amplitude of fundamental and odd-order harmonic components of the signal for a worn tool is higher than that of a sharp cutter. The total harmonic distortion increases as tool wear occurs and abruptly increases during tool breakage [12]. Condition monitoring comprises the steps of acquisition, processing, and interpretation. Most signals measured are non-deterministic, requiring special processing techniques for their analysis. Therefore, it is essential to identify and apply the best possible condition-monitoring method for machining processing [13]. It is also necessary to use appropriate signal processing and pattern recognition techniques to identify and predict the cutting tool’s state. The electric current signal can be processed to obtain different machinability parameters to characterize tool life and workpiece surface roughness. Skewness and kurtosis effectively identify the workpiece surface conditions [14].
It is common practice to process the vibration signals in machining processes with the fast Fourier transform technique. This technique is considered the traditional analysis technique, and it is suitable for stationary signal processing but unsuited for non-stationary transient signal analysis. This limitation has led to the introduction of time–frequency signal processing tools. The wavelet transform, a time–frequency approach, has recently been used as a detection and classification tool.
Fast Fourier transform (FFT) is the standard method for observing signals in the frequency domain and is widely used in tool condition monitoring, but it is not easy to analyze the local properties of a signal with FFT. The wavelet transform overcomes this situation. It is a time–frequency domain approach sensitive to flank wear and cutting conditions [15]. This technique can separate the milling cutter and spindle signal obtained from a single-channel contaminated power signal [16]. Using current sensors offers numerous advantages (inexpensive, easily installed, and does not affect the milling process), and multi-domain feature extraction overcomes the loss of useful information related to tool conditions when employing a single domain. Motor current signals include a considerable amount of noise, the fluctuations are small in the cutting force signal, and the spindle power signal is a small portion of the total power [17]. The evolution of the decomposition details of the wavelet procedure is sensitive to tool wear progress and can be employed as an indicator for drill failure prediction [18]. Feature extraction is one of the critical steps in diagnosis, and algorithms search for the optimal subset of features by removing redundant elements. The fusion of multi-domain features is not always better. The most informative features are obtained from the time–frequency domain and perform slightly better than using frequency–domain features from FFT. The wavelet transform improves the prediction accuracy, indicating more tool wear-related information content in precision machining [19].
It has been found that most research on milling processes reports power or current analysis with a focus on spectral characterization or wavelet transform signal isolation techniques, but not regarding the detection of the cutting force using the signal shape.
2. Materials and Methods
A 3-D universal milling machine was employed to validate the suitability of the methodology for detecting cutting forces in milling processes. An electric current sensor was integrated into the primary AC power wiring to acquire a signal directly associated with the cutting forces (Figure 1). The output of the current sensor was fed to an electronic signal conditioning circuit and converted to digital with a data acquisition module at a sample rate of 1 kHz. Data processing was performed with a computer program.
AISI 4140T steel bars with dimensions of 28 mm × 28 mm × 121 mm and 41 HRC hardness were used as the working material (Figure 2). The depth of the cut was established at 1 mm and 1.5 mm, with a spindle speed adjusted to 1000 rpm, a PVD-coated 1-insert boring cutter of 32 mm diameter, and a feed rate of 0.4 mm/rev. The 1-insert cutter was determined to have the same frequency in the force signal as in the spindle speed. The electric current obtained from the sensor for the cases studied was normalized for the purpose of comparison. The signals were subjected to traditional time and frequency analysis, employing techniques such as the Savitzky–Golay smoothing filtering, fast Fourier transform, and time–frequency analysis with the Daubechies 4 wavelet transform.
3. Results and Discussion
3.1. Time and Frequency Analysis
In a milling process, the cutting tool inserts impact the material being machined, and variations in the cutting force are reflected in the electric current of the spindle motor and, therefore, in the power lines. The electric power needed to machine a part increases as the depth of the cut or the hardness of the material increases. Sometimes the energy dissipation is evident when the cutting force produces high heat release during the cutting process, as evidenced in Figure 3, where steel bars with hardnesses of 25 and 50 HRC illustrate this effect.
A comparison of the electric current obtained for the spindle idle, 1 mm, and 1.5 mm depth of cut is shown in Figure 4. The electric current increased as the cutting process began and then remained, with minor changes, until the end. Electric current variations were present due to the insert impacts, mechanical instabilities of the machine, and the intrinsic noise of the electronic circuits. Therefore, the digitally acquired raw signal was a mixture of a low-frequency signal (envelope) and ripple (electric current variations), in concordance with other reports in the literature [10,19]. It was observed that the current measured for a 1.5 mm depth of cut was almost double that for a 1 mm depth of cut.
The cutting force signal, produced by the periodic force variations obtained from the insert impacts, was mixed with all the electric signal sources measured by the current transformer, as shown in Figure 5. As can be seen, the inset graph shows a periodic modulated signal, where the cutting force signal variations can be identified. These electric current profiles are commonly reported [14] and can be found when measuring cutting force with dynamometers [6]. Signal filtering is necessary to remove the envelope and isolate and analyze the signal variations corresponding to the cutting force, as illustrated in Figure 6. Results have been normalized for the purpose of comparison.
A power spectrum analysis, shown in Figure 7, reveals the difficulty of implementing techniques for extracting the cutting force signal, since the low electric current values obtained from the current transformer require advanced signal filtering and processing techniques. Reinforcing this fact, this figure shows strong components of the signal located on the lower portion of the spectrum (“A”), with a modulation signal source located at 5.4 Hz (“B”), and the cutting force signal at 17.4 Hz (“C”). These results coincide with those of the graph shown in Figure 5.
The amplitude of the cutting force signal depends on the force applied while cutting the material. As the depth of cut increases, the signal-to-noise ratio also increases, allowing for more precise identification of the cutting force signal. This is evidenced by the differences in waveform shapes illustrated in Figure 8. However, it is worth mentioning that these signals have not been subjected to further processing. If additional low-pass filtering is applied, a sinusoidal-like signal may improve the signal characteristics for detection purposes.
3.2. Time–Frequency Analysis Approach
A time–frequency analysis decomposes a signal in different frequency bands. Figure 9 shows the sub-bands “SB1” to “SB6” obtained from the analysis of the signal. Sub-band 1 encompasses the higher frequencies inherent in the signal, while the lower frequency content of the signal is located at lower indexes. However, this representation shows a compressed plot of each sub-band resulting from a subsampling process, which is difficult to interpret. Therefore, an expanded view of each sub-band is presented in Figure 10. Accordingly, the cutter insert frequency is localized within SB5, in the frequency band between 15.6 Hz and 31.25 Hz.
A comparison plot between the signal subjected to traditional filtering and the wavelet processing is shown in Figure 11. Generally, both graphs exhibit similarities. However, a notable modulation effect can be observed in the wavelet results, since each sub-band of the wavelet processing contains information in a range of frequencies, whose values depend on the sampling frequency used during the digitalization process.
This result contrasts with the traditional filtering method, where a band-pass filter can be centered to a specific frequency. The concordance of results with this fact is derived from a frequency analysis applied to the data depicted in Figure 11, as shown in Figure 12A, which displays the cutting force signal and the additional frequencies previously illustrated in Figure 5.
The technique of feature extraction to identify the cutter force signal by the wavelet transform comprises a process of filtering by sub-band suppression and reconstruction. Figure 13A,B exhibit the wavelet coefficient amplitude (WCA), while Figure 13C illustrates the electric current amplitude (ECA). In this figure, as noted above, the signal generated by the impacts of the tool insert is included in sub-band SB5 of the wavelet transform (Figure 13A). Suppressing the adjacent bands to SB5 allows the wavelet coefficients to be kept corresponding to the cutting force frequencies (Figure 13B). Finally, the inverse wavelet transform is applied to reconstruct the electric current produced by the cutting force with frequencies limited to those corresponding to SB5 (Figure 13C).
The signal that corresponds to the cutter insert impacts can be extracted from the processed data, as shown in Figure 14. For the case of the traditional filtering process, as illustrated in Figure 14C, where the normalized current amplitude (NCA) is established, the electric current variations that the cutting force produce are well-shaped, facilitating post-processing of the signal for detection purposes. However, the signal obtained from the wavelet processing, shown in Figure 14A with the signal reconstructed (SR) and in Figure 14B with the wavelet coefficient amplitude (WCA), is far from being clearly defined. In Figure 14B, pertaining to the WCA case, identifying the cycles of the signal that produced the cutter insert impacts is challenging. This results from the sampling frequency used during the digitalization process and the wavelet transform algorithm, where sub-band 5 contains few coefficients for the duration of the signal, resulting in a poor resolution and representativeness of the cutting force. The poor resolution obeys the discrete wavelet transform process. Thus, the multi-level decomposition of the signal is accomplished by an iterated process in which the signal is down-sampled for each step of the procedure. The resulting poor resolution of the array that contains the wavelet coefficients poses challenges for the implementation of other detection processes. On the other hand, the signal reconstructed from the wavelet coefficients of SB5 (Figure 14A) shows the characteristic shape of the Daubechies D4 wavelet transform, which looks similar to a deformed sawtooth signal. The shape of this signal is better than that of the wavelet coefficients, but not as good as that obtained with traditional processing.
4. Summary and Conclusions
The cutting force signal in milling operations, obtained via electric current monitoring, was analyzed. The analysis used non-traditional processing techniques, such as the wavelet transform, for which the results were compared with those obtained from traditional techniques. The latter included processing the signal in time and frequency domains. To acquire the source signal, a current transformer was connected to the main AC power wiring of a 3-D universal milling machine. It was found that as the depth of the cut increased, the cutting force signal also increased. However, this signal’s amplitude was small compared to the current signal’s envelope and to the modulating frequencies produced while the milling process was in progress. The time–domain and frequency–domain results evidenced this fact. Regarding the wavelet processing, after the sub-band decomposition of the signal, the technique was able to localize the wavelet coefficients of the cutting force signal in the corresponding frequency range. However, the signal shape was not clearly defined by the time–frequency electric current reconstruction technique. The lack of clarity is because, due to the sub-sampling process of the wavelet transform, there were few wavelet coefficients in the sub-band that contained the cutting force signal frequency. The wavelet transform resulted in a more distorted signal waveform than the traditional processing. Regardless, wavelet analysis facilitated efficient noise reduction and feature extraction from the current sensor. These extracted features serve as valuable inputs for condition monitoring, fault detection, and process optimization. Additionally, the computational efficiency of the wavelet algorithm enables real-time processing of sensor signals, allowing for timely decision making and adaptive control in machining processes.
Author Contributions
Conceptualization, E.R. and J.C.J.-C.; methodology, E.R. and J.C.J.-C.; software, E.R.; validation, E.R. and J.C.J.-C.; formal analysis, E.R. and J.C.J.-C.; investigation, E.R. and J.C.J.-C.; resources, E.R. and J.C.J.-C.; data curation, E.R.; writing—original draft preparation, E.R.; writing—review and editing, E.R. and J.C.J.-C.; visualization, E.R.; supervision, J.C.J.-C.; project administration, E.R. and J.C.J.-C. All authors have read and agreed to the published version of the manuscript.
Funding
This research received no external funding.
Data Availability Statement
The original contributions presented in the study are included in the article, further inquiries can be directed to the corresponding author.
Conflicts of Interest
The authors declare no conflicts of interest.
References
- Mohanraj, T.; Shankar, S.; Rajasekar, R.; Sakthivel, N.R.; Pramanik, A. Tool condition monitoring techniques in milling process—A review. J. Mater. Res. Technol. 2020, 9, 1032–1042. [Google Scholar] [CrossRef]
- Iliyas, A.M.; Yusof, Y.; Daud, M.E.; Latiff, K.; Abdul, K.A.Z.; Saif, Y. Machine monitoring system: A decade in review. Int. J. Adv. Manuf. Technol. 2020, 108, 3645–3659. [Google Scholar] [CrossRef]
- Öztürk, B.; Uğur, L.; Yildiz, A. Investigation of effect on energy consumption of surface roughness in X-axis and spindle servo motors in slot milling operation. Measurement 2019, 139, 92–102. [Google Scholar] [CrossRef]
- Da Silva, L.R.R.; Del Claro, V.T.S.; Andrade, C.L.F.; Guesser, L.W.; Jackson, M.J.; Machado, A.R. Tool wear monitoring in drilling of high-strength compacted graphite cast irons. Proc. Inst. Mech. Eng. Part. B J. Eng. Manuf. 2021, 235, 207–218. [Google Scholar] [CrossRef]
- Da Silva, L.R.R.; Souza, F.C.R.; Guesser, W.L.; Jackson, M.J.; Machado, A.R. Critical assessment of compacted graphite cast iron machinability in the milling process. J. Manuf. Process. 2020, 56, 63–74. [Google Scholar] [CrossRef]
- Lv, J.; Jia, S.; Wang, H.; Ding, K.; Chan, F.T. Comparison of different approaches for predicting material removal power in milling process. Int. J. Adv. Manuf. Technol. 2021, 116, 213–227. [Google Scholar] [CrossRef]
- Pimenov, D.; Gupta, M.K.; da Silva, L.R.; Kiran, M.; Khanna, N.; Krolczyk, G.M. Application of measurement systems in tool condition monitoring of Milling: A review of measurement science approach. Measurement 2022, 199, 111503. [Google Scholar] [CrossRef]
- Kuntoğlu, M.; Salur, E.; Gupta, M.K.; Sarıkaya, M.; Pimenov, D.Y. A state-of-the-art review on sensors and signal processing systems in mechanical machining processes. Int. J. Adv. Manuf. Technol. 2021, 116, 2711–2735. [Google Scholar] [CrossRef]
- Stavropoulos, P.; Papacharalampopoulos, A.; Vasiliadis, E.; Chryssolouris, G. Tool wear predictability estimation in milling based on multi-sensorial data. Int. J. Adv. Manuf. Technol. 2016, 82, 509–521. [Google Scholar] [CrossRef]
- Al-Sulaiman, F.A.; Baseer, M.A.; Sheikh, A.K. Use of electrical power for online monitoring of tool condition. J. Mat. Process. Technol. 2005, 166, 364–371. [Google Scholar] [CrossRef]
- Ammouri, A.H.; Hamade, R.F. Current rise criterion: A process-independent method for tool-condition monitoring and prognostics. Int. J. Adv. Manuf. Technol. 2014, 72, 509–519. [Google Scholar] [CrossRef]
- Akbari, A.; Danesh, M.; Khalili, K. A method based on spindle motor current harmonic distortion measurements for tool wear monitoring. J. Braz. Soc. Mech. Sci. Eng. 2017, 39, 5049–5055. [Google Scholar] [CrossRef]
- Goyal, D.; Mongia, C.; Sehgal, S. Applications of digital signal processing in monitoring machining processes and rotary components: A review. IEEE Sens. J. 2021, 21, 8780–8804. [Google Scholar] [CrossRef]
- Da Silva, L.R.R.; França, P.H.P.; Andrade, C.L.F.; da Silva, R.B.; Guesser, W.L.; Machado, A.R. Monitoring tool wear and surface roughness in the face milling process of high-strength compacted graphite cast irons. J. Braz. Soc. Mech. Sci. Eng. 2021, 43, 180. [Google Scholar] [CrossRef]
- Zhu, K.; San Wong, Y.; Hong, G.S. Wavelet analysis of sensor signals for tool condition monitoring: A review and some new results. Int. J. Mach. Tool. Manuf. 2009, 49, 537–553. [Google Scholar] [CrossRef]
- Shao, H.; Shi, X.; Li, L. Power signal separation in milling process based on wavelet transform and independent component analysis. Int. J. Mach. Tool. Manuf. 2011, 51, 701–710. [Google Scholar] [CrossRef]
- Zhou, Y.; Sun, W. Tool wear condition monitoring in milling process based on current sensors. IEEE Access 2020, 8, 95491–95502. [Google Scholar] [CrossRef]
- Jiménez, A.; Arizmendi, M.; Sánchez, J.M. Extraction of tool wear indicators in peck-drilling of Inconel 718. Int. J. Adv. Manuf. Technol. 2021, 114, 2711–2720. [Google Scholar] [CrossRef]
- Han, S.; Yang, Q.; Pattipati, K.R.; Bollas, G.M. Sensor selection and tool wear prediction with data-driven models for precision machining. J. Adv. Manuf. Process. 2022, 4, e10143. [Google Scholar] [CrossRef]
Figure 1.
Experimental setup for measurement and processing of the electric current.
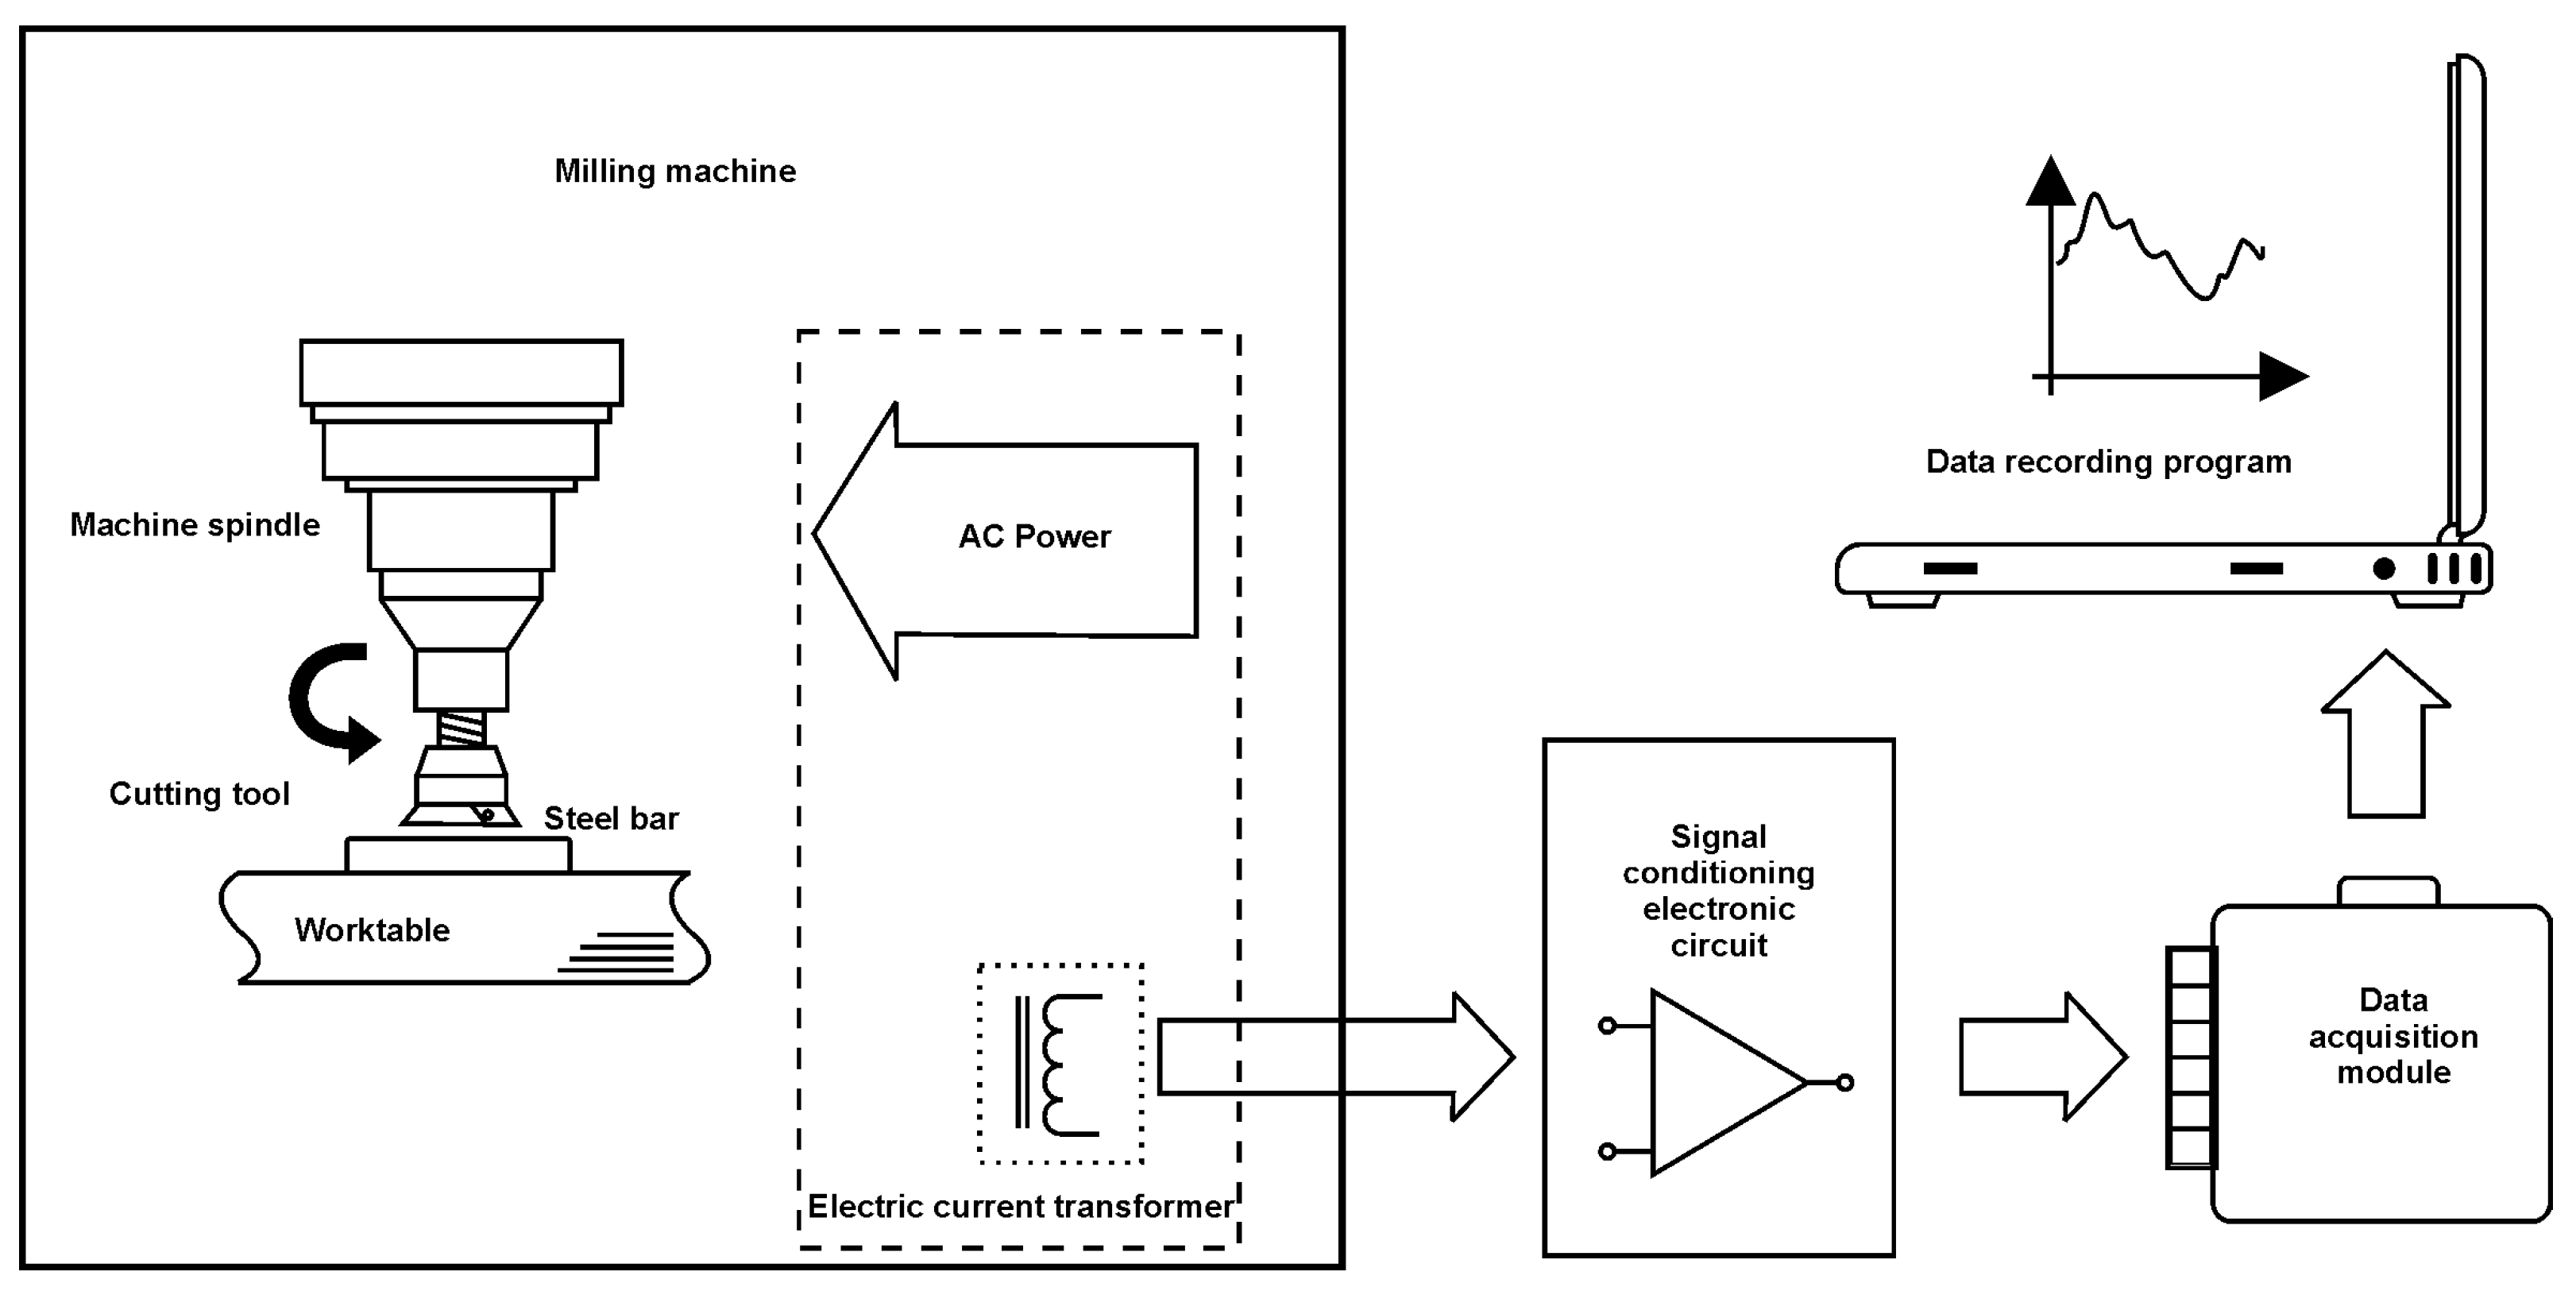
Figure 2.
Dimensions of the steel bar workpieces used for milling experiments.
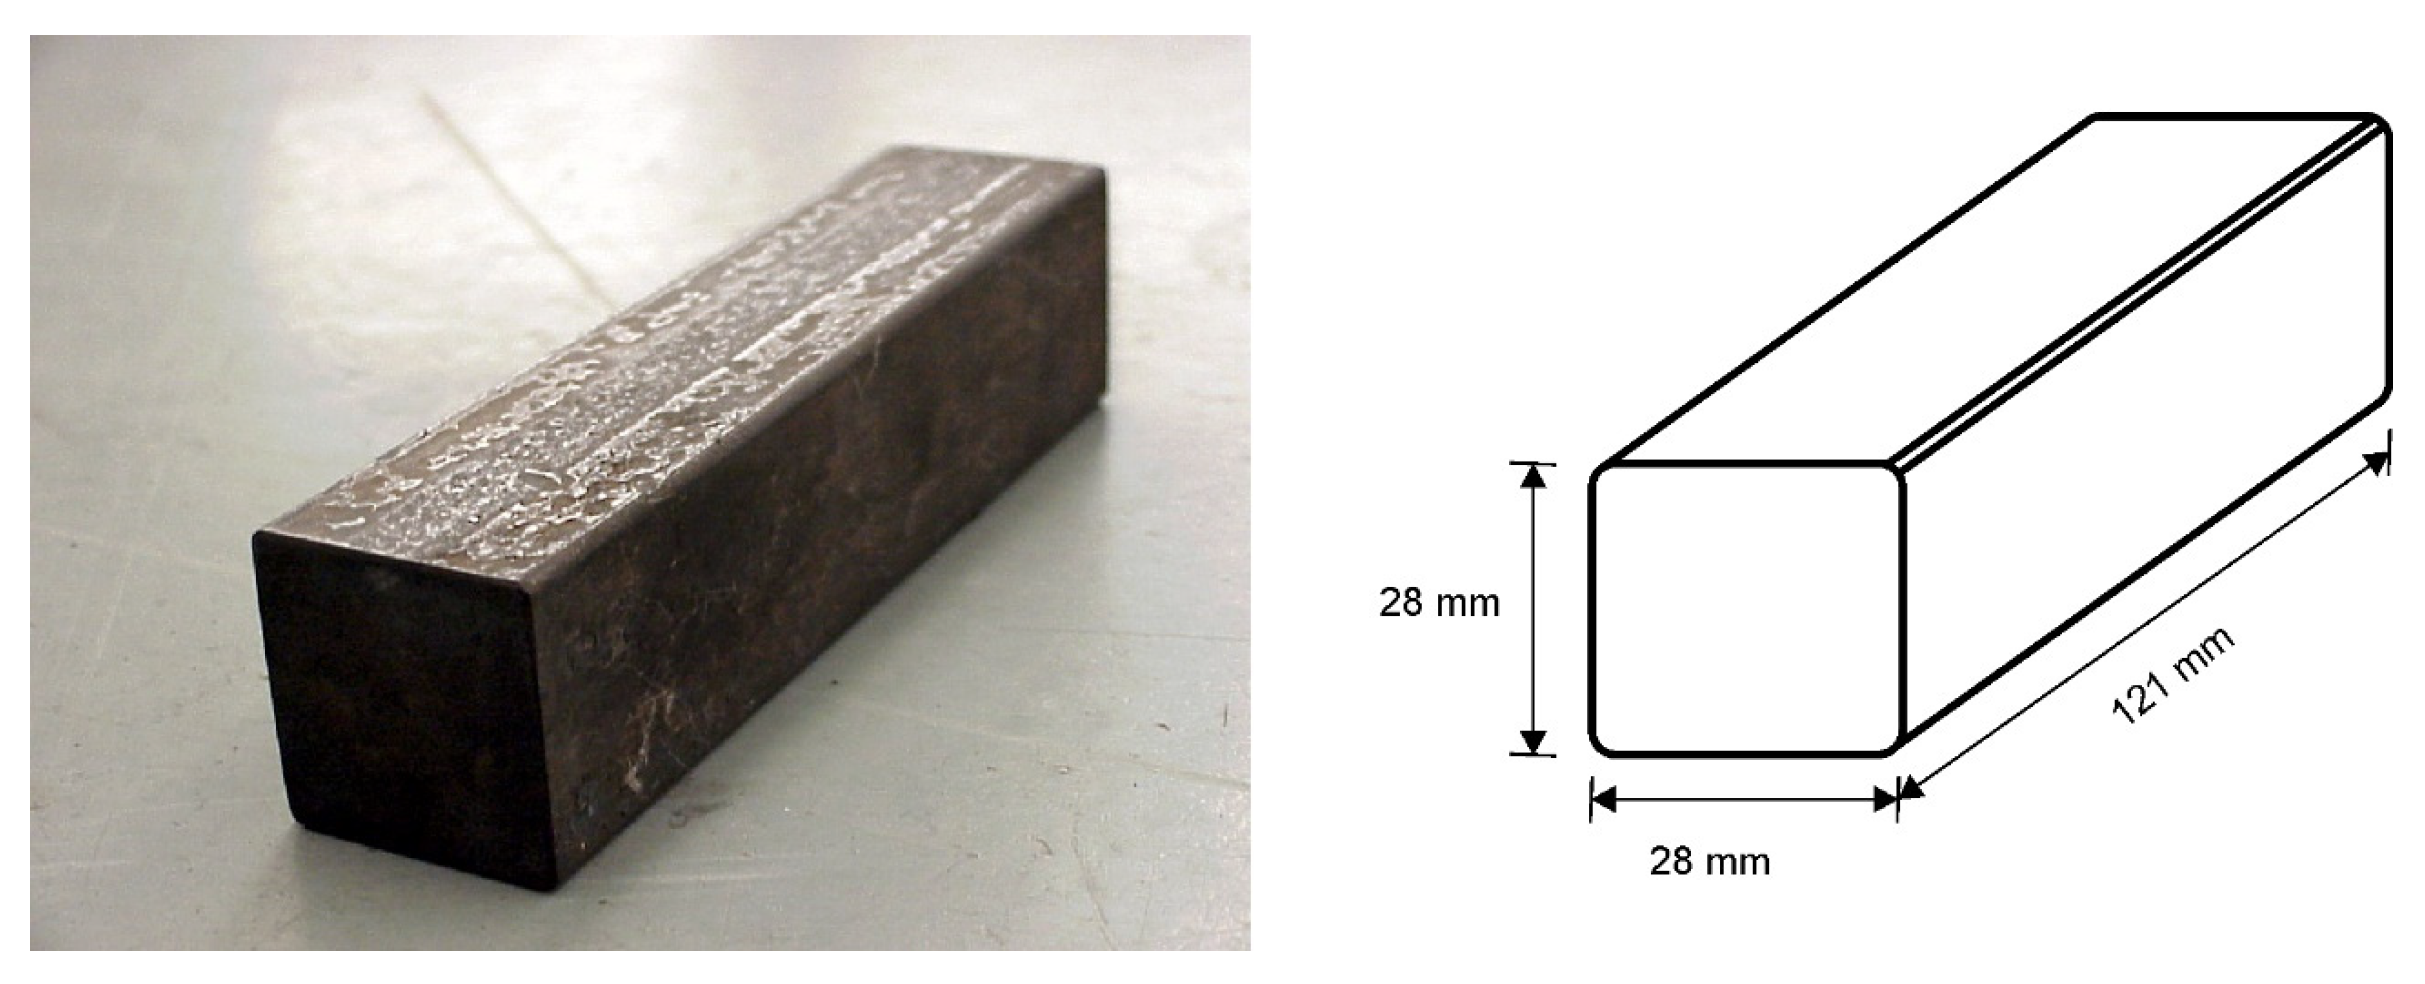
Figure 3.
Electric power transformed in heat during milling.
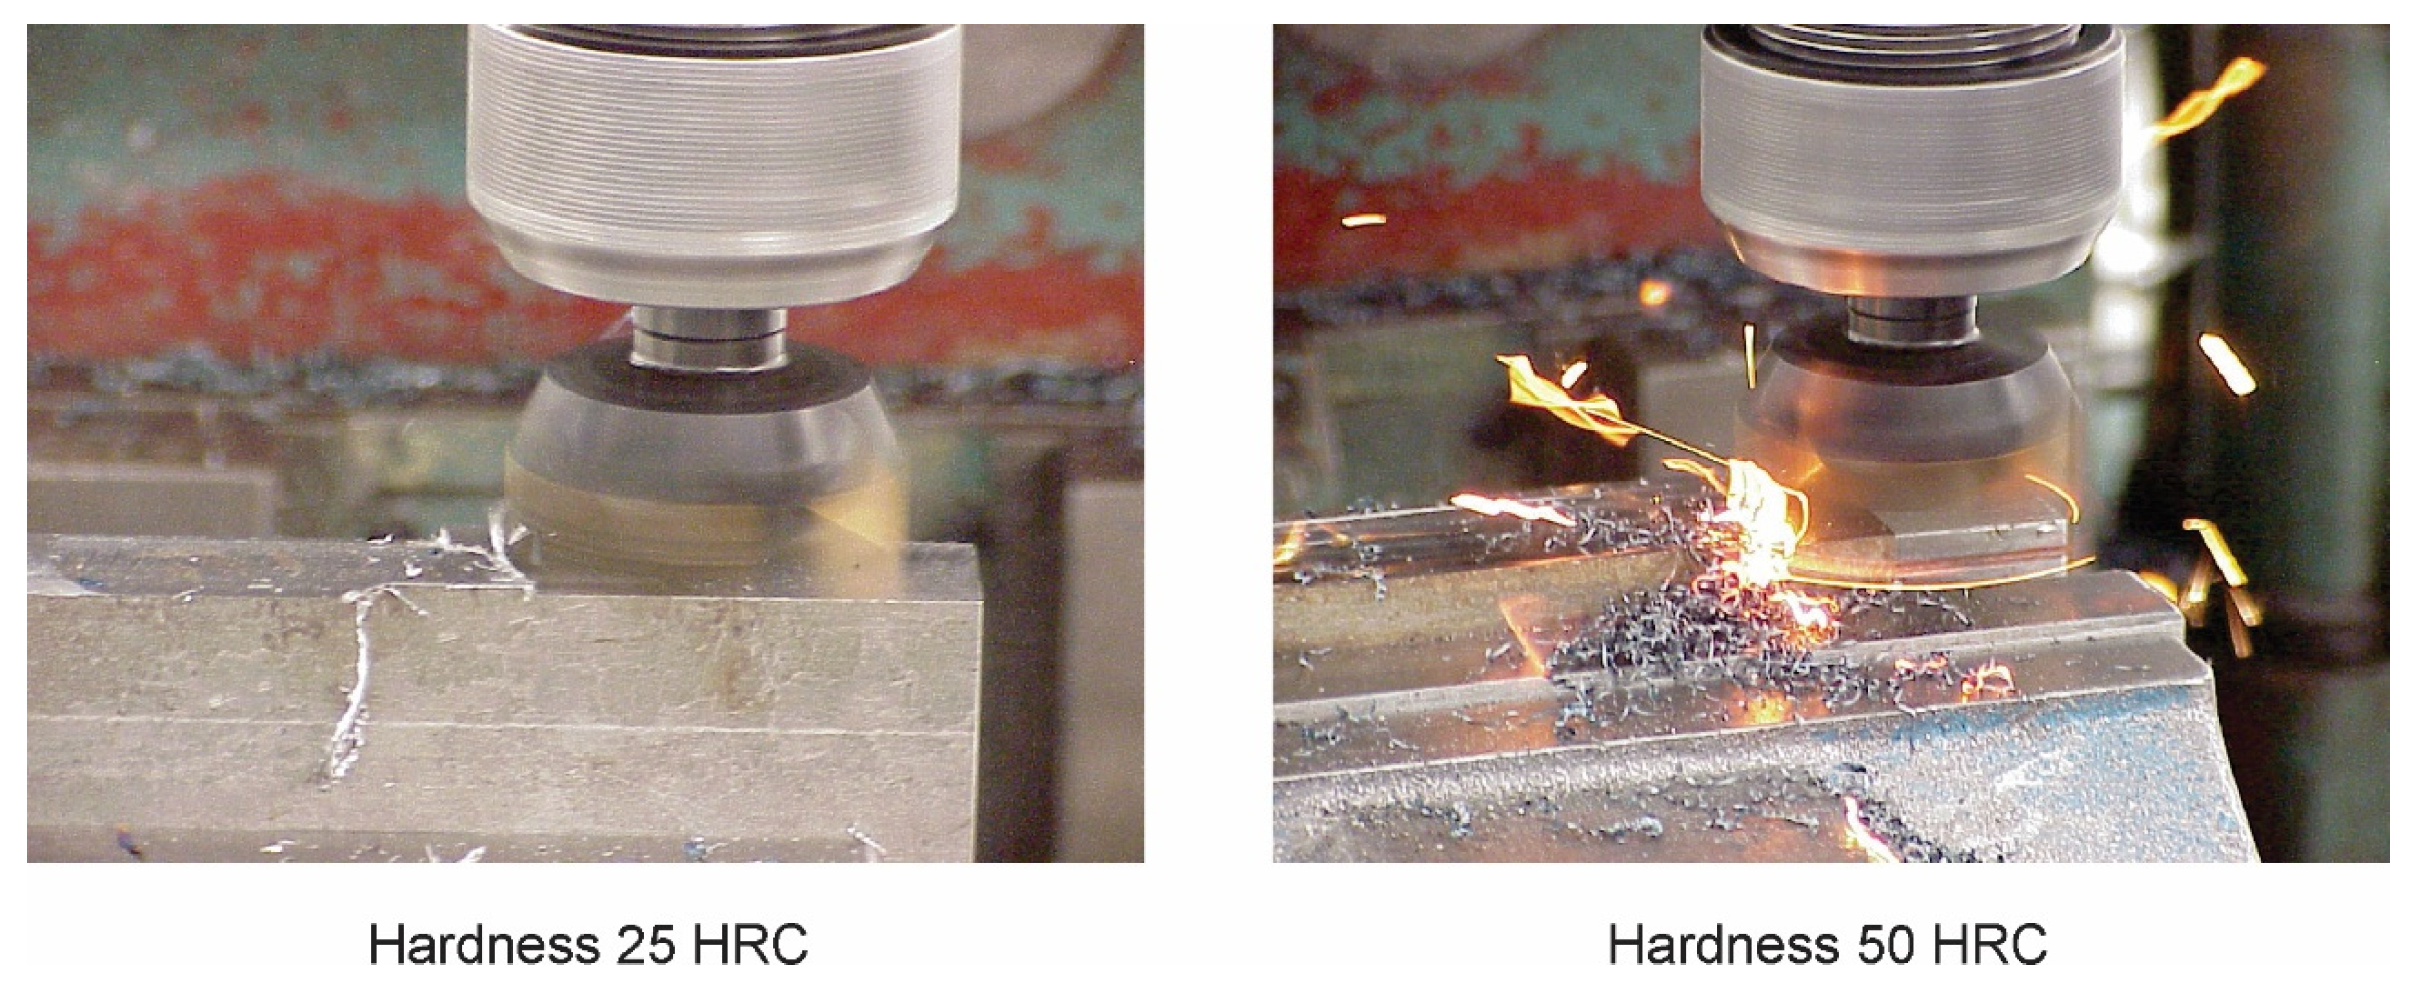
Figure 4.
Electric current, measured with a current sensor, connected to the main AC power wiring.

Figure 5.
Time–domain characterization of the electric current variations produced by the cutting tool insert impacts. (A) Electric current envelope. (B) Modulation effects. (C) Cutting tool insert impact signal. (*) Cutting impacts location.
Figure 5.
Time–domain characterization of the electric current variations produced by the cutting tool insert impacts. (A) Electric current envelope. (B) Modulation effects. (C) Cutting tool insert impact signal. (*) Cutting impacts location.
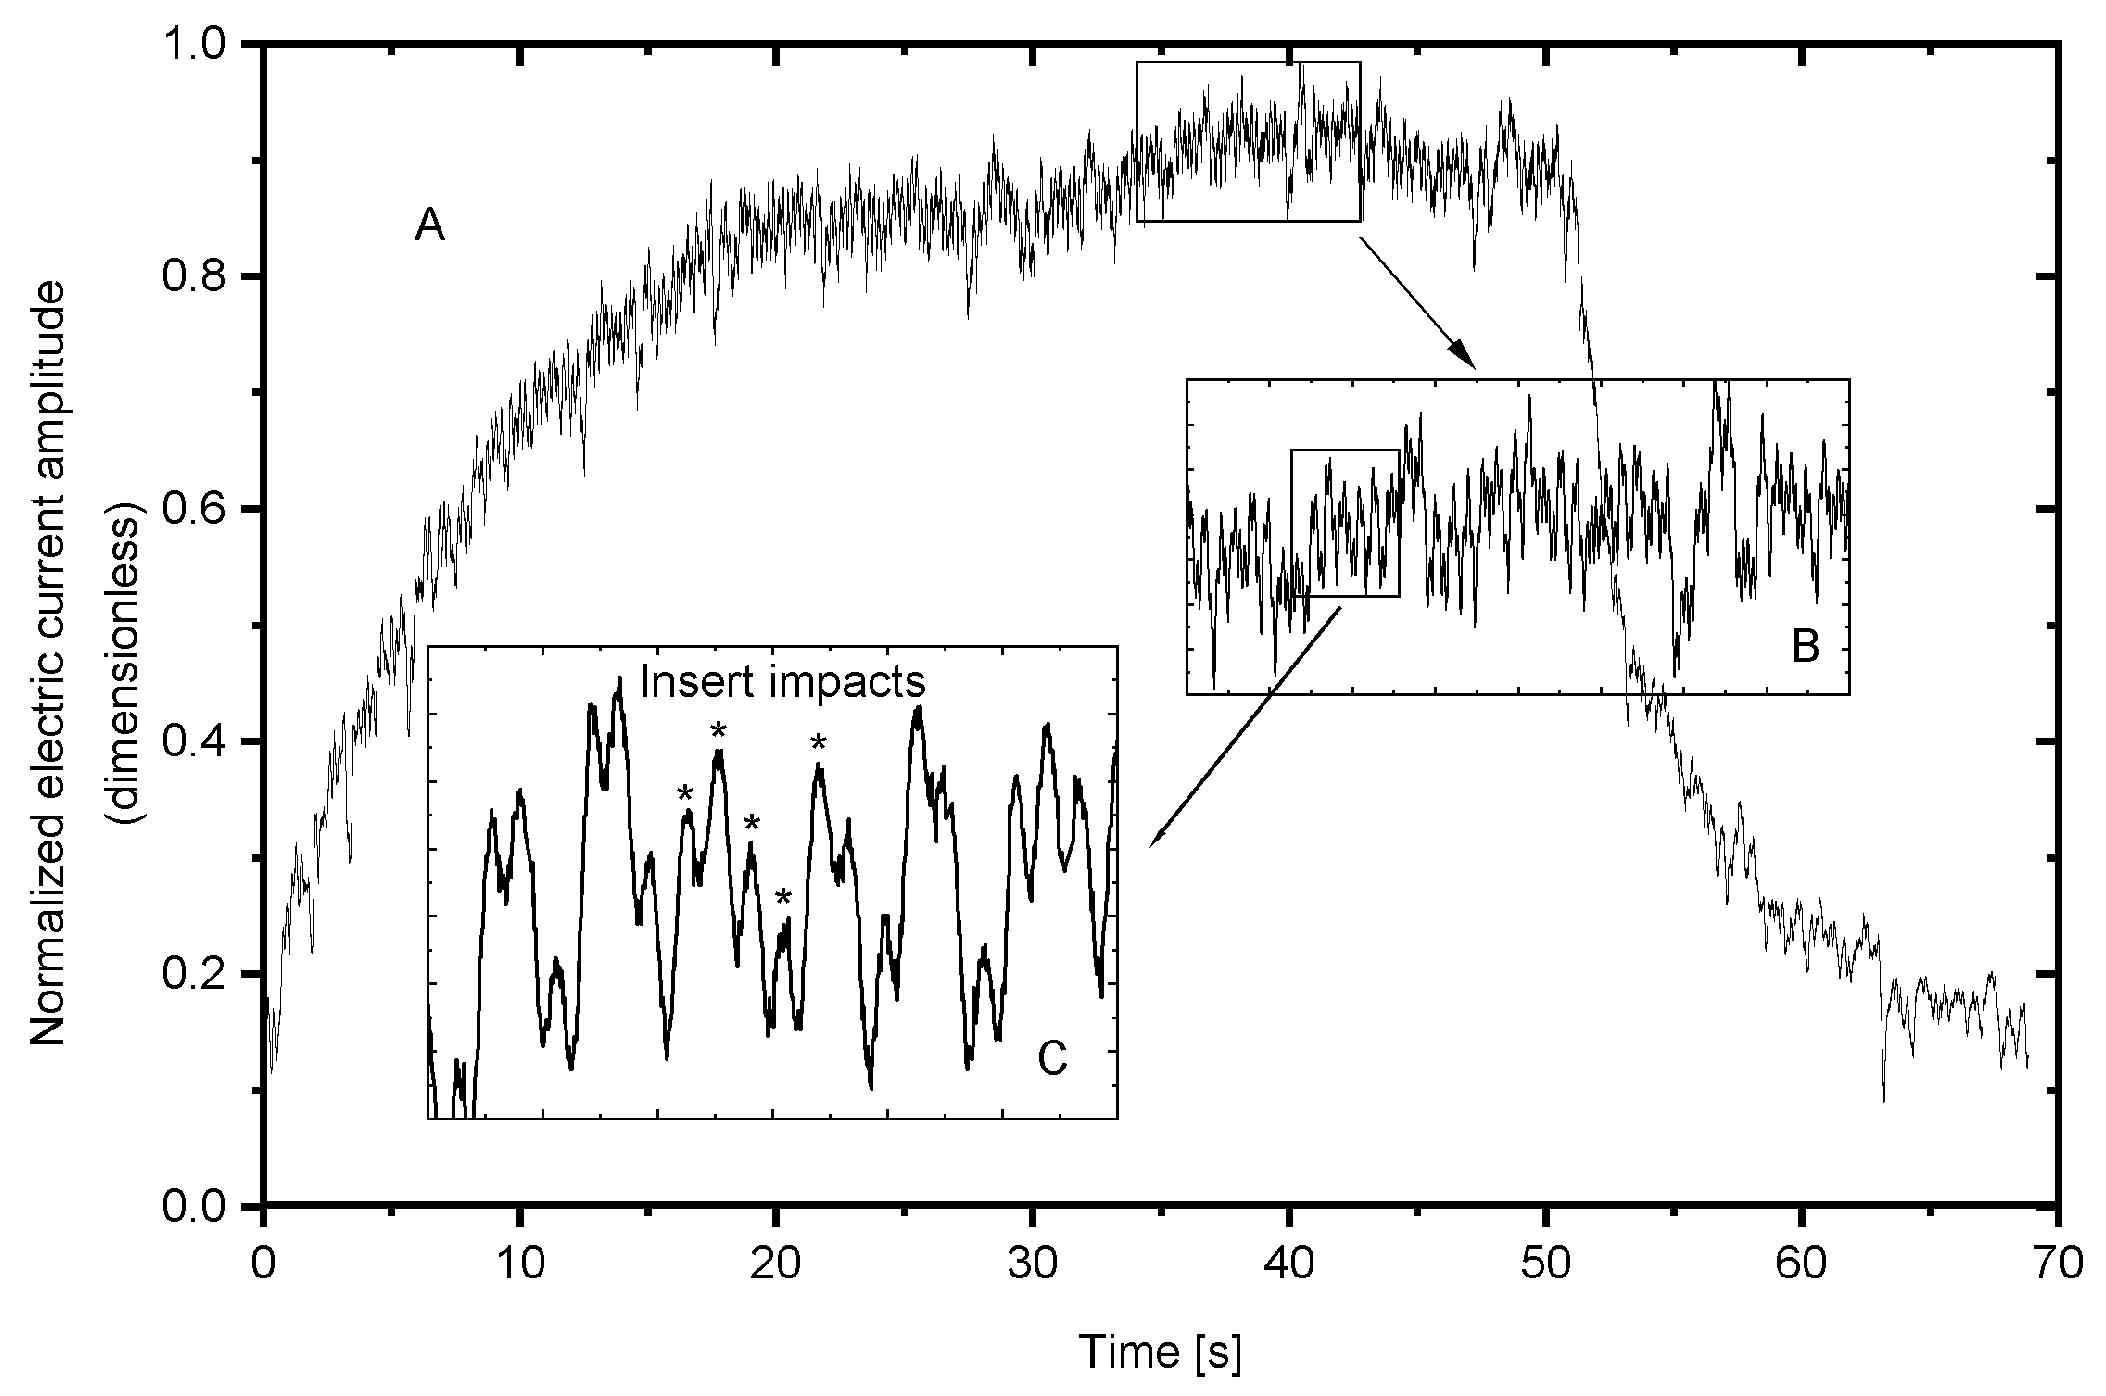
Figure 6.
Electric current variations as a function of the depth of cut separated from the signal envelope.
Figure 6.
Electric current variations as a function of the depth of cut separated from the signal envelope.

Figure 7.
Frequency analysis of the filtered electric current variations. (A) Main components of the signal. (B) Modulation signal. (C) Cutting force signal.
Figure 7.
Frequency analysis of the filtered electric current variations. (A) Main components of the signal. (B) Modulation signal. (C) Cutting force signal.
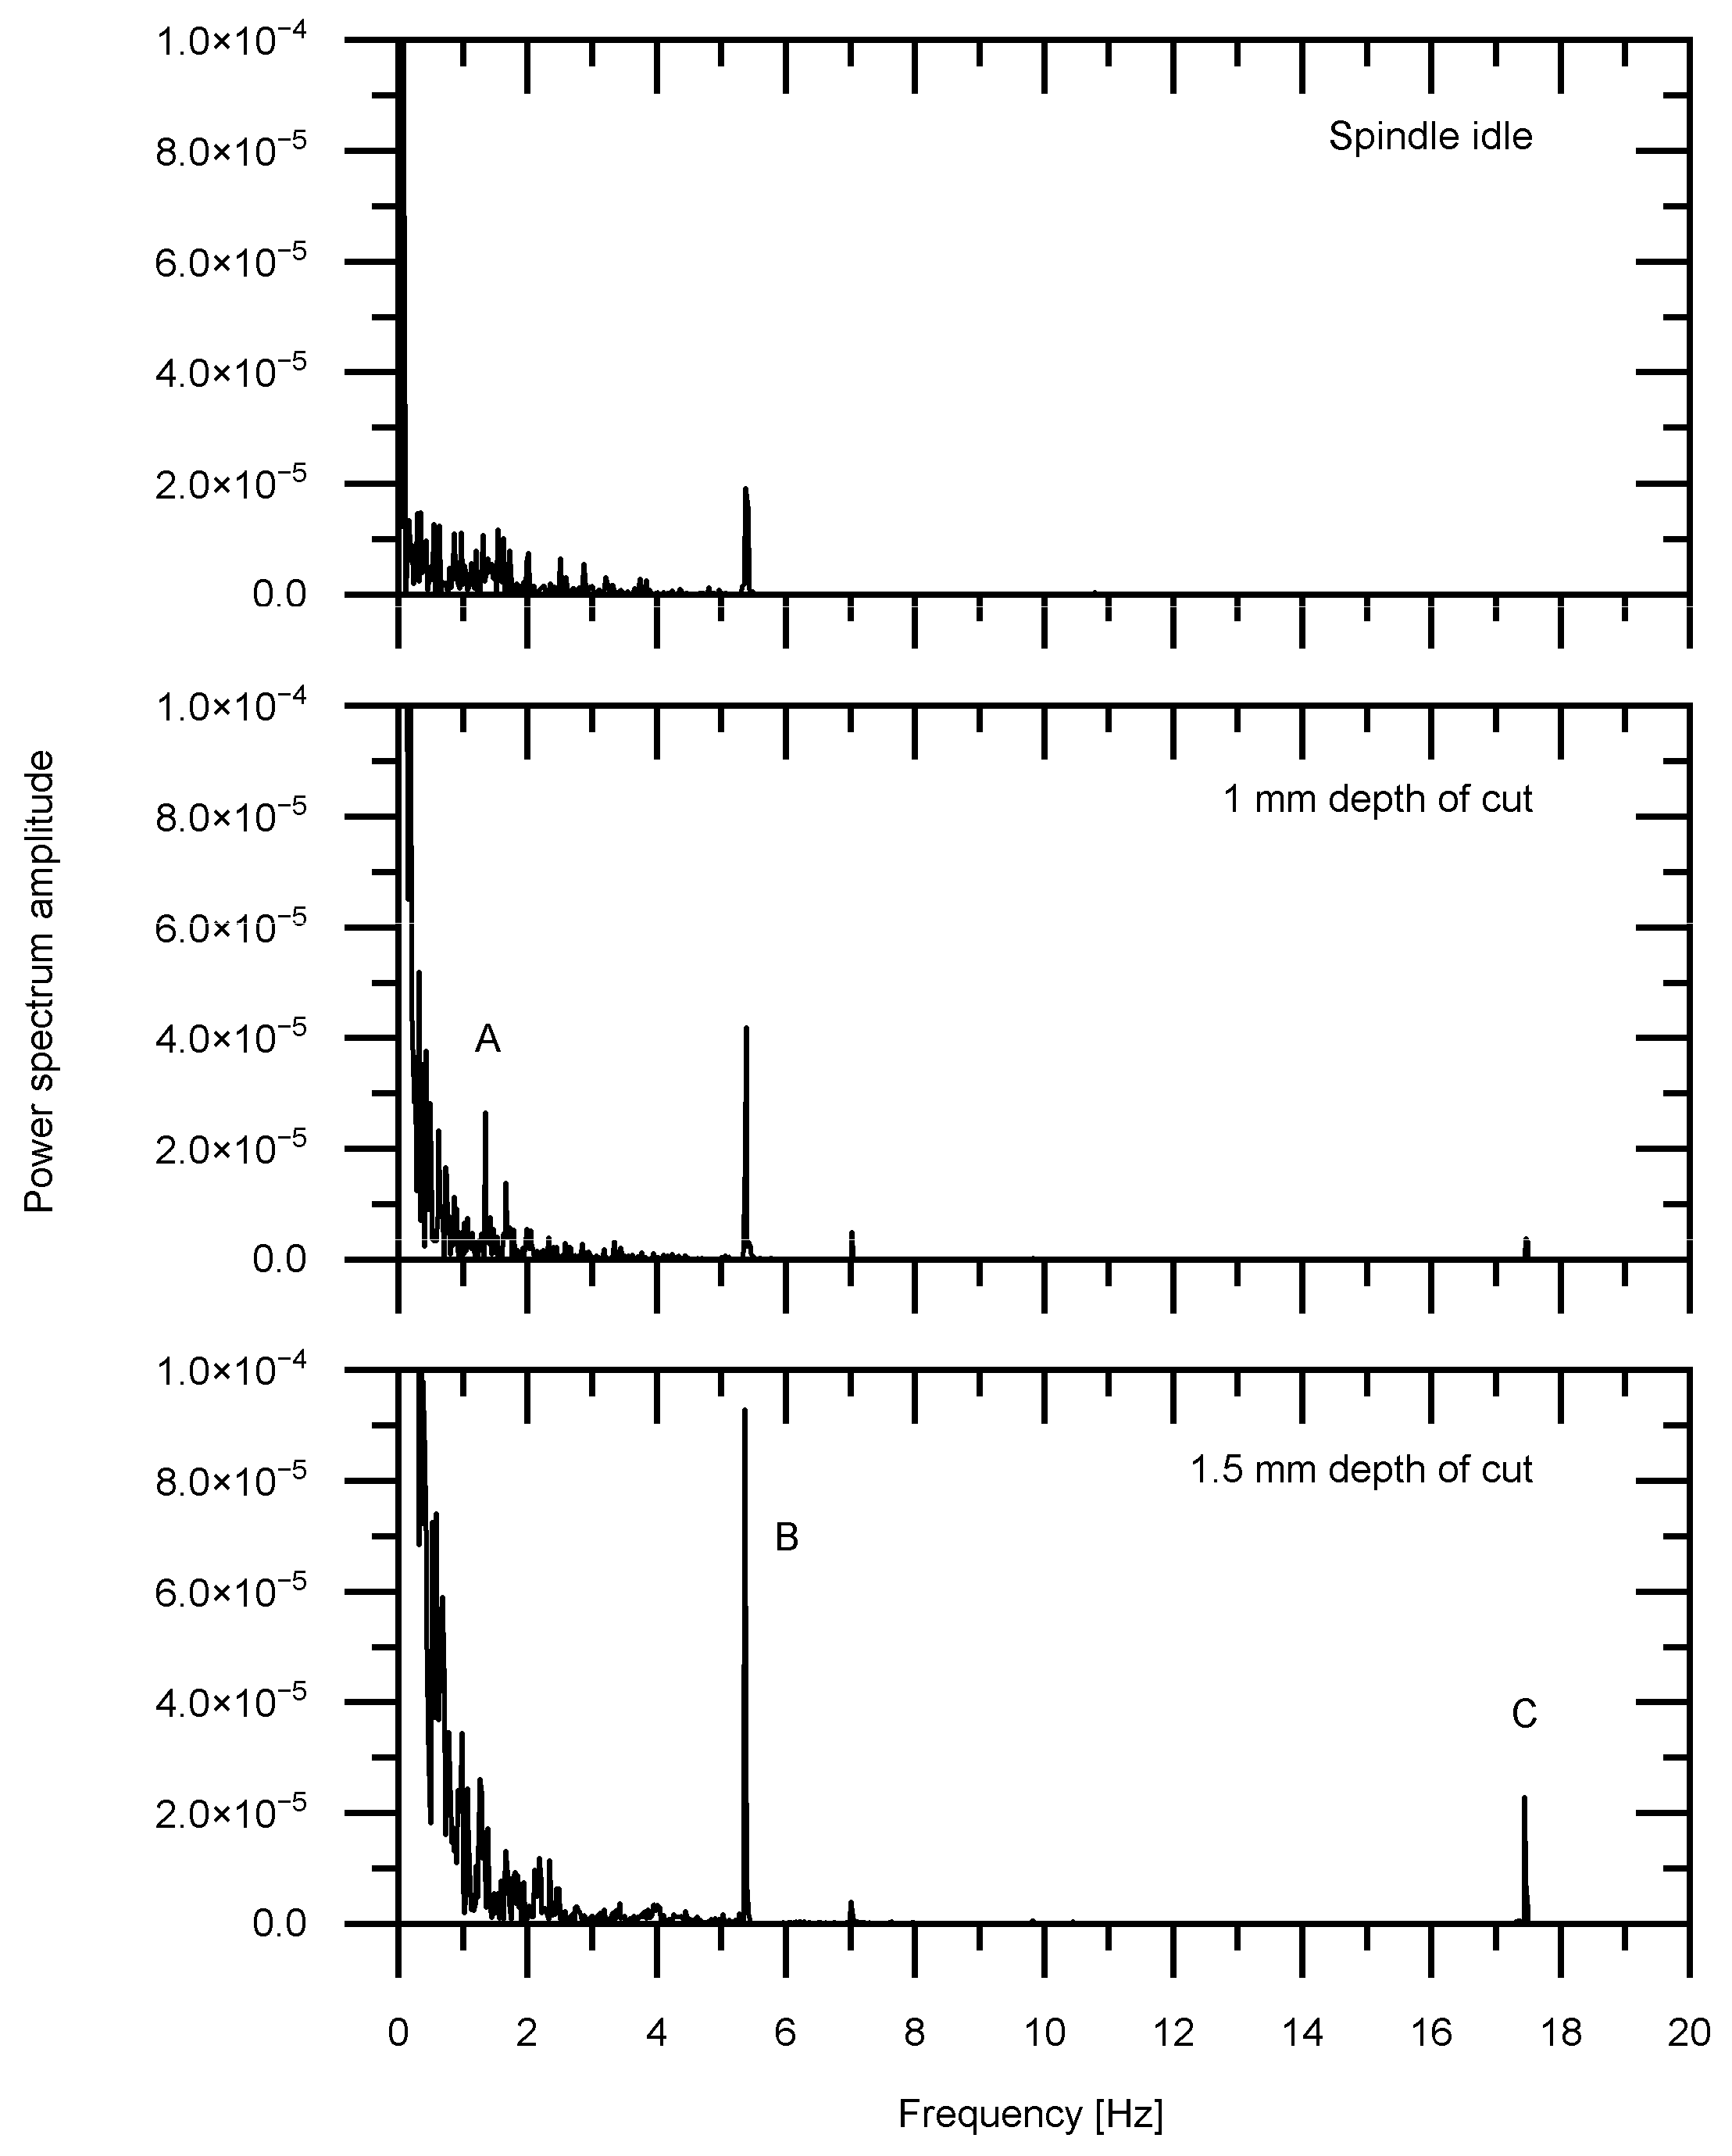
Figure 8.
Periodic signal produced by the cutting tool insert impacts for various depths of cut.
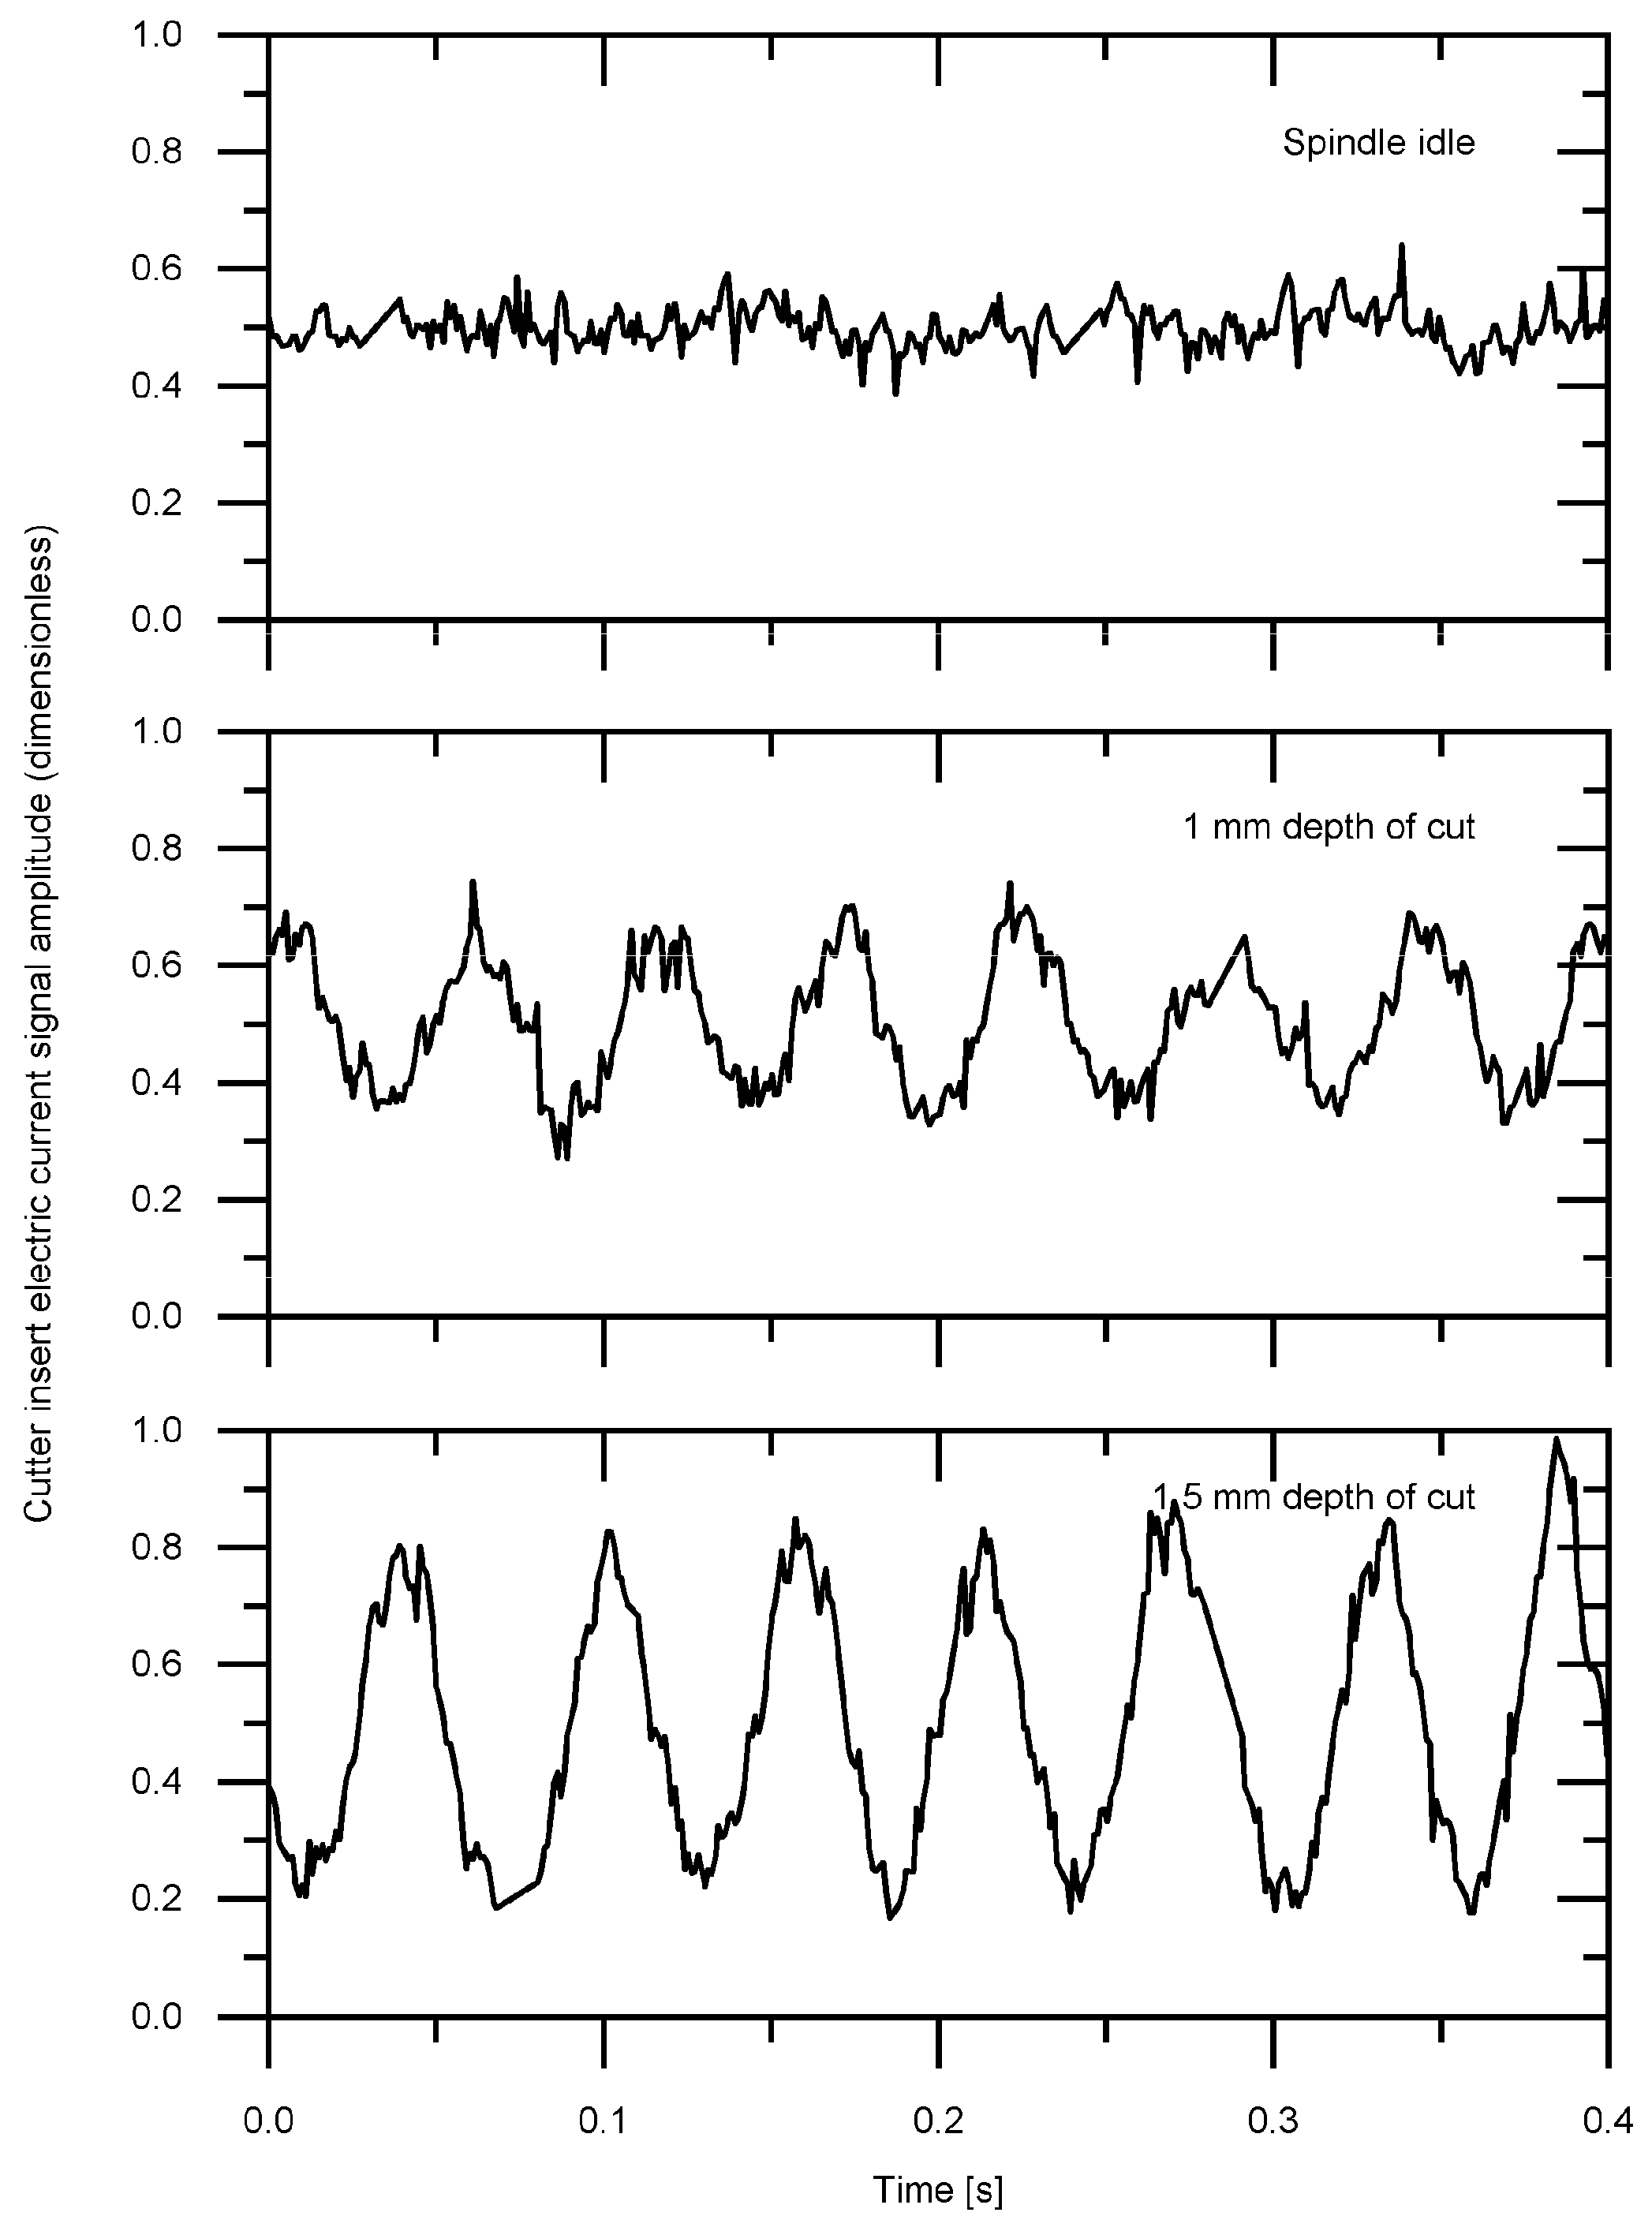
Figure 9.
The electric current signal of interest is located in the lower indexes of the wavelet transform.
Figure 9.
The electric current signal of interest is located in the lower indexes of the wavelet transform.
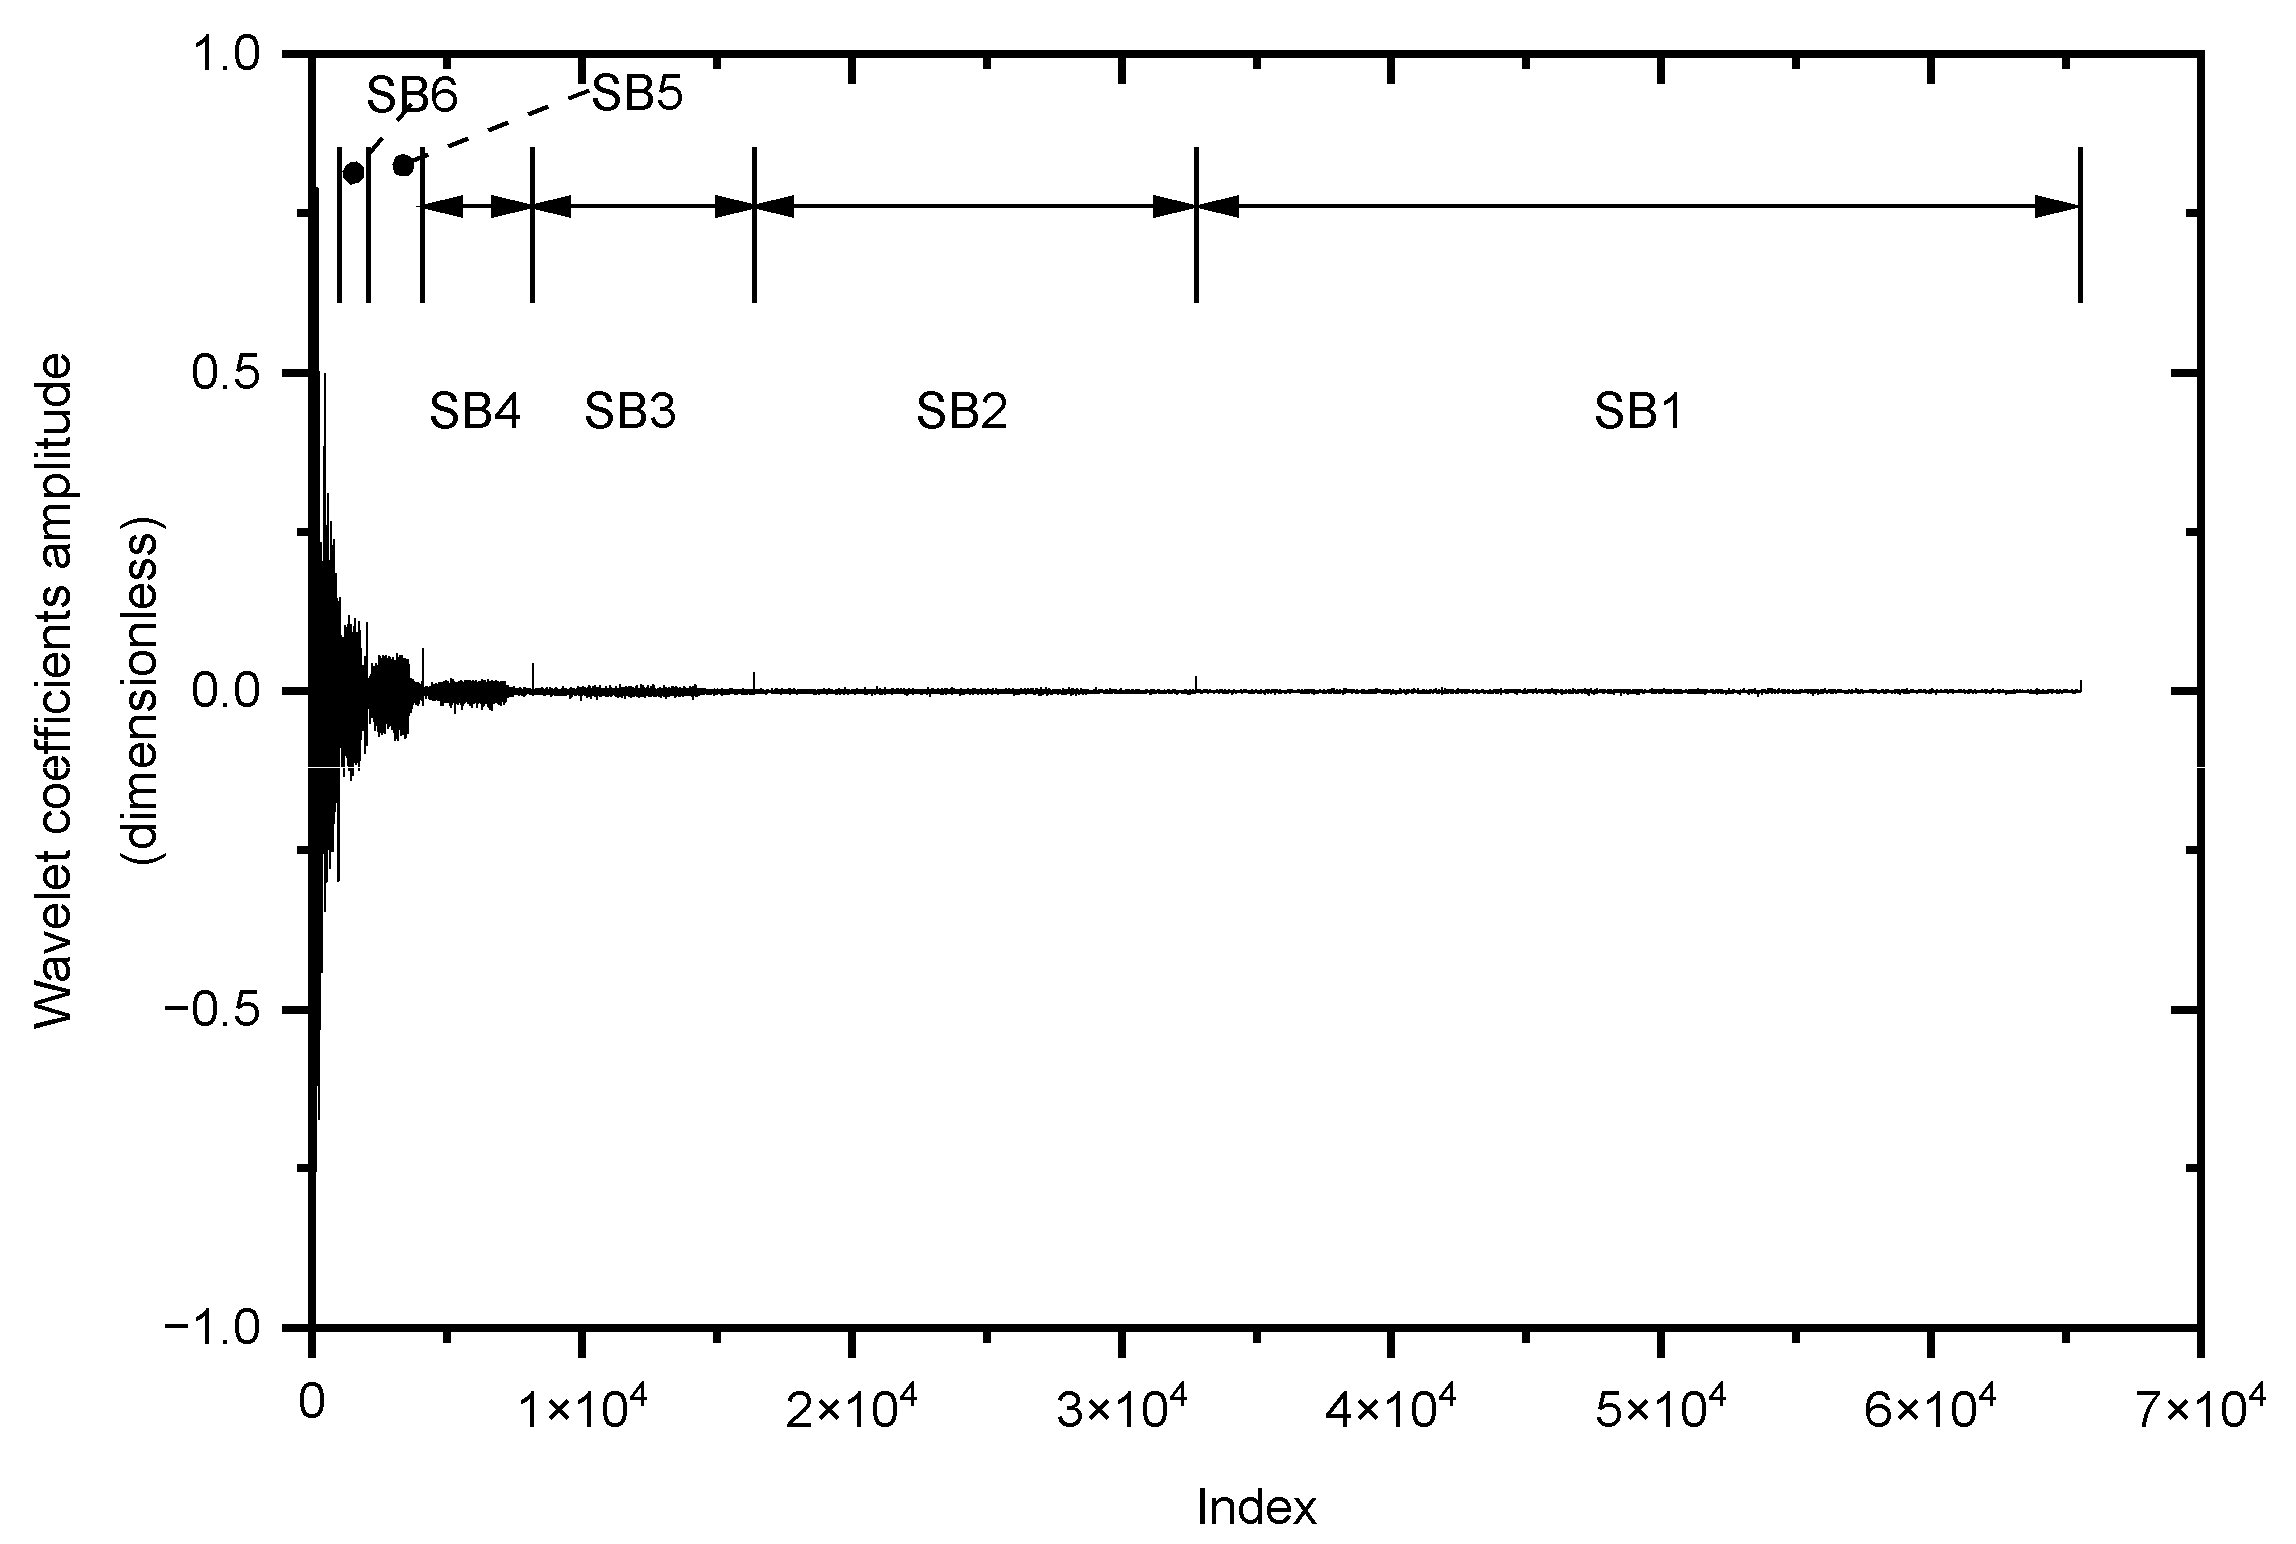
Figure 10.
Coefficients’ amplitudes for seven sub-bands of the wavelet transform.
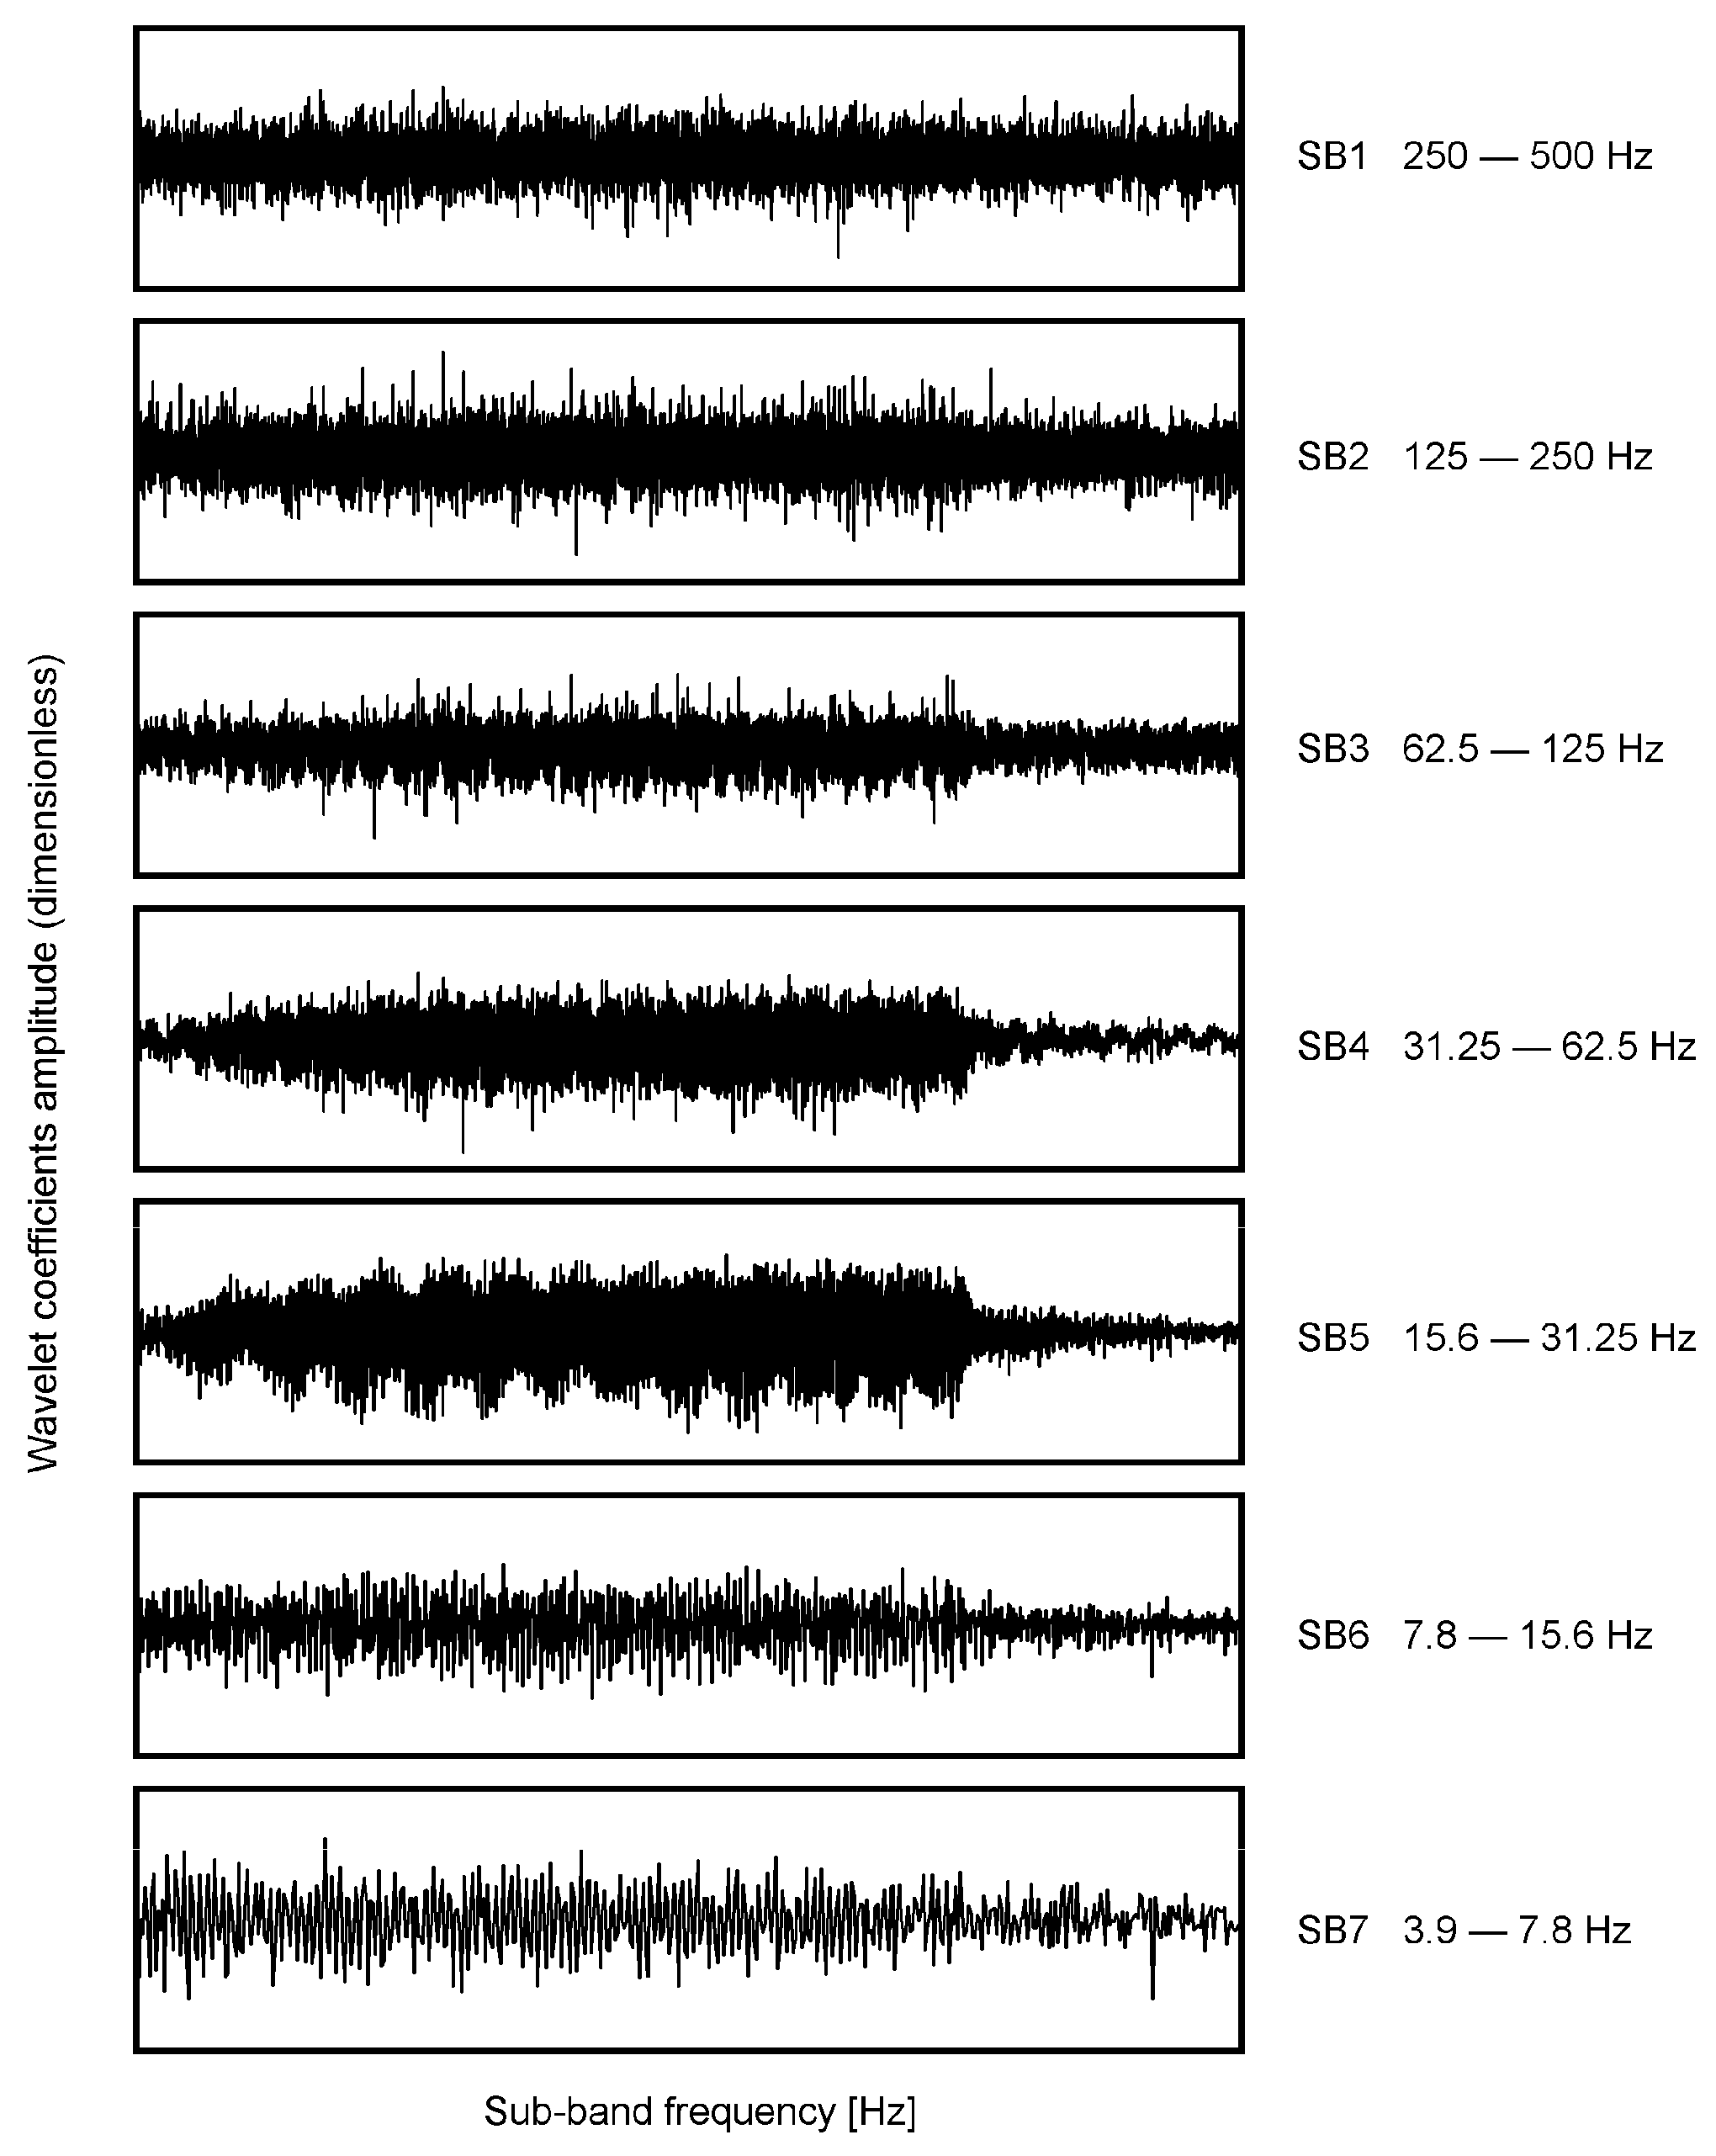
Figure 11.
Comparison of the electric current variations. (A) Wavelet processing. (B) Time–domain signal processing.
Figure 11.
Comparison of the electric current variations. (A) Wavelet processing. (B) Time–domain signal processing.

Figure 12.
Frequency spectrum for (A) wavelet coefficient processing and (B) time–domain filtered signal.
Figure 12.
Frequency spectrum for (A) wavelet coefficient processing and (B) time–domain filtered signal.
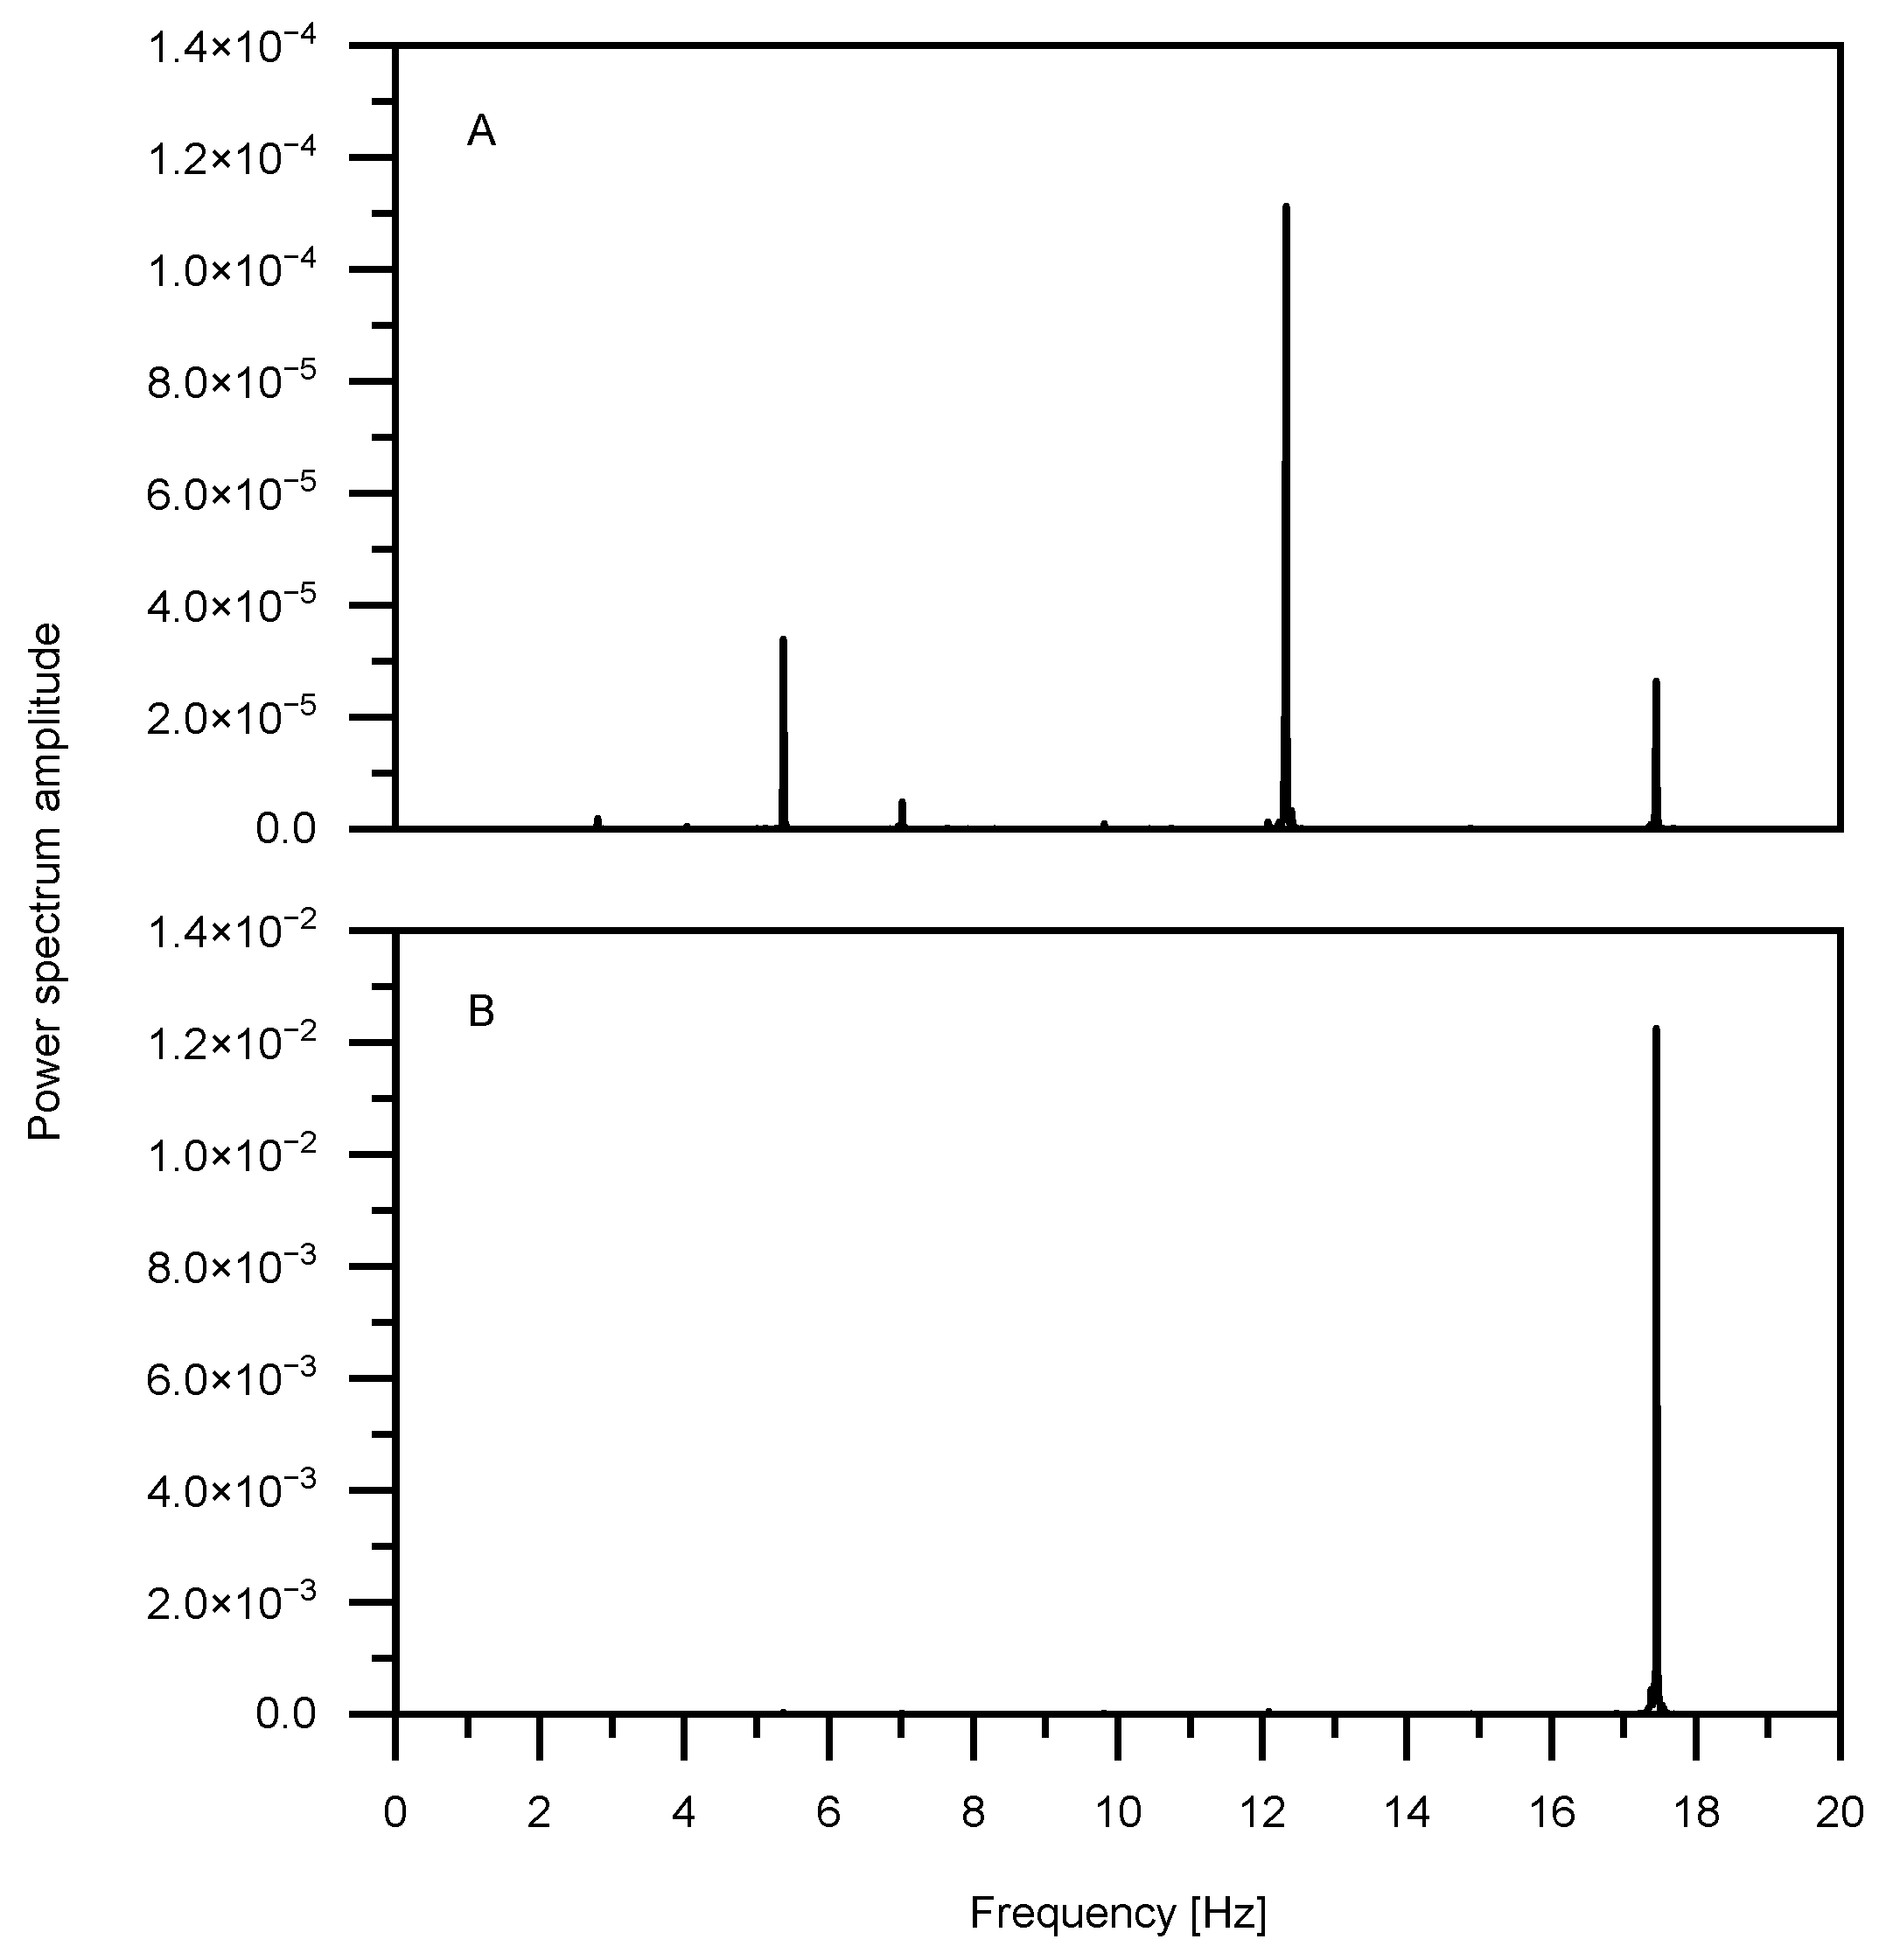
Figure 13.
Electric current signal wavelet filtering and reconstruction. (A) Full wavelet transform coefficients. (B) Suppression of sub-bands that are not of interest. (C) Electric current reconstruction from SB5.
Figure 13.
Electric current signal wavelet filtering and reconstruction. (A) Full wavelet transform coefficients. (B) Suppression of sub-bands that are not of interest. (C) Electric current reconstruction from SB5.
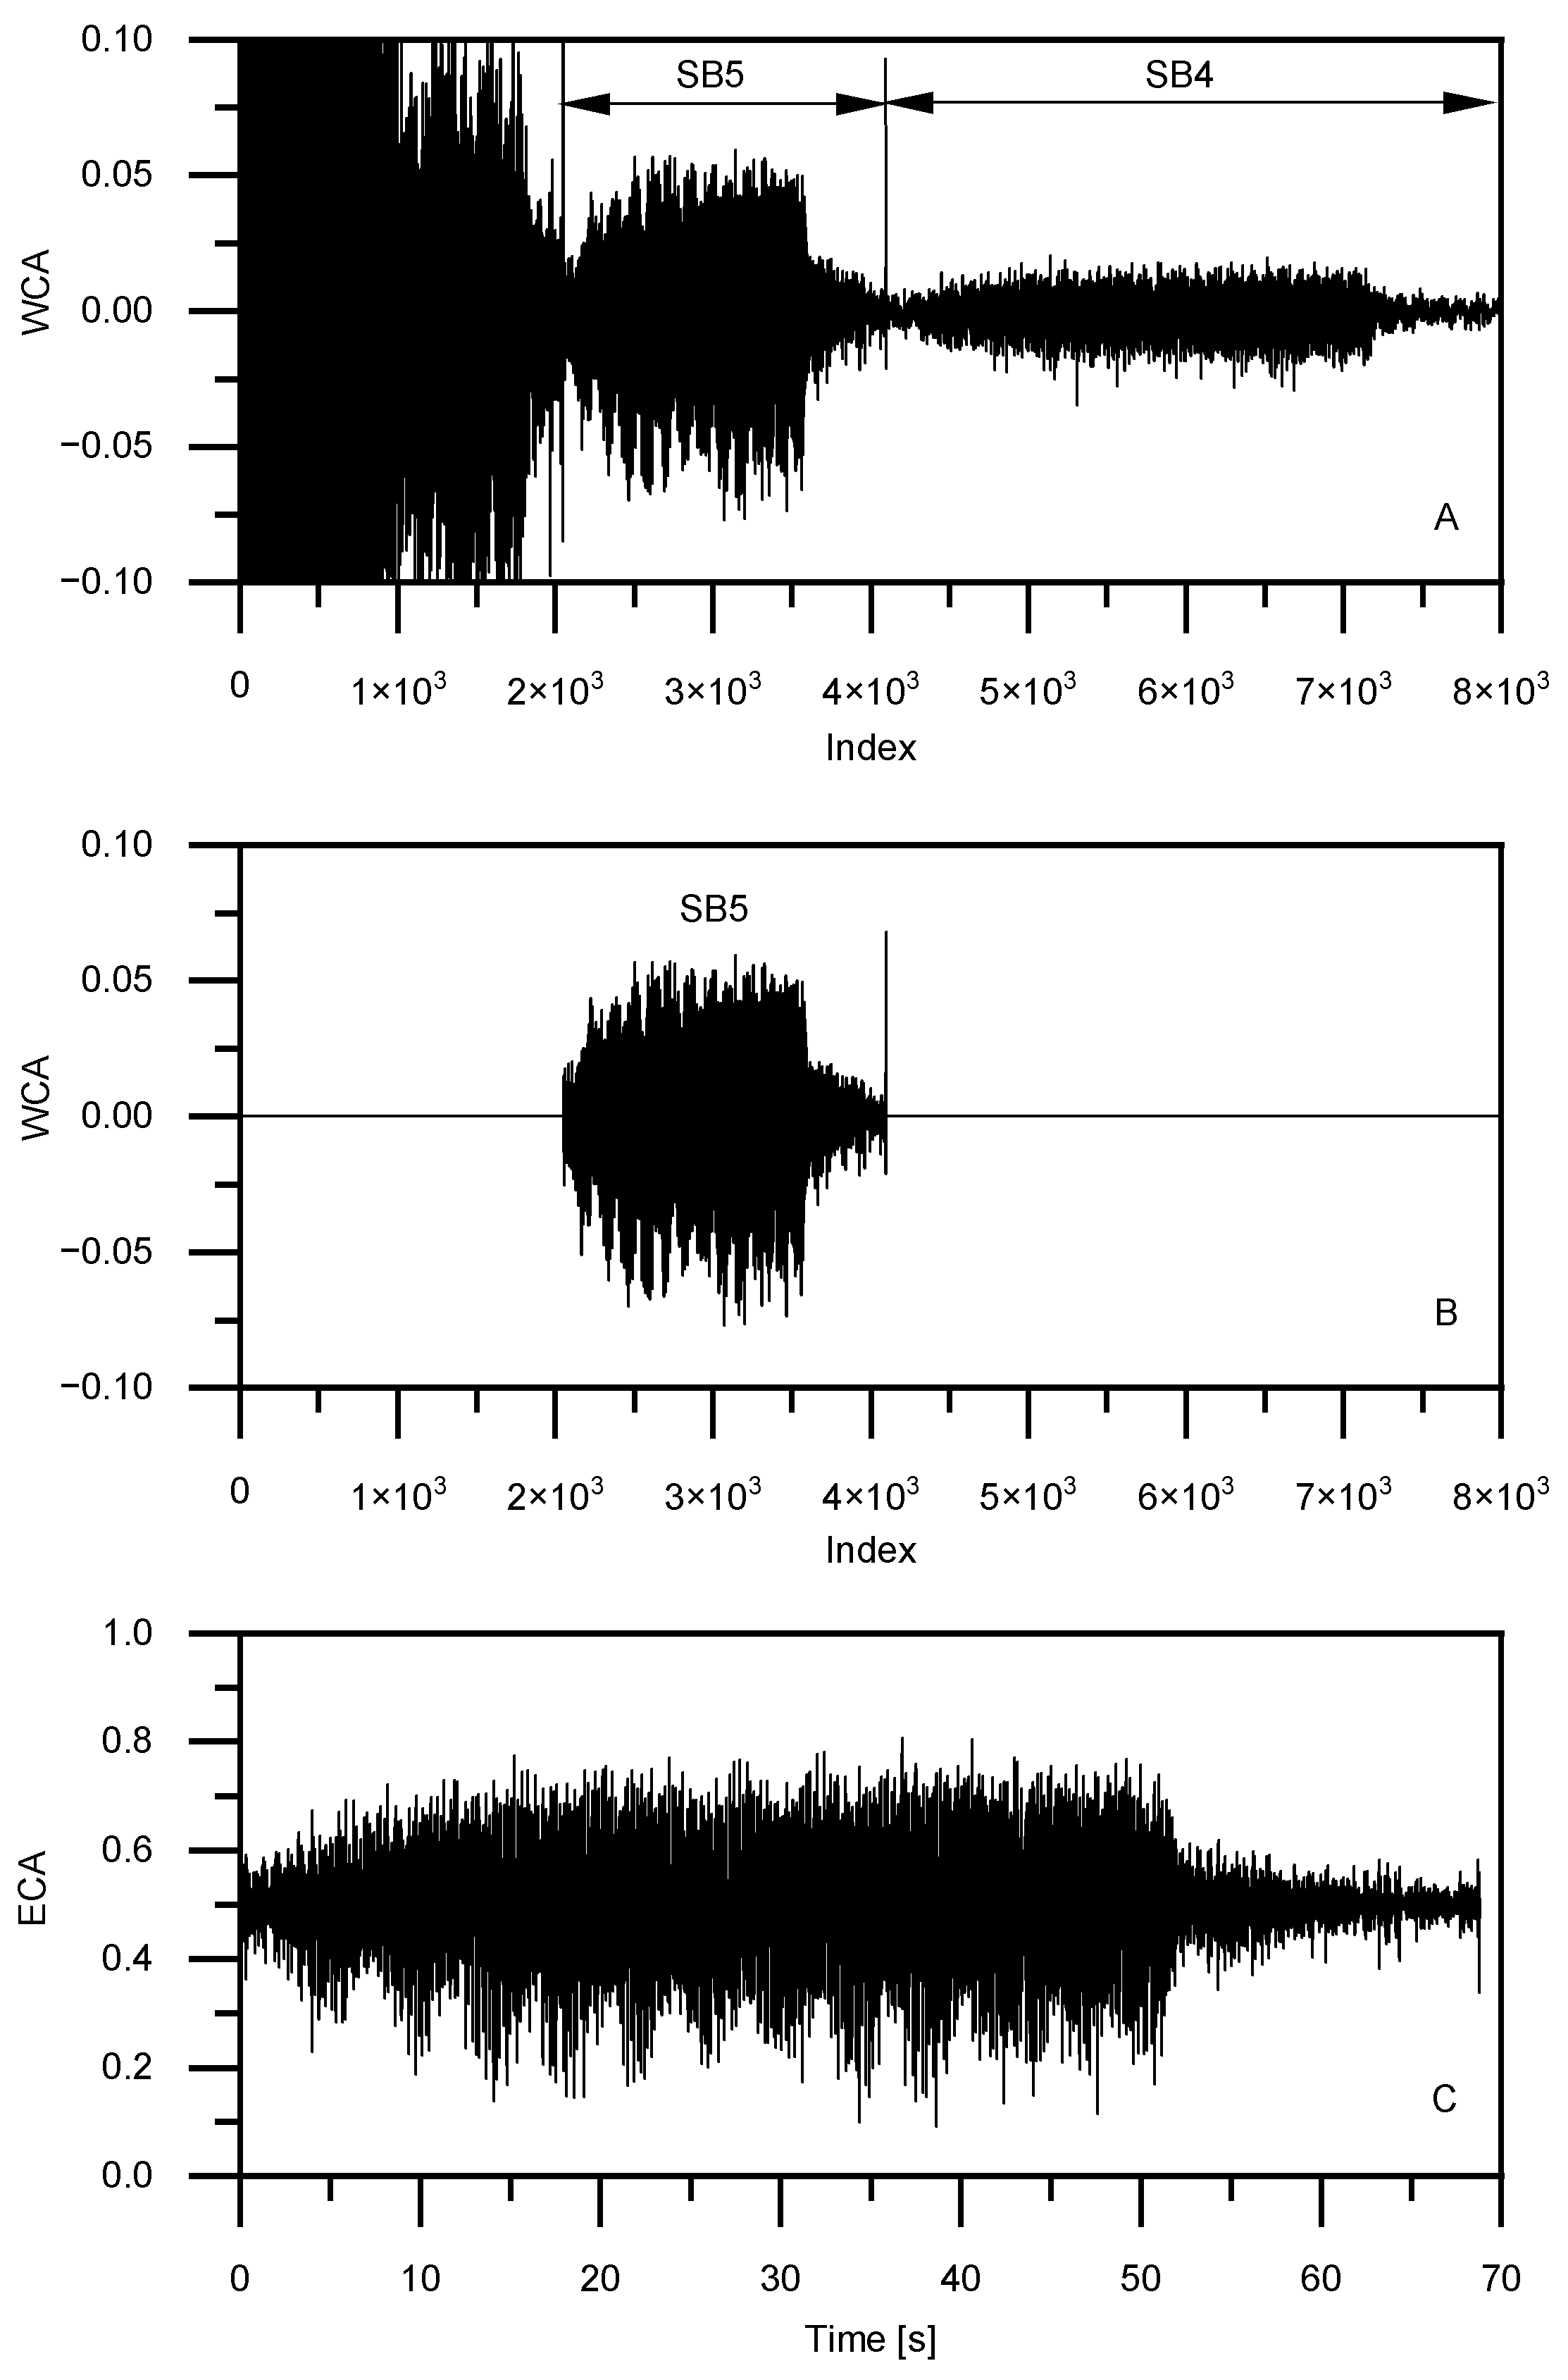
Figure 14.
Signals extracted with wavelets and traditional processing. (A) Electric current wavelet filtering and reconstruction. (B) Wavelet transform coefficients. (C) Traditional filtering processing of the electric current.
Figure 14.
Signals extracted with wavelets and traditional processing. (A) Electric current wavelet filtering and reconstruction. (B) Wavelet transform coefficients. (C) Traditional filtering processing of the electric current.

Disclaimer/Publisher’s Note: The statements, opinions and data contained in all publications are solely those of the individual author(s) and contributor(s) and not of MDPI and/or the editor(s). MDPI and/or the editor(s) disclaim responsibility for any injury to people or property resulting from any ideas, methods, instructions or products referred to in the content. |
© 2024 by the authors. Licensee MDPI, Basel, Switzerland. This article is an open access article distributed under the terms and conditions of the Creative Commons Attribution (CC BY) license (https://creativecommons.org/licenses/by/4.0/).
Share and Cite
MDPI and ACS Style
Rubio, E.; Jáuregui-Correa, J.C. Time–Frequency Approach for Cutting Tool Power Signal Separation in Face Milling Operations. Appl. Mech. 2024, 5, 180-191. https://doi.org/10.3390/applmech5010012
AMA Style
Rubio E, Jáuregui-Correa JC. Time–Frequency Approach for Cutting Tool Power Signal Separation in Face Milling Operations. Applied Mechanics. 2024; 5(1):180-191. https://doi.org/10.3390/applmech5010012
Chicago/Turabian StyleRubio, Eduardo, and Juan Carlos Jáuregui-Correa. 2024. "Time–Frequency Approach for Cutting Tool Power Signal Separation in Face Milling Operations" Applied Mechanics 5, no. 1: 180-191. https://doi.org/10.3390/applmech5010012