
Minimum Shear Reinforcement for Reactive Powder Concrete Beams

1
Civil Engineering Department, College of Engineering, Al-Muthanna University, Al-Muthanna, Samawah 66001, Iraq
2
Guangzhou Institute of Energy Conversion, Chinese Academy of Sciences, Guangzhou 510640, China
3
Department of the Built Environment, School of Design and Environment, National University of Singapore, Singapore 117566, Singapore
*
Author to whom correspondence should be addressed.
Eng 2024, 5(2), 801-818; https://doi.org/10.3390/eng5020043
Submission received: 3 April 2024
/
Revised: 1 May 2024
/
Accepted: 6 May 2024
/
Published: 8 May 2024
(This article belongs to the Special Issue Advances in Structural Analysis and Rehabilitation for Existing Structures)
Abstract
:The aim of this research was to determine the minimal requirements for shear reinforcement for reactive powder concrete (RPC) rectangular cross-sectional beams with a compressive strength of 157 MPa and a steel fiber volume content of 2.0% that remained constant for all the tested beams. Additionally, the recommendations of KCI-2012 and AFGC-2013 for the design of RPC beams as well as the shear design requirements of ACI 314-2014 when applied to RPC beams were studied. Utilizing a three-dimensional finite element program, a computational model was designed for forecasting the deformations and shear strength of the examined RPC beams. Both the shear-span-to-depth relationship (a/d) and the minimal reinforcement web ratio, represented by the distance between stirrups and the diameter of the stirrup bars, are the key study parameters in this regard. According to this study’s experimental findings, increasing the given reinforcement of the web ratio has little influence on both the ultimate shear strength as well as the diagonal cracking strength of the beams. Additionally, the findings demonstrated that the ACI 318-2014 maximum stirrup spacing requirement of 0.5 d can safely be extended to 0.75 d for beams that are relatively short. Compared to what ACI 318-2014 mandates, the suggestions of AFGC-2013 and KCI-2012 are more cautious and safe. According to the AFGC-2013 criteria, the mean proportion of Vfb to projected Vu,AFGC is roughly 58.3%, whereas the mean proportion of vs. and Vc is just 41.7%. The deformation response and ultimate shear strength of the examined RPC beams were well predicted by the designed model using finite elements when metal fibers were taken into account.
1. Introduction
Reactive powder concrete (RPC) is a kind of concrete that was introduced as a result of the building industry’s ongoing growth over the past few decades to serve a variety of structural applications, offering a considerably greater level of strength and more durability [1]. The outstanding performance of RPC is due to the microstructure improvement processes applied to cementitious materials, including excluding coarse aggregates, using super-plasticizing agents to lower the water/cement ratio, and incorporating fibers and cementitious components like silica fume [2,3,4]. RPC is being employed more and more in applications in civil engineering owing to its excellent structural performance to date, particularly for high-rise, long-span structures; bridges; highways; municipal transit; etc. [5,6,7,8]. Several studies have looked into the mechanical features [9,10,11,12,13,14], fiber dispersion features [15,16,17,18,19,20], bond efficiency [21,22,23,24,25,26,27], and shrinkage behaviors of RPC [28,29]. But there is limited data in the literature regarding the shear properties of RPC deep and narrow beams both without and with reinforcement of the web [30,31,32,33,34,35,36]. The design of RPC beams is not addressed in any of the current international codes, including Eurocode 2 (EC-2) [37] and the ACI 318-2014 Building Code [38]. As a result, there have been several inquiries into the minimal reinforcement for shear required for RPC beams. The first recommendations for design for RPC construction projects were introduced in 2002 by the France Association of Civil Engineers (AFGC)-2002 [39], and they were modified in 2013 by the AFGC-2013 [40] so as to account for the role of steel fibers in the shearing design. In 2008, the Japan Society of Civil Engineers (JSCE) [41] and, in 2012, the Korea Concrete Institute (KCI-2012) [42] also made suggestions for the design of RPC beams.
Based on that, this study focuses on reporting the results of shear tests of RPC beams provided with minimum shear reinforcement. The RPC beams’ shear design was examined following the KCI-2012 and AFGC-2013 recommendations. Additionally, anumerical model for predicting the RPC beams’ shear strength and deformations was created utilizing a 3-dimensional finite element program.
2. Design Guidelines for the Shear of RC Beams
2.1. Shear Design of RC Beams under ACI318-2014 Code
According to the commonly used approach for the investigated codes, the total design shear strength, Vud, is calculated as the sum of the shear sustained by the shear reinforcement, Vs, and the concrete, Vc, i.e.,
The following are the specifications for concrete’s design shear strength, Vc:
where bw and d are the beam’s width and depth, respectively, and f′c is the concrete’s cylinder compressive strength in MPa. It is possible to calculate the shear strength offered by shear reinforcement Vs by using the following formula:
where Av and fyv represent the area and required yield strength, respectively, of vertical reinforcement on the web located within a distance between stirrups (sv). The specified vertical web strengthening ratio (ρv = Av/bw sv) should be greater than the minimal value (ρv,min) demanded by this code, which is equal to the higher of the two values 0.35/fyv or (0.062 f′c/fyv).
2.2. The ACI318-2014 Code for RC Beams Specifies the Minimal Amount of Shear Reinforcement
According to this code, beams are structural members whose clear spans cannot be more than four times the total component depth (h), or whose concentrated loads are located at a distance of two times the distance (2h) from the face of the support, and that satisfy these requirements.
The following are the minimal areas for the horizontal and vertical reinforcement of the web, (Ah,min) and (Av,min), respectively:
where b is the beam’s breadth, sh is the distance between longitudinal reinforcements that are dispersed horizontally, and sv is the distance between vertical web reinforcements. In order to prevent sh and sv from exceeding the minimum value of 300 mm or d/5, wherein d is the effective depths, the reinforcement of the web needs to be designed in this way.
2.3. Limits of Spacing for Shear Reinforcement
The shear reinforcement spacing limits are outlined in Section 9.7.6.2.2 of ACI 318-14 (2014) [38]. The highest permitted distance between stirrups (sv,max) is equal to a minimum of 600 or 0.5 d mm; however, if the shear reinforcement’s contribution to the shear strength is above (0.33 bw d), sv,max should be decreased by half. The spacing limitations recommened by EC2 [33] are 0.75 d or 600 mm.
But the present design recommendations for RPC members do not specify the shear reinforcement spacing limitations.
2.4. Design Recommendations for RPC Beams in Regard to Shear
The following equation shows how the design shear strength Vud of RPC is determined:
where Vs, Vc, and Vfb are the shear strengths contributed by the shear reinforcement, cement matrix, and steel fiber, respectively.
2.5. The France Association of Civil Engineers (AFGC-2013)
The cement matrix’s design shear strength Vc is specified as follows:
where γcf is the assumed value of 1.30 for the partial safety factor regarding fibers, k is the factor pertaining to the situation in which pre-stressing has been applied, and γE is a safety factor, with γcf γE being equal to 1.5. The following formula can be used to compute the contribution of steel fibers, Vfb:
where θ is the angle between the primary compression stress and the beam axis, which can be taken to be at least 30°; Afv is the area of the a fiber effects, which can be taken as bw z for rectangular sections, where z = 0.9 d; and σRd,f is the remaining tensile strength, which can be calculated as follows:
where σf(w) is a function of tensile stress and fracture breadth, where wlim = max (wu, wmax); K is the orientation of the fiber factor, which can be considered to be equal to 1.25; and wmax is the widest fracture possible.
The vertical shear reinforcement’s shear strength is calculated as follows:
2.6. Korea Concrete Institute (KCI-2012)
The cement matrix’s shear strength is given as follows:
where bw is the beam’s breath, d is the beam’s effective depth, f′c is the cylinder’s compressive strength, and ϕb is a member reduction factor of 0.77. According to the equation below, the steel fibers’ shear strength (Vfb) is
where βu is the angle between the diagonal tensile fracture plane and the axial direction of the beam and must be greater than 30°, fvd is the mean splitting tensile strength design in a location perpendicular to the diagonal tensile break, and z is the span from the location affected by compressive stresses to the centroid of tension steel, which is typically equal to d/1.15. This formula is used to determine fvd’s value:
where wv is the ultimate fracture width at the area at which outer-fiber peak stress is applied; ϕc is the material’s reducing factor, considered to be 0.8; σk (w) is the tensile softening curve; wv = max (wv, 0.3 mm); and σd (w) is equivalent to ϕc σk (w).
The vertical shear reinforcement’s shear strength is calculated as follows:
where αs is the angle between a beam’s longitudinal direction and the shearing reinforcement, Av is the cross-sectional area of the reinforcement, fyv is its design yield strength, and sv is its spacing.
3. Materials and Methods
3.1. Materials Used
Materials utilized for this investigation include quartz sand, silica fume, cement, water, fibers, steel reinforcing bars, and superplasticizer. In the RPC mix, Portland cement type CEM I 52.5 N with a mean compressive strength of 53.8 MPa at 28 days, a mean specific surface area of 3300 cm2/g, and a medium diameter of particles of 15 μm was utilized. It was made from natural sand that was 0.5 mm in size and had a specific density of 2.65. In addition to silica fume powder, which has a specific gravity of 2.20, a specific surface area of 170,000 cm2/g, and an average diameter of around 0.15 mm, crushed quartz powder with an average diameter of 1 um to 100 um, a Blaine fineness of 3100 cm2/gm, and a specific gravity of 2.85 was also utilized. All mixes contained a superplasticizer of a new generation of polycarboxlic ether. The steel fibers employed in this investigation were a form of locally accessible hook-ended straight fiber. The steel fibers had an equivalent diameter and length of 13.0 mm and 2.0 mm, respectively. By performing a direct tension test, the fibers’ yield strength and tensile strength were calculated, and the results were 550 MPa and 820 MPa, respectively. The volume fraction of steel fibers was maintained at a consistent level of 2.0% for each tested beam. The regular tap water that was used complied with the standards for concrete mixing water.
3.2. Concrete Mix Proportions and Specimen Casting
Table 1 provides a summary of the mixture ratios for 1.0 m3 of RPC. A high-speed mixer was used to combine the mixture’s contents for 10 min. Then, 75% of the water was added to the mixer after all powders and natural sand had been dry-mixed for 2 min at low speed. The mixer was stopped for 1 min after 2 min of mixing at low speed (140 ± 5 rpm). The mixture was then blended for three minutes while the remaining water and superplasticizer were added. The final step involved mixing the mixture for two minutes at high speed (285 ± 10 rpm). For the first 24 h, concrete specimens were allowed to cure at ambient temperature (21 ± 2 °C). The samples were damp-cured up until the testing day after demolding. This RPC mix’s cube concrete compressive strength (fcu) is 157 MPa depending on a typical of three cube specimens, and its cylinder concrete compressive strength (f′c) and splitting cylinder tensile strength (fsp) are 144.3 MPa and 11.9 MPa, respectively. Its flexural strength (fr) is 39.7 MPa based on 100 mm × 100 mm × 500 mm prisms.
The beams were put to the test in a 200-ton loading frame. Each specimen was equipped with enough instrumentation to determine the strains in the stirrups and longitudinal bars as well as the mid-span deflection. The induction and spread of cracks were noted, and measurements of the crack widths inside the shear span zone were made.
According to ASTM C109 [43], ASTM C496 [44], and ASTM C78 [45], the compressive strength of 100 mm cubic molds, splitting tensile strength of the cylinder (diameter of 100 mm × depth of 200 mm), and flexural strength of 100 mm × 100 mm × 500 mm prisms were calculated, respectively, and the average values of the three tested specimens were adopted.
3.3. Experimental Program for the RPC Beams
Information about the test specimens can be found in Table 2. The test specimens, which consist of five RPC beams composed of an identical concrete mixture, were subjected to two point loads with simple supports.
As presented in Figure 1, the beam specimen’s cross-section had the following dimensions: a width of 140, a depth of 220 mm, and a length of 2000 mm. The appropriate a/d ratio was achieved by varying the distance (c) between the two loads while maintaining the beams’ effective spans, which were 1750 mm each. Six distorted 18 mm diameter bars arranged in two layers were used as the principal longitudinal tension reinforcement of the examined beams in order to guarantee shear failure. These bars have a yield strength of 496 MPa. Two deformed bars with a yield strength (fyl) of 410 MPa served as the compression reinforcement for the beams. Each bar was 10 mm in diameter. The yield strengths (fyv) of stirrup bars with diameters of 6 mm and 8 mm are 330 MPa and 310 MPa, respectively.
The existing vertical reinforcement of the web was altered in the tested beams by using different stirrup spacings (sv = 200 and 100 mm) and different bar stirrup diameters (dv = 6 and 8 mm) so as to test the suitability of the minimal vertical reinforcement of the web required according to ACI 318-14 when applied to RPC beams. In accordance with ACI 318-14, sv,max is equal to the lesser of 600 mm or 0.5d, and ρv,min is equivalent to the larger of 0.35/fy or (0.062/fyv), while sv,max must be decreased by half in cases where the shear strength given by shear reinforcement (Vs) is above (0.33 bd). Table 2 compares the provided vertical web reinforcement ratio (ρv = Av/(bw·sv)) of the examined RPC beams with the minimum requirements (ρv,min) of the code, as well as the distance between stirrups (sv) of the examined RPC beams with the highest permitted distance between stirrups (sv,max) required by the ACI 318-2014 code. Clearly, it can be observed that the provided area of vertical web reinforcement (Av) for all the tested beams satisfies the minimum requirements (Av,min) of the ACI 318-2014 code. The specified stirrup spacing (sv) of each of the examined beams, however, is significantly greater than the highest stirrup distance (sv,max) allowed by the aforementioned code. It should be noted that the stated stirrup spacing (sv) of all examined beams is more than double the highest stirrup spacing (sv,max) permitted by ACI 318-2014.
4. Analysis Software and Model Calibration
Nonlinear finite element software was utilized to perform the analysis. This R/C-focused software features a wide variety of constitutive models for concrete, reinforcement, metals, and robust nonlinear solvers. Hence, it meets the requirements of the analysis. Several criteria were set to evaluate the numerical results. Primarily, it was determined that the numerical and experimental failure modes for the R/C beam should be identical. Furthermore, numerical analysis was conducted to predict parameters such as the maximum load (Pmax) and the corresponding displacement (δmax) but also the ultimate load (Pu) and the corresponding displacement (δu). The final parameter was the energy absorption capacity of the beam, which is equal to the area below the force–deflection response curve [44,45].
4.1. Concrete and Reinforcement Constitutive Models
Utilizing the software program ABAQUS [46], a 3-dimensional nonlinear finite element model (FEM) was utilized to forecast the overall response of the reinforced concrete beams, including displacement, stress and strain distributions, ultimate shear stresses and modes of failure, and crack patterns. SOLID C3D8R, a three-dimensional RC element that can collapse under compression and fracture under tension, was used to mimic concrete. This component is composed of eight nodes, each of which has three translational degrees of freedom (x, y, and z). Utilizing a bar element (T2D3) inside the concrete solid 65 component, the main and web reinforcement were modeled. It was presumed that the bar element was embedded into the concrete solid element.
4.2. Finite Element Modelling and Analysis Procedure
Concrete was modelled using eight-node isoparametric solid elements, with each side equal to 2 cm. Cables and reinforcement were modeled using 2-node truss elements, which were embedded in concrete elements. Load was applied as prescribed displacement, which was applied in small steps, in order to simulate the experimental procedure and avoid local failures. To evaluate the force–deflection response curves of the specimens, two monitoring points were utilized. The first was placed in the loading plate and monitored the applied load, which was essentially the reaction of the beam to the applied displacement. The second was located on the bottom surface of the R/C beam, right below the first one, and monitored the corresponding displacement. The Modified Newton–Raphson iterative scheme was applied with appropriate convergence criteria and the maximum number of iterations. Table 3 summarizes the concrete and reinforcement model calibrations.
5. Results and Discussion
5.1. Damage and Crack Patterns
Figure 2 provides images of the examined beams that demonstrate typically observable fracture patterns and modes of failure. Except for the tested beam, B-3, which failed in a compression region in the middle of the spans prior to a shear failure, all of the examined RPC beams failed under shear.
The ultimate strength (Pu,exp) and diagonal cracking strength (Pcr) of the examined beams in this study are shown in Table 4. Following the development of flexural fractures in the middle of the span, diagonal cracks often developed in the beam’s two shear spans. The breadth of the flexural crack narrowed significantly after the formation of diagonal shear cracks. Typically, a diagonal shear crack began abruptly in the center of the span of a shear crack and spread toward the supports and load points as a result of an increase in the load being applied. The already-present diagonal shear cracks only slightly spread further as the load applied was increased, but a few new inclined cracks were also created. Finally, the concrete fractured abruptly across the inclined crack due to shear failure. The images demonstrate that the shear spans of the examined beams B-1, B-2, B-4, and B-5 failed due to significant concrete degradation, whereas beam B-3 fell due to crushing of the compression zone in the middle of the span with an a/d of 3.0. According to the test results, flexural failure may occur before shear failure when minimal reinforcement for shear is provided within the distance of 0.5d recommended in ACI code [34]. The yielding of shear reinforcement, however, may be seen before the yielding of flexural reinforcement and the compression failure of beams with a distance that is higher than the minimal levels required by code.
5.2. Load–Displacement Relationships
In Figure 3, the mid-span load (P)–deflection curves for the examined RPC beams with various a/d ratios and varying vertical web reinforcement ratios (ρv) are displayed.
The beams exhibited fully elastic behavior when they were initially loaded. Overall, the upward portion of the load–deflection curves was not significantly affected when altering the tested beams’ ρv% when the a/d ratio was kept constant. The deflection values of the examined beams with an equal a/d ratio and various ρv% values showed only slight variations after being subjected to the ultimate load. Figure 3 shows that beam B-2 with an a/d ratio of 3.0 and a supplied ρv of 0.10, the latter of which is lower than the minimum specified by the code, exhibits a stiffness like that of beam B-1, with the same a/d ratio but providing a ρv of 0.20. The rigidity of the examined beams significantly decreases as the a/d ratio rises. In comparison to beam B-4, which has an a/d ratio of 3.0, beam B-5, which has an a/d ratio of 3.2, is less stiff.
5.3. Strain Response
The maximum bending moment in the middle of the span of the examined beams’ longitudinal steel strain revealed that the forms of tensile strain there are nearly uniform at all load levels. All of the tested beams failed before the longitudinal bars gave way. The tensile steel strain rose at an approximately constant rate. The longitudinal bars’ strain values were unaffected by the development of inclined diagonal shear cracks. The longitudinal bars of the tested RPC beams’ strain measurements are roughly identical for the same a/d ratio. Figure 4 compares the recorded strain in the stirrups’ vertical legs in the shear span of the examined beams. As can be seen, the stirrup legs’ tensile steel strain starts out very low and increases roughly at a consistent rate. Upon initiation of the diagonal shear crack, the strain rate accelerates and eventually reaches the yield level just prior to the imposed ultimate load. When the stirrup leg yields, the measured strain grows very quickly while the load being applied decreases. At the same time, the shear crack breadth increases rapidly till the concrete in the zone of shear is crushed. The measured strains of the examined beams at a similar load decreased for a similar a/d ratio after enlarging the stirrup’s diameter and decreasing the distance between stirrups.
5.4. Effect of Web Reinforcement Ratio
Table 4 and Figure 5 show the impact of the given vertical reinforcements in terms of the web ratio (ρv%) on the examined beams’ ultimate shear strength and the strength of diagonal cracks in terms of the distance between stirrups and the diameter of the stirrups’ bars. It is evident that while diagonal cracks formed more slowly with a smaller distance between stirrups (sv), they formed more quickly with a smaller diameter of the stirrup bars (dv). The growth of diagonal cracks was significantly slower for beam B-1, with a 100 mm stirrup spacing (sv), than it was for the comparable B-2 beam, with a 200 mm stirrup spacing (sv). The emergence of diagonal cracking occurred more slowly in beam B-4, with an 8 mm stirrup bar diameter and a 200 mm stirrup spacing (sv), than in beam B-2, with a 6 mm stirrup bar diameter and a 200 mm stirrup spacing (sv). As can be observed, decreasing the distance between stirrups had a greater inhibitory effect on the growth of diagonal cracks than increasing stirrup diameter. The given stirrup spacings (sv) for all the examined RPC beams are noticeably greater than the maximum stirrup spacing (sv,max) stipulated in the ACI code [34]. The RPC beams strengthened using the widest possible stirrup spacing, however, exhibited good overall performance.
For RPC beams with relatively low heights, the sv,max requirements of ACI 318-2014 are not practically appropriate and can be safely adjusted to 0.75d instead of 0.50d. Table 3 shows that for the beams with an identical a/d ratio, the ultimate shear strength improves marginally as the given vertical reinforcement of the web ratio (ρv%) rises. It should be noticed that, in accordance with ACI 318-2014, the given reinforcement of the web ratio (ρv%) for beams B-1, B-2, B-4, and B-5 is lower than the minimal web reinforcement ratio (ρv,min). Nevertheless, excellent general performance was seen for all of the examined RPC beams that were strengthened via reinforcement of the web ratios (ρv%) smaller than the minimal web reinforcement ratios (ρv,min) stipulated by the ACI code. This shows that when used with RPC beams with 2.0% steel fibers, the minimal vertical reinforcement of the web ratio specified by the ACI code can be properly lowered.
Stirrups play a critical role in reinforced concrete (RC) beams, including those made using reactive powder concrete (RPC). The configuration of stirrups significantly affects the performance of RPC beams in terms of shear strength, ductility, crack control, flexural capacity, construction considerations, and material optimization. Proper detailing and optimization of stirrups are essential for ensuring the structural integrity and longevity of RPC beams in various applications.
5.5. Analyzing the RPC Beam Test Results in Relation to the ACI 318-2014 Code’s Shear Requirements
The ACI 318-14 code’s shear design formulas were employed to determine the ultimate shear strength of the examined RPC beams. It must be mentioned that Table 2 compares the supplied web reinforcements (ρv) of the examined beams with the minimal demands of the ACI 318-14 code, while Table 4 gives a ratio between the estimated ultimate shear strength (Vu,cal) utilizing the ACI 318-14 code and the estimated experimental ultimate shear strength (Vu,exp). As can be observed, the average value for the evaluated beams’ Vu,cal to Vu,exp ratio according to the ACI 318-14 code is 0.403. This shows that despite every one of the examined beams having stirrups with a spacing (sv) significantly greater than the maximum stirrup spacing (sv,max) required by ACI 318-14, the measured readings of Vu,exp for all of the examined beams were significantly higher than those specified by the code. This demonstrates that the shear strength estimation formulae established by ACI 318-14 are not suitable for RPC beams as they do not account for the significant role that steel fibers play in providing resistance to shear stresses. It should be noted that, in accordance with ACI 318-14, steel fibers may be utilized as the beam’s reinforcement for shear if their normalized shear strength is more than 0.29 (for f′c ≤ MPa, d ≤ 600 mm). For all of the examined RPC beams with a fiber percent of 2.0%, the normalized shear strength values in Table 3 are significantly higher than 0.29, having an average value of 0.60.
5.6. Comparison of Test Results for RPC Beams with AFGC-2013 and KCI-2012 Design Recommendations
Two design suggestions have been put forth, with the first stemming from AFGC-2013 and the second from KCI-2012, to account for the role that steel fibers play in the construction of RPC structures. The ultimate shear strength of this study’s examined RPC beams was estimated using the shearing design techniques specified in KCI-2012 and AFGC-2013, and the results were contrasted with the experimental ultimate shearing strength shown in Table 5 and Table 6.
As can be observed, the average value for the examined beams’ Vu,exp and Vu,AFGC ratios is 1.280, while the average value for their Vu,exp and Vu,KCI ratios is 1.220. This shows that, when used for RPC beams equipped with shear reinforcement below the minimum requirement allowed by ACI 318-14, the KCI-2012 and AFGC-2013 forecasts for the ultimate shear strength are secure and cautious. When AFGC-2013 and KCI-2012 recommendations were compared for all of the examined beams, it was found that there were only very slight variations among the projections of the ultimate shear strength. In actuality, the tiny variation in the safety parameters taken into account by each methodology is what caused the small variance in the forecasts of the two recommendations. In accordance with the KCI-2012 recommendations, Table 5 demonstrates that the mean percent of the forecast contributions of the fibers of steel (Vfb) in comparison to the forecast ultimate shear strength of the examined beams (Vu,KCI) is roughly 59.2%, while the mean percent of the forecast contributions of the shear reinforcement (Vs) and concrete (Vc) is only 40.8%. According to the AFGC-2013 criteria, the mean proportion of Vfb to projected Vu,AFGC is roughly 58.3%, whereas the mean proportion of Vs to Vc is just 41.7%.
5.7. RPC Beam Analytical Modeling Utilizing Finite Element Software
The RPC was represented using a mesh of eight-node linear 3D-brick solid elements with reduced integration (C3D8R) based on their capability to simulate the physical behavior of RPC beams [48,49] with possible nonlinearities emanating from the plastic behavior of RPC under shear loading. Longitudinal and shear reinforcement bars were schematized with two-node linear 3D truss elements (T3D2). To avoid stress concentrations and simulate the experimental setup of shear tests, supports and loading points were provided with 50 mm × 100 mm × 150 mm steel plates, which were also schematized with C3D8R element types.
To simulate the four-point bending experimental setup [50], the model was constrained by roller and pin boundary conditions at the left and right supports, respectively (see Figure 6). Displacement boundary conditions were applied at the loading plates with respect to the required a/d ratio.
The tie constraint was used to define the contact interaction of the RPC beam with the four steel plates, while the embedded region interaction property was used for the steel reinforcing bar–RPC interaction, for both transverse and longitudinal reinforcements (see Figure 6). After a careful mesh convergence study and taking into account node compatibility, a mesh size of 25 mm was found to be adequate for the RPC matrix, steel plates, and longitudinal and transverse steel reinforcement bars.
Each example was created in accordance with the size and reinforcement details. The ABAQUS program’s documentation contains comprehensive information on FEM for steel reinforcement and concrete. As seen in Figure 7 for B-1, the tested beams’ FEM is visible in the corresponding figure. Nonlinear RPC and reinforcement constitutive models were introduced in this model. Poisson’s ratio was set to 0.30, and the steel’s elastic modulus (Es) was assumed to be 200 GPa. It was believed that the concrete and reinforcement would always stick together perfectly.
According to the results of this study’s experimental tests, the following proposed simple equation was used to determine the elasticity modulus (Ec) of RPC:
For the tested beams with a compressive strength (fcu) equal to 157 MPa, the normative value of Ec is equal to 48,929.5 MPa. The Poisson’s ratio is assumed to be equal to 0.20, and the tensile strength of RPC is considered to be 11 MPa.
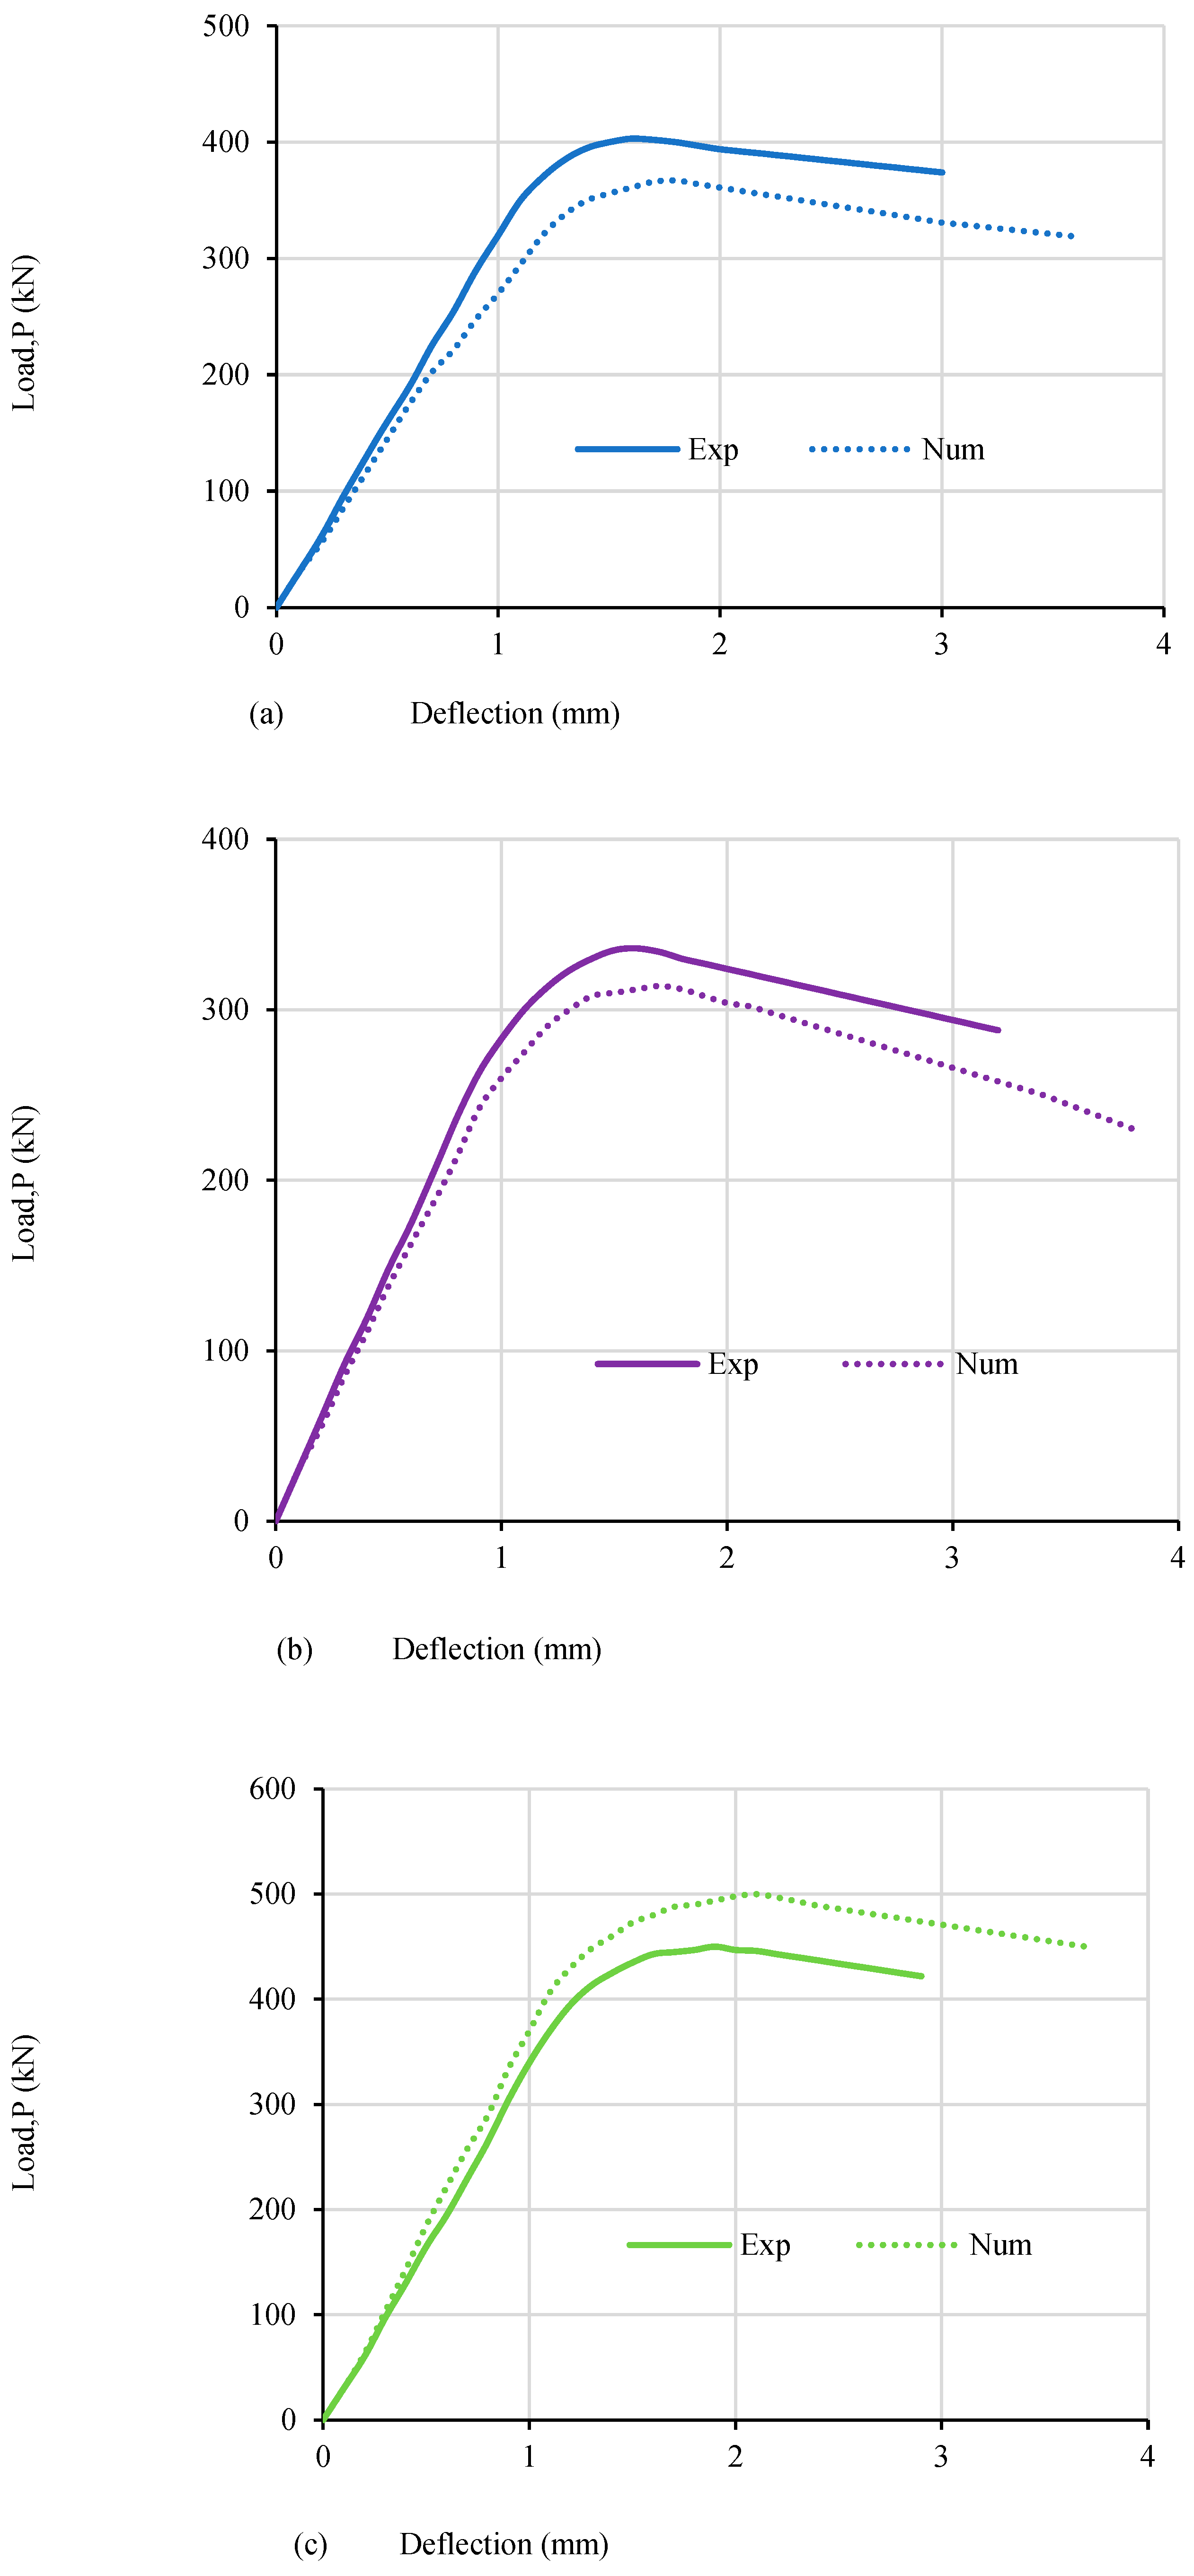
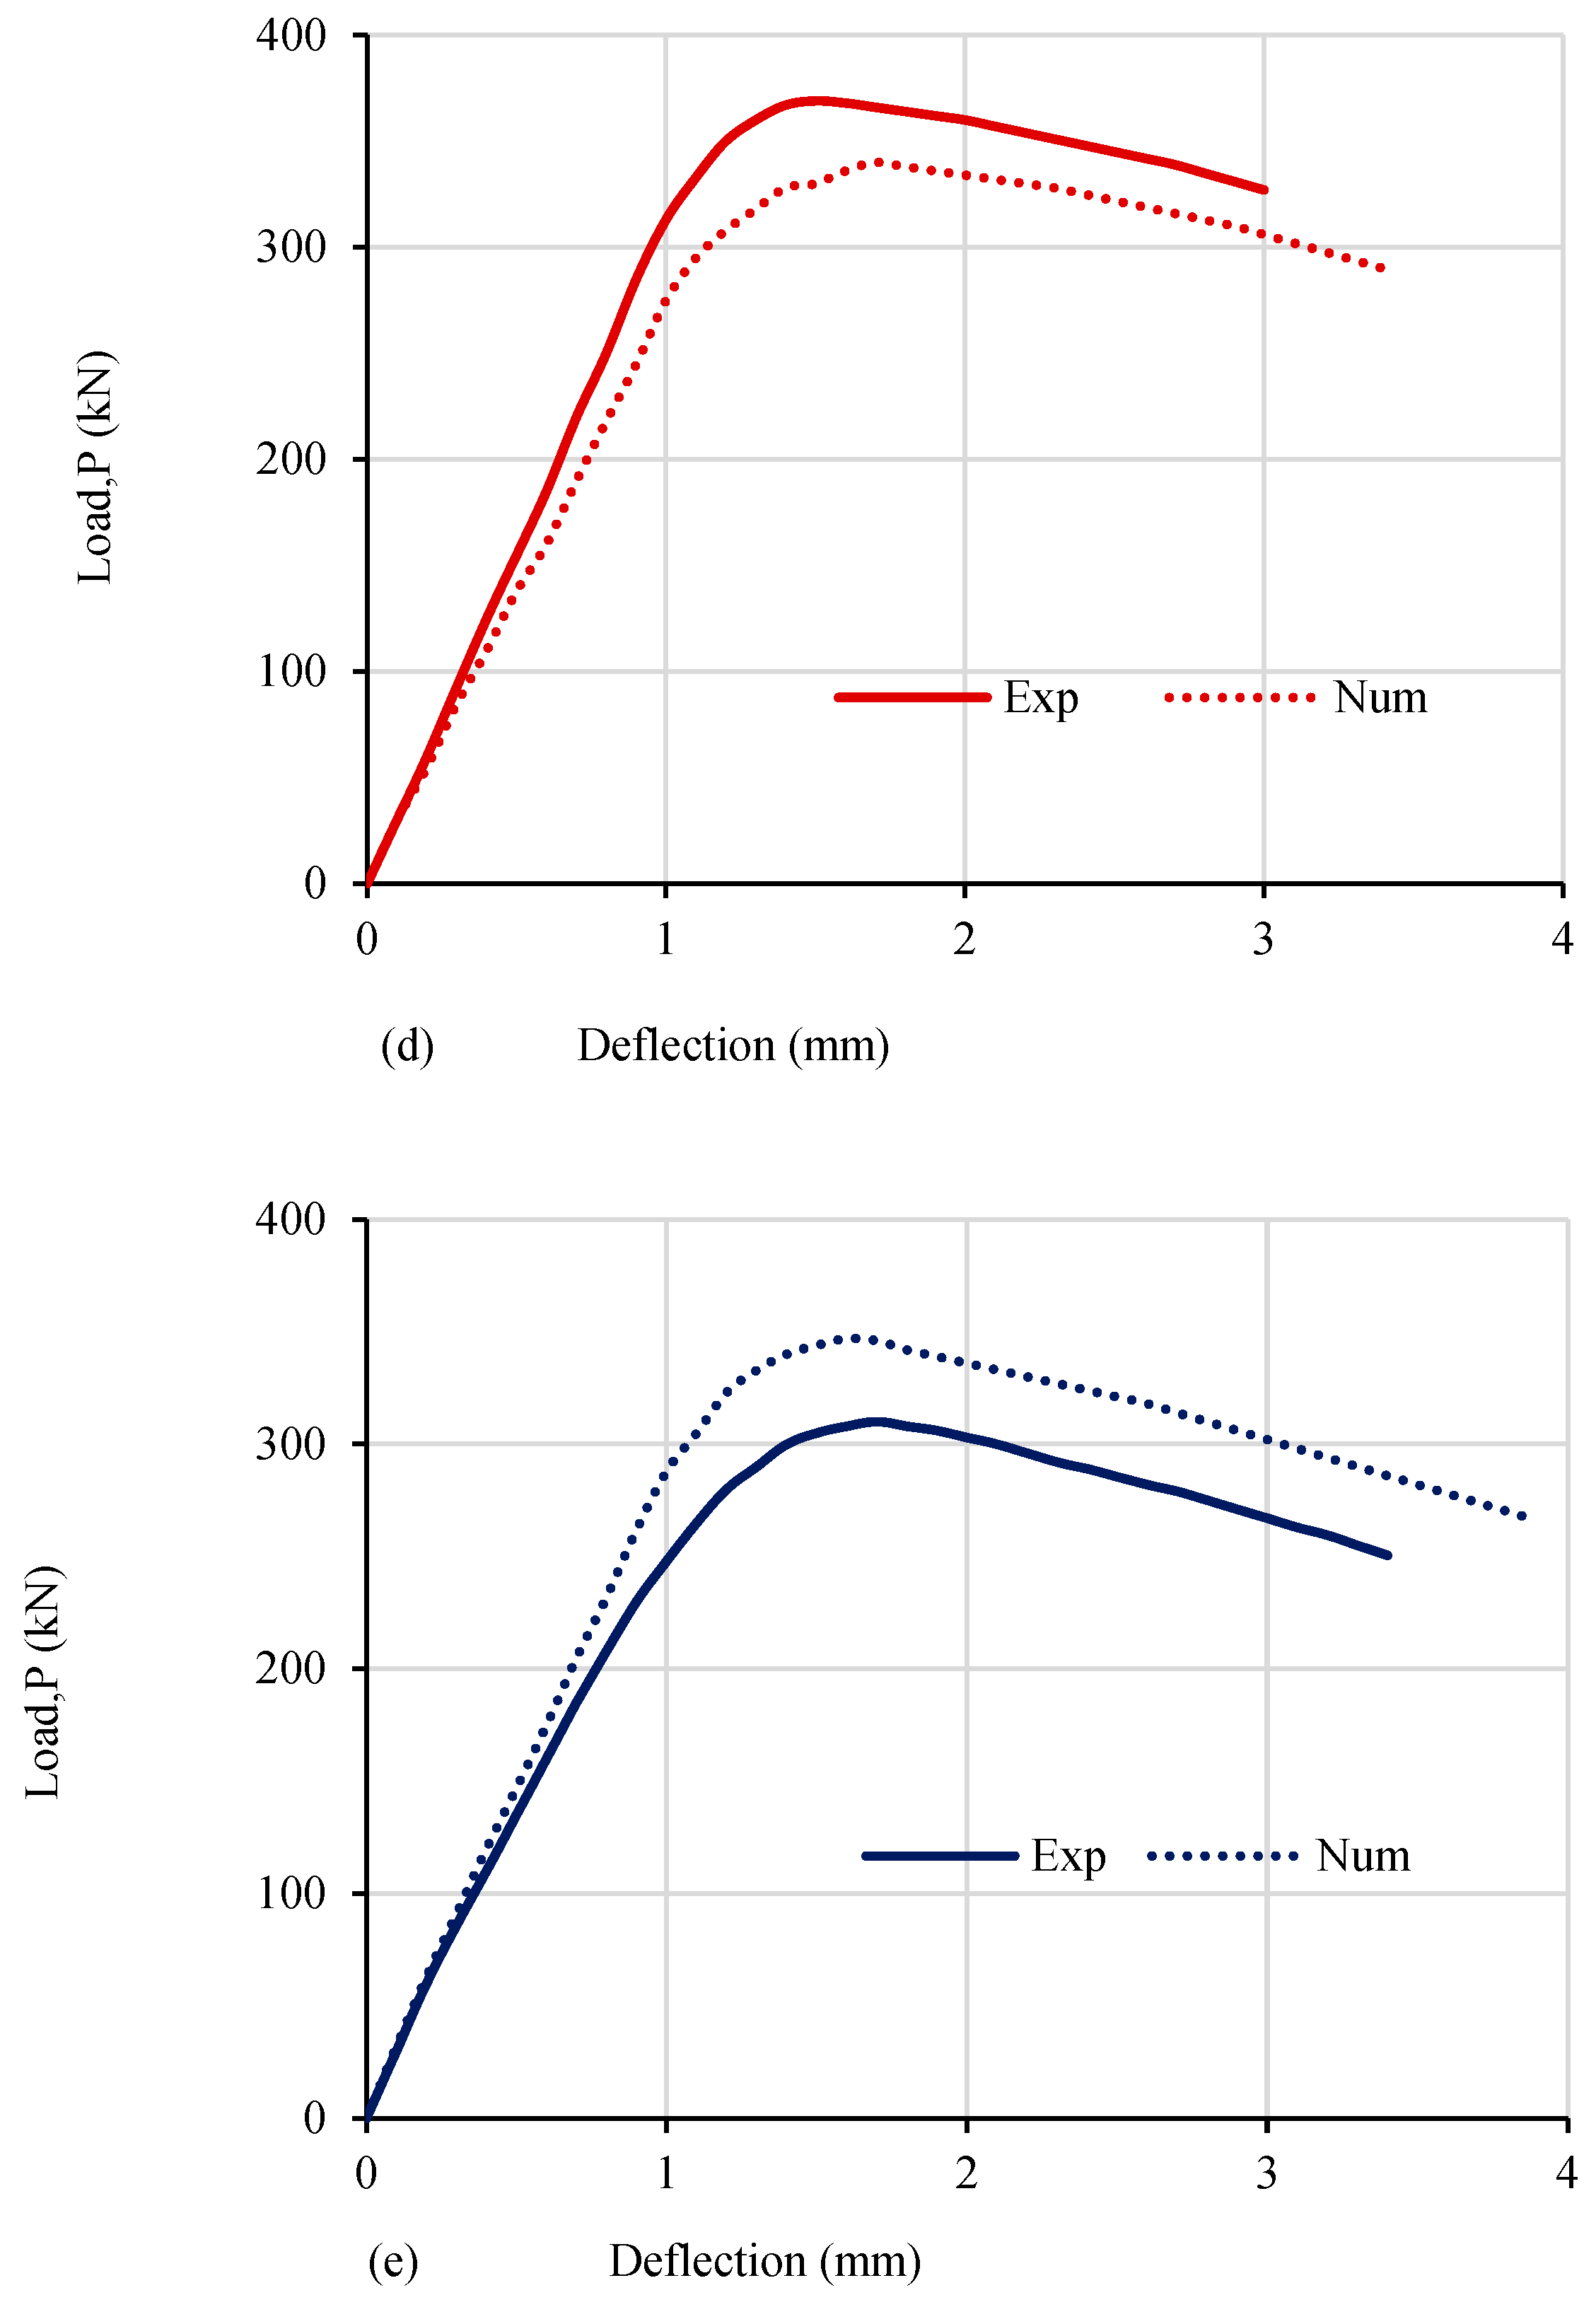
The acquired results were contrasted with the outcomes for the RPC beams examined in the current study in order to assess the precision of the nonlinear finite element model. Table 7 compares the ultimate load, the experimental crack load, and the projected results for the examined beams derived from the FEM. For RPC beams, the average proportion of Vcr,exp to Vcr,NUM is equivalent to 1.034, whereas the average proportion of Vu,exp to Vu,NUM is equivalent to 1.007. Additionally, the proportion of ∆cr,exp to ∆cr,NUM has a mean value of 0.92, while the proportion of ∆u,exp to ∆u,NUM has a mean value of 0.979. This demonstrates that for the examined RPC beams, the FEM model can accurately predict the ultimate shear load and the diagonal cracking load. Figure 8 displays a comparison of the empirical and numerical load–displacement curves for the examined beams. It can be observed that the load–displacement response of the examined RPC beams can be well predicted by the suggested nonlinear FEM.
6. Conclusions
The following conclusions can be drawn from this study’s findings regarding RPC slender beams under shear:
- i
- The offered shear reinforcement barely affects the maximum shear strength of the tested RPC beams with a volume content of 2.0% steel fibers. These steel fibers are crucial in helping RPC beams endure shear loads. Despite the fact that the examined RPC shallow beams’ vertical web reinforcement ratio was far below the smallest proportion specified by ACI 318-14, all of the examined RPC shallow beams displayed excellent performance in general.
- ii
- ACI 318-14’s shear strength calculation formulas significantly understate the shear strength of the examined RPC beams that have a minimal vertical web reinforcement ratio. As a result, these formulas are not suitable for RPC beams as they do not account for the significant role that steel fibers play in resisting shear stresses. For RPC beams with relatively low heights, the highest distance between stirrups (sv,max) specified according to the ACI 318-14 guidelines can safely be extended from 0.50 d to 0.75 d.
- iii
- In light of the predicted ultimate shear strengths of the examined beams, the design suggestions for RPC specified by KCI-2012 and AFGC-2013 are secure and restrained. The ultimate shearing strength forecasts made by KCI-2012 and AFGC-2013 are roughly equivalent (the mean proportion of the experimental ultimate shearing strength and the predicted ultimate shearing strength utilizing KCI-2012 and AFGC-2013 are approximately 1.462 and 1.446, respectively).
- iv
- According to the AFGC-2013 criteria, the mean proportion of Vfb to projected Vu,AFGC is roughly 58.3%, whereas the mean proportion of Vs to Vc is just 41.7%.
- v
- The deformation response and the ultimate shear strength of the examined RPC beams with vertical reinforcement of the web ratio much below the lowest value permitted by the code were reliably predicted by the suggested FEM when steel fibers were taken into account.
Author Contributions
Conceptualization, H.K.S. and G.F.H.; methodology, H.K.S.; software, H.K.S.; validation, H.K.S. and G.F.H.; formal analysis, H.K.S.; investigation, G.F.H.; resources, H.K.S.; data curation, H.K.S.; writing—original draft preparation, H.K.S.; writing—review and editing, G.F.H.; visualization, H.K.S.; supervision, G.F.H.; project administration, H.K.S.; funding acquisition, G.F.H. All authors have read and agreed to the published version of the manuscript.
Funding
This research received no external funding.
Institutional Review Board Statement
Not applicable.
Informed Consent Statement
Not applicable.
Data Availability Statement
The original contributions presented in the study are included in the article, further inquiries can be directed to the corresponding author.
Acknowledgments
The authors gratefully acknowledge the financial support for this research by Guangzhou Institute of Energy Conversion, Chinese Academy of Sciences.
Conflicts of Interest
The authors declare no conflicts of interest.
References
- Hou, X.M.; Cao, S.J.; Rong, Q.; Zheng, W.Z.; Li, G. Effects of steel fiber and strain rate on the dynamic compressive stress-strain relationship in reactive powder concrete. Constr. Build. Mater. J. 2018, 170, 570–581. [Google Scholar] [CrossRef]
- Shen, L.; Ding, M.; Chen, K.; Feng, C.; Yang, B.; Elchalakani, M. The mechanical behavior of RPC under combined shear and compressive loads. Cem. Concr. Compos. 2021, 121, 104071. [Google Scholar] [CrossRef]
- Hiremath, P.N.; Yaragal, S.C. Performance evaluation of reactive powder concrete with polypropylene fibers at elevated temperatures. Constr. Build. Mater. J. 2018, 169, 499–512. [Google Scholar] [CrossRef]
- Abid, M.; Hou, X.; Zheng, W.; Hussain, R.R. High temperature and residual properties of reactive powder concrete—A review. Constr. Build. Mater. J. 2017, 147, 339–351. [Google Scholar] [CrossRef]
- Wang, Z.; Wang, J.Q.; Tang, Y.C.; Liu, T.X.; Gao, Y.F.; Zhang, J. Seismic behavior of precast segmental UHPC bridge columns with replaceable external cover plates and internal dissipaters. Eng. Struct. 2018, 177, 540–555. [Google Scholar] [CrossRef]
- Paschalis, S.A.; Lampropoulos, A.P. Ultra-high-performance fiber reinforced concrete under cyclic loading. ACI Mater. J. 2016, 113, 419–427. [Google Scholar] [CrossRef]
- Xu, S.C.; Wu, C.Q.; Liu, Z.X.; Han, K.P.; Su, Y.; Zhao, J.; Li, J.C. Experimental investigation of seismic behavior of ultra-high performance steel fiber reinforced concrete columns. Eng. Struct. 2017, 152, 129–148. [Google Scholar] [CrossRef]
- Yu, R.; Spiesz, P.; Brouwers, H.J.H. Energy absorption capacity of a sustainable Ultra-High Performance Fibre Reinforced Concrete (UHPFRC) in quasi-static mode and under high velocity projectile impact. Cement Concr. Compos. 2016, 68, 109–122. [Google Scholar] [CrossRef]
- ACI Committee 363; Ultra-High Performance Concrete, A State-of-the-Art Report for the Bridge Community, Publication No. FHWA-HRT-13-060. Federal Highway Administration: Washington, DC, USA, 2013; pp. 13–44.
- Ji, W.Y.; Li, W.W.; An, M.Z.; Zhu, L. Shear capacity of T-section girders made of reactive powder concrete. J. Bridge Eng. 2018, 23, 04018041. [Google Scholar] [CrossRef]
- Zinkaah, O.H.; Sultan, H.K.; Al-Rifaie, A.; Alridha, Z. Influence of Strut Geometry on the Size Effect of FRP Reinforced Simply Supported Deep Beams: A Theoretical Analysis. Math. Model. Eng. Probl. 2022, 9, 411–417. [Google Scholar] [CrossRef]
- Zheng, H.; Fang, Z.; Chen, B. Experimental study on shear behavior of prestressed reactive powder concrete I-girders. Front. Struct. Civ. Eng. 2019, 13, 618–627. [Google Scholar] [CrossRef]
- Kaufmann, W.; Amin, A.; Beck, A.; Lee, M. Shear transfer across cracks in steel fibre reinforced concrete. Eng. Struct. 2019, 186, 508–524. [Google Scholar] [CrossRef]
- Sultan, H.K.; Alyaseri, I. Effects of elevated temperatures on mechanical properties of reactive powder concrete elements. Constr. Build. Mater. 2020, 261, 120555. [Google Scholar] [CrossRef]
- Sultan, H.K.; Zinkaah, O.H.; Rasheed, A.A.; Alridha, Z.; Alhawat, M. Producing Sustainable Modified Reactive Powder Concrete Using Locally Available Materials. Innov. Infrastruct. Solut. 2022, 7, 342. [Google Scholar] [CrossRef]
- Lantsoght, E.O.L. How do steel fibers improve the shear capacity of reinforced concrete beams without stirrups? Compos. B Eng. 2019, 175, 107079. [Google Scholar] [CrossRef]
- Biswas, R.K.; Bin Ahmed, F.; Haque, M.E.; Provasha, A.A.; Hasan, Z.; Hayat, F.; Sen, D. Effects of steel fiber percentage and aspect ratios on fresh and harden properties of ultra-high performance fiber reinforced concrete. Appl. Mech. 2021, 2, 501–515. [Google Scholar] [CrossRef]
- He, J.; Chen, W.; Zhang, B.; YU, J.; Liu, H. The mechanical properties and damage evolution of UHPC Reinforced with glass fibers and high-performance polypropylene fibers. Materials 2021, 14, 2455. [Google Scholar] [CrossRef] [PubMed]
- Yoo, D.Y.; Yang, J.M. Effects of stirrup, steel fiber, and beam size on shear behavior of high-strength concrete beams. Cement Concr. Compos. 2018, 87, 137–148. [Google Scholar] [CrossRef]
- Głodkowska, W.; Ziarkiewicz, M. Cracking behavior of steel fiber reinforced waste sand concrete beams in flexure-experimental investigation and theoretical analysis. Eng. Struct. 2018, 176, 1–10. [Google Scholar] [CrossRef]
- Wille, K.; Naaman, A.E.; Parra-Montesions, G.J. Ultra-High-Performance Concrete with Compressive Strength Exceeding 150 MPa (22 ksi), A simpler Way. ACI Mater. J. 2011, 108, 46–54. [Google Scholar]
- Sultan, H.K. Designing reinforced HSC rectangular beams using optimization techniques. Pollack Period. J. 2023, 18, 20–25. [Google Scholar] [CrossRef]
- Wang, C.; Xiao, J.; Liu, W.; Ma, Z. Unloading and reloading stress-strain relationship of recycled aggregate concrete reinforced with steel/polypropylene fibers under uniaxial low-cycle loadings. Cem. Concr. Compos. 2022, 131, 104597. [Google Scholar] [CrossRef]
- Wang, C.; Wu, H.; Li, C. Hysteresis and damping properties of steel and polypropylene fiber reinforced recycled aggregate concrete under uniaxial low-cycle loadings. Constr. Build. Mater. 2022, 319, 126191. [Google Scholar] [CrossRef]
- Samadi, M.; Baghban, M.H.; Kubba, Z.; Faridmehr, I.; Abdul Shukor Lim, N.H.; Benjeddou, O.; Huseien, G.F. Flexural behavior of reinforced concrete beams under instantaneous loading: Effects of recycled ceramic as cement and aggregates replacement. Buildings 2022, 12, 439. [Google Scholar] [CrossRef]
- Wang, C.; Wu, H.; Li, C. Hysteretic deteriorating behaviors of fiber-reinforced recycled aggregate concrete composites subjected to cyclic compressive loadings. J. Build. Eng. 2022, 49, 104087. [Google Scholar] [CrossRef]
- Sultan, H.K. Hysteresis Damping Ratio for Moment Steel Frame Evaluation Using DDBD. Pollack Period. J. 2024, 19, 33–40. [Google Scholar] [CrossRef]
- Sultan, H.K.; Mohammed, A.T. Assessing of the common strengthening methods for existing RC buildings. Pollack Period. J. 2023, 18, 6–11. [Google Scholar] [CrossRef]
- Yahy Al-Radi, H.H.; Dejian, S.; Sultan, H.K. Performance of Fiber Self-Compacting Concrete at High Temperatures. Civ. Eng. J. 2021, 7, 2083–2098. [Google Scholar] [CrossRef]
- Sultan, H.K.; Mohammed, A.T.; Qasim, O.D.; Maula, B.H.; Aziz, H.Y. Ductility Factor Evaluation of Concrete Moment Frame Retrofitted by FRP Subjected to Seismic Loads. Int. Rev. Civ. Eng. (IRECE) 2020, 11, 275–282. [Google Scholar] [CrossRef]
- Qasim, O.A.; Sultan, H.K. Experimental Investigation of Effect of Steel Fiber on Concrete Construction Joints of Prism. IOP Conf. Ser. Mater. Sci. Eng. 2020, 745, 012170. [Google Scholar] [CrossRef]
- Voo, Y.; Poon, W.K.; Foster, S.J. Shear strength of steel fiber-reinforced ultrahigh-performance concrete beams without stirrups. J. Struct. Eng. 2010, 136, 1393–1400. [Google Scholar] [CrossRef]
- Aziz, O.Q.; Hasan, M.; Ali, H. Shear Strength and Behavior of Ultra-High Performance Fiber Reinforced Concrete (UHPC) Deep Beams without Web Reinforcement. Int. J. Civ. Eng. (IJCE) 2013, 2, 85–96. [Google Scholar]
- Baby, F.; Marchand, P.; Toutlemonde, F. Shear Behavior of Ultra-High Performance Fiber-Reinforced Concrete Beams, I: Experimental investigation. J. Struct. Eng. 2014, 140, 04013111. [Google Scholar] [CrossRef]
- Lim, W.-Y.; Hong, S.-G. Shear Test for Ultra-High Performance Fiber Reinforced concrete (UHPFRC) Beams with shear reinforcement. Int. J. Concr. Struct. Mater. 2016, 10, 177–188. [Google Scholar] [CrossRef]
- Qi, J.; Ma, Z.J.; Wang, J. Shear Strength of UHPFRC Beams: Mesoscale Fiber Matrix Discrete Model. J. Struct. Eng. 2016, 143, 1–10. [Google Scholar] [CrossRef]
- European Committee for Standardization. Eurocode 2: Design of Concrete Structures—Part 1; European Committee for Standardization: Brussels, Belgium, 2004. [Google Scholar]
- ACI Committee 318; Building Code Requirements for Structural Concrete (ACI 318-14) and Commentary (ACI 318R-14). American Concrete Institute: Farmington Hills, MI, USA, 2014.
- Association Francaise du Genil Civil (AFGC). Ultra-High Performance Fiber Reinforced Concrete; AFGC: Paris, France, 2002. [Google Scholar]
- Association Francaise du Genil Civil (AFGC). Ultra-High Performance Fiber Reinforced Concrete; AFGC: Paris, France, 2013. [Google Scholar]
- Japan Society of Civil Engineers (JSCE). Recommendations for Design and Construction of Ultra-High-Strength Fiber Reinforced Concrete Structures; Concrete Engineering Series; Japan Society of Civil Engineers: Tokyo, Japan, 2008. [Google Scholar]
- Korea Concrete Institute. Design Recommendations for Ultra High Performance Concrete (K-UHPC), KCI-M-12-003; Korea Concrete Institute: Seoul, Republic of Korea, 2012. [Google Scholar]
- ASTM C109/C109M-20b; Standard Test Method for Compressive Strength of Hydraulic Cement Mortars (Using 2-in. or [50 mm] Cube Specimens). ASTM International: West Conshohocken, PA, USA, 2020.
- ASTM C496; Standard Test Method for Splitting Tensile Strength of Cylindrical Concrete Specimens. American Society for Testing and Materials Standard Practice C496. ASTM International: West Conshohocken, PA, USA, 2017.
- ASTM C78; Standard Test Method for Flexural Strength of Concrete (Using Simple Beam with Center Point Loading). ASTM International: West Conshohocken, PA, USA, 2010.
- ABAQUS: Abaqus Analysis User’s Manual, Version 6.9; Dassault Systems Corp.: Providence, RI, USA, 2009.
- Katsamakas, A.A.; Papanikolaou, V.K.; Thermou, G.E. Tree-dimensional numerical modeling of RC beam strengthened in shear with steel reinforced grout (SRG). In Proceedings of the 1st Fib Italy YMG Symposium on Concrete and Concrete Structures, Krakow, Poland, 27–29 May 2019; pp. 64–71. [Google Scholar]
- Ombres, L.; Verre, S. Shear strengthening of reinforced concrete beams with SRG (Steel Reinforced Grout) composites: Experimental investigation and modeling. J. Build. Eng. 2021, 42, 103047. [Google Scholar] [CrossRef]
- Bahij, S.; Adekunle, S.K.; Al-Osta, M.; Ahmad, S.; Al-Dulaijan, S.U.; Rahman, M.K. Numerical investigation of the shear behavior of reinforced ultra-high-performance concrete beams. Struct Concr. 2018, 19, 305–317. [Google Scholar] [CrossRef]
- Ahmad, S.; Bahij, S.; Al-Osta, M.; Adekunle, S.K.; Al-Dulaijan, S.U. Shear behavior of ultra-high-performance concrete beams reinforced with high-strength steel bars. ACI Struct. J. 2019, 116, 3–14. [Google Scholar] [CrossRef]
Figure 1.
Details of the reinforcement employed in the RPC beam samples (depending on a/d ratio 3 or 3.2 the a: 465 or 496 mm; c: 758 or 820 mm; d: 155 mm).
Figure 1.
Details of the reinforcement employed in the RPC beam samples (depending on a/d ratio 3 or 3.2 the a: 465 or 496 mm; c: 758 or 820 mm; d: 155 mm).

Figure 2.
Images of the tested beams’ shear cracks.
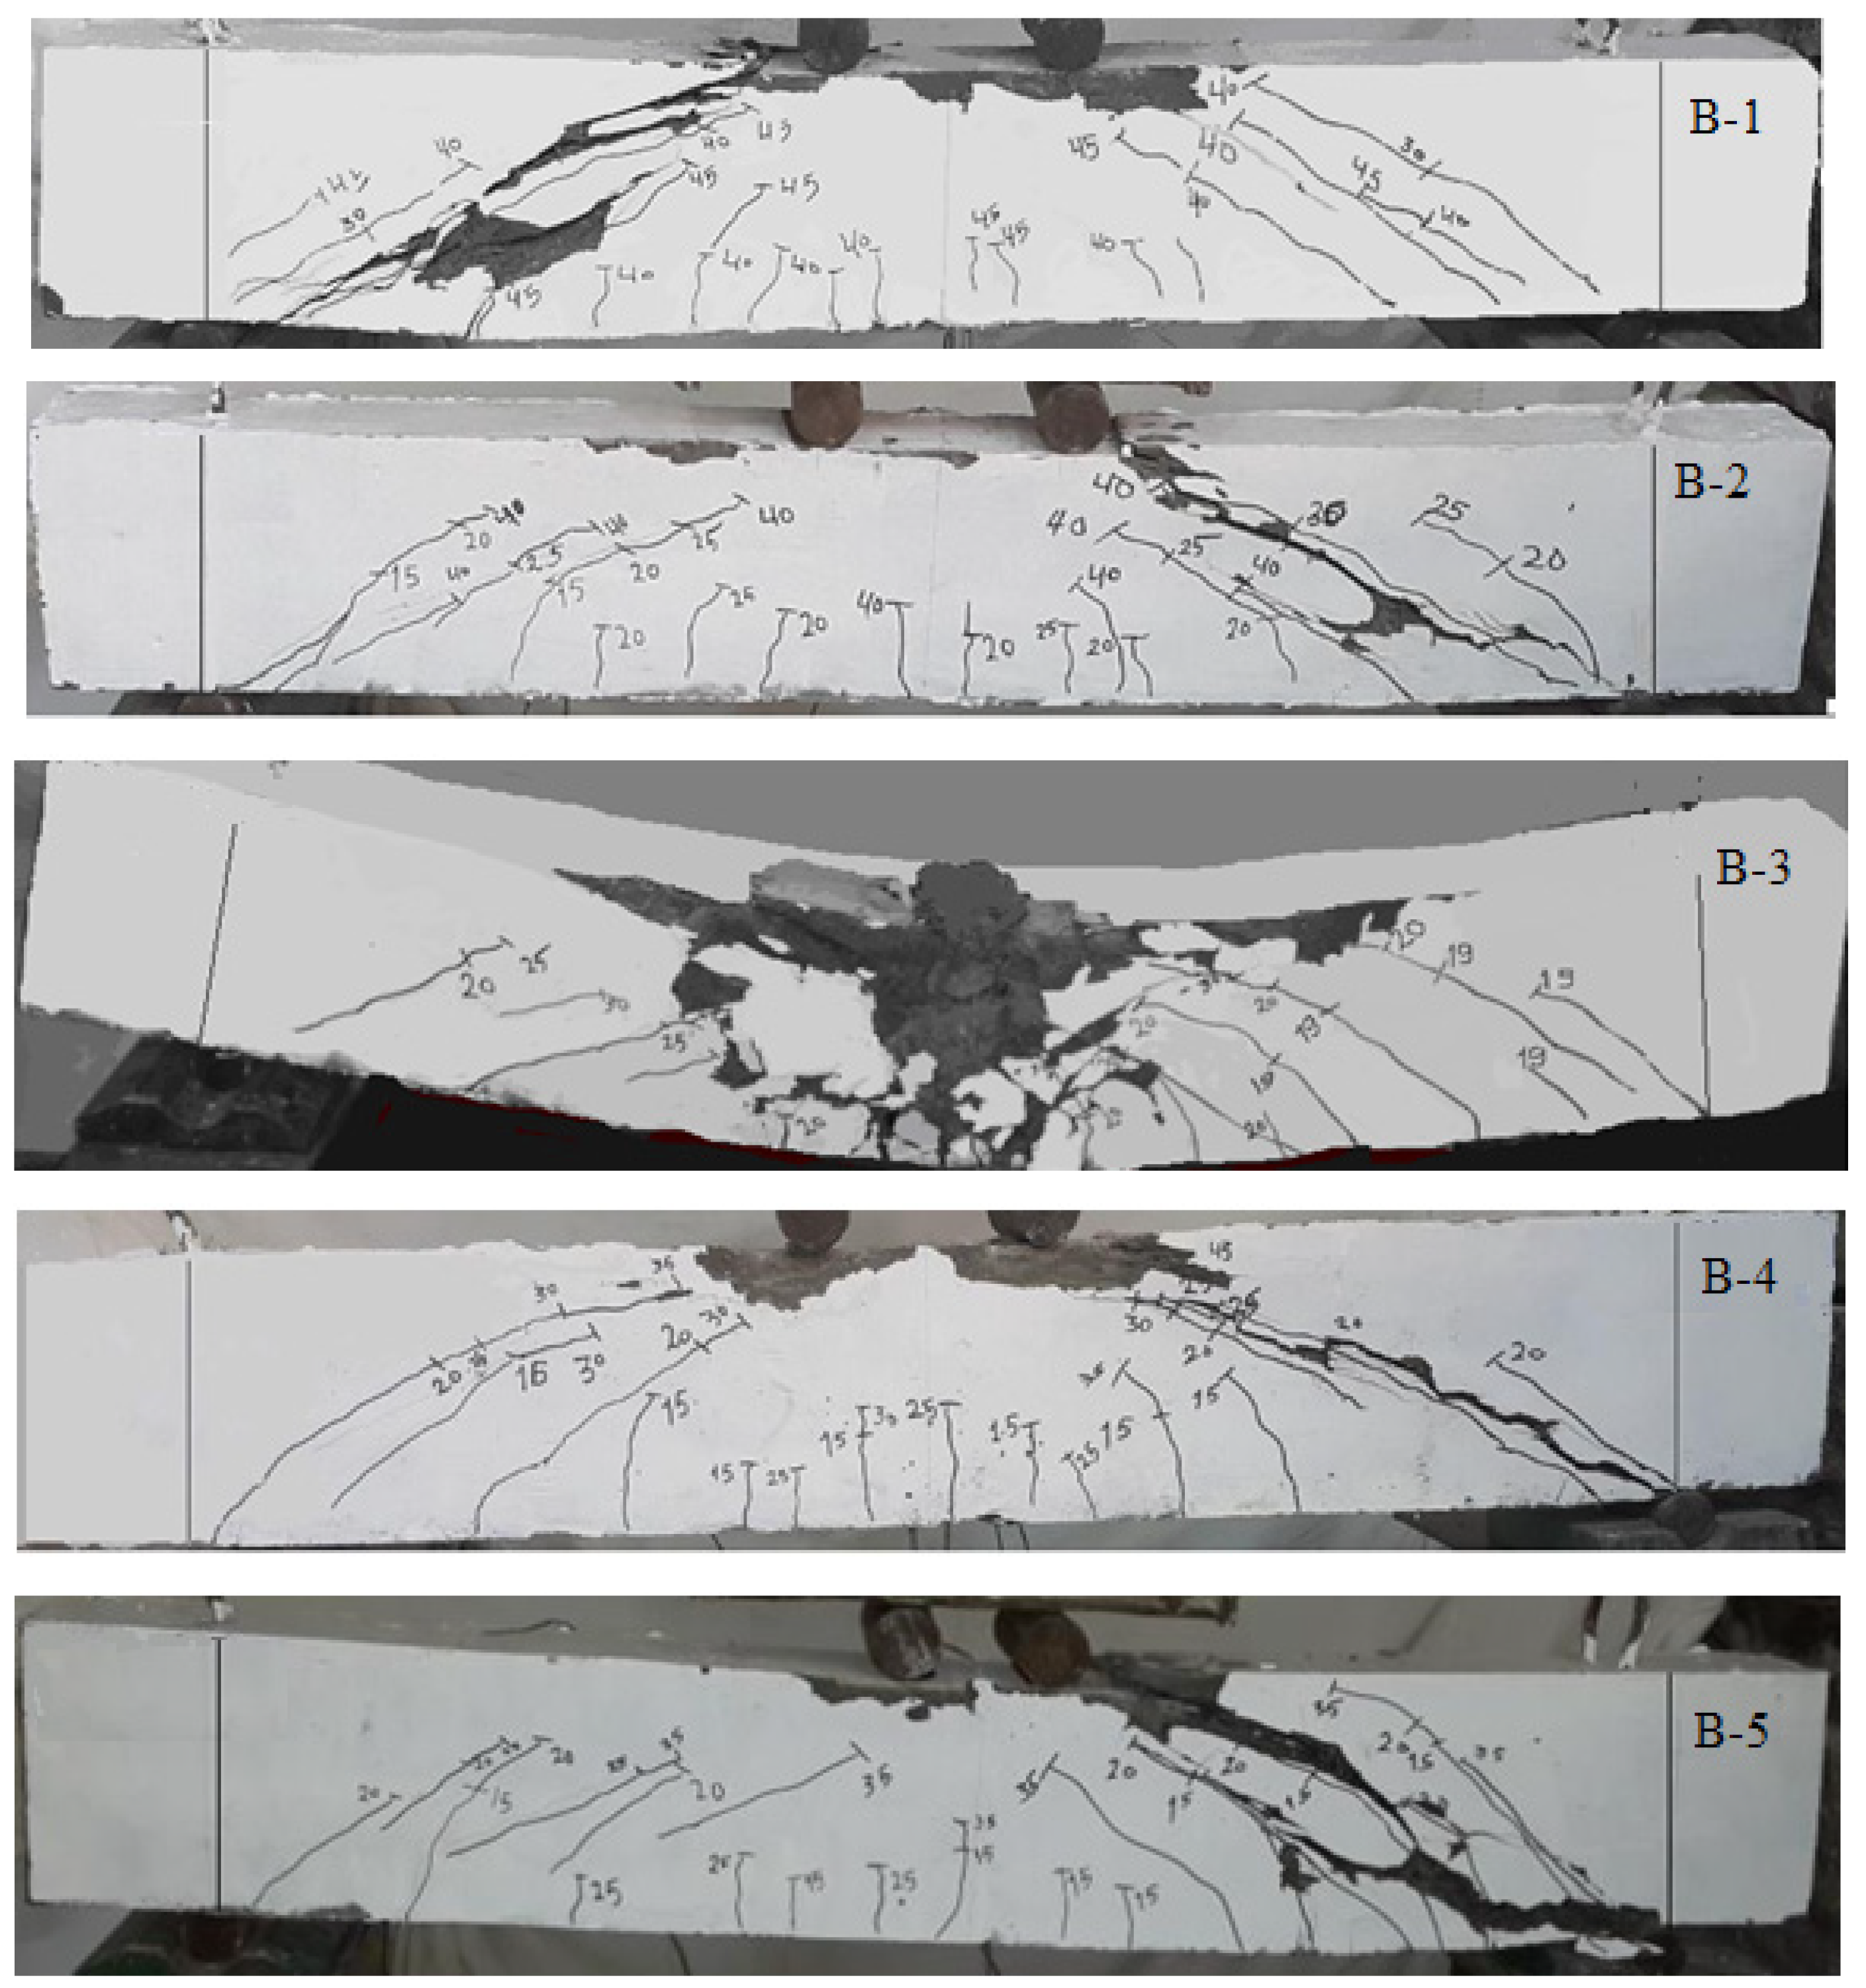
Figure 3.
Mid-span load–deflection relationships for the shear-tested beams.
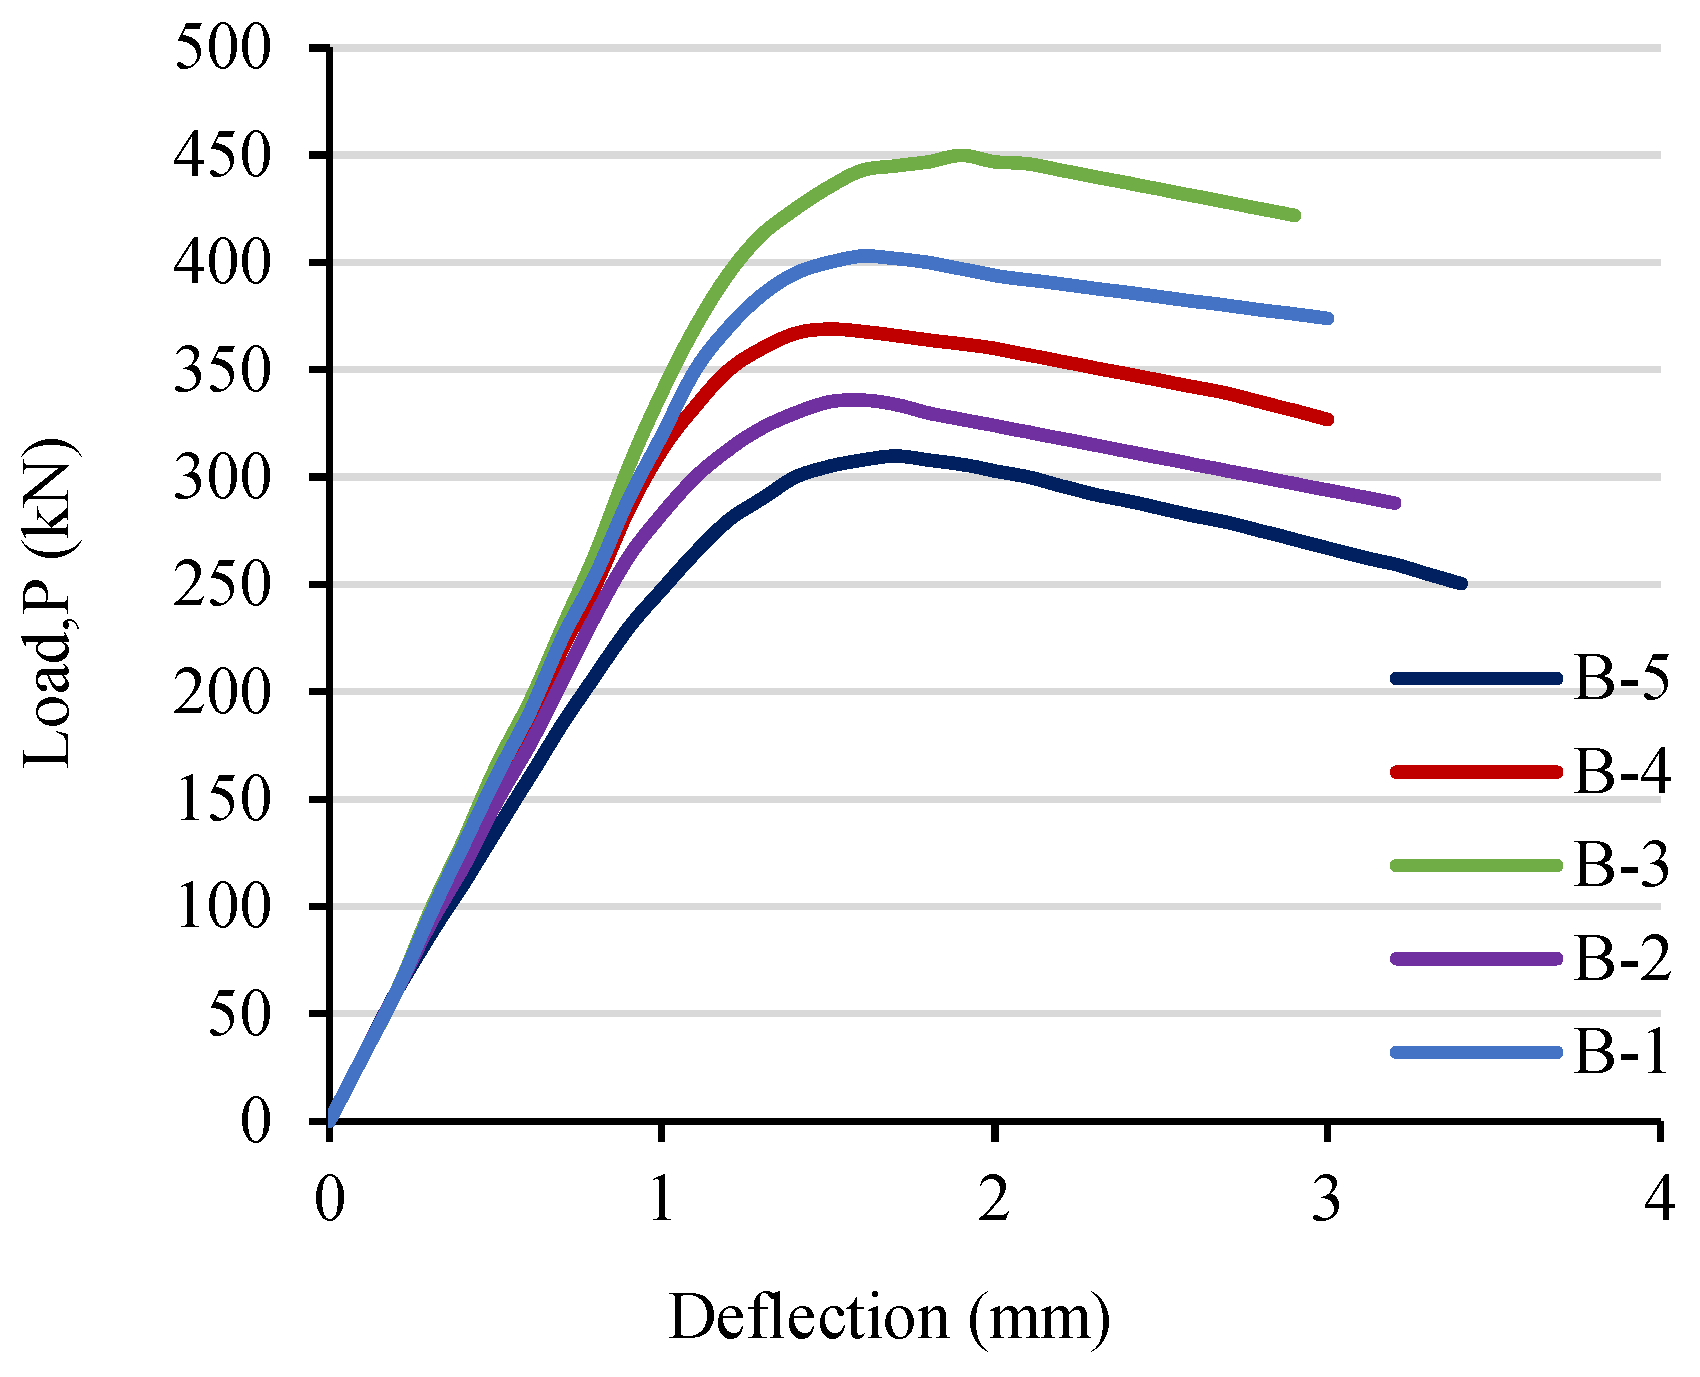
Figure 4.
Relationship between the examined beams’ total load and strain in the stirrups’ vertical legs.
Figure 4.
Relationship between the examined beams’ total load and strain in the stirrups’ vertical legs.
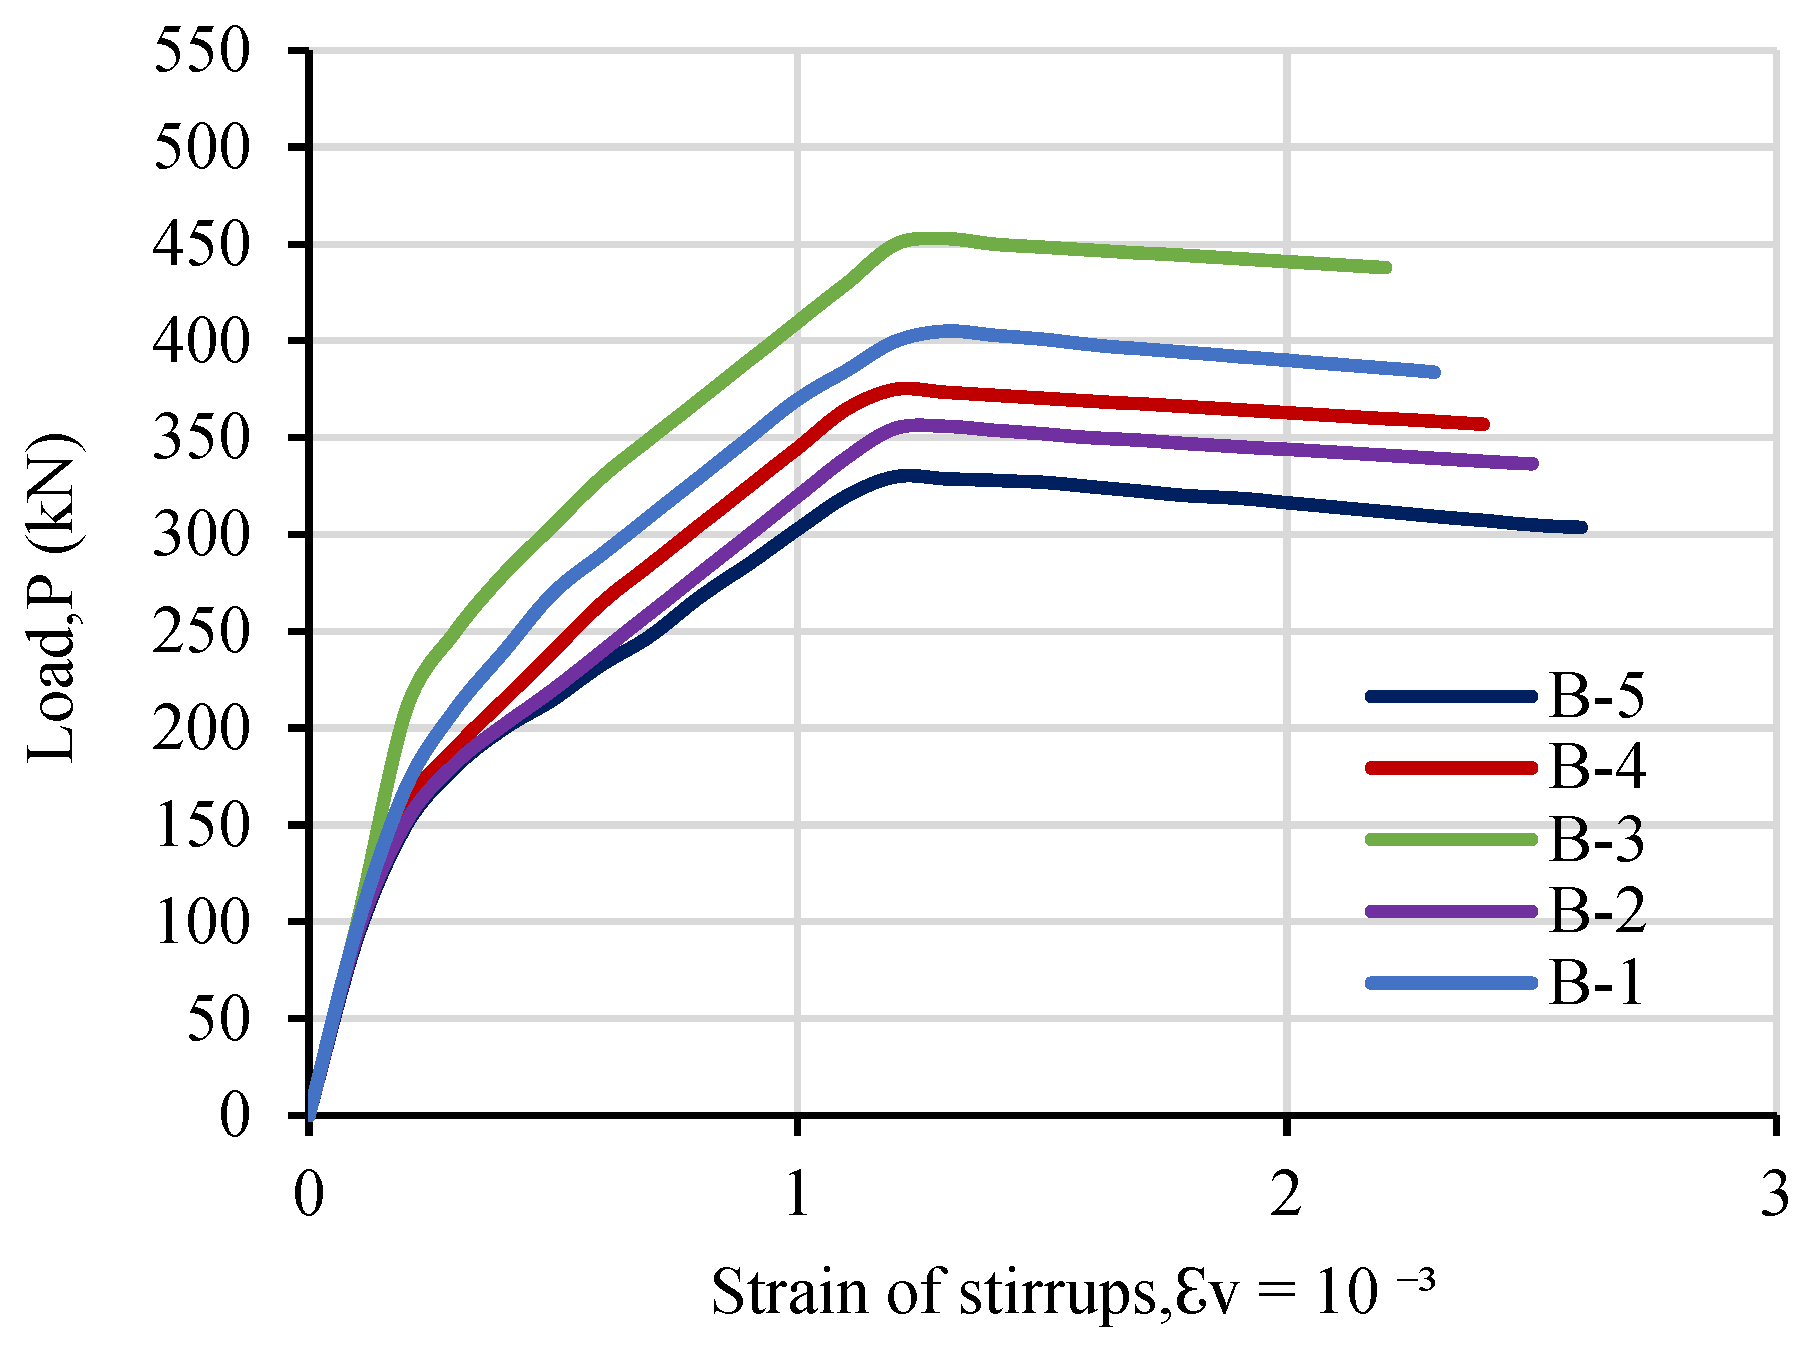
Figure 5.
Development of diagonal cracks in RPC beams with various a/d ratios.

Figure 6.
(a) A wire-frame model reinforcement cage profile showing longitudinal and transverse reinforcements and (b) a shaded model showing the loading and boundary condition profile with the load applied taken to be P/2.
Figure 6.
(a) A wire-frame model reinforcement cage profile showing longitudinal and transverse reinforcements and (b) a shaded model showing the loading and boundary condition profile with the load applied taken to be P/2.
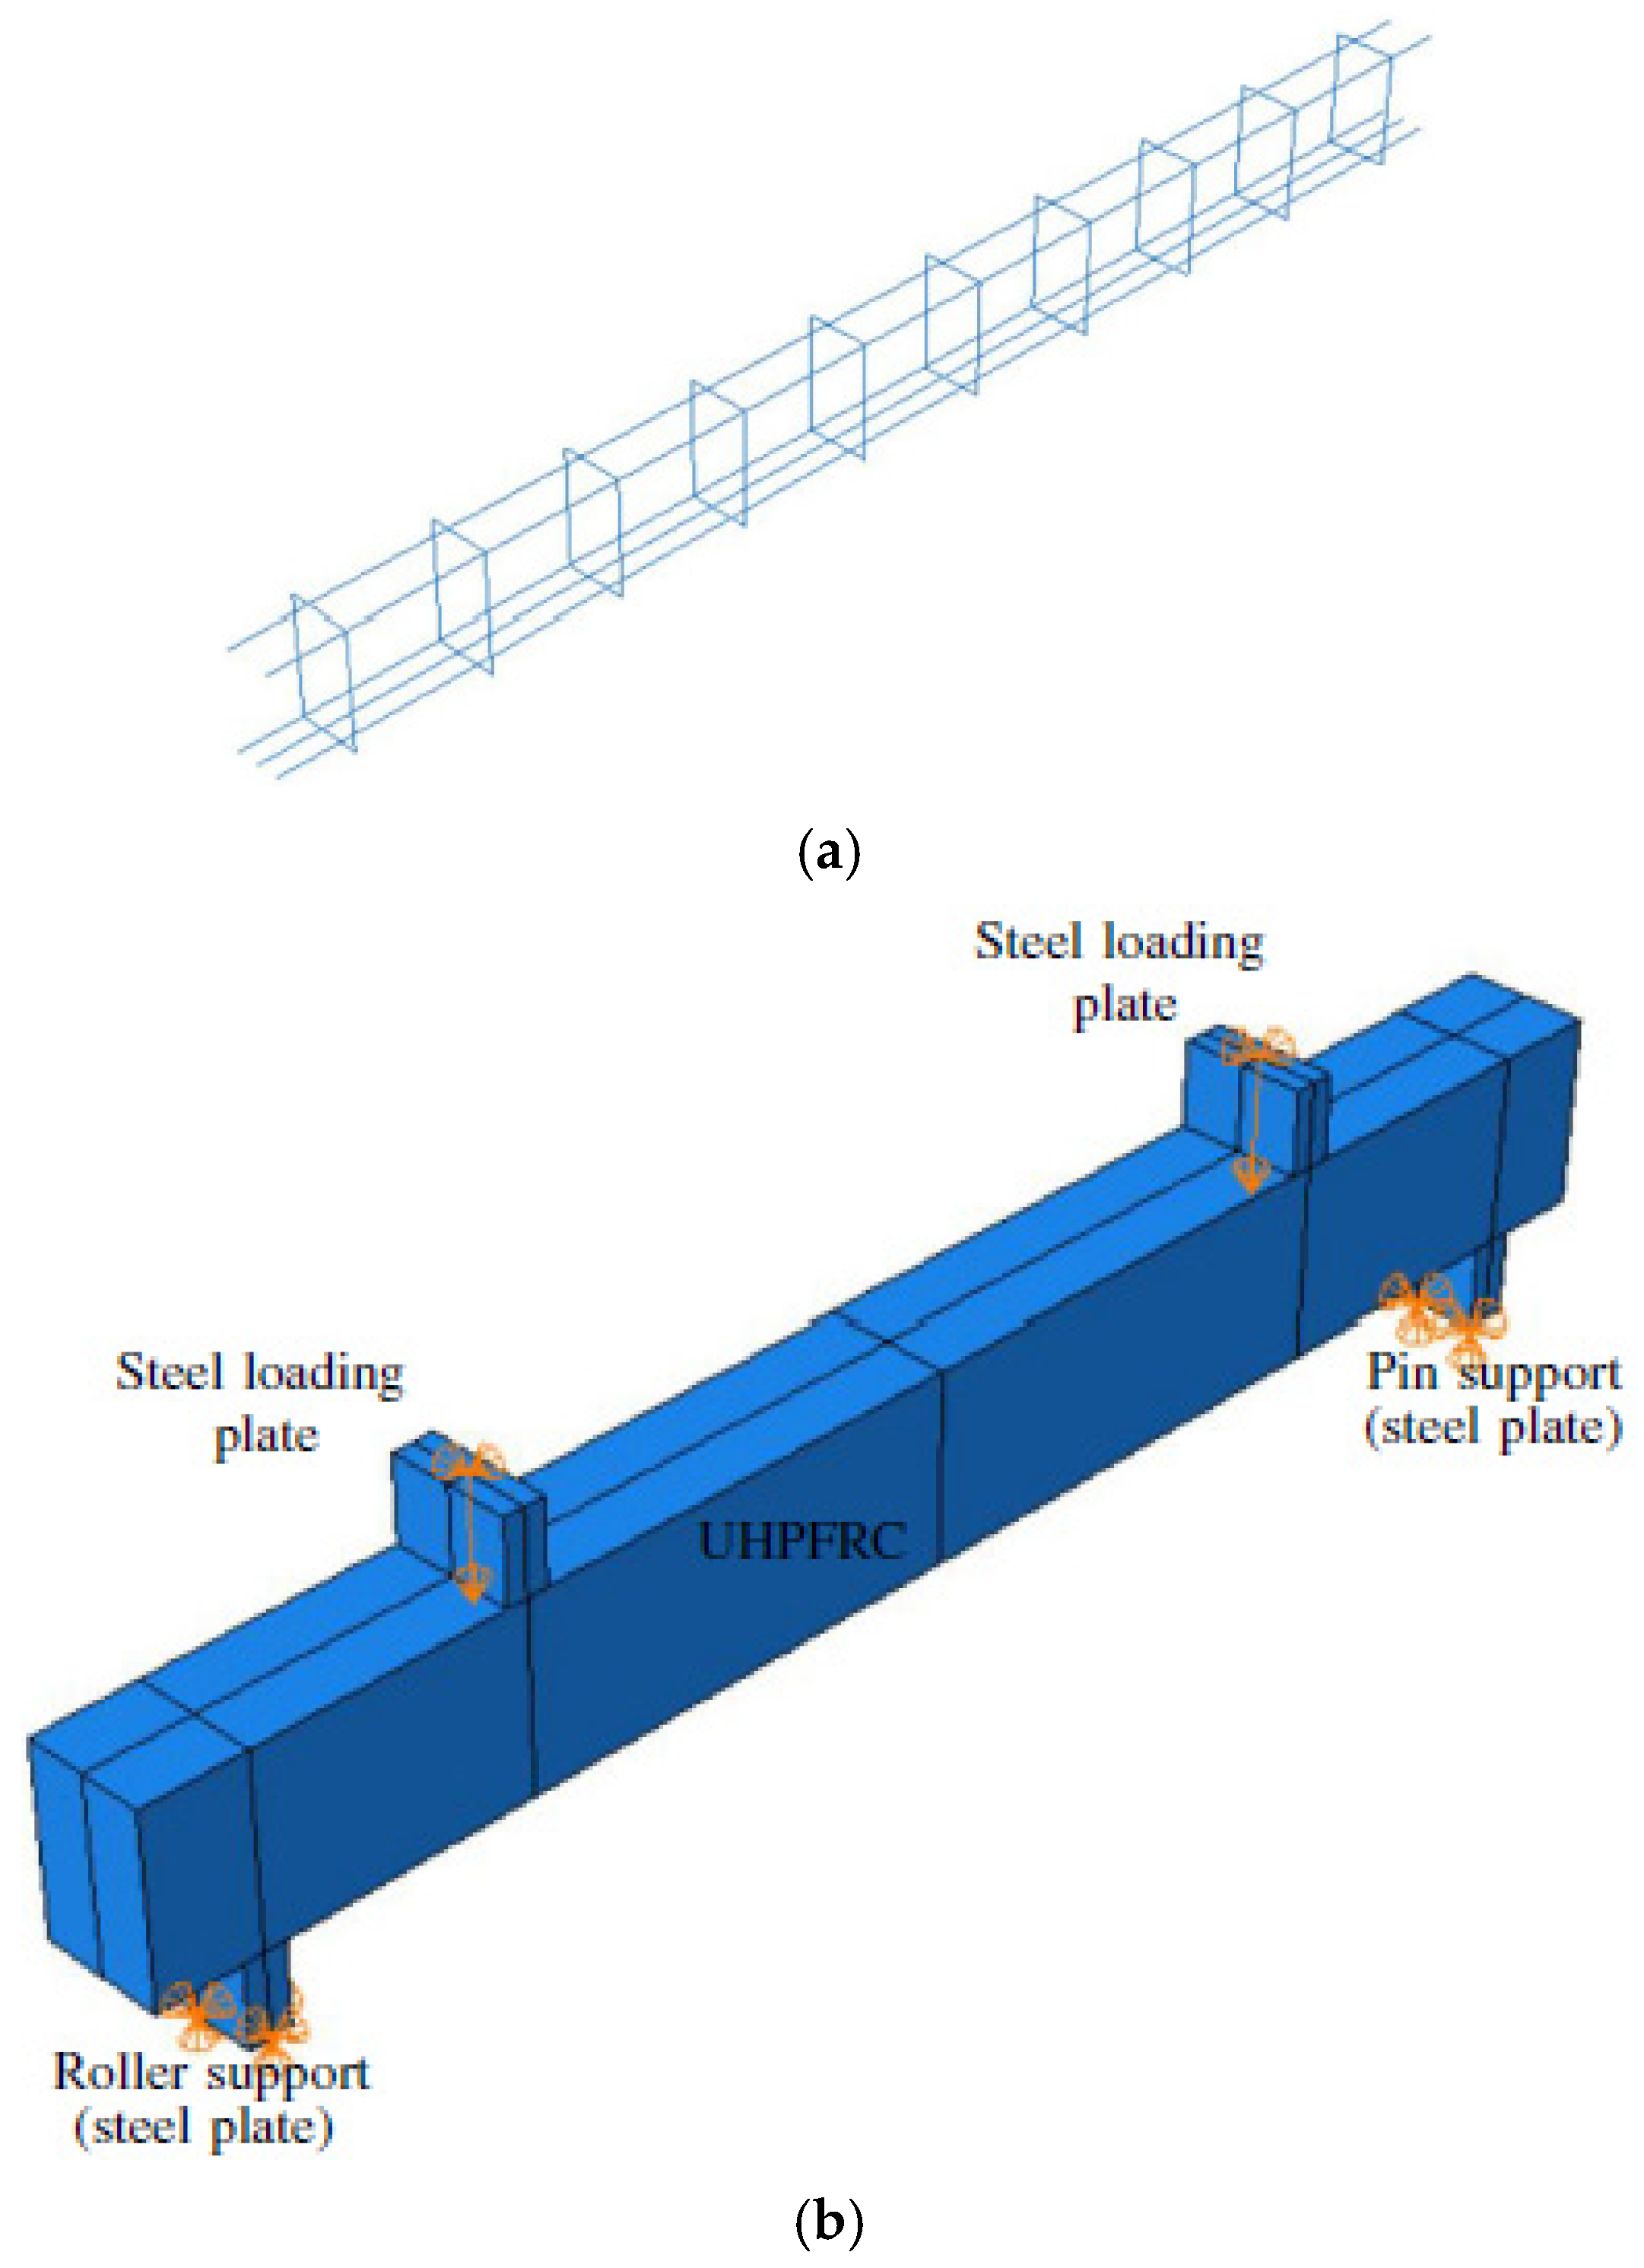
Figure 7.
RPC beam B-1 meshing and stress distribution determined using a finite element model (a) designed been (b) loaded beam.
Figure 7.
RPC beam B-1 meshing and stress distribution determined using a finite element model (a) designed been (b) loaded beam.
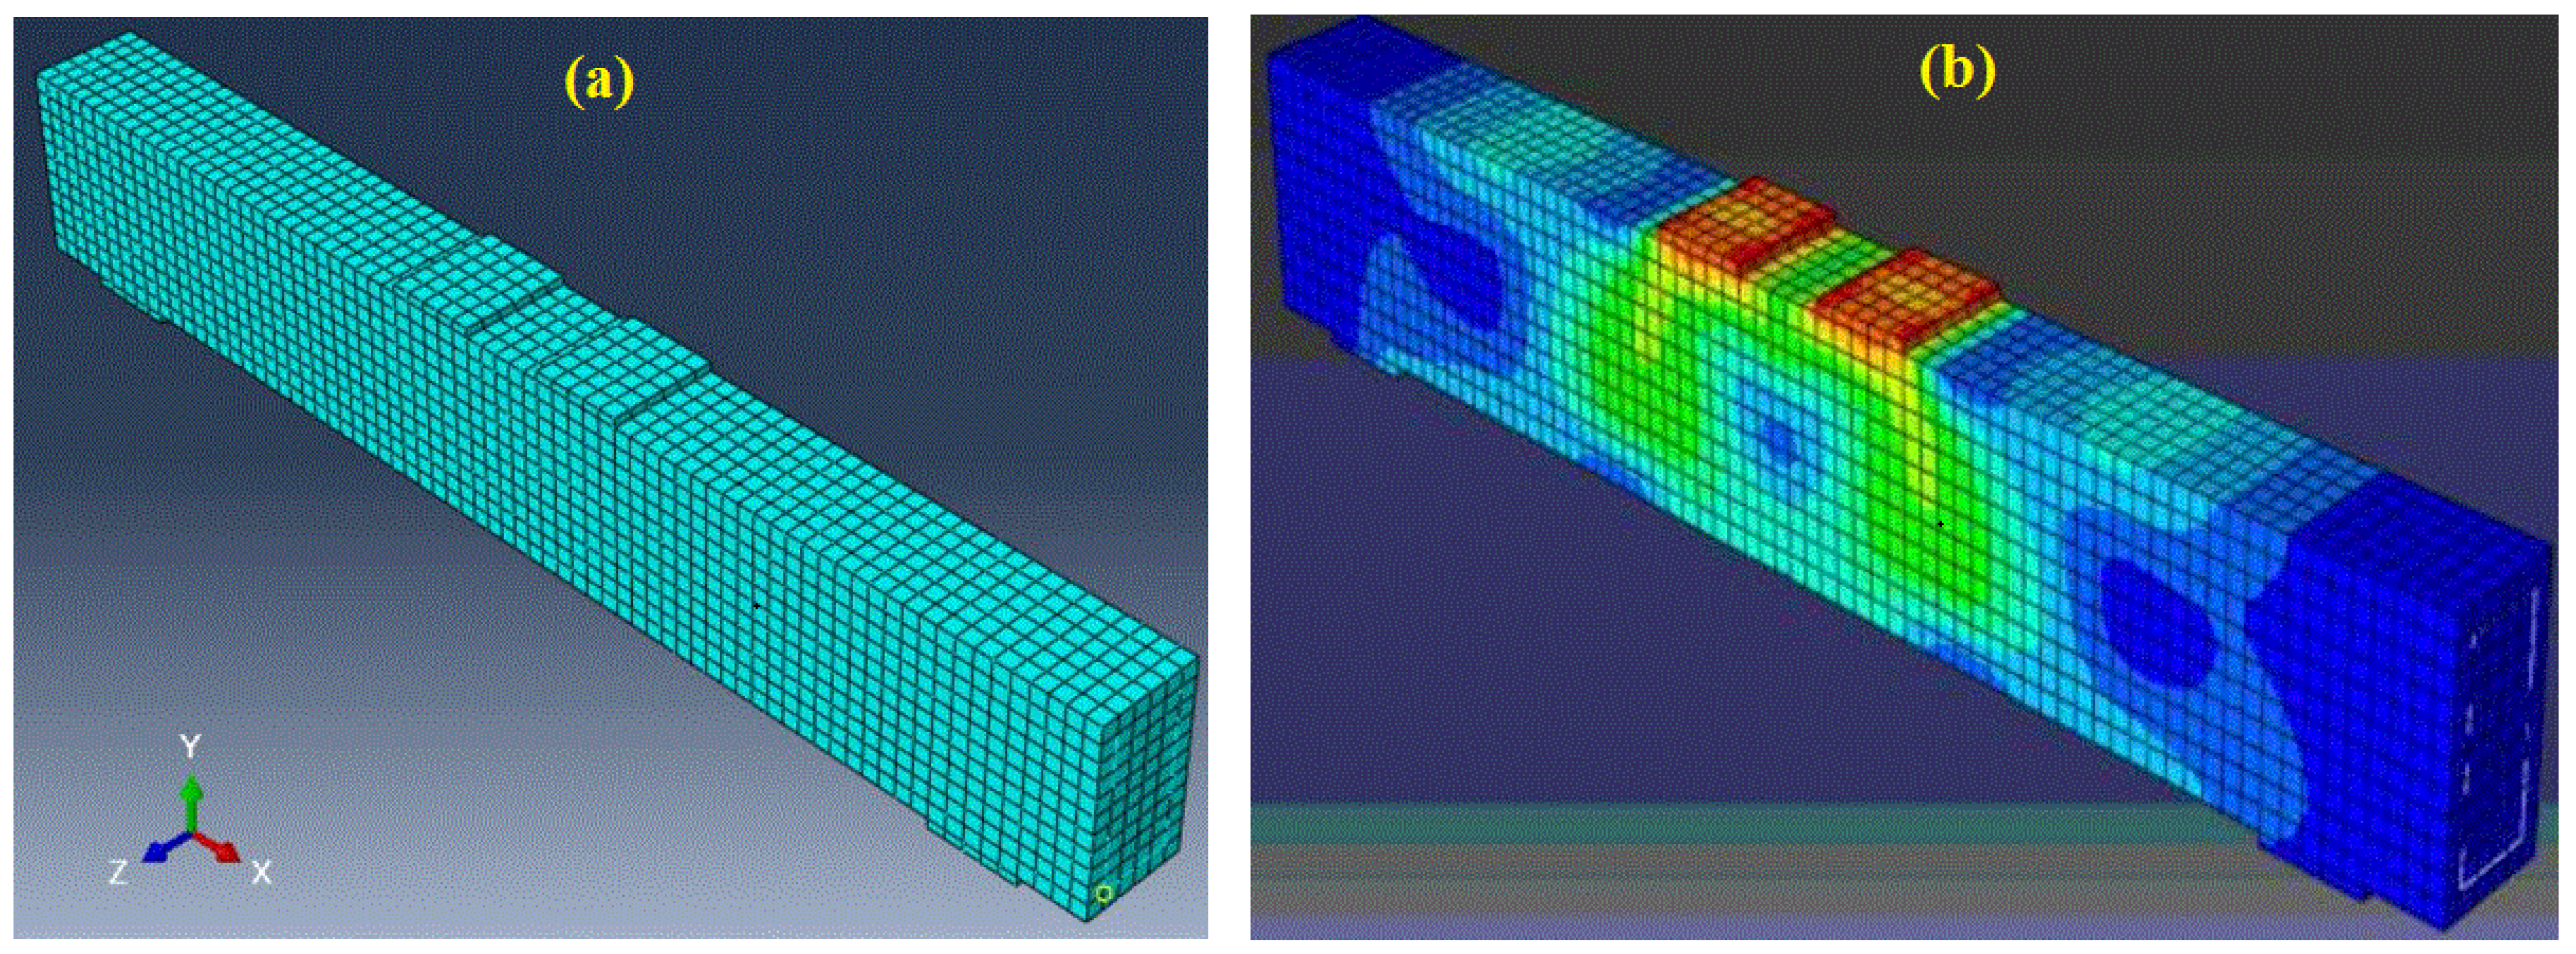
Figure 8.
Comparison of the load–displacement curves for the examined beams using experimental and numerical data for (a) B-1, (b) B-2, (c) B-3, (d) B-4, and (e) B-5.
Figure 8.
Comparison of the load–displacement curves for the examined beams using experimental and numerical data for (a) B-1, (b) B-2, (c) B-3, (d) B-4, and (e) B-5.

Table 1.
Ratio of RPC mix for a cubic meter (kg/m3).
| C a, kg | FS b, kg | QP c, kg | SF d, kg | W e, kg | SP f, kg |
|---|---|---|---|---|---|
| 760 | 1026 | 228 | 190 | 144.4 | 30.4 |
a, b, c, d, e, and f represent cement, fine sand, quartz powder, silica fume, water, and superplasticizer, respectively.
Table 2.
Specifications of the RPC beams that were examined in regard to shear.
| Beam | fcu, MPa | b × h (mm) | a/d Ratio | Main Longitudinal Bars | Provided Stirrups (Vertical Web Reinforcement) | Requirements of ACI 318-14 for sv,max and ρv,min | ||||
|---|---|---|---|---|---|---|---|---|---|---|
| Lower | Upper | sv, (mm) | dv, (mm) | ρv, (%) | sv,max, (mm) | ρv,min (%) | ||||
| B-1 | 157 | 140 × 220 | 3.0 | 6Φ18 | 2Φ10 | 100 | 6 | 0.20 | 90 | 0.235 |
| B-2 | 157 | 140 × 220 | 3.0 | 6Φ18 | 2Φ10 | 200 | 6 | 0.10 | 90 | 0.235 |
| B-3 | 157 | 140 × 220 | 3.0 | 6Φ18 | 2Φ10 | 100 | 8 | 0.36 | 90 | 0.25 |
| B-4 | 157 | 140 × 220 | 3.0 | 6Φ18 | 2Φ10 | 200 | 8 | 0.18 | 90 | 0.25 |
| B-5 | 157 | 140 × 220 | 3.2 | 6Φ18 | 2Φ10 | 200 | 8 | 0.18 | 90 | 0.25 |
Table 3.
Summary of model calibrations [47].
Table 3.
Summary of model calibrations [47].
| Details | ||
|---|---|---|
| Concrete | Finite element type | 8-node isoparametric solid elements |
| Failure mode | Fracture under tension, plasticity under compression | |
| Crack formulation | Smeared | |
| Numerical modification | Shear factor reduction | |
| Reinforcement | Finite element type | 2-node truss elements |
| Constitutive model | Uniaxial multilinear law | |
| Modeling type | Embedded reinforcement | |
| Bond type | Full reinforcement–concrete bond | |
Table 4.
Summary of the test findings for the shear-tested RPC beams.
| Beam | a/d | 2Vcr (kN) | 2Vu,exp (kN) | Vcr (kN) | Vu,exp (kN) | ||
|---|---|---|---|---|---|---|---|
| B-1 | 3.0 | 130 | 403 | 65 | 201.5 | 0.323 | 0.638 |
| B-2 | 3.0 | 110 | 369 | 55 | 184.5 | 0.298 | 0.584 |
| B-3 | 3.0 | 170 | 450 | 85 | 225 | 0.378 | 0.713 |
| B-4 | 3.0 | 120 | 369 | 60 | 184.5 | 0.325 | 0.584 |
| B-5 | 3.2 | 110 | 310 | 55 | 155 | 0.355 | 0.491 |
Table 5.
Comparison of the experimental findings with the maximum shear strength specified by the ACI 318-14 code.
Table 5.
Comparison of the experimental findings with the maximum shear strength specified by the ACI 318-14 code.
| Beam | Vu,exp (kN) | ACI 318-14 Code | |||
|---|---|---|---|---|---|
| Vc (kN) | Vs (kN) | Vu,cal (kN) | |||
| B-1 | 201.5 | 45.6 | 32.3 | 77.9 | 0.387 |
| B-2 | 184.5 | 45.6 | 16.2 | 61.8 | 0.335 |
| B-3 | 225 | 45.6 | 52.7 | 98.3 | 0.437 |
| B-4 | 184.5 | 45.6 | 26.4 | 72 | 0.390 |
| B-5 | 155 | 45.6 | 26.4 | 72 | 0.465 |
Table 6.
Comparison of testing results and maximum shear strength computed using the RPC design guidelines.
Table 6.
Comparison of testing results and maximum shear strength computed using the RPC design guidelines.
| Beam | Vu,exp (kN) | KCI-2012 | AFGC-2013 | ||||||||
|---|---|---|---|---|---|---|---|---|---|---|---|
| Vc (kN) | Vfb (kN) | Vs (kN) | Vu,KCI (kN) | Vc (kN) | Vfb (kN) | Vs (kN) | Vu,AFGC (kN) | ||||
| B-1 | 201.5 | 37.2 | 87.4 | 24.9 | 149.5 | 1.348 | 37.6 | 90.4 | 29.1 | 157.1 | 1.283 |
| B-2 | 184.5 | 37.2 | 87.4 | 12.5 | 137.1 | 1.346 | 37.6 | 90.4 | 14.5 | 142.5 | 1.295 |
| B-3 | 225 | 37.2 | 87.4 | 40.6 | 165.2 | 1.362 | 37.6 | 90.4 | 47.4 | 175.4 | 1.283 |
| B-4 | 184.5 | 37.2 | 87.4 | 20.3 | 144.9 | 1.273 | 37.6 | 90.4 | 23.7 | 151.7 | 1.216 |
| B-5 | 155 | 37.2 | 87.4 | 20.3 | 144.9 | 1.07 | 37.6 | 90.4 | 23.7 | 151.7 | 1.022 |
Table 7.
Comparison of the experimental data with the numerical model using a finite element model.
| Beam | Cracking Load and Ultimate Load | Cracking Displacement and Maximum Displacement | ||||||||||
|---|---|---|---|---|---|---|---|---|---|---|---|---|
| (kN) | (kN) | (kN) | (kN) | (mm) | (mm) | (mm) | (mm) | |||||
| B-1 | 72 | 76.5 | 1.06 | 201.5 | 185 | 1.089 | 0.5 | 0.34 | 0.68 | 1.75 | 1.95 | 0.897 |
| B-2 | 51 | 57 | 1.12 | 184.5 | 178 | 1.037 | 0.48 | 0.4 | 0.83 | 1.85 | 2.1 | 0.881 |
| B-3 | 88 | 83.5 | 0.95 | 225 | 255 | 0.882 | 0.31 | 0.33 | 1.07 | 2.2 | 1.98 | 1.11 |
| B-4 | 58 | 65 | 1.12 | 184.5 | 174 | 1.06 | 0.24 | 0.26 | 1.08 | 1.78 | 1.88 | 0.947 |
| B-5 | 60 | 55 | 0.92 | 155 | 160.5 | 0.966 | 0.47 | 0.44 | 0.94 | 2.1 | 1.98 | 1.06 |
Disclaimer/Publisher’s Note: The statements, opinions and data contained in all publications are solely those of the individual author(s) and contributor(s) and not of MDPI and/or the editor(s). MDPI and/or the editor(s) disclaim responsibility for any injury to people or property resulting from any ideas, methods, instructions or products referred to in the content. |
© 2024 by the authors. Licensee MDPI, Basel, Switzerland. This article is an open access article distributed under the terms and conditions of the Creative Commons Attribution (CC BY) license (https://creativecommons.org/licenses/by/4.0/).
Share and Cite
MDPI and ACS Style
Sultan, H.K.; Huseien, G.F. Minimum Shear Reinforcement for Reactive Powder Concrete Beams. Eng 2024, 5, 801-818. https://doi.org/10.3390/eng5020043
AMA Style
Sultan HK, Huseien GF. Minimum Shear Reinforcement for Reactive Powder Concrete Beams. Eng. 2024; 5(2):801-818. https://doi.org/10.3390/eng5020043
Chicago/Turabian StyleSultan, Hussein Kareem, and Ghasan Fahim Huseien. 2024. "Minimum Shear Reinforcement for Reactive Powder Concrete Beams" Eng 5, no. 2: 801-818. https://doi.org/10.3390/eng5020043