Abstract
Fall detection systems play a key role in addressing the health risks faced by elderly individuals. This work implements a fall detection system using machine learning techniques. This work used a fall detection dataset and preprocessed it by encoding categorical variables using one-hot encoding and handling missing data about ADLs, and associated data were culled from the particular database used. Classifiers such as Support Vector Machine, Logistic Regression, Random Forest, AdaBoost, and Gradient Boosting (GB) were trained and evaluated using the dataset. Training the classifier on a split dataset allows for the evaluation of its performance using a variety of metrics. The components that comprise it are the confusion matrix, the F1 score, recall, accuracy, and precision. Furthermore, in order to determine the major elements that contribute to fall detection, the system displays the importance of certain features. Bar charts showing the relative importance of features, a heatmap showing the confusion matrix, and feature-specific box plots showing the distribution of data are all part of the visualizations included. The ERF model emerged victorious in a comparison of models, achieving the highest level of accuracy. The purpose of this fall detection system is to improve the well-being of the elderly by accurately detecting and reporting instances of falls.
1. Introduction
A fall happens when a person slips and falls to the floor or another lower level; occasionally, a body part hits something and stops the fall. In the event of a fall, ask the person to gently sit up and then attempt to stand if the injuries seem to be minor. Take them to an emergency room or hospital right away if the pain persists after they stand up. A broken bone or other serious injury warrants the immediate assistance of an ambulance.
For elderly people who are vulnerable to falls, there are devices that can detect when they are about to happen and summon help immediately. Help can be summoned automatically with a fall detection medical alert system. With these systems, the sensor is activated automatically in the event that the user experiences a fall. To help people with gait and balance issues, most smart walkers have a fall detection system. A number of approaches are used to track gait parameters through sensory systems in order to anticipate, identify, and avoid falls. The elderly, particularly those at higher risk of falling, can reap many benefits from fall detection technology. To give just one example, a recent study found that with proper wear, these devices could achieve an average accuracy rate of 93%.
A significant injury, such as a fractured bone or a brain injury, is caused by one in five falls. Three million elderly people visit emergency rooms every year due to injuries sustained in falls. Injuries sustained in falls account for over 800,000 annual hospitalizations, with the most common causes being hip fractures and head trauma. Hip fractures account for at least 300,000 annual hospitalizations among the elderly. The majority of hip fractures (over 95%) occur as a result of a fall, most commonly a sideways fall. Most traumatic brain injuries (TBIs) occur as a result of falls. Medical expenses related to falls exceeded USD 50 billion in 2015. This amount was paid for in full, with 75% of it being contributed by Medicare and Medicaid.
In touch-sensor-based fall detection using machine learning, the subject wears sensors that, when activated, detect any abrupt movement that might indicate a fall. The use of gyroscopes and accelerometers is one example of these. The accelerometer is the principal sensor that picks up on environmental changes during fall detection. The SVM’s value will rise in response to rapid and substantial subject movement. The SVM values will change significantly if the subject falls.
2. Literature Review
A.Y. Alaoui et al. suggested a spatial-temporal approach that can detect falls in surveillance footage. Finding the video frames that contain important skeletal elements is the first order of business. Then, going forward, for every set of frames after that, you need to determine the crucial angles and distances. The dimensionality of the data is reduced using principal component analysis (PCA). Lastly, the gathered features are grouped using a number of classifiers, such as SVM, DT, RF, and KNN. Most other classifiers are out-performed by Support Vector Machines (SVMs) [1].
A.Y. Alaoui et al. presented a new approach to fall detection and direction judgement [2] by estimating human posture and using video-based analysis. They used a posture estimate network to predict the human body’s joint point coordinates. The Support Vector Machine (SVM) can use these coordinates to identify the falls. In addition, the direction of the fall was determined using the 3D data on human posture. On the Le2i fall dataset, the method attained a sensitivity of 95.66%, specificity of 99.5%, and accuracy of 97.52%. Similarly, 97.43%, 100%, and 95.45% were the corresponding results on the UR autumn dataset.
Taking into account the unique characteristics of human posture, Amara et al. developed a two-stage system for fall detection. Using OpenPose to extract the skeleton, they created new, crucial elements like deflection angles and spine ratio, and then preprocessed and analyzed differences in human posture. The first step for the researchers was to classify people’s physical states as either steady, variable, or disordered. Using icons to represent trends and consistency derived from primary characteristics, we were able to successfully classify the data [3]. The first step was to eliminate ADLs that demonstrated a high level of stability to ensure the patient was physically stable. Step two involved creating a new time-continuous recognition algorithm to differentiate between potentially dangerous falls and other types of ambiguous ADLs. While the human body was in an unstable state, features such as the compare value, energy value, and state score were proposed for use in constructing a feature vector. Some of the machine learning algorithms used by the researchers for data classification included the Support Vector Machine (SVM), Decision Tree (DT), Random Forest (RF), and K-Nearest Neighbour (KNN). Support Vector Machines (SVMs) equipped with linear kernel functions outperformed all other approaches when it came to distinguishing between falling actions. A 97.91% F1 score was achieved, along with 98.50% precision, 97.33% recall, and 97.34% detection accuracy, subsequently.
Sagar Chhetri et al. [4] presented a method for fall detection using computer vision. They fed the algorithms videos of people in small spaces in a specific order. In order to identify the 2D skeletons in every frame, the method relied on the V2V-PoseNet model. The following were the sequential steps that made up the plan: 1. Use V2V-PoseNet to determine the skeletal structure of each frame. 2. Compile paths by means of the skeletal joints on the Riemannian manifold, where the positive semidefinite matrix data features a fixed rank. 3. Find out how similar or different the trajectories are by using the temporal bending method. 4. Bring together the kernel and the (dis-)similarity test. The two publicly available datasets used to test the suggested method were URFD and Charfi.
S. A. Choi et al. focused on a comparative analysis using the SisFall dataset. Python was used to implement five machine learning techniques: Logistic Regression, Decision Tree, Linear Discriminant Analysis (LDA), KNN, and Naive Bayes. According to the study’s findings, KNN outperformed when compared to other classifiers. The study also found that data customization increased accuracy by 93% [5].
Han et al. demonstrated a method for capturing long-term dependencies between consecutive frames in fall detection videos using a mix of CNN and LSTM. The system achieved an impressive outcome with recall, accuracy, precision, and F1-score values of 92% when using 10 frames per video [6].
R. Jayakarthik et al. employed Generative Adversarial Network (GAN) models for fall detection by utilizing effective signal segments as inputs. The results indicated high accuracy, precision, and recall in detecting falls. The original dataset was separated into a training set and a testing set, each of which made up 30% and 70% of the total. The study demonstrated that, when used to predict position quality, the Artificial Neural Network achieved an accuracy of 73% [7].
Kumar et al. emphasized the significance of precise fall detection for the well-being of older individuals, as it contributes to reducing the risk of injuries or fatalities caused by falls. While vision-based fall detection systems encountered challenges in implementing machine learning techniques due to computational demands and the requirement for extensive training data, this research tackled these limitations. The vision-based fall detection system proposed aimed to improve accuracy in complex environments, even in scenarios with varying light conditions. The system exhibited excellent prediction performance, achieving an accuracy of 91% [8].
S. Mobsite et al. employed the LDA (Linear Discriminant Analysis) technique for both classification and dimensionality reduction tasks. LDA utilized hyperplanes to separate data into two or more classes based on their characteristics. Furthermore, the hyperplane that maximized the margin between the two classes was found using SVM (Support Vector Machine), with support vectors representing data points located on the margin. The researchers enhanced their toolbox with KNN, a popular non-parametric classification algorithm, which assigned each data point to a predefined class according to its proximity to the k nearest neighbors in the training set. An astounding 90% accuracy rate was attained by the suggested method in its predictions [9].
By merging the SIMADL dataset with people’s ages, S. Ravikumar et al. suggested an idea. LSTM and CNN were both used in the experiment by the researchers. The evaluations of performance showed that LSTM excelled in identifying odd behavior in the senior population [10].
S. Ravikumar et al. focused on using generally characterized perturbation-evoked response (PEP) components in people wearing an exoskeleton. They examined whether single-trial electroencephalography might be used in combination with a CNN to predict balance loss. With the chance level set at 50%, the model’s accuracy in the five-fold cross-validation test averaged at 75.2% [11].
A fall detection system that uses deep neural networks and a phone gyro sensor was developed by T. Vaiyapuri et al. A sudden change in the body’s position that resulted in a hard collision with the ground was referred to as a fall. Falls frequently happened as a result of outside circumstances that people were unaware of. Although falls might occur to anyone at any moment, the senior population is more prone to them. With a 90% accuracy rate, the created system revealed a good prediction performance [12].
Using a training set and a testing set, C. Yuan et al. evaluated the efficacy of multiple ML algorithms. The Naive Bayes algorithm attained a 55.91% accuracy rate on both the training and testing sets. The SVM algorithm attained an overall accuracy of 68.64% on both the testing and training sets. Using the Random Forest method, we achieved an accuracy level of 65.43% on both the training and testing sets. Every one of these outcomes demonstrates how various algorithms perform in that particular context [13].
From the literature survey, the identified that the drawbacks of the Existing System are limited accuracy, dependency on wearable devices, a lack of continuous monitoring, environmental limitations, the inability to distinguish falls from other activities, and a lack of real-time assistance [14].
3. Proposed Methodology
In the initial phase, the necessary libraries are imported, and the fall detection dataset is loaded from the specified file.
After that, the data is preprocessed using Simple Imputer to deal with missing values and Label Encoder to turn category variables into numerical values. Step two of the data organization is to sort the information according to its features (X) and labels (y). You also have the option of using the training test split function to split the data. Consequently, separate sets will be generated for training and testing. So that we can gain knowledge from them, we would provide the classifiers with the training dataset. Using the trained classifier, predictions are made on the testing set. Several metrics are utilized to evaluate the model’s performance, including recall, accuracy, precision, confusion matrix, and F1 score. In addition, a bar plot is used to estimate the importance of those features, and heatmaps and bar graphs are used to visualize the confusion matrix and recall, respectively. The architectural layout of the proposed work is shown in Figure 1 [15,16,17,18].
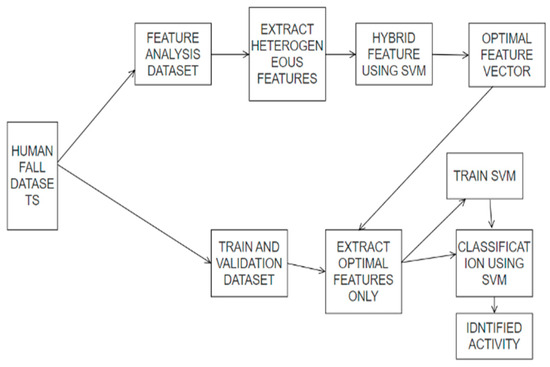
Figure 1.
Architecture diagram.
3.1. Data Collection
The dataset used in this study consists of instances of various activities performed by 11 individuals. Each instance represents a 6 s window of tri-axial accelerometer and gyroscope data. The maximum acceleration magnitude and gyroscope magnitude at the 4th second of each window are recorded. From this data, 11 informative features are extracted, including maximum acceleration, kurtosis, skewness, maximum gyroscope magnitude, and others. The dataset is balanced, with 767 samples representing falls and 1017 samples representing non-fall activities. The non-fall samples are composed of 113 data samples from each of the 9 different activities, resulting in a total of 1017 non-fall samples. After that, we will make sure that there is an equal amount of fall and non-fall samples in the training set (80%) and the test set (20%) by dividing the dataset in this way. There is a “Train.csv” file for training data and a “Test.csv” file for test data.
The features of the dataset are:
- acc_max: The fourth second of the maximum acceleration magnitude of the window;
- acc_kurtosis: Complete window acceleration kurtosis;
- acc_skewness: Asymmetry of the entire window due to acceleration;
- gyro_max: Fourth second of the maximum gyroscope magnitude for the window;
- gyro_kurtosis: The entire window’s gyroscope kurtosis;
- gyro_skewness: The whole window’s gyroscope skewness;
- lin_max: The highest possible linear acceleration (acceleration excluding gravity) of the fourth second of the window;
- post_lin_max: The sixth second maximal linear acceleration;
- post_gyro_max: The sixth second maximal linear acceleration;
- fall: 1, if the activity is a fall activity; otherwise, 0;
- label: The activity label.
3.2. Data Pre-Processing
In the dataset, the presence of missing values in some columns poses a significant challenge. Therefore, preprocessing the dataset is necessary before training the model. The dataset consists of a total of 400 samples of patient data, but some values are missing. To ensure an accurate model performance, it is essential to address these missing values by filling them with appropriate values. In our study, we utilized the mean imputation method to address the missing values present in the dataset. The missing values of a variable were filled in using the mean value from the available non-missing cases, using this method. The classification algorithm was then fed the pre-processed dataset that has had the missing values filled in. Figure 2 presents a heatmap that visualizes the correlations among the variables, aiding in the identification of the most influential features for building a robust machine learning model.
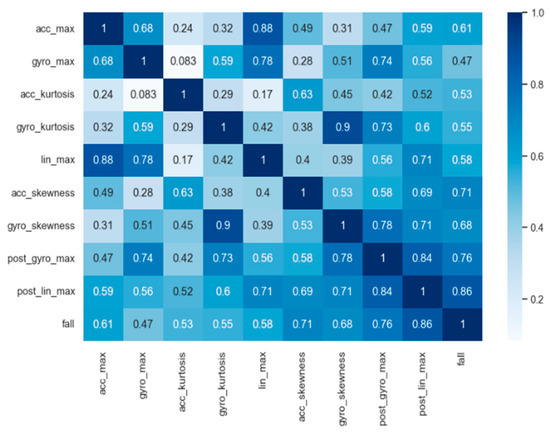
Figure 2.
Representation of correlation of the attributes.
To further enhance data quality, any remaining null values were replaced with the mean value. Outlier identification was also used to discover and handle data points that differed significantly from the norm. A Local Outlier Factor (LOF) method is used for removing the outliers. Addressing outliers is crucial, as they can have a substantial impact on the accuracy of the human activity prediction model. Figure 3 describes the important features of the model [19,20].
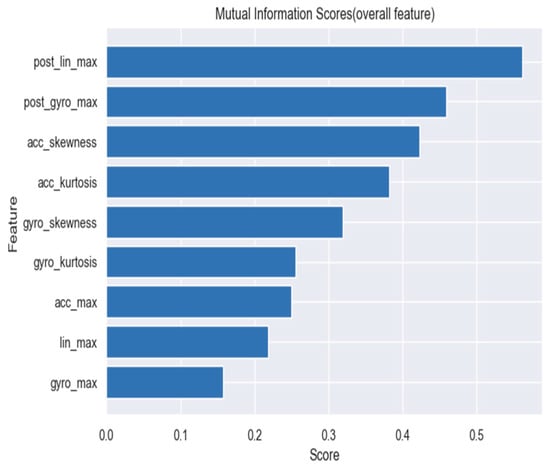
Figure 3.
Important features.
3.3. Model Training and Evaluation
In this instance, the dataset was trained and evaluated using a number of machine learning algorithms, including Random Forest, AdaBoost, Gradient Boosting, Support Vector Machines, K-Nearest Neighbors, and an Enhanced Random Forest Classifier. The training set was used to fit the classifier first. Using the predictive method to make predictions for the test set is the second step. Some of the many metrics used to measure a model’s efficacy include recall, accuracy, precision, F1 score, confusion matrix, and many more aspects.
Enhanced Random Forest Classifier (ERF):
- Start by setting the number of trees in the forest (n_estimators).
- For each tree in the forest:
- a.
- Randomly choose a subset of the training data, allowing for duplicates (bootstrap samples);
- b.
- Take all of the features and pick a subset at random;
- c.
- Enhance the tree building process by incorporating additional techniques, such as:
- -
- Feature engineering: Create new features or transform existing features to capture more relevant information;
- -
- Feature selection: Use algorithms or heuristics to select the most informative features for each tree;
- -
- Sample weighting: Assign different weights to the training samples to emphasize or de-emphasize certain instances;
- -
- Ensemble diversity: Introduce variations in tree construction, such as by using different splitting criteria or different impurity measures.
- d.
- Build a Decision Tree using the selected data and features, considering the enhancements applied;
- e.
- Repeat steps a–d until the tree is fully grown or a stopping criterion is met.
- To produce predictions for fresh data, use an ensemble approach adapted to the enhancements made to aggregate the forecasts of all the trees in the forest;
- Check how well the Enhanced Random Forest model worked by applying standard measures such as recall, accuracy, precision, F1 score, and confusion matrix;
- Adjust the Enhanced Random Forest model’s hyperparameters, such as the number of estimators (n_estimators), maximum tree depth, feature selection parameters, and any other parameters pertaining to the improvements made;
- Repeat steps 2–5 until the desired performance level is achieved or a maximum number of iterations is reached.
4. Experimental Results and Performance Measures
The methods employed in this paper are Random Forest, AdaBoost, Gradient Boosting, SVM, KNN, and Enhanced Random Forest (ERF). Each classifier’s performance is measured as follows.
Precision: A classification model’s accuracy in identifying positive samples can be measured by its precision. As demonstrated in Equation (1), it is calculated by dividing the sum of all samples (positive and negative) by the number of samples that were actually positive.
Recall: One way to measure how well a classification model does its job is by looking at its recall, which is also called its sensitivity or true positive rate. The sum of the number of samples that were classified as true positives or false negatives is divided by the total number of samples to obtain this value. Using Equation (2), we can obtain the memory formula.
Classification Accuracy: The accuracy of a classifier is the degree to which it makes the right predictions. The precision of a prediction system can be calculated by dividing the number of right calls by the total number of calls. Equation (3) provides the formula for precision.
F1-measure: The F1 score is a single number that represents both accuracy and recall. When contrasting two models with different accuracy–recall trade-offs, this method shines. To determine F1 scores, simply plug the numbers into Equation (4).
The accuracy, F1 score, recall, and precision value of RF, AdaBoost, KNN, Gradient Boosting, SVM, and Enhanced Random Forest (ERF) are shown in Table 1 and Figure 4. The Enhanced Random Forest classifier outperformed all others in accuracy with a value of 99%. Figure 5 describes the predicted labels with corresponding values. If it lies within the box, the person has fallen.

Table 1.
Precision, accuracy, recall and F1 scores of the classifiers.
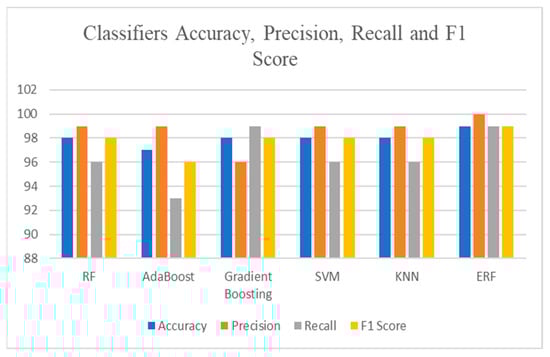
Figure 4.
Accuracy, F1 score, and recall of classifiers.
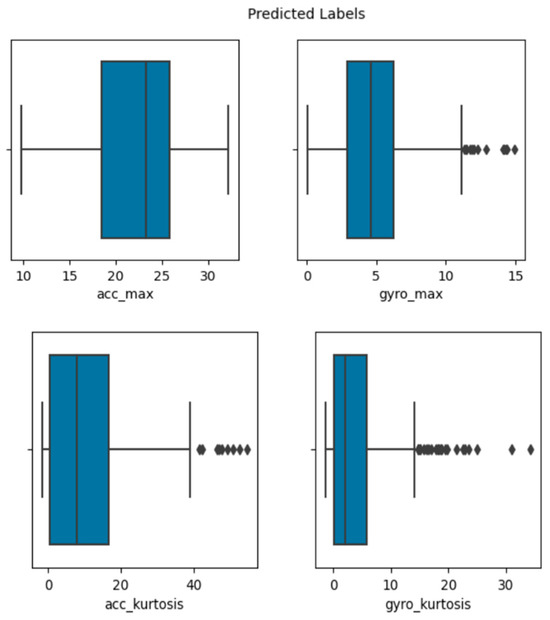
Figure 5.
Predicted labels with values.
5. Conclusions and Future Work
The Enhanced Random Forest (ERF) algorithm has shown superior performance in detecting human falls compared to traditional image-based methods. Unlike images, ERF can accurately deduct each pose of a person, enabling precise fall detection. By applying the mentioned methods, the proposed system efficiently processes various types of datasets to generate accurate outputs. ERF’s capability to detect even subtle poses allows for the reliable identification of fall incidents. Machine learning techniques, particularly the Enhanced Random Forest algorithm, have been successfully applied in fall detection, which is critical due to the increasing number of elderly individuals and fall-related injuries. The algorithm utilizes sophisticated learning algorithms to classify falls from non-fall events with high accuracy, adaptability to different environments, and efficiency in handling large datasets for real-time applications. Comparing the proposed system with existing systems that employ CNN, our Enhanced Random Forest algorithm outperforms in terms of accuracy, achieving a 99% accuracy rate, surpassing the existing system’s performance of less than 98%. The purpose of this research is to review fall detection techniques and motivate future researchers to build machine learning-based fall detection systems. Future research may focus on combining education, IoT techniques, and clinical support to achieve real-world fall detection goals.
Author Contributions
R.S.: Conceived and designed the Fall Detection System, implemented the machine learning models, and analyzed the results. E.C.: Preprocessed the fall detection dataset, performed feature engineering, and contributed to the system’s visualizations. V.K.: Assisted in the evaluation of the machine learning models and contributed to the interpretation of the performance metrics. All authors have read and agreed to the published version of the manuscript.
Funding
This research received no external funding.
Institutional Review Board Statement
This study did not require ethical approval because it did not involve humans or animals.
Informed Consent Statement
Informed consent was obtained from all subjects involved in the study.
Data Availability Statement
https://www.kaggle.com/code/saadmansakib/human-fall-detection-using-random-forest-97-47/input (accessed on 1 September 2022).
Conflicts of Interest
The authors declare no conflicts of interest.
References
- Alaoui, A.Y.; El Fkihi, S.; Thami, R.O.H. Fall detection for elderly people using the variation of key points of human skeleton. IEEE Access 2019, 7, 154786–154795. [Google Scholar] [CrossRef]
- Alaoui, A.Y.; Tabii, Y.; Thami, R.O.H.; Daoudi, M.; Berretti, S.; Pala, P. Fall detection of elderly people using the manifold of positive semidefinite matrices. J. Imaging 2021, 7, 109. [Google Scholar] [CrossRef]
- Amara, M.I.; Akkouche, A.; Boutellaa, E.; Tayakout, H. A smartphone application for fall detection using accelerometer and convlstm network. In Proceedings of the 2020 2nd International Workshop on Human-Centric Smart Environments for Health and Well-being (IHSH), Boumerdes, Algeria, 9–10 February 2021; IEEE: Piscataway, NJ, USA, 2021; pp. 92–96. [Google Scholar]
- Chhetri, S.; Alsadoon, A.; Al-Dala’in, T.; Prasad, P.W.C.; Rashid, T.A.; Maag, A. Deep learning for vision-based fall detection system: Enhanced optical dynamic flow. Comput. Intell. 2021, 37, 578–595. [Google Scholar]
- Choi, A.; Kim, T.H.; Yuhai, O.; Jeong, S.; Kim, K.; Kim, H.; Mun, J.H. Deep learning-based near-fall detection algorithm for fall risk monitoring system using a single inertial measurement unit. IEEE Trans. Neural Syst. Rehabil. Eng. 2022, 30, 2385–2394. [Google Scholar] [CrossRef] [PubMed]
- Han, K.; Yang, Q.; Huang, Z. A two-stage fall recognition algorithm based on human posture features. Sensors 2020, 20, 6966. [Google Scholar] [CrossRef] [PubMed]
- Jayakarthik, R.; Srinivasan, A.; Goswami, S.; Mahaveerakannan, R. Fall Detection Scheme based on Deep Learning Model for High-Quality Life. In Proceedings of the 2022 3rd International Conference on Electronics and Sustainable Communication Systems (ICESC), Coimbatore, India, 17–19 August 2022; IEEE: Piscataway, NJ, USA, 2022; pp. 1582–1588. [Google Scholar]
- Kumar, S.; Jain, A.; Shukla, A.P.; Singh, S.; Raja, R.; Rani, S.; Harshitha, G.; AlZain, M.A.; Masud, M. A comparative analysis of machine learning algorithms for detection of organic and nonorganic cotton diseases. Math. Probl. Eng. 2021, 2021, 1790171. [Google Scholar] [CrossRef]
- Mobsite, S.; Alaoui, N.; Boulmalf, M. A framework for elders fall detection using deep learning. In Proceedings of the 2020 6th IEEE Congress on Information Science and Technology (CiSt), Agadir-Essaouira, Morocco, 5–12 June 2021; IEEE: Piscataway, NJ, USA, 2021; pp. 69–74. [Google Scholar]
- Ravikumar, S.; Kannan, E. Machine Learning Techniques for Identifying Fetal Risk During Pregnancy. Int. J. Image Graph. 2022, 22, 2250045. [Google Scholar] [CrossRef]
- Ravikumar, S.; Vijay, K.; Pavithra, S.; Prithi, S.; Kannan, S. Prediction of Rental Demands using different Machine Learning Algorithms. In Proceedings of the 2023 International Conference on Computer Communication and Informatics (ICCCI), Coimbatore, India, 23–25 January 2023; IEEE: Piscataway, NJ, USA, 2023; pp. 1–6. [Google Scholar]
- Vaiyapuri, T.; Lydia, E.L.; Sikkandar, M.Y.; Díaz, V.G.; Pustokhina, I.V.; Pustokhin, D.A. Internet of things and deep learning enabled elderly fall detection model for smart homecare. IEEE Access 2021, 9, 113879–113888. [Google Scholar] [CrossRef]
- Yuan, C.; Zhang, P.; Yang, Q.; Wang, J. Fall detection and direction judgment based on posture estimation. Discret. Dyn. Nat. Soc. 2022, 2022, 8372291. [Google Scholar] [CrossRef]
- Zamzami, I.F. The Key Criteria for Predicting Unusual Behavior in the Elderly with Deep Learning Models Under 5G Technology. IEEE Access 2023, 11, 18921–18937. [Google Scholar]
- Amen, K.; Zohdy, M.; Mahmoud, M. Machine learning for multiple stage heart disease prediction. In Proceedings of the 7th International Conference on Computer Science, Engineering and Information Technology, Copenhagen, Denmark, 26–27 September 2020; pp. 205–223. [Google Scholar]
- Babu, R.; Kannappan, J.; Krishna, B.V.; Vijay, K. An efficient spam detector model for accurate categorization of spam tweets using quantum chaotic optimization-based stacked recurrent network. Nonlinear Dyn. 2023, 111, 18523–18540. [Google Scholar] [CrossRef]
- S, M.; Raj Y, A.; Kumar, A.; Ashok Kumar, V.D.; Kumar, A.; D, E.; Kumar, V.D.A.; B, C.; Abirami, a. Prediction of cardiovascular disease using deep learning algorithms to prevent COVID 19. J. Exp. Theor. Artif. Intell. 2021, 35, 791–805. [Google Scholar] [CrossRef]
- Manikandan, J.; Devakadacham, S.R.; Shanthalakshmi, M.; Raj, Y.A.; Vijay, K. An Efficient Technique for the Better Recognition of Oral Cancer using Support Vector Machine. In Proceedings of the 2023 7th International Conference on Intelligent Computing and Control Systems (ICICCS), Madurai, India, 17–19 May 2023; IEEE: Piscataway, NJ, USA, 2023; pp. 1252–1257. [Google Scholar]
- Latha, G.C.P.; Sridhar, S.; Prithi, S.; Anitha, T. Cardio-vascular disease classification using stacked segmentation model and convolutional neural networks. J. Cardiovasc. Dis. Res. 2020, 11, 26–31. [Google Scholar]
- Wang, X.; Ellul, J.; Azzopardi, G. Elderly fall detection systems: A literature survey. Front. Robot. AI 2020, 7, 71. [Google Scholar] [CrossRef] [PubMed]
Disclaimer/Publisher’s Note: The statements, opinions and data contained in all publications are solely those of the individual author(s) and contributor(s) and not of MDPI and/or the editor(s). MDPI and/or the editor(s) disclaim responsibility for any injury to people or property resulting from any ideas, methods, instructions or products referred to in the content. |
© 2024 by the authors. Licensee MDPI, Basel, Switzerland. This article is an open access article distributed under the terms and conditions of the Creative Commons Attribution (CC BY) license (https://creativecommons.org/licenses/by/4.0/).