
Seasonal Analysis of Silicon Photovoltaic Technology Module †

1
Department of Electrical Engineering, Sandip Institute of Technology, Nasik 422213, Maharashtra, India
2
Department of Electronics and Telecommunication Engineering, D. Y. Patil Deemed to be University, Ramrao Adik Institute of Technology, Navi Mumbai 400706, Maharashtra, India
3
Department of Electronics Engineering, D. Y. Patil Deemed to be University, Ramrao Adik Institute of Technology, Navi Mumbai 400706, Maharashtra, India
*
Author to whom correspondence should be addressed.
†
Presented at the International Conference on Recent Advances in Science and Engineering, Dubai, United Arab Emirates, 4–5 October 2023.
Eng. Proc. 2023, 59(1), 184; https://doi.org/10.3390/engproc2023059184
Published: 18 January 2024
(This article belongs to the Proceedings of Eng. Proc., 2023, RAiSE-2023)
Abstract
:The installed capacity of photovoltaic systems has been rising quickly lately. Deploying photovoltaic systems to generate power, however, is a substantial problem given their reliance on weather and environmental circumstances. The various environmental factors that must be taken into account are temperature, wind direction, speed, as well as irradiation. The solar system’s standard test condition is never precisely attained outside. Because of this, it is necessary to take into account the seasonal influences to increase solar system performance in a real-time context. In the context of the Indian subcontinent, this research is especially important due to seasonal fluctuations in spectrum-related characteristics. The findings demonstrate that the multi-crystalline technology efficiency and output power evaluated for sites conform to the efficiency as well as output power anticipated using the temperature of the module. Under normal testing conditions, the solar PV module’s parameters are taken from the manufacturer’s datasheet. The accurate modeling of solar systems is necessary to address a variety of PV system problems. We may characterize a solar module’s electrical properties using this precise modeling technique to provide an accurate analysis of cell behavior under any operating situation. Three main stages must be taken into account while modeling a PV cell: the right selection of analogous models, the mathematical formulation of the model, and the precise identification of parameter values in the models. Therefore, in order to mimic the characteristics of solar modules, it is crucial to analyze and design relevant models, as well as use the right modeling technique. The root-mean-square error parameter is considered for the linear regression method.
1. Introduction
Temperature has a major effect on how well a solar photovoltaic (PV) panel works. It affects how much energy the entire solar plant produces. The PV module’s performance capacity increases as a result of the temperature change, which also quickens the cycle of degradation [1]. A precise estimate of the PV module’s temperature is essential for assessing the PV installation’s capacity to produce electricity when planning and evaluating the potential performance of large PV installations [2].
Based on variations in climatic parameters including air temperature, rainfall, and air current, the climate of India can be categorized into four seasons: monsoon, post-monsoon, winter, and summer [3,4]. The effects of seasonal solar spectrum changes on solar panels consisting of mono-crystalline-Si, amorphous-Si, and cadmium sulfide (CdS) were studied in Japan by Hirata et al. [5,6]. Gottschalg et al. [7,8] demonstrated comparable spectrum fluctuations on several thin-film-based solar modules in the UK in terms of UF variation. In [9], a method for integrating seasonal variations in the incident spectrum at a site in the United Kingdom was established for both single-junction as well as multi-junction amorphous silicon panels. The yearly spectral effect and its uncertainty were evaluated and linked to both the MMF and the APE at a different site in Germany [10,11].
At the Japan site, the effect of seasonal variations in spectral distribution on the performance ratio was investigated [12,13,14,15], taking into account both APE and module temperature. Another Spanish study [16] used a spectral correction parameter to examine the impact of the spectrum on multi-crystalline silicon (mc-Si) and amorphous Si solar modules. The impact of the spectrum on the photovoltaic devices was modeled in [17]. Trials were conducted with respect to real time environmental conditions between the winter and summer seasons [18]. In [19], the authors proposed various meta-heuristic optimization methods. A parameter extraction technique for the double-diode photovoltaic cell is mentioned in [20].
2. Methodology
The work on measuring the spectrum that is presented here was carried out at the National Institute of Solar Energy (NISE) in India, as presented in Figure 1. This area is in Gurgaon, the northernmost city in India, not far from New Delhi. Data were collected for one year, from January to December, from a sensing device between 8 a.m. and 5 p.m. at an interval of 10 min. A year can be partitioned into the 4 seasons of winter, summer, monsoon, and post-monsoon at this location. The first week of November marks the start of winter, which lasts through February. In contrast, summer starts in March and lasts through the end of June, whereas the monsoon lasts from July to September, and October and early November may be considered the post-monsoon. Finding the module temperature coefficient is a crucial step in this paper’s analysis of how the weather affects photovoltaic modules. For the most accurate estimate of output energy generation, module temperature prediction is essential because local environmental factors including in-plane irradiance (Gt), speed of wind (Vw), and ambient temperature (Ta) change over time. Based on projected coefficients, the experimental module temperature for mc-Si technology was compared to the predicted module temperature. The temperature (Tm) of the output power module is an important factor when determining efficiency. This is because it has a direct impact on the solar module’s output performance [16].
Using the least-squares approach on noted data for 1-year, linear regression data analysis was utilized to complete the estimation of all Tm model coefficients. Using one or more independent variables that may most effectively predict the value of the dependent variable, linear regression analysis calculates the coefficients of the linear equation. It reduces the differences between the expected and actual output values by fitting a straight line or surface. Given a set of paired data, basic linear regression calculators using the “least squares” method can be used to determine the best-fit line. Before using this linear regression technique, undesirable values from the supplied dataset were eliminated for a more accurate and better estimation of the model coefficients.
3. Measurement and Experimental Setup
Figure 2 presents the experimental measurement setup that was utilized in NISE. In addition, this location is at 28°37′ N latitude, 77°04′ E longitude, with a height of 216 m above level of sea. This area is in Gurgaon, the northernmost city in India, not far from New Delhi. Data were collected for one year, from January to December, from the sensing device between 8 a.m. and 5 p.m. at an interval of 10 min. The identical area of these technologies, namely amorphous Si, HIT, as well as multi-crystalline Si, was arranged at a slope angle of 28°, parallel to the sites.
On the other hand, data loggers gathered information from modules and sent it to a computer for estimation, while environmental characteristics such as irradiance (Gt), speed of wind (Vw), and ambient temperature (Ta) were sensed by a sensing device as shown in Figure 2. Table 1 shows a list of sensing devices and their resolutions that can be used in a weather base station. A pyranometer sensor was used to detect solar radiation. A propeller-style wind sensor detected Vw. The temperature of the atmosphere was monitored using a K-type thermocouple. At a 10 min period, real-time data were collected for each solar module.
To record solar radiation upon the exterior surface with a 305–2800 nm wavelength (λ) range, a pyranometer was used with a resolution of 10 W/ m2. In order to sense and note down the atmospheric temperature, a temperature sensor with a resolution of 0.2°C was used [16]. Important environmental factors that affect the power of the PV module were included in the model. The module’s short-circuit current (Isc) and open-circuit voltage (Voc), which are the two major output power components, are directly impacted. Irradiance indirectly affects current and voltage because it raises the temperature of the module [20]. The amount of solar radiation directly affects how powerful the panels are. Therefore, a reduction in solar radiation level results in a reduction in panel power. On the other hand, the relationship between panel power and temperature is inverse. In other words, when the outside temperature rises, panel power declines. A PV panel that is exposed to wind can produce more power than that of without considering the wind. Climate factors such as high temperature and humidity have a greater-than-70% impact on solar cell performance and significantly reduce the efficiency of solar cells.
A heuristic approach is presented in the mentioned equation, which shows the deviation from STC, and it is given by
where GSTC, PSTC, and TSTC are the irradiance, power, and module temperature at the standard test condition, respectively. The in-plane irradiance, ambient temperature, and wind speed, respectively, are the instantaneous environmental parameters G, Ta, and Vw. The terms related to module temperature are shown by coefficients a3, a4, a5, and constant a6, whereas the power generation terms due to the direct influence of irradiance are connected with coefficients a1 and a2. The model coefficients were derived using regression analysis from quantifiable data gathered over a one-year period and technical specifications provided by the manufacturer using Equation (1). The linear regression analysis utilizing the observed module temperature yielded the model’s coefficients a3, a4, a5, and constant a6.
Module temperature is taken into account for the horizontal axis while determining the three coefficients, namely a3, a4, a5, and constant a6, while efficiency, ambient temperature, and wind speed are taken into account for the vertical axis. By taking into account power, module temperature, and gamma factor for the horizontal axis and the active area of the module and irradiance for the vertical axis, regression analysis was used to obtain the model’s a1 and a2 coefficients.
4. Results and Discussion
The coefficients a3 to a6 of the model were obtained from the regression analysis using the observed module temperature. These coefficients were then used in the regression analysis to create the model’s a1 and a2 coefficients, together with the observed power deviation, and are shown in Table 1.
The site condition may affect the coefficients associated with the module temperature (a3–a6). These coefficients are proportional to the temperature of the module. The coefficients a1 and a2, which are connected to power-generating terms, are mostly related to the module’s technical characteristics. The a1 coefficient would have a considerable influence on power, which would follow the seasonal efficiency trend for PV modules. Other coefficients, such as a2, have a greater influence than the a1 coefficient.
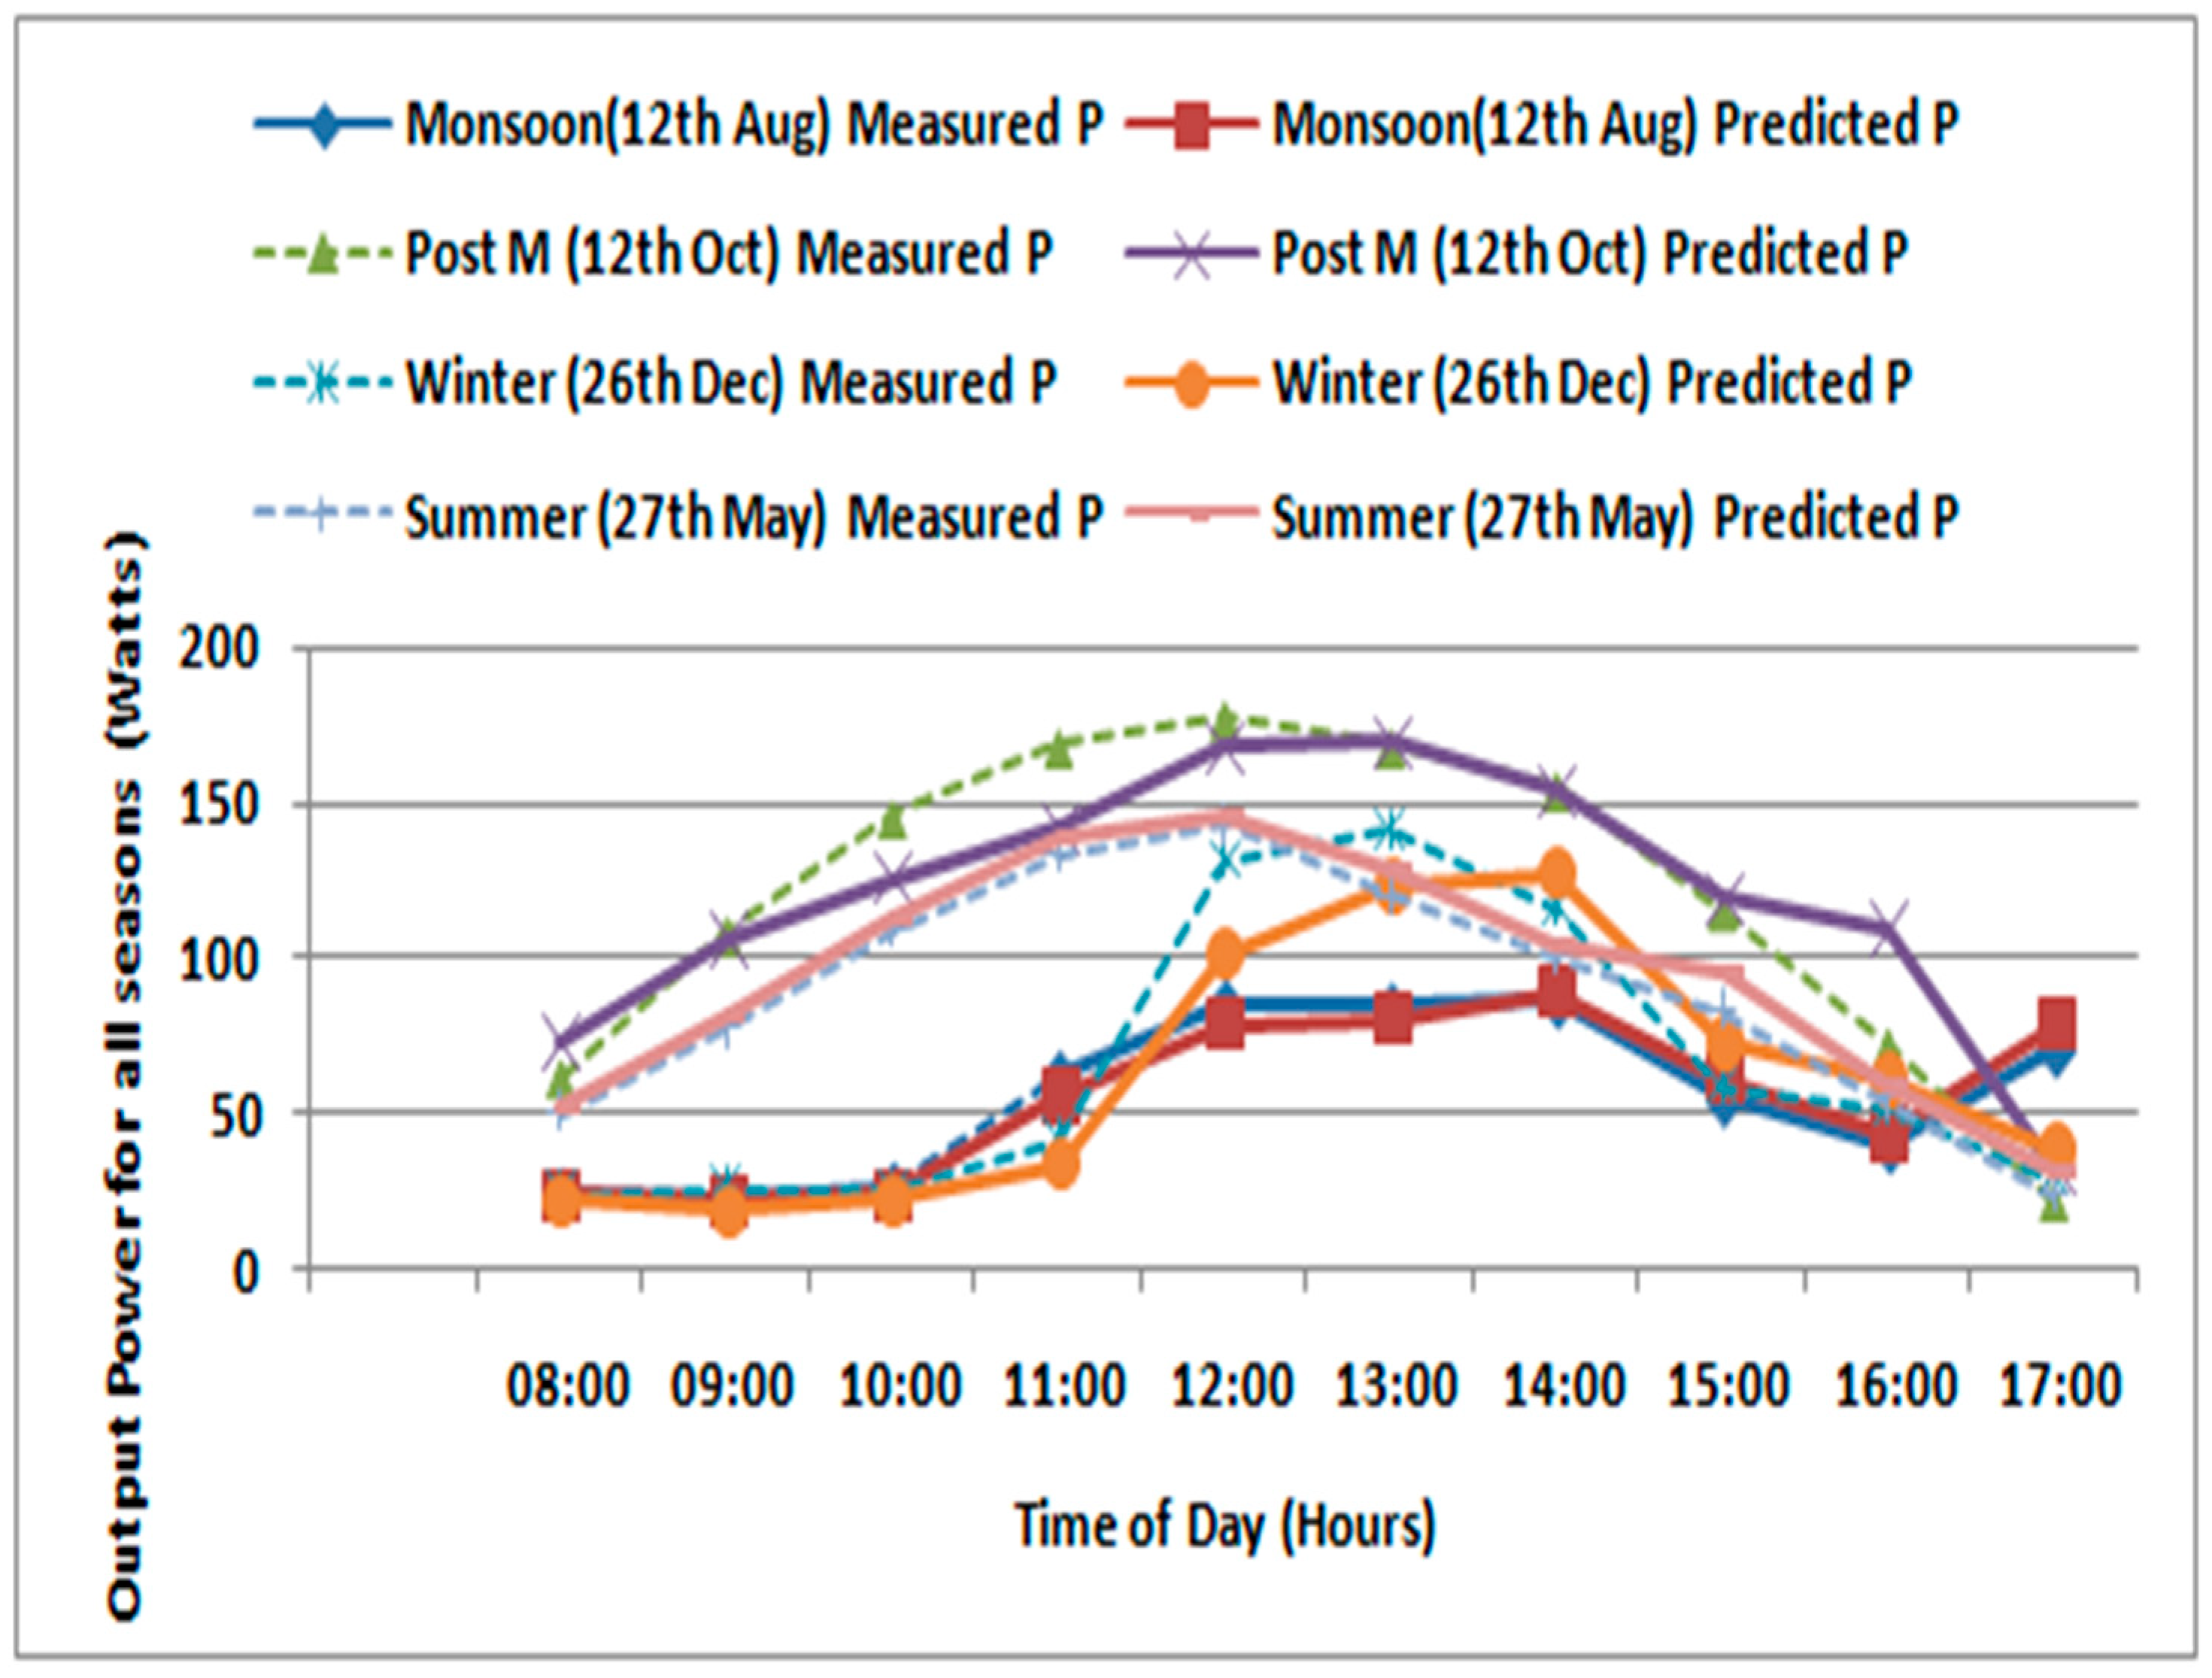
For analysis purposes, sample dates for the seasons were chosen as the 12 August for the monsoon, the 12 October for the post-monsoon, the 26 December for the winter, and the 27 May for the summer.
The measured and projected temperatures for the summer are shown in Figure 3. A single day from each season was chosen, and readings were obtained every ten minutes to simulate various weather conditions. The period of consideration for the same was from 8 AM to 5 PM. The graph shows that the observed and anticipated temperatures are closely related. The difference between measured and projected temperatures is depicted in Figure 4. If we look at a season-by-season graph, we can see that the observed and anticipated module temperatures are in line.
Figure 5 represents the difference in measured as well as predicted Pout for the summer season. Figure 6 compares the percentage power variations expected and empirically measured. The predicted or guessed total output power matches with the experimental total output power. Because of the strong four seasons in India, the graph plots for a particular season are drawn for mc-Si technology. However, the RMSE was used to quantify the difference between experimental and predicted values, and it is shown in Table 2.
It can be seen from the graphs in Figure 3, Figure 4, Figure 5 and Figure 6 that the winter season will have more variance because of the lower temperature. In contrast to poly- or mono-crystalline cells, amorphous silicon can sustain higher temperatures without affecting output. Due to this, the winter season’s root-mean-square error value is higher than its counterparts during the monsoon, post-monsoon, and summer seasons. Given that summer has the lowest root-mean-square value of the four seasons, it follows that mc-Si technology is best suited to summer.
When applying the linear regression approach suggested by Table 3, the root-mean-square power value is 3.84, which is less compared to the method suggested in the literature and it is 4.68 in the literature. Therefore, as compared to earlier work, the proposed method exhibits better results from the root-mean-square value.
5. Conclusions
The mathematically based study of a solar cell includes a nonlinear-type current and voltage characteristic with a number of unknown parameters. It may be believed that the information provided by the seller of solar modules is insufficient. Therefore, utilizing the error objective function between the estimated value and the observed value, the problem to be studied was reformatted. The problem’s goal was to lower the error function.
The current study examined how a multi-crystalline (mc-Si) technology module responds to seasonal variations in an Indian environment. With the use of mc-Si technology, this model was utilized to find out the temperature of solar modules placed on the site under a range of wind conditions. A qualitative analysis of the experimental data indicated that the temperature of the module reacts nonlinearly to the temperature, namely, ambient temperature and irradiance in windy conditions, leading to a notable variation in temperature. The analysis conducted throughout the estimation procedure revealed that the winter season, which exhibits a high RMSE in terms of temperature and power, is more sensitive to variations in the seasonal spectrum. It was shown that summer is the best season for mc-Si technology since it has the lowest root-mean-square value of the four seasons.
Author Contributions
Conceptualization, K.K., P.B. and D.M.; methodology, K.K. and D.M., software, K.K.; validation, K.K., P.B. and D.M.; formal analysis, K.K.; investigation, K.K., P.B. and D.M.; resources, K.K., P.B., and D.M.; data curation, K.K., P.B., and D.M.; writing—K.K., P.B. and D.M; visualization, K.K., P.B. and D.M.; supervision, P.B. and D.M.; project administration, K.K., P.B. and D.M. All authors have read and agreed to the published version of the manuscript.
Funding
No external funding.
Institutional Review Board Statement
Not applicable.
Informed Consent Statement
Not applicable.
Acknowledgments
The National Institute of Solar Energy (NISE), Gurgaon, India and Japan’s Advanced Industrial Science and Technology (AIST) are both to be thanked by the writers.
Conflicts of Interest
No conflict of interest.
References
- Gray, L.J.; Beer, J.; Geller, M.; Haigh, J.D.; Lockwood, M.; Matthes, K.; Cubasch, U.; Fleitmann, D.; Harrison, G.; Hood, L.; et al. Solar influence on climate. Rev. Geophys. 2010, 48, 1–53. [Google Scholar]
- Kelkar, R.R. Monsoons elsewhere in the world. In Monsoon Monograph; Government of India, Ministry of Earth Sciences, India Meteorological Department, 2012. Available online: https://rrkelkar.files.wordpress.com/2019/02/kelkar-2012.pdf (accessed on 1 January 2024).
- Prasanna, V. Impact of monsoon rain fall on the total food grain yield over India. J. Earth Syst. Sci. 2014, 123, 1129–1145. [Google Scholar]
- Parthasarathy, B.; Munot, A.A.; Kothawale, D.R. All India monthly and seasonal rain fall series:1871–1993. Theor. Appl. Climatol. 1995, 49, 217–224. [Google Scholar] [CrossRef]
- Hirata, Y.; Tani, T. Output variation of photovoltaic modules with environmental factors. Sol. Energy 1995, 55, 463–468. [Google Scholar] [CrossRef]
- Hirata, Y.; Inasaka, T.; Tani, T. Output variation of photovoltaic modules with environmental factors-II seasonal variation. Sol. Energy 1998, 63, 185–189. [Google Scholar] [CrossRef]
- Gottschalg, R.; Betts, T.R.; Infield, D.G.; Keamey, M.J. Experimental study of variations of the solar spectrum of relevance to thin film solar cells. Sol. Energy Mater. Sol. Cell 2003, 79, 527–537. [Google Scholar] [CrossRef]
- Gottschalg, R.; Infield, D.G.; Kearney, M.J. Influence of environmental conditions on outdoor performance of thin film devices. In Proceedings of the 17th European Photovoltaic Solar Energy Conference, Munich, Germany, 1 October 2001; pp. 796–799. [Google Scholar]
- Gottschalg, R.; Cueto, J.D.; Betts, T.R.; Williams, S.R.; Infield, D.G. Investigating the seasonal performance of amorphous silicon single and multi-junction modules. In Proceedings of the 3rd World Conference, Osaka, Japan, 11–18 May 2003; pp. 2078–2081. [Google Scholar]
- Dirnberger, D.; Blackburn, G.; Muller, B.; Reise, C. On the impact of solar spectral irradiance on the yield of different PV technologies. Sol. Energy Mater. Sol. Cells 2015, 132, 431–442. [Google Scholar] [CrossRef]
- Dirnberger, D.; Muller, B.; Reise, C. On the uncertainty of energetic impact on the yield of different PV technologies due to varying spectral irradiance. Sol. Energy 2015, 111, 82–96. [Google Scholar] [CrossRef]
- Nakada, Y.; Fukushige, S.; Minemoto, T.; Takakura, H. Seasonal variation analysis of the outdoor performance of amorphous Si photovoltaic modules using the contour map. Sol. Energy Mater. Sol. Cells 2009, 93, 334–337. [Google Scholar] [CrossRef]
- Minemoto, T.; Nagae, S.; Takakura, H. Impact of spectral irradiance distribution and temperature on the outdoor performance of amorphous Si photovoltaic modules. Sol. Energy Mater. Sol. Cells 2007, 91, 919–923. [Google Scholar]
- Jawaharlal Nehru National Solar Mission. Ministry of New and Renewable Energy Government of India, 2010; pp. 1–15. Available online: http://www.mnre.gov.in/filemanager/UserFiles/mission_document_JNNSM.pdf (accessed on 20 June 2015).
- Magare, D.; Sastry, O.S.; Gupta, R.; Kumar, A.; Sinha, A. Data Logging Strategy of Photovoltaic (PV Module Test Beds. In Proceedings of the 27th European Photovoltaic Solar Energy Conference (EUPVSEC), Frankfurt, Germany, 24–28 September 2012; pp. 3259–3262. [Google Scholar]
- Magare, D.; Sastry, O.; Gupta, R.; Bora, B.; Singh, Y.; Mohammed, H. Wind Effect Modeling and Analysis for Estimation of Photovoltaic Module Temperature. J. Sol. Energy Eng. 2017, 140, 011008. [Google Scholar] [CrossRef]
- Lekouaghet, B.; Boukabou, A.; Boubakir, C. Estimation of the photovoltaic cells/modules parameters using an improved Rao-based chaotic optimization technique. Energy Convers. Manag. 2021, 229, 113722. [Google Scholar] [CrossRef]
- Ortiz-Conde, A.; Trejo, O.; Garcia-Sanchez, F.J. Direct extraction of solar cell model parameters using optimization methods. In Proceedings of the IEEE Latin America Electron Devices Conference (LAEDC), Mexico, 19–21 April 2021; pp. 1–6. [Google Scholar] [CrossRef]
- Kanekar, K.D.; Agrawal, R.; Magare, D. Different Meta-Heuristic Optimization Techniques and Application in Solar Photovoltaic Field: A Renewable Energy Source. In Optimal Planning of Smart Grid with Renewable Energy Resources; IGI Global: Hershey, PA, USA, 2022; pp. 1–37. [Google Scholar]
- Montalvo-Galicia, F.; Sanz-Pascual, M.T.; Rosales-Quintero, P.; Moreno-Moreno, M. Parameter extraction method for the two-diode solar cell model. In Proceedings of the IEEE 65th International Midwest Symposium on Circuits and Systems (MWSCAS), Fukuoka, Japan, 7–10 August 2022; pp. 1–4. [Google Scholar] [CrossRef]
Figure 1.
Test setup modules at NISE, India [16].
Figure 1.
Test setup modules at NISE, India [16].
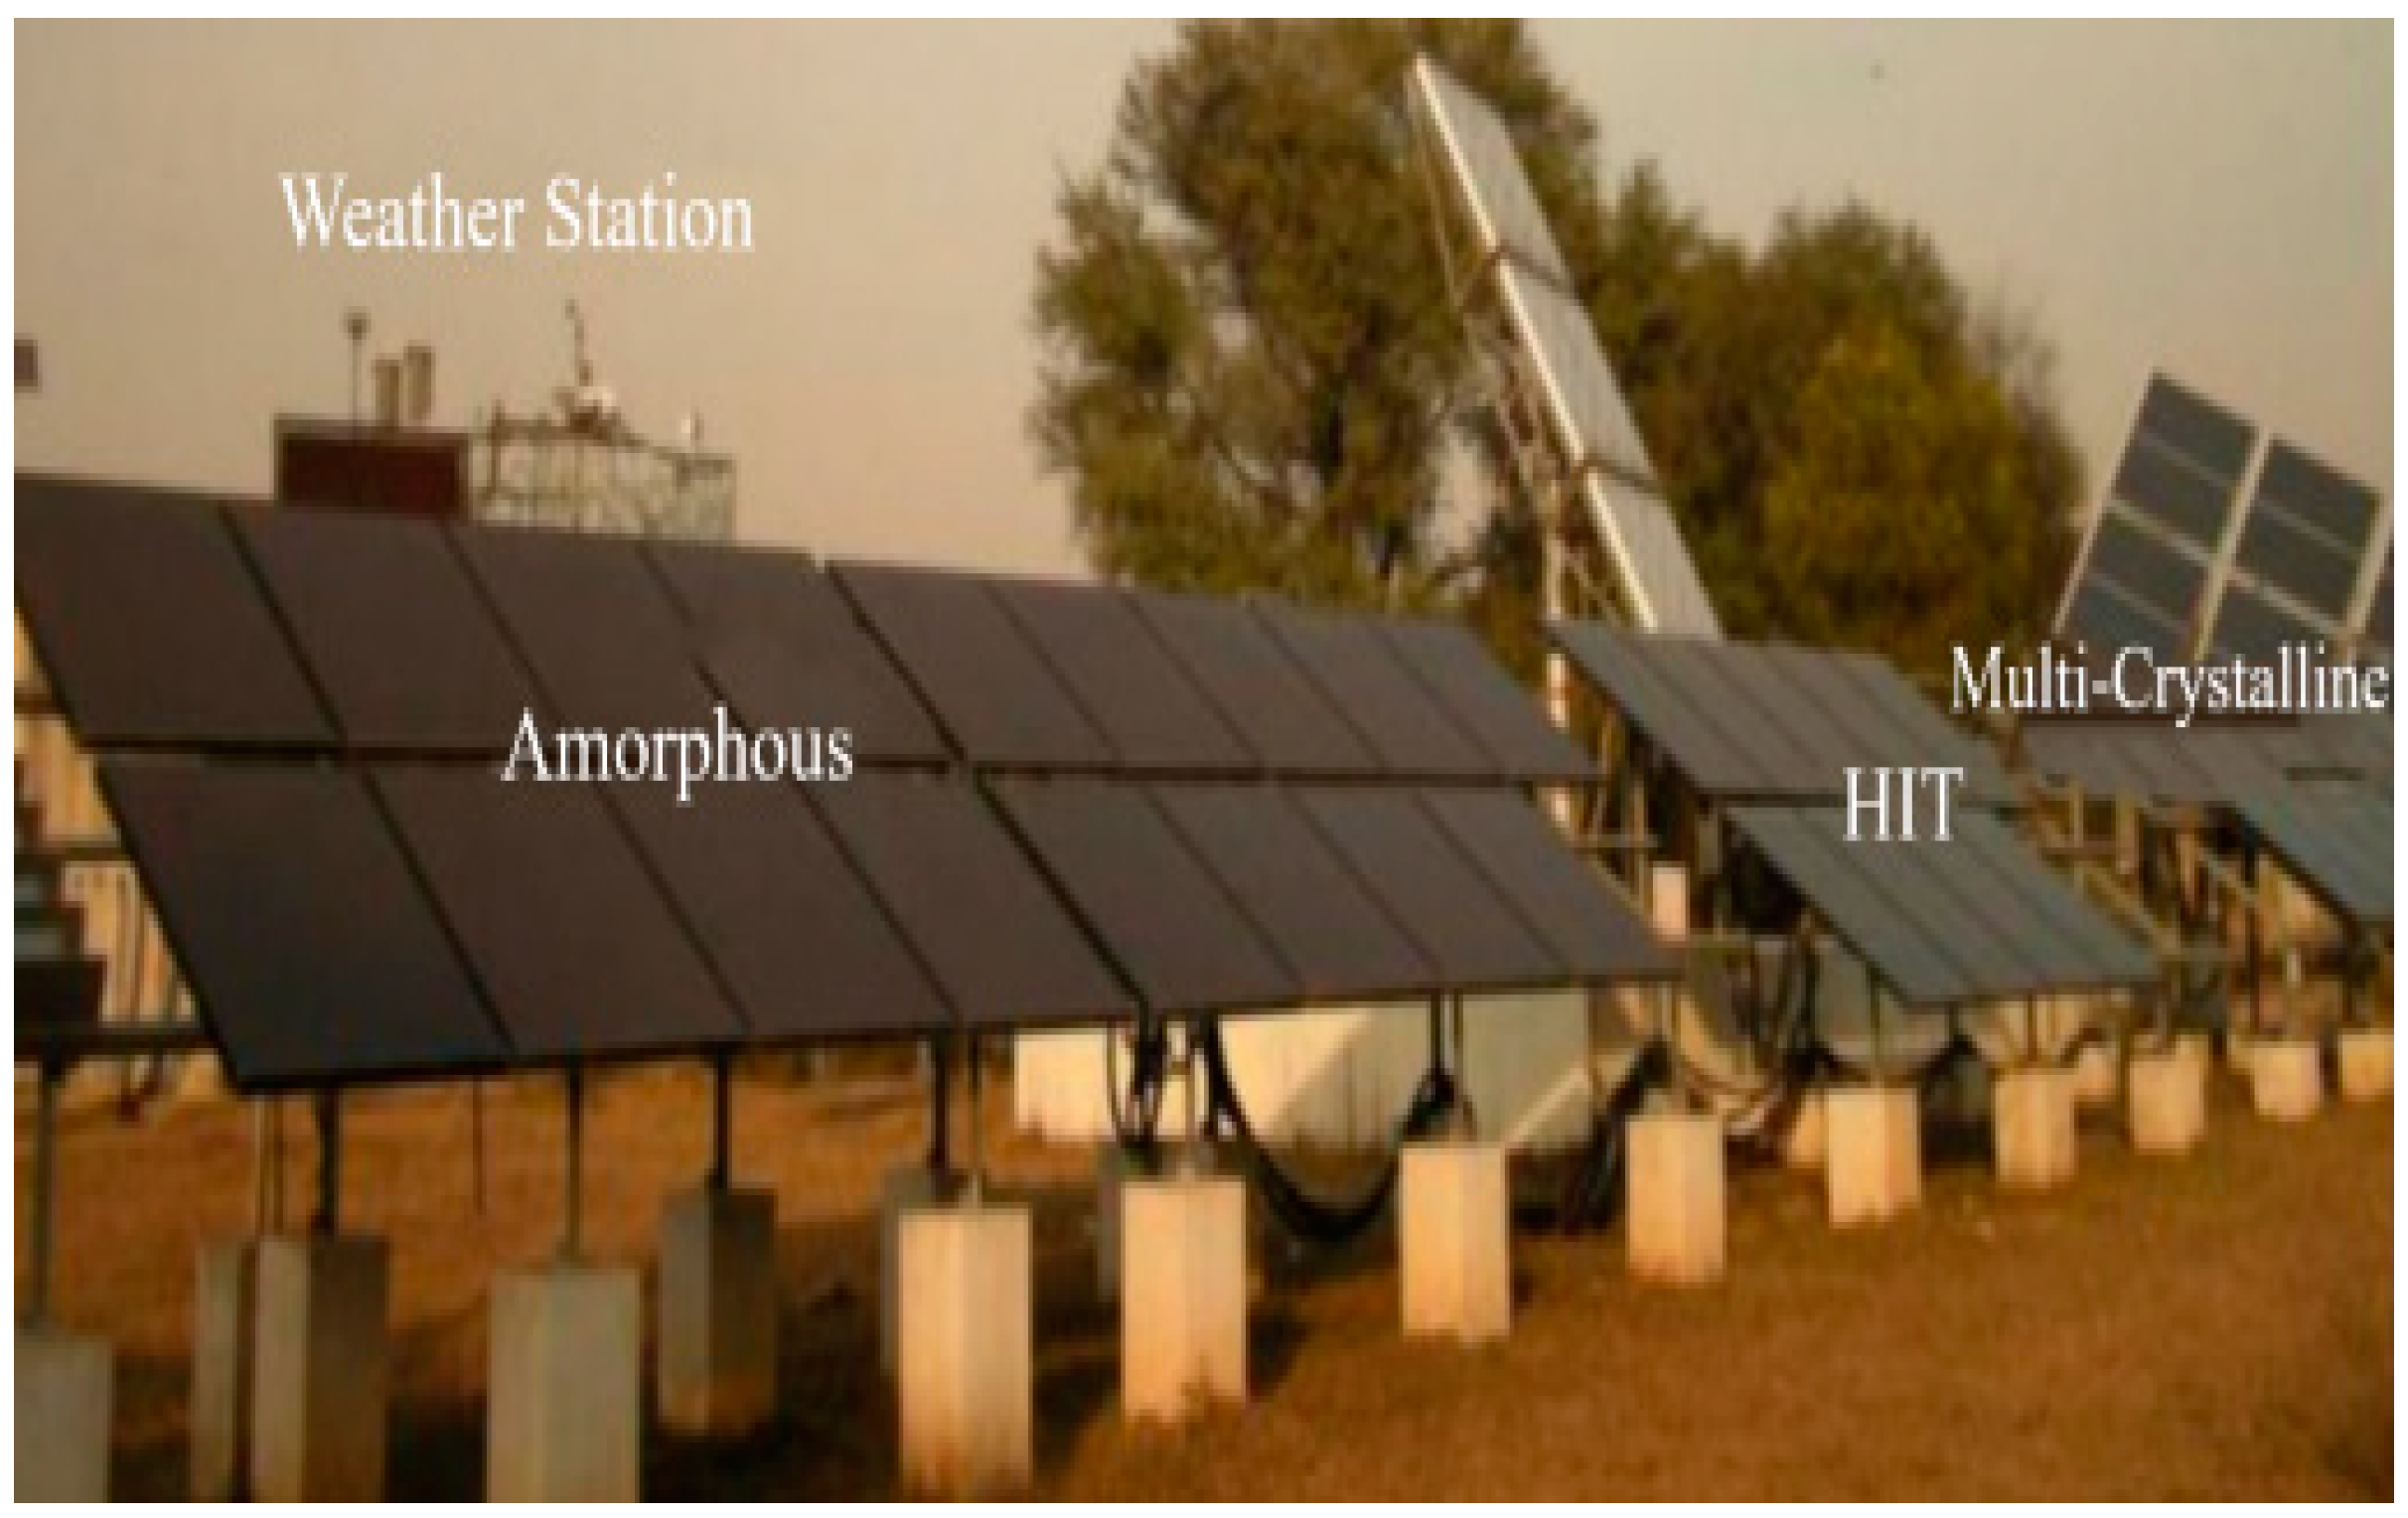
Figure 2.
Experimental setup of PV module [16].
Figure 2.
Experimental setup of PV module [16].
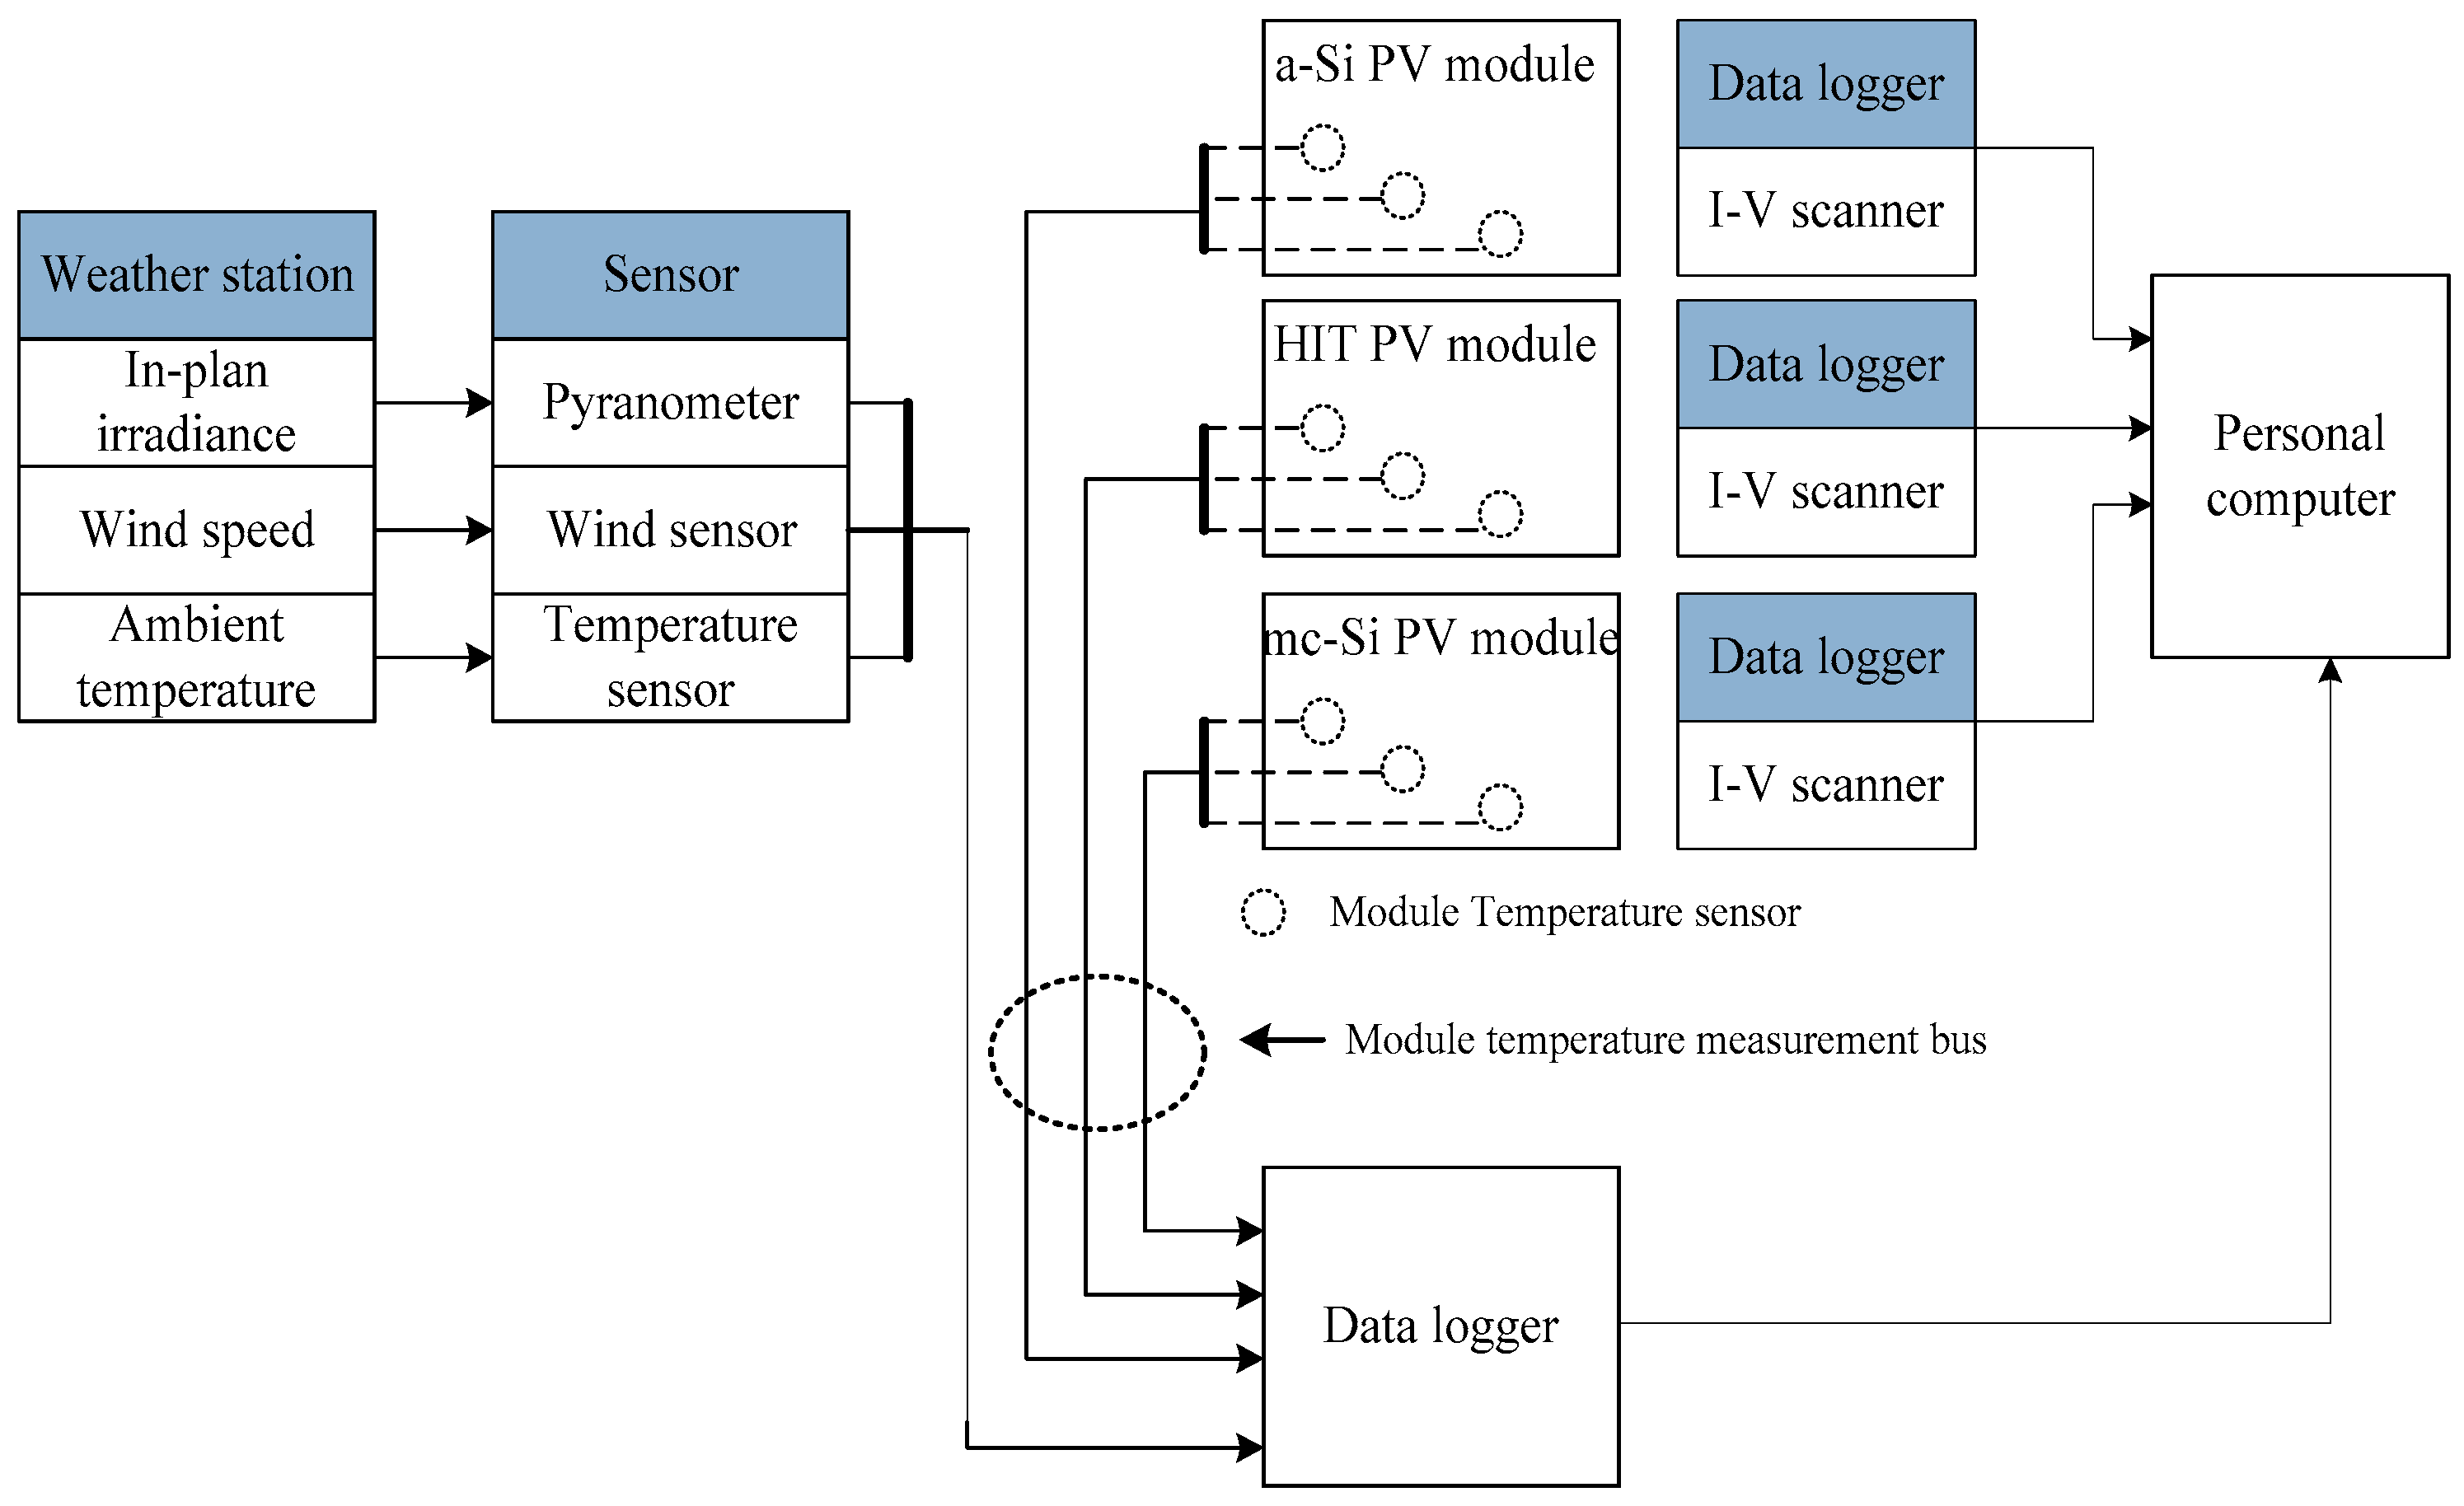
Figure 3.
Measured and predicted temperature for summer season.
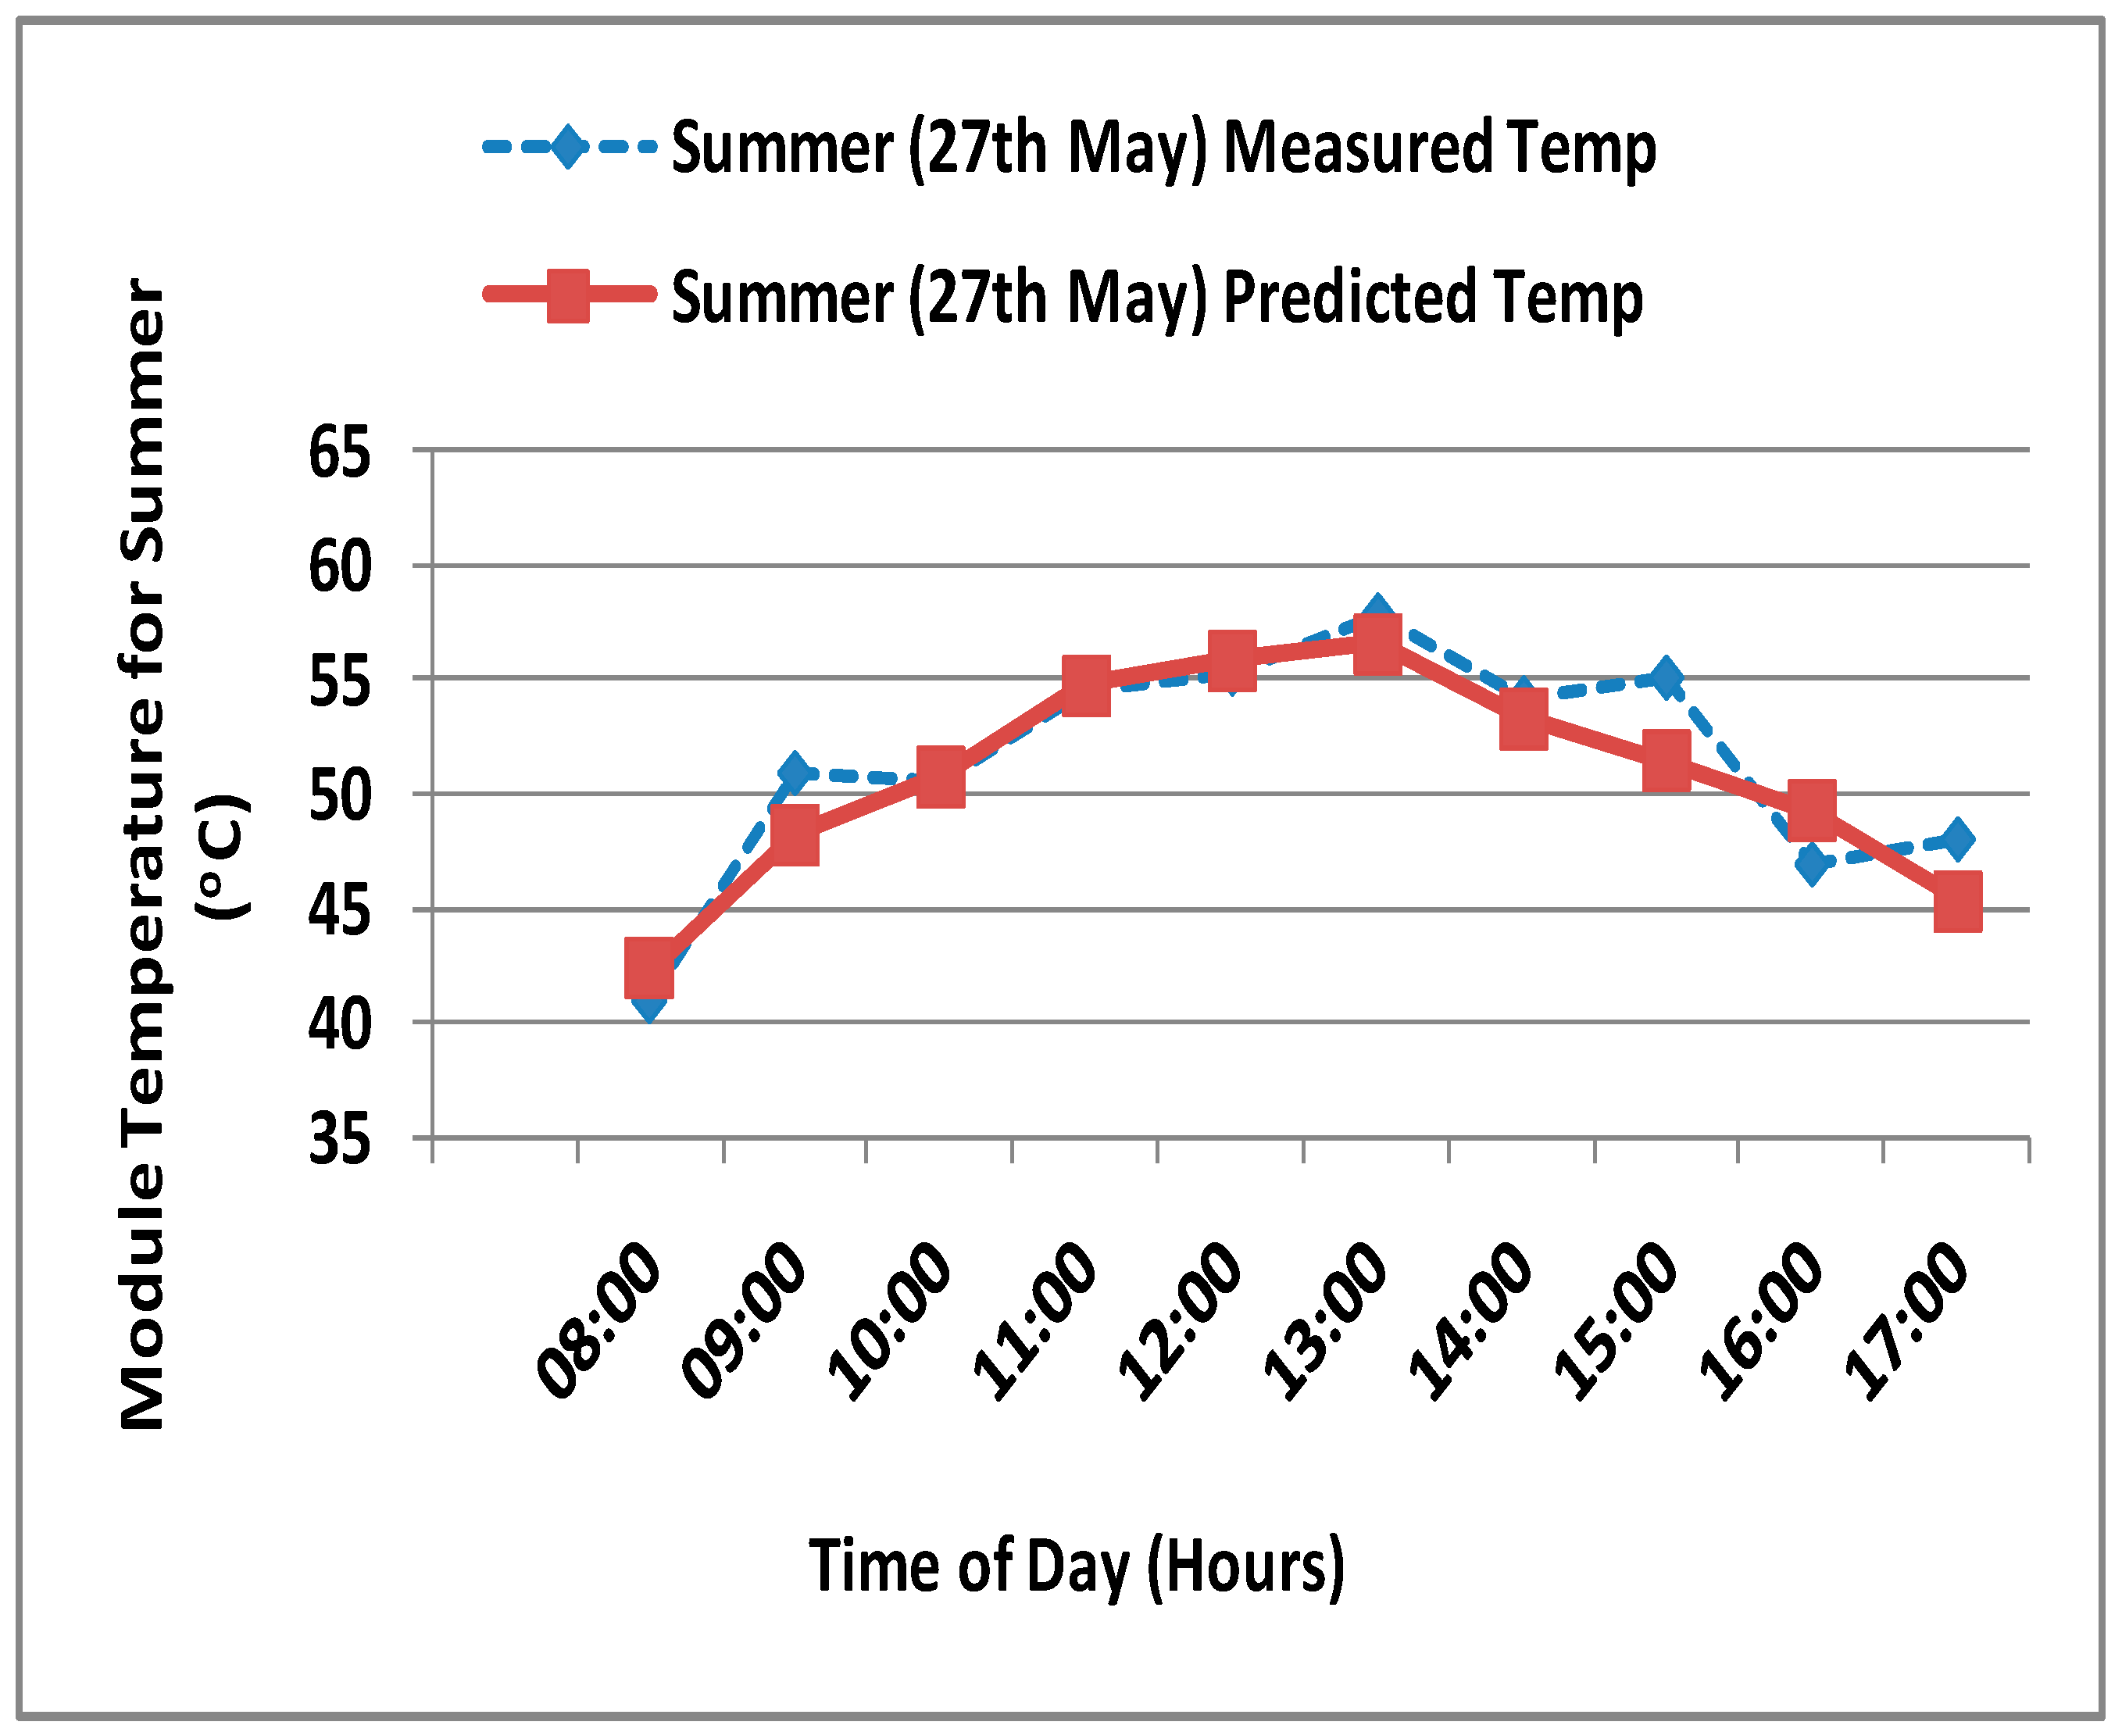
Figure 4.
Season-wise measured and predicted temperature.
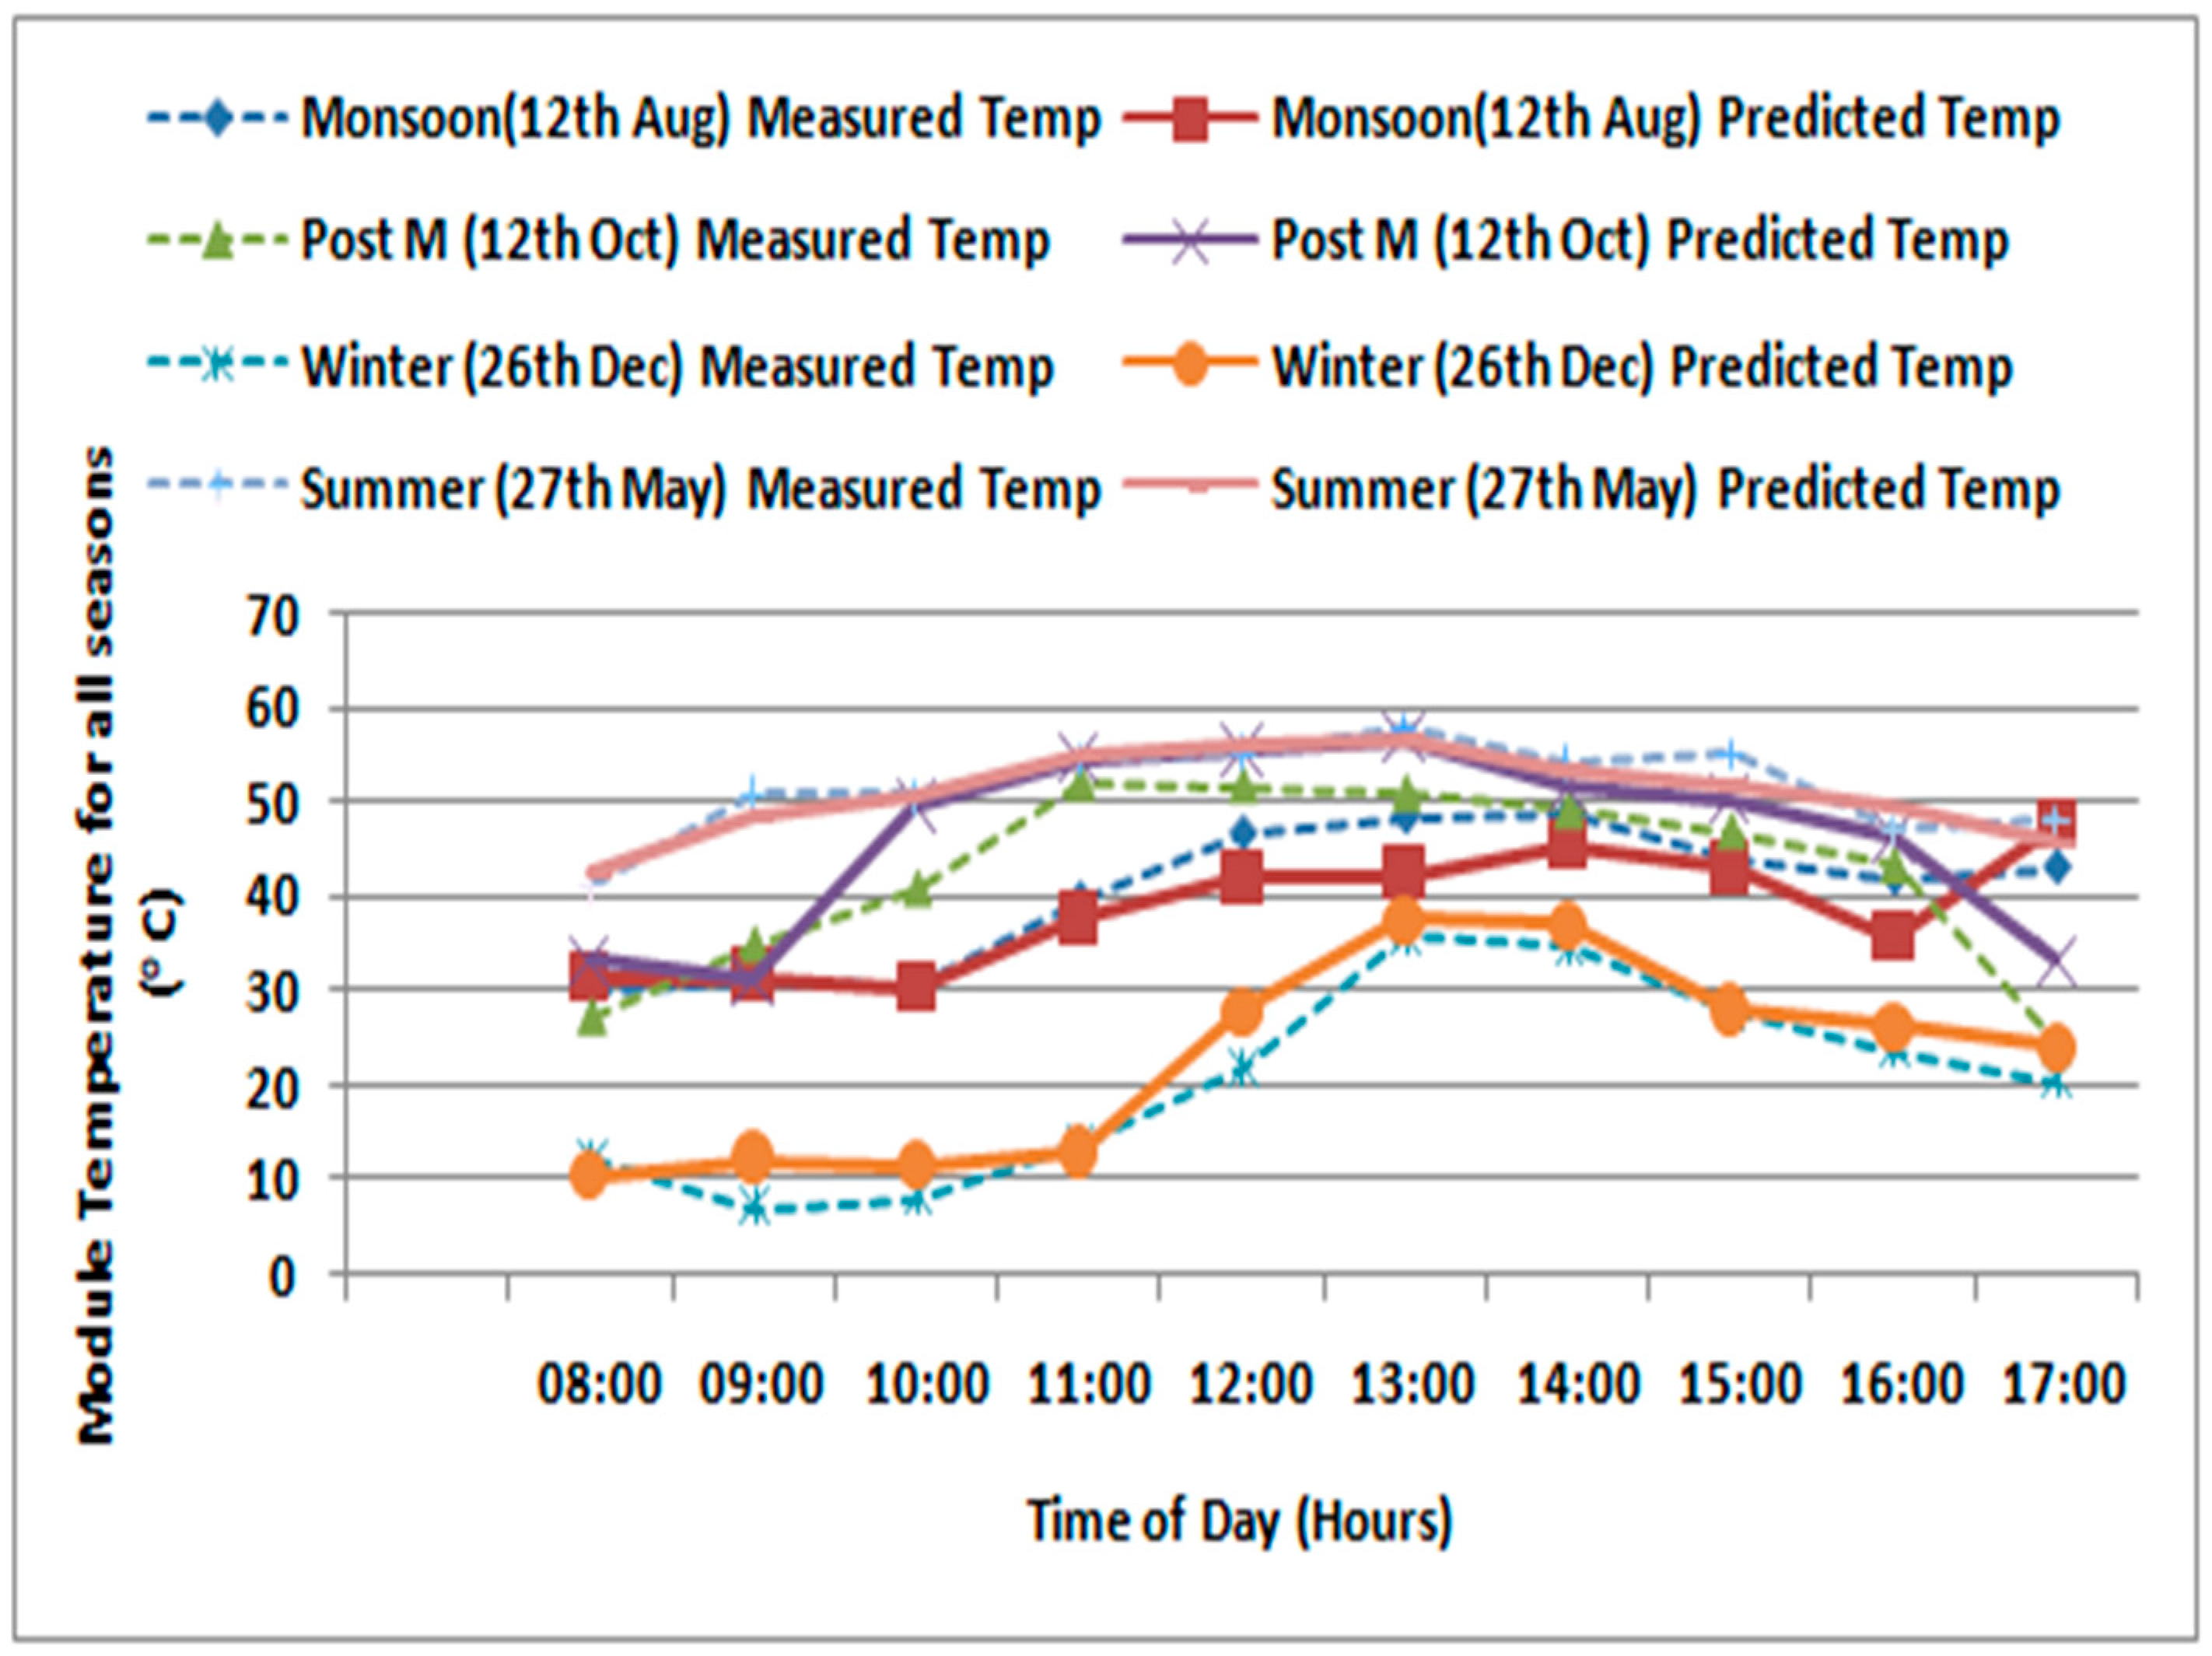
Figure 5.
Experimental and predicted Pout for summer season.
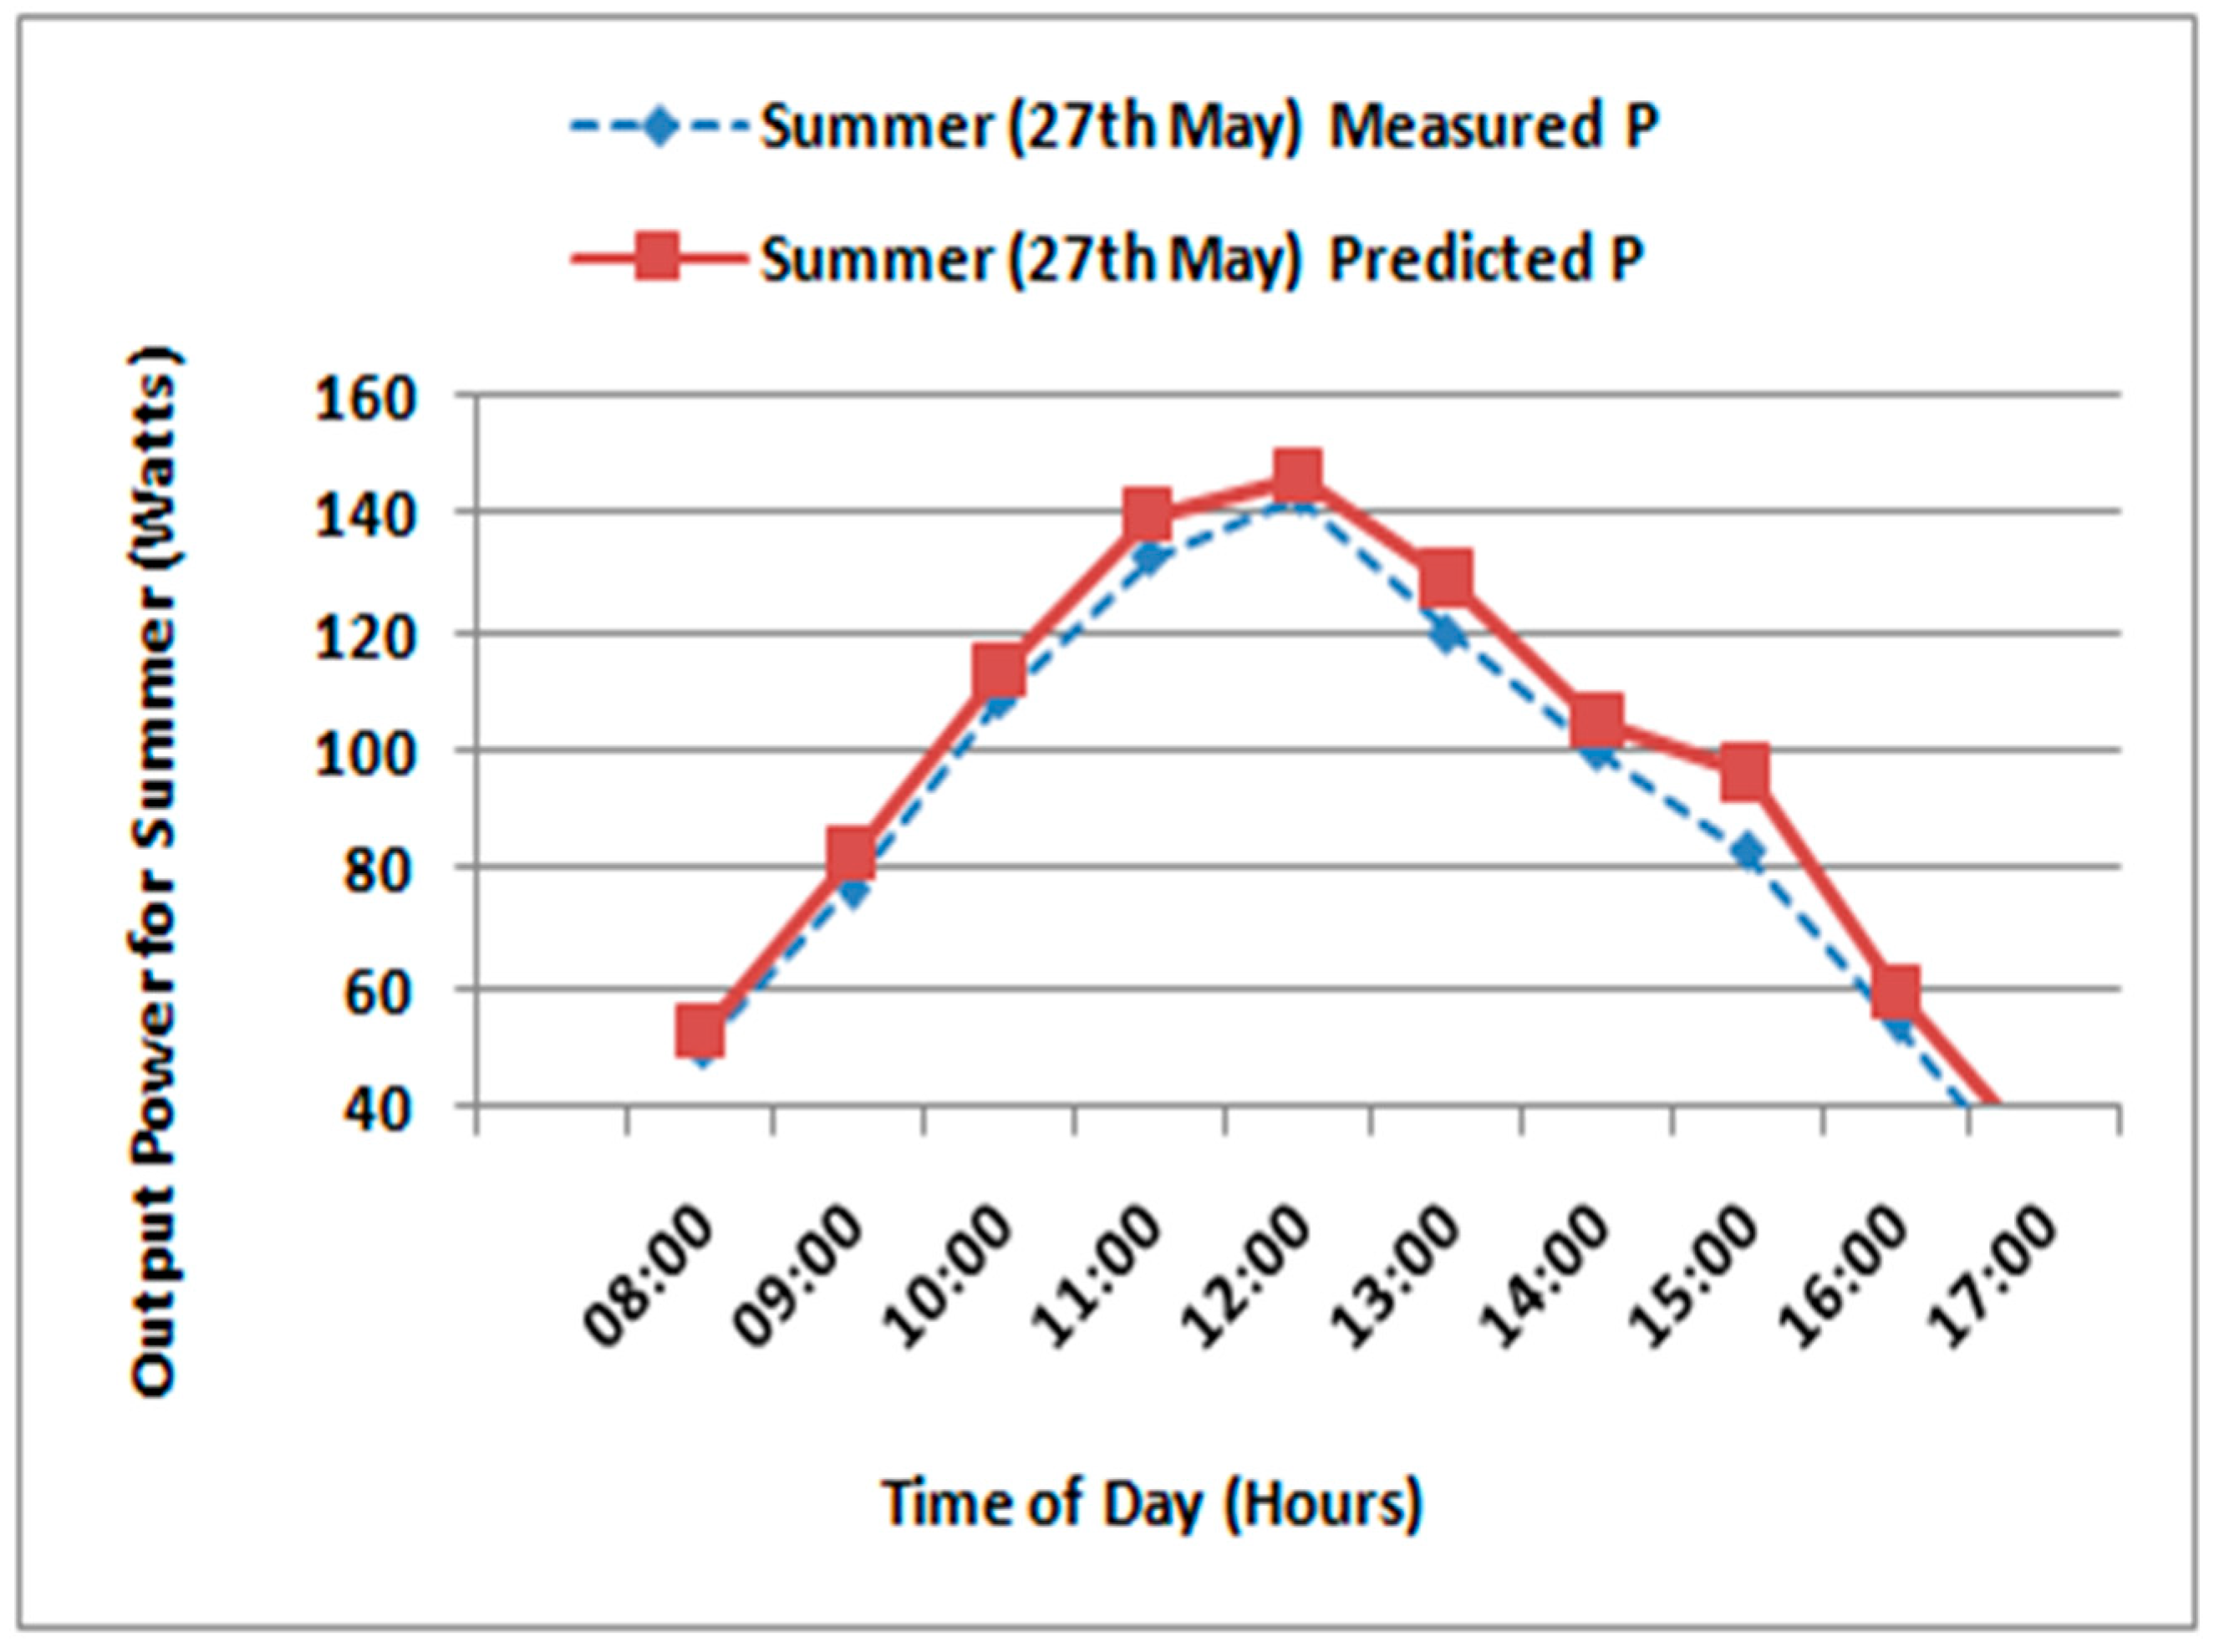
Figure 6.
Experimental and predicted Pout for various seasons.

Table 1.
Model coefficients for different seasons.
| Coefficients | Monsoon | Post Monsoon | Winter | Summer |
|---|---|---|---|---|
| Power Coefficient (a1) | −0.0076 | −0.2615 | −0.0113 | −0.0053 |
| Power Coefficient (a2) | 0.0035 | 0.0013 | 0.04166 | 0.003 |
| Irradiance (a3) | 0.024 | 0.0375 | 0.0254 | 0.0309 |
| Ambient temperature (a4) | 1.23 | 1.175 | 1.142 | 1.0422 |
| Wind Speed(a5) | −1.0327 | −2.4569 | −1.3112 | −1.0113 |
| Constant (a6) | −9.8155 | −2.1883 | −1.8169 | −0.5167 |
Table 2.
RMSE for temperature and power for mc-Si Technology.
| Seasons | RMSE of Module Temperature | RMSE of Power |
|---|---|---|
| Monsoon | 3.9026 | 3.6532 |
| Post Monsoon | 4.7126 | 3.7391 |
| Winter | 4.4333 | 3.8425 |
| Summer | 4.9832 | 4.1264 |
Table 3.
Power RMSE for mc-Si technology with respect to literature and proposed method.
| Active Module Area, A (m2) | Module Power PSTC (W) | Temperature Coefficient of Power (%/°C) | Power RMSE by Literature Method | Power RMSE by Proposed Method |
|---|---|---|---|---|
| 1.01 | 160 | −0.49 | 4.68 | 3.84 |
Disclaimer/Publisher’s Note: The statements, opinions and data contained in all publications are solely those of the individual author(s) and contributor(s) and not of MDPI and/or the editor(s). MDPI and/or the editor(s) disclaim responsibility for any injury to people or property resulting from any ideas, methods, instructions or products referred to in the content. |
© 2024 by the authors. Licensee MDPI, Basel, Switzerland. This article is an open access article distributed under the terms and conditions of the Creative Commons Attribution (CC BY) license (https://creativecommons.org/licenses/by/4.0/).
Share and Cite
MDPI and ACS Style
Kanekar, K.; Burade, P.; Magare, D. Seasonal Analysis of Silicon Photovoltaic Technology Module. Eng. Proc. 2023, 59, 184. https://doi.org/10.3390/engproc2023059184
AMA Style
Kanekar K, Burade P, Magare D. Seasonal Analysis of Silicon Photovoltaic Technology Module. Engineering Proceedings. 2023; 59(1):184. https://doi.org/10.3390/engproc2023059184
Chicago/Turabian StyleKanekar, Krupali, Prakash Burade, and Dhiraj Magare. 2023. "Seasonal Analysis of Silicon Photovoltaic Technology Module" Engineering Proceedings 59, no. 1: 184. https://doi.org/10.3390/engproc2023059184