Proceeding Paper

Feasibility Analysis of Tamura Features in the Identification of Machined Surface Images Using Machine Learning and Image Processing Techniques †

1
Department of Mechanical and Industrial Engineering, Manipal Institute of Technology, Manipal Academy of Higher Education, Manipal 576104, Karnataka, India
2
Department of Artificial Intelligence and Machine Learning, Shri Madhwa Vadiraja Institute of Technology and Management, Vishwothama Nagar, Bantakal 574115, Karnataka, India
*
Author to whom correspondence should be addressed.
Presented at the International Conference on Recent Advances on Science and Engineering, Dubai, United Arab Emirates, 4–5 October 2023.
Eng. Proc. 2023, 59(1), 92; https://doi.org/10.3390/engproc2023059092
Published: 19 December 2023
(This article belongs to the Proceedings of Eng. Proc., 2023, RAiSE-2023)

Abstract

:
In modern manufacturing industries with Industry 4.0 capabilities, the automated identification and classification of machined surfaces based on their texture will play a crucial role. Texture analysis through computer vision, image processing, classification using artificial neural networks (ANN), and various machine learning techniques have been prominent research areas in recent decade. Tamura features are very popular in selecting optimum textural features from an image, especially in the medical domain. These textural features correspond to human visual perception and play a significant role in identifying and shortlisting the best features from the photographs. Despite the popularity of Tamura features in the medical domain, their usage in extracting the features from machined surface photographs is seldom reported. Hence, the present study investigates the feasibility of using Tamura features to classify machined surface images produced using turning, milling, grinding, and shaping operations in manufacturing. Photographs of the surfaces produced are obtained using smartphone cameras. Further, the photographs are preprocessed and divided into sixteen different portions. Then, Tamura features are extracted and are given as input to ANN, support vector machines (SVM), K-Nearest Neighbor (KNN), Decision Tree (DT), and Random Forest (RF). The result shows that each machine learning (ML) algorithm performs differently while classifying the same set of machined surface images. Amongst the ML algorithms considered in the study, RF classified the photographs of surfaces machined using different machining operations with the highest accuracy. On the other hand, SVM performed poorly.

1. Introduction

A picture or image is a two-dimensional function called f (x, y), where x and y are coordinates in the spatial plane. The intensity of the image at any given level is equal to the amplitude of f at any given pair of coordinates (x, y) [1]. A digital image has discrete, finite values for the variables x, y, and amplitude. A digital picture is a binary image split into a matrix of pixels, each with a digital value of one or more bits, specified by the bit depth. Analog images, such as photographs, are represented by a continuous shift in tone. Electrical approaches are well-known for modifying visuals. In analog image processing, analog signals can be non-periodic, which means they vary without showing any pattern, or periodic, which means they are simple and contain numerous sine waves. A cathode-ray tube television is an example of analog image processing since it sends, transforms, and projects an electrical signal onto the screen as a series of pictures [2]. Digital image processing, on the other hand, comprises retrieving and storing picture data as computer data to interpret, analyze, extract, and retrieve the image using computer products (such as phones, digital cameras, computers, and current televisions). Image processing is a technique for enhancing or extracting information from a photograph by applying procedures to a photograph. It is a form of signal processing where an image serves as the input, and the picture or its traits/features serve as the output. Image processing is one of the technologies that is evolving the most quickly nowadays [3,4]. Additionally, it is a crucial topic for engineering and computer science study. The following are the three stages of image processing [5]:
-
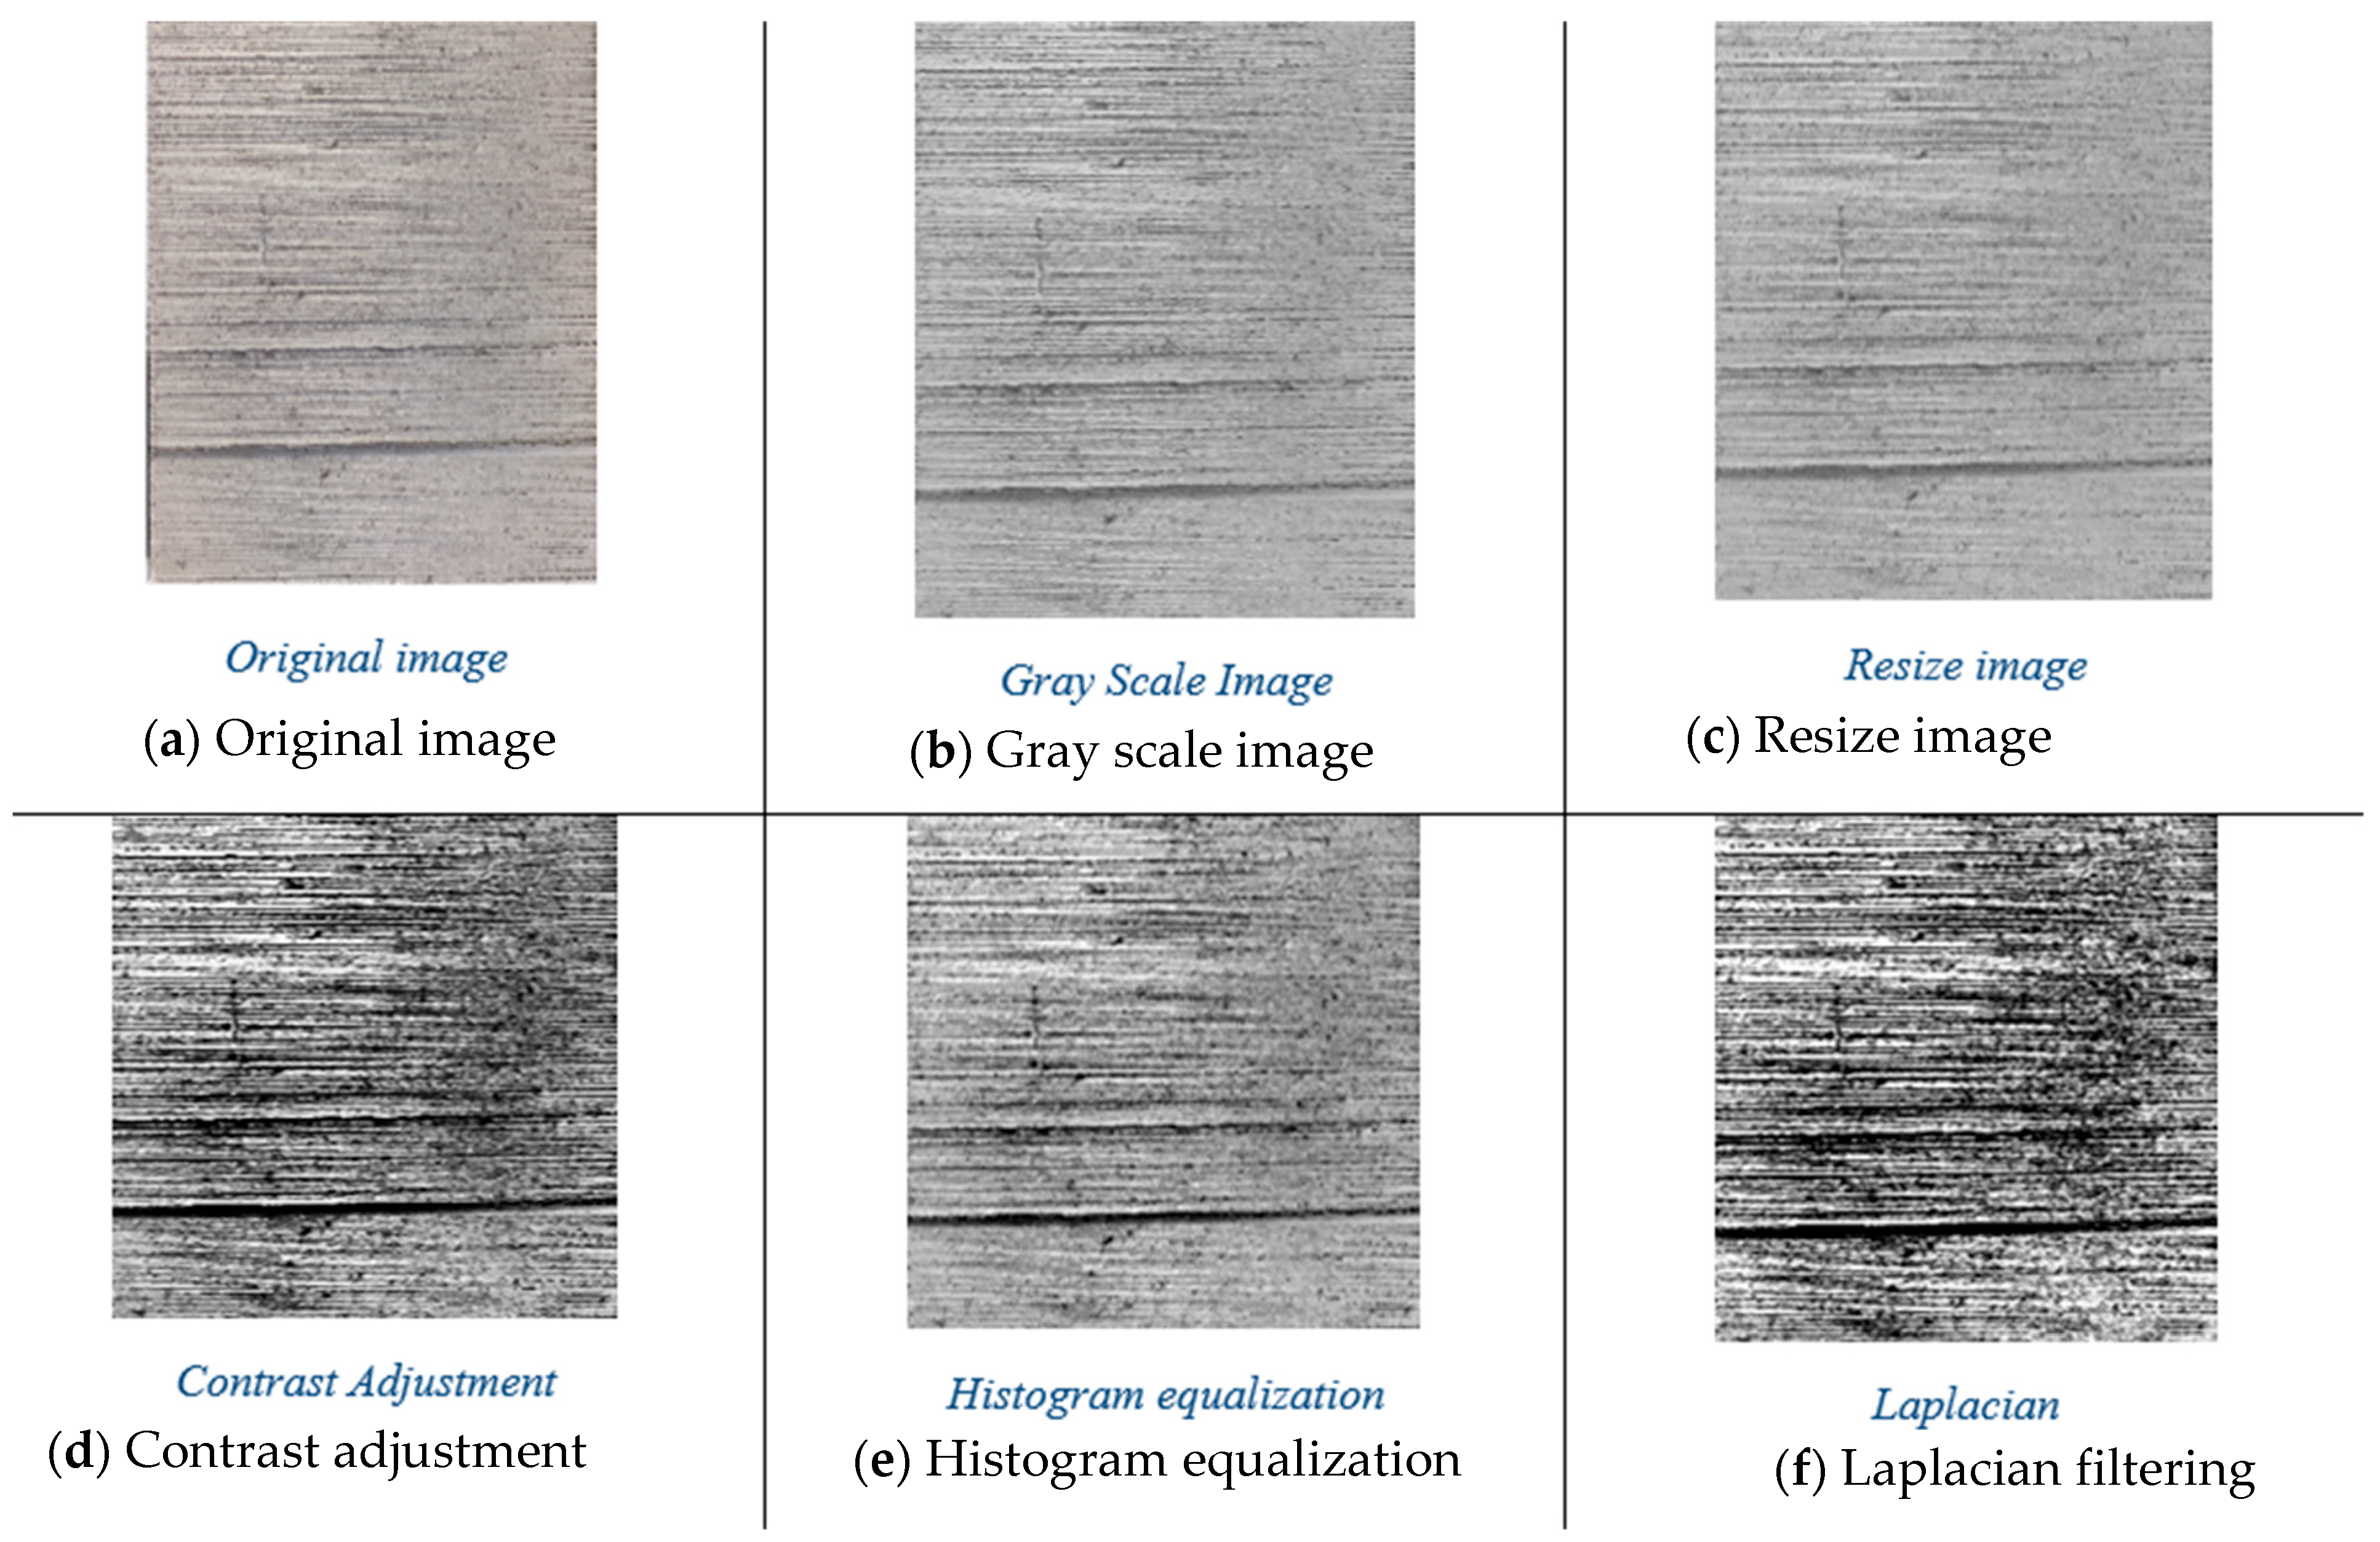
Using image acquisition tools to import the image;
-
Examining and modifying the image;
-
Outputting from image analysis that can potentially provide changed images or reports.
When employing these visual aids, image analysts employ a variety of interpretation criteria. On computers, digital image processing methods are used to modify digital photos. Digital image processing (DIP) includes picture enhancement, image restoration, image analysis, and image compression, to name a few [6,7].

Tamura Textural Features

Tamura and colleagues introduced a set of perceptual texture features for human vision derived from psychological experiments. The mathematical definitions of the Tamura features are given in Table 1.
Here, m and n denote the size of images, s b i , j represents the neighborhood from center pixel having the highest average intensity, α 4 is the kurtosis, σ is the standard deviation of intensity histogram, n is a positive number, HD represents bar graph degree, np denotes count of peaks, = 180°, and r is the normalized factor. The coarseness is the measure of the size of the texels composing the texture. The contrast represents the measure of polarization, and directionality is the measure of the frequency distribution of local edges oriented against their directional angle [8].
The manufacturing sector has undergone significant transformations, evolving from the first industrial revolution (Industry 1.0) to the current Industry 4.0 era, driven by remarkable technological advancements in rapidly developing fields like computing, image processing (IP), automation, machine vision, ML, as well as the integration of big data and the Internet of Things (IoT). In Industry 4.0, machine tools are expected to possess the capability to autonomously identify the materials they are handling, enabling them to make and execute necessary decisions as required autonomously [9,10]. Machined surface texture identification is of the utmost importance in production firms, as it helps to measure the roughness of the surface. Various methods have been used for surface texture identification by earlier researchers [11,12,13]. However, the Tamura features are considered one of the essential features in identifying patterns, which is not studied in determining surface texture [8,14]. Thus, the study aims to explore the applicability of Tamura features in identifying surface texture. Four different surface texture images were obtained from turning, milling, grinding, and shaping operations to check the feasibility of Tamura features. The images are preprocessed and given as input to different classification models to identify surface textures. The comprehensive procedure involved in the work is presented in Figure 1.

2. Methodology

The experiment procedures involved the use of a shaping machine, vertical milling machine, CNC lathe machine, and surface grinding machine. A mild steel rectangular block of 200 mm length by 50 mm width was divided into three approximately equal rectangular blocks of 66 mm length by 50 mm width for milling, shaping, and surface grinding operations. However, 50 mm-diameter and 200 mm-length cylindrical mild steel workpieces were taken for the CNC turning operation. After machining for a particular duration/length, the machine was stopped, and machined surface images were captured with a One Plus 7 mobile phone 48-megapixel camera in a daylight environment without any extra accessories.
The captured images were then transferred to a Lenovo Idea pad laptop with 16 GB RAM to preprocess the images. The MATLAB software was used for preprocessing the captured images. Photos were captured in RGB format for each of the four classes and then converted to grayscale. They were then scaled to 1600 × 1600-pixel resolution. After analyzing the texture’s characteristics, the contrast was adjusted appropriately to improve the image’s quality. To change the strength of the grey levels, histogram equalization was used. The Laplacian filter was then used for further filtering to determine the surface texture. To increase the number of images given as input to different models and to generalize the developed model, the picture was split into 16 pieces [15]. Four classes, including 27 × 16 × 4 partitions, gave us 1728 images. The various DIP steps implemented in the work are shown in Figure 2.
The four different Tamura features (Table 1) were extracted from preprocessed images. These feature vectors of size 1728 × 4 were given as input to different classification models. As each feature varied in magnitude, the normalization of the feature was essential. The features were normalized as per Equation (1).
x n o r = x x m a x

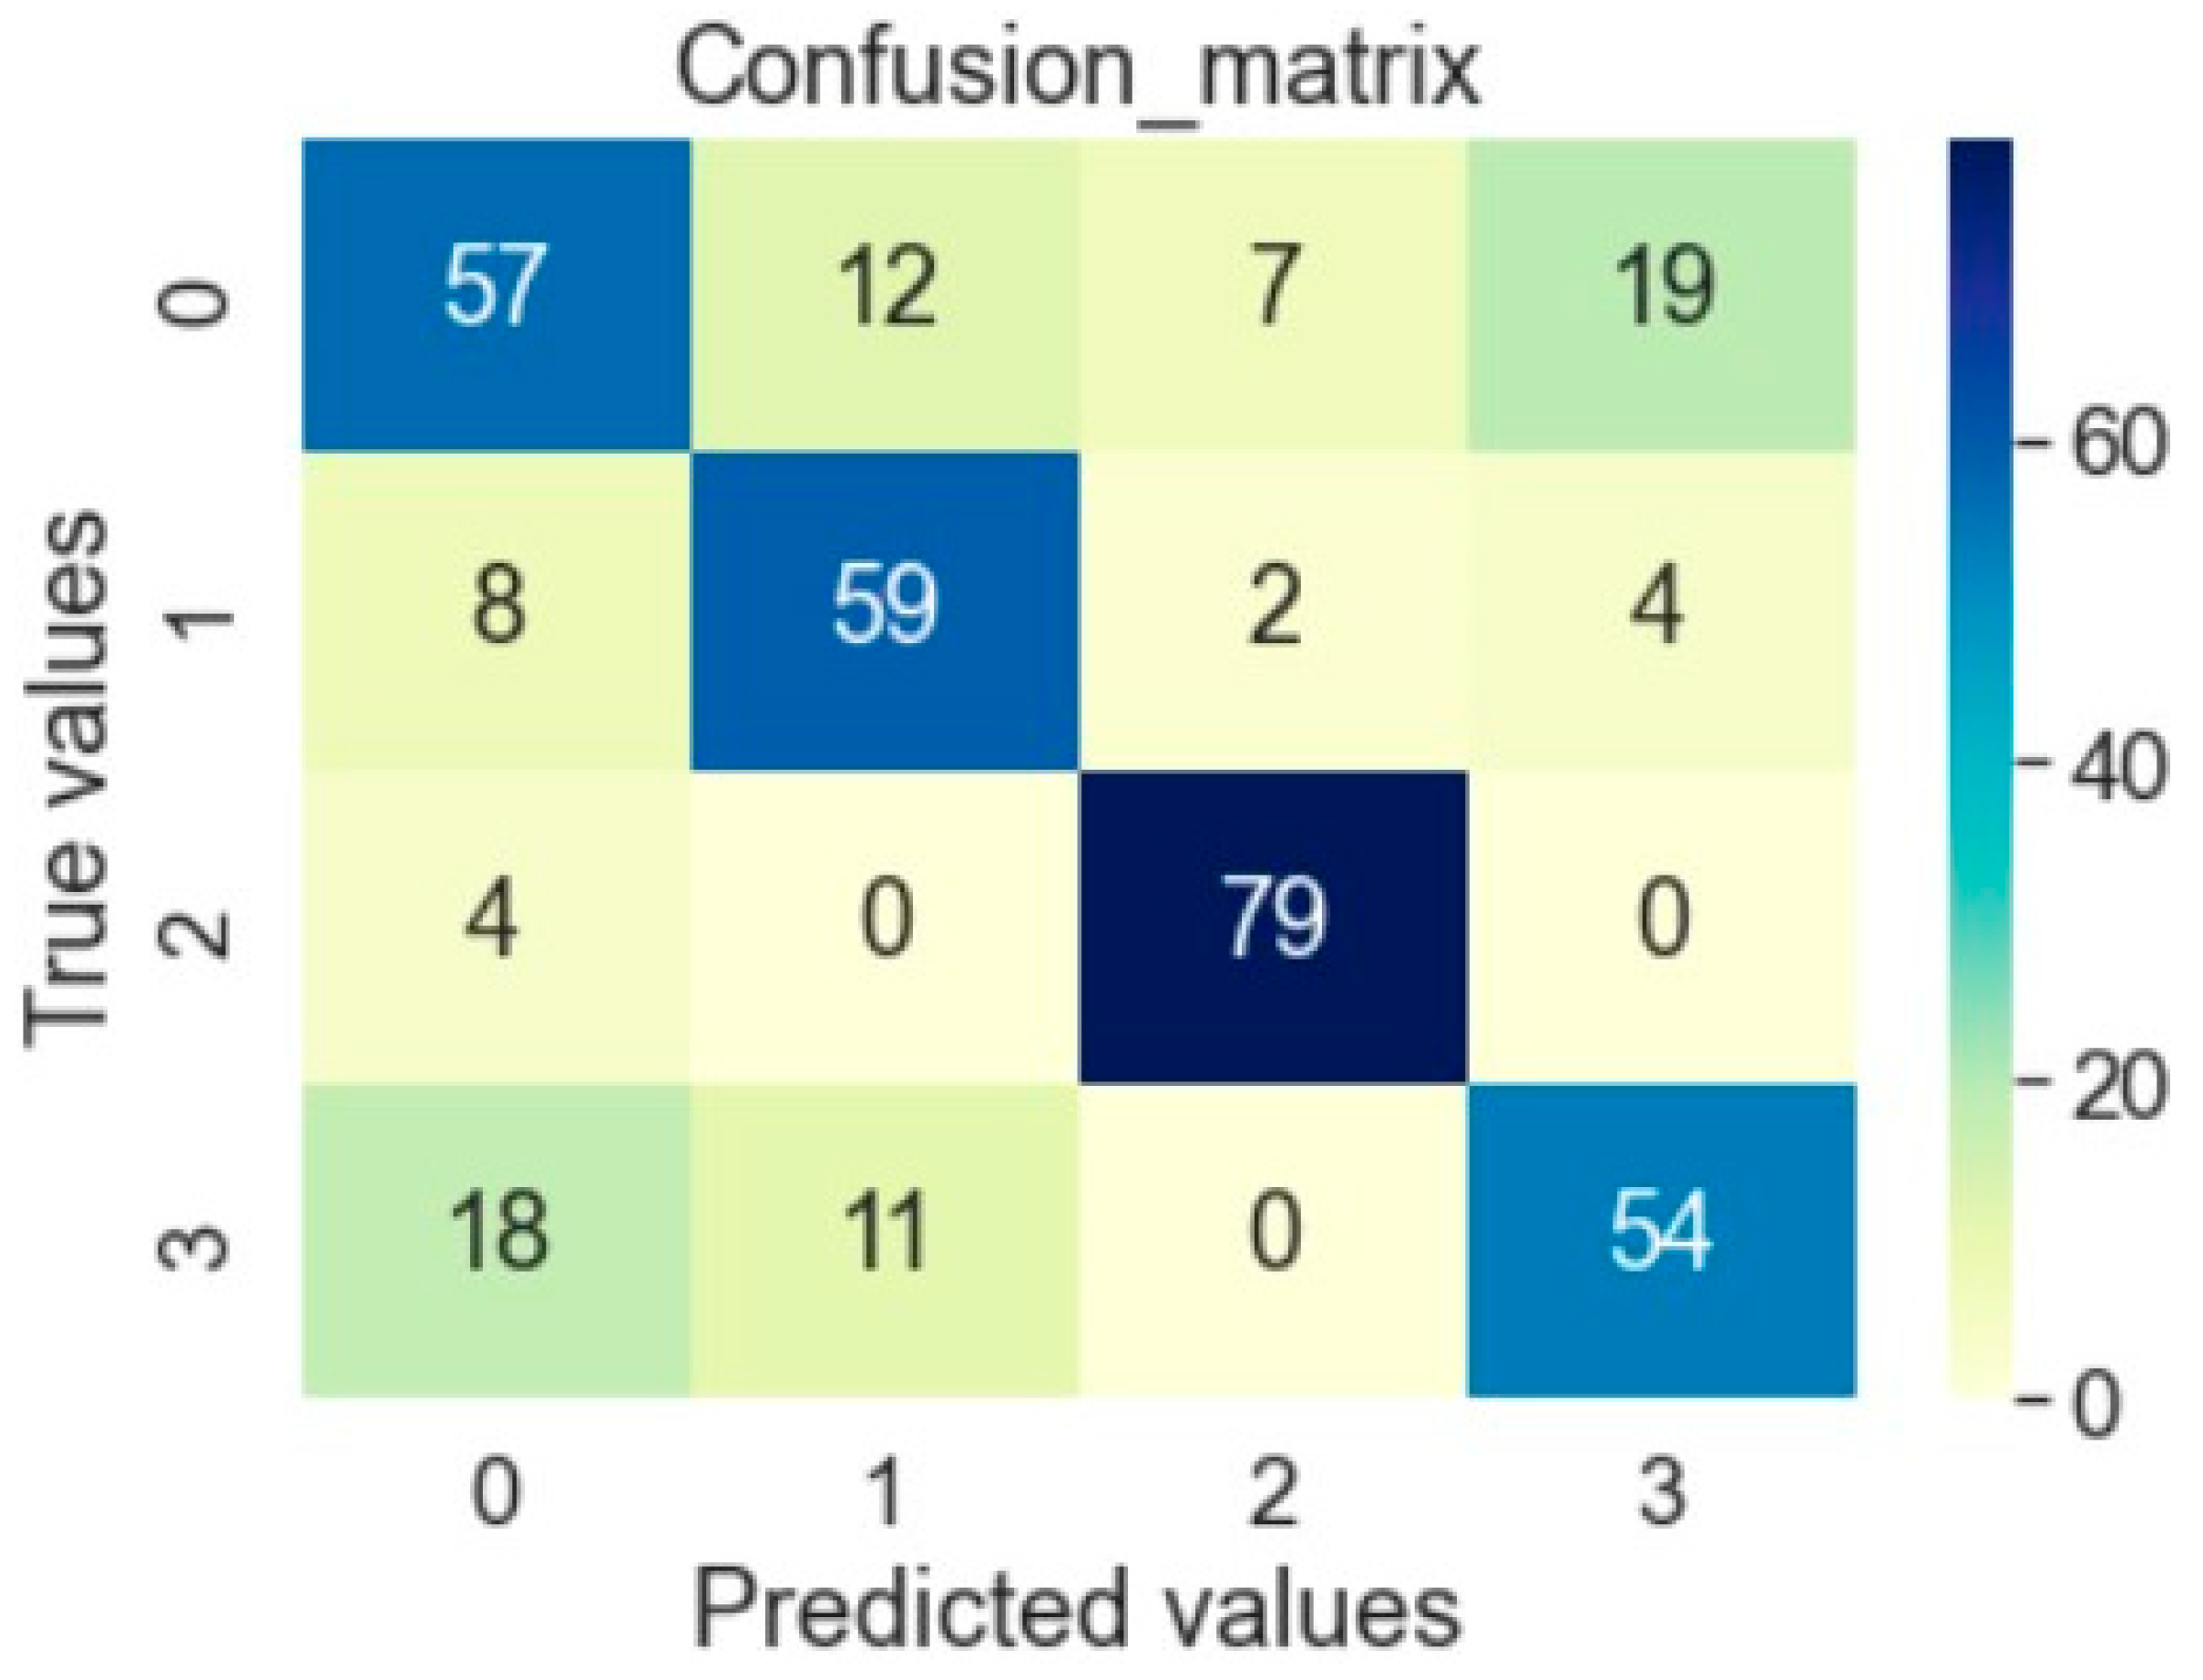
3. Results and Discussion

The total feature dataset was separated into duplet, with eighty percent of the features being employed for training, and twenty percent for testing the classification model. Five different machine learning-based models were selected for classification purposes viz. ANN [16], DT [17], KNN [18], RF [19] and SVM [20]. Hyperparameter tuning is very much essential for the identification of the best parameters for the classification model. The “GridSearchCV” function from the “sklearn.model_selection” module has been used for tuning the hyperparameters of all classification models. The selected hyperparameters are shown in Table 2. The K-fold approach was utilized for validation through the training phase. By trial and error, the value of K was fixed to 10. The confusion matrix is the most common method of evaluating classification problems. Therefore, all the classifiers were evaluated using a confusion matrix.
Table 3 shows the classification accuracy for different models. Among five different classification models, DT and RF performed better during training, with 90% reliable results. Conversely, in the testing phase, the RF model outperformed others, with 77.5% reliable results (Figure 3).
On the other hand, SVM performed poorly, having 69.8% and 69.4% reliable results apiece in training and testing. The confusion matrix (CF) for the random forest model is given in Figure 4. The digits zero, one, two, and three marked in both the axes in the CF represent the machined surfaces obtained from turning, milling, grinding, as well as shaping operations. The slopping elements in the CF provide the number of valid classifications, whereas off-slopping elements provide the number of wrong classifications. By employing four Tamura features, the different models are able to give a testing accuracy above 70%. The classification model’s accuracy can be further increased by using more images as input to the machine learning models. Additionally, other image features along with Tamura features can be used as input to models to increase and generalize the classification accuracy of the models. These models can be further implemented in robots for automatically identifying objects or measuring surface roughness.

4. Conclusions

This work used image processing and ML to recognize and classify the quality of surfaces obtained from various machining operations. The current study investigated the use of four Tamura characteristics from partitioned images, including coarseness, contrast, directionality, and roughness, in identifying surface textures. Five different classification models were used to classify machined surface images, namely, ANN, DT, KNN, Random Forest, and SVM. Out of the five different classification models, the Random Forest model outperformed others, having obtained 90% and 77.5% reliable results apiece in training and testing. However, the SVM model performed poorly, obtaining 69.8% and 69.4% reliable results apiece in training and testing. Enhancements in model performance can be achieved by using a greater quantity of better-quality images as input to the classifier, and by combining other image texture features.

Author Contributions

Conceptualization, P.S.; A.S.; G.P. (Gautham Parameshwaran); methodology, G.P. (Ganesha Prasad); P.K.R.; software, G.P. (Ganesha Prasad); validation, U.K.S.; formal analysis, R.C.K.; G.S.V.; resources, G.P. (Ganesha Prasad); writing—original draft preparation, P.S.; A.S.; G.P. (Gautham Parameshwaran); writing—review and editing, R.C.K.; G.S.V.; visualization, G.S.V.; supervision, R.C.K.; project administration, R.C.K. All authors have read and agreed to the published version of the manuscript.

Funding

This research received no external funding.

Institutional Review Board Statement

Not applicable.

Informed Consent Statement

Not applicable.

Data Availability Statement

The data can be obtained from the corresponding author on request.

Conflicts of Interest

The authors declare no conflict of interest.

References

  1. Ashour, M.W.; Khalid, F.; Halin, A.A.; Abdullah, L.N. Machining process classification using PCA reduced histogram features and the Support Vector Machine. In Proceedings of the IEEE 2015 IEEE International Conference on Signal and Image Processing Applications (ICSIPA), Kuala Lumpur, Malaysia, 19–21 October 2015. [Google Scholar] [CrossRef]
  2. Haralick, R.M.; Dinstein, I.; Shanmugam, K. Textural features for image classification. IEEE Trans. Syst. Man. Cybern. 1973, 3, 610–621. [Google Scholar] [CrossRef]
  3. Manish, R.; Venkatesh, A.; Ashok, S.D. Machine vision based image processing techniques for surface finish and defect inspection in a grinding process. Mater. Today Proc. 2018, 5, 12792–12802. [Google Scholar] [CrossRef]
  4. Dutta, S.; Pal, S.K.; Mukhopadhyay, S.; Sen, R. Application of digital image processing in tool condition monitoring: A review. CIRP J. Manuf. Sci. Technol. 2013, 6, 212–232. [Google Scholar] [CrossRef]
  5. Dutta, S.; Pal, S.K.; Sen, R. Digital Image Processing in Machining. In Modern Mechanical Engineering-Research, Development, and Education; Davim, P.J., Ed.; Springer Nature: Berlin/Heidelberg, Germany, 2014; pp. 369–412. [Google Scholar]
  6. Jurevicius, M.; Skeivalas, J.; Urbanavicius, R. Analysis of surface roughness parameters digital image identification. Measurement 2014, 56, 81–87. [Google Scholar] [CrossRef]
  7. Simunovic, G.; Svalina, I.; Simunovic, K.; Saric, T.; Havrlisan, S.; Vukelic, D. Surface roughness assessing based on digital image features. Adv. Prod. Eng. Manag. 2016, 11, 93–104. [Google Scholar] [CrossRef]
  8. Barges, E.; Thabet, E. GLDM and Tamura features based KNN and particle swarm optimization for automatic diabetic retinopathy recognition system. Multimed. Tools Appl. 2023, 82, 271–295. [Google Scholar] [CrossRef]
  9. Penumuru, D.P.; Muthuswamy, S.; Karumbu, P. Identification and classification of materials using machine vision and machine learning in the context of industry 4.0. J. Intell. Manuf. 2020, 31, 1229–1241. [Google Scholar] [CrossRef]
  10. Wang, J.; Yan, J.; Li, C.; Gao, R.X.; Zhao, R. Deep heterogeneous GRU model for predictive analytics in smart manufacturing: Application to tool wear prediction. Comput. Ind. 2019, 111, 1–14. [Google Scholar] [CrossRef]
  11. Vishwanatha, J.S.; Srinivasa Pai, P. Modelling and prediction of surface roughness in Ti-6Al-4V turned surfaces: Use of DTCWT image fusion and GLCM. In Proceedings of the International Conference on Advances in Manufacturing, Materials and Energy Engineering (ICon MMEE 2018), Moodbidri, Karnataka, India, 2–3 March 2018. [Google Scholar] [CrossRef]
  12. Lakshmana Kumar, S.; Thenmozhi, M.; Bommi, R.M.; Ezilarasan, C.; Sivaraman, V.; Palani, S. Surface roughness evaluation in turning of Nimonic C263 super alloy using 2D DWT histogram equalization. J. Nanomater. 2022, 2022, 9378487. [Google Scholar] [CrossRef]
  13. Joshi, K.; Patil, B. Prediction of Surface Roughness by Machine Vision using Principal Components based Regression Analysis. Procedia Comput. Sci. 2020, 167, 382–391. [Google Scholar] [CrossRef]
  14. Ge, J.; Liu, H.; Yang, S.; Lan, J. Laser Cleaning Surface Roughness Estimation Using Enhanced GLCM Feature and IPSO-SVR. Photonics 2022, 9, 510. [Google Scholar] [CrossRef]
  15. Rifai, A.P.; Aoyama, H.; Tho, N.H.; Dawal, S.Z.; Masruroh, N.A. Evaluation of turned and milled surfaces roughness using convolutional neural network. Measurement 2020, 161, 107860. [Google Scholar] [CrossRef]
  16. El Kadi, H. Modeling the mechanical behavior of fiber-reinforced polymeric composite materials using artificial neural networks—A review. Compos. Struct. 2006, 73, 1–23. [Google Scholar] [CrossRef]
  17. Mohanraj, T.; Yerchuru, J.; Krishnan, H.; Nithin Aravind, R.S.; Yameni, R. Development of tool condition monitoring system in end milling process using wavelet features and Hoelder’s exponent with machine learning algorithms. Meas. J. Int. Meas. Confed. 2021, 173, 108671. [Google Scholar] [CrossRef]
  18. Uddin, S.; Haque, I.; Lu, H.; Moni, M.A.; Gide, E. Comparative performance analysis of K-nearest neighbour (KNN) algorithm and its different variants for disease prediction. Sci. Rep. 2022, 12, 6256. [Google Scholar] [CrossRef] [PubMed]
  19. Tavus, B.; Kocaman, S.; Gokceoglu, C. Flood damage assessment with Sentinel-1 and Sentinel-2 data after Sardoba dam break with GLCM features and Random Forest method. Sci. Total Environ. 2022, 816, 151585. [Google Scholar] [CrossRef] [PubMed]
  20. Vijay, G.S.; Kumar, H.S.; Srinivasa, P.P.; Sriram, N.S.; Rao, R.B.K.N. Evaluation of effectiveness of wavelet based denoising schemes using ANN and SVM for bearing condition classification. Comput. Intell. Neurosci. 2012, 2012, 582453. [Google Scholar] [CrossRef]
Figure 1. Overall methodology involved in the work.
Engproc 59 00092 g001
Figure 2. Pre-processing of machined surface image.
Engproc 59 00092 g002
Figure 3. Plot of testing accuracy.
Engproc 59 00092 g003
Figure 4. Confusion matrix (CF) of Random Forest model.
Engproc 59 00092 g004
Table 1. Tamura features.
FeatureDefinition
Coarseness 1 m × n i = 1 m j = 1 n s b i , j
Contrast σ α 4 n
Directionality 1 r n ˙ p p n p ϵ w p p 2 H ˙ D
Roughness Coarseness + contrast
Table 2. Hyperparameters for classifiers.
ModelHyperparameters
ANNHidden layers: Two
Layer 1 and 2: 100 and 50 neurons apiece
optimizer: rmsprop
DTCriterion: entropy, max_features:auto, splitter:best
KNNAlgorithm: auto, n_neighbors: 9, weights: distance
RFCriterion: entropy, max_features: log2, n_estimators: 200
SVMC: 17, gamma: scale, kernel: rbf
Table 3. Classification model accuracy.
ModelTraining AccuracyTesting Accuracy
ANN76.573
DT9076.6
KNN89.5076.6
RF9077.5
SVM69.869.4
Disclaimer/Publisher’s Note: The statements, opinions and data contained in all publications are solely those of the individual author(s) and contributor(s) and not of MDPI and/or the editor(s). MDPI and/or the editor(s) disclaim responsibility for any injury to people or property resulting from any ideas, methods, instructions or products referred to in the content.

