Article

Relative and Combined Impacts of Climate and Land Use/Cover Change for the Streamflow Variability in the Baro River Basin (BRB)

by
Shimelash Molla Kassaye
1,2,*,
Tsegaye Tadesse
3,
Getachew Tegegne
4,5,
Aster Tesfaye Hordofa
6 and
Demelash Ademe Malede
7
1
Hydrology and Water Resources Management, Africa Center of Excellence for Water Management, Addis Ababa University, Addis Ababa P.O. Box 1176, Ethiopia
2
Department of Water Resources and Irrigation Engineering, Mattu University, Mattu P.O. Box 318, Ethiopia
3
National Drought Mitigation Center, School of Natural Resources, University of Nebraska-Lincoln, 815 Hardin Hall, 3310 Holdrege St., Lincoln, NE 68583-0749, USA
4
Department of Civil Engineering, Addis Ababa Science and Technology University, Addis Ababa P.O. Box 16417, Ethiopia
5
Sustainable Energy Center of Excellence, Addis Ababa Science and Technology University, Addis Ababa P.O. Box 16417, Ethiopia
6
Arba Minch Water Technology Institute, Arba Minch University, Arba Minch P.O. Box 21, Ethiopia
7
Department of Natural Resource Management, Debre Markos University, Debre Markos P.O. Box 269, Ethiopia
*
Author to whom correspondence should be addressed.
Earth 2024, 5(2), 149-168; https://doi.org/10.3390/earth5020008
Submission received: 7 February 2024 / Revised: 18 April 2024 / Accepted: 22 April 2024 / Published: 24 April 2024

Abstract

:
The interplay between climate and land use/cover significantly shapes streamflow characteristics within watersheds, with dominance varying based on geography and watershed attributes. This study quantifies the relative and combined impacts of land use/cover change (LULCC) and climate change (CC) on streamflow variability in the Baro River Basin (BRB) using the Soil and Water Assessment Tool Plus (SWAT+). The model was calibrated and validated with observed streamflow data from 1985 to 2014 and projected the future streamflow from 2041 to 2070 under two Shared Socio-Economic Pathway (i.e., SSP2-4.5 and SSP5-8.5) scenarios, based on the ensemble of four Coupled Model Intercomparison Project (CMIP6) models. The LULCC was analyzed through Google Earth Engine (GEE) and predicted for the future using the Land Change Modeler (LCM), revealing reductions in forest and wetlands, and increases in agriculture, grassland, and shrubland. Simulations show that the decrease in streamflow is attributed to LULCC, whereas an increase in flow is attributed to the impact of CC. The combined impact of LULCC and CC results in a net increase in streamflow by 9.6% and 19.9% under SSP2-4.5 and SSP5-8.5 scenarios, respectively, compared to the baseline period. Our findings indicate that climate change outweighs the impact of land use/cover (LULC) in the basin, emphasizing the importance of incorporating comprehensive water resources management and adaptation approaches to address the changing hydrological conditions.

1. Introduction

It is crucial to understand the complex dynamics of hydrological systems by grasping the interconnection between land use patterns, climate changes (CCs), and their combined impact on the variability of streamflow [1]. The interplay of these factors holds significant importance in shaping the quantity, timing [2], and quality of water flow within watersheds. The dominance of either of them in influencing streamflow is not a one-size-fits-all scenario [3], which can vary depending on geographic location, watershed characteristics, and the specific changes occurring.
Studies have been conducted to investigate the individual and integrated impact of LULC and climate on streamflow variability [4,5,6,7,8,9,10] on a global scale. The result shows that the combined impact of those factors can be positive or negative depending on the characteristics of the basin. For example, the study [11] in Xinanjiang Basin, East China, investigated how future climate and LULCC impact streamflow. The results indicate that the impacts of these changes on streamflow can vary, and thus it is essential to understand the specific characteristics of the basin to assess the potential impact. Similarly, a study by the authors of [12] assessed the impact of climate and LULCC in the Parvara Mula Basin, India, and found an increase in streamflow at the end of the century under different climate scenarios. These and other similar studies [13,14] highlighted the complex and varied impact of CC and LULC on streamflow, emphasizing the need for basin-specific assessments to understand and manage the potential implications. Furthermore, some researchers found that CC has more impact on hydrological changes than land use change, while others found the opposite. This indicates that the specific dominance of either of them requires localized studies, considering the distinct characteristics of each geographic location [3,14,15,16].
However, despite these insights, there remain potential gaps that researchers should address that include, for instance, understanding how the relative and combined impacts vary across different regions or periods [17], investigating how various land use changes (urbanization, deforestation, and agriculture) contribute differently to streamflow variability, and addressing uncertainties in hydrological modeling through robust validation and sensitivity analyses [18]. These additional gaps need attention from researchers to improve the reliability of predictions.
In Ethiopia, studies have been carried out to understand the combined and individual effects of climate and LULC change on streamflow [19,20,21]. The findings collectively demonstrate the significant impact of those factors on streamflow variability. In this study, we focused on the BRB, one of the least researched basins in Ethiopia. The BRB is a vital source of water and livelihood for millions of people in Ethiopia and South Sudan [22]; however, it also faces serious environmental and socio-economic challenges due to CC and human activities [23]. The local climate variability in the basin [24] and the anthropogenic influence, particularly through resettlement programs, lead to deforestation in the area, followed by agricultural expansion. Currently, flooding is impacting the downstream area of the Gambella Region (i.e., Nuer, Anuak, and Mejenger zones) in Ethiopia. This is believed to be caused by changes in LULC, especially in the upstream area of the basin, and is worsened by the overall impact of global climate change.
Most studies conducted in the basin reveal that maximum and minimum temperatures are both increasing in magnitude [23,25,26]. However, there is no consensus among them regarding the rainfall pattern. For instance, the authors of [25] reported that the projected annual precipitation shows an increase of 6% and 16.46% under SSP2-4.5 and SSP5-8.5 scenarios, respectively, whereas the authors of [23] reported decrease in rainfall under the RCP4.5 and RCP8.5 climate scenarios. On the other hand, the authors of [26] reported that rainfall does not exhibit a systematic increasing or decreasing trend over the century. This disparity can be attributed to a combination of methodological choices, model and scenario selection, inherent uncertainties, data limitations, and variations in the consideration of local factors and timeframes across different studies.
To address these discrepancies and advance the understanding of streamflow variability under climate and LULCC, it is essential to utilize the latest input data and updated hydrological modeling tools. In this study, we employed SWAT+—the latest version of SWAT—along with the new climate models from the CMIP6 and leveraged the GEE cloud computing platform.

2. Materials and Methods
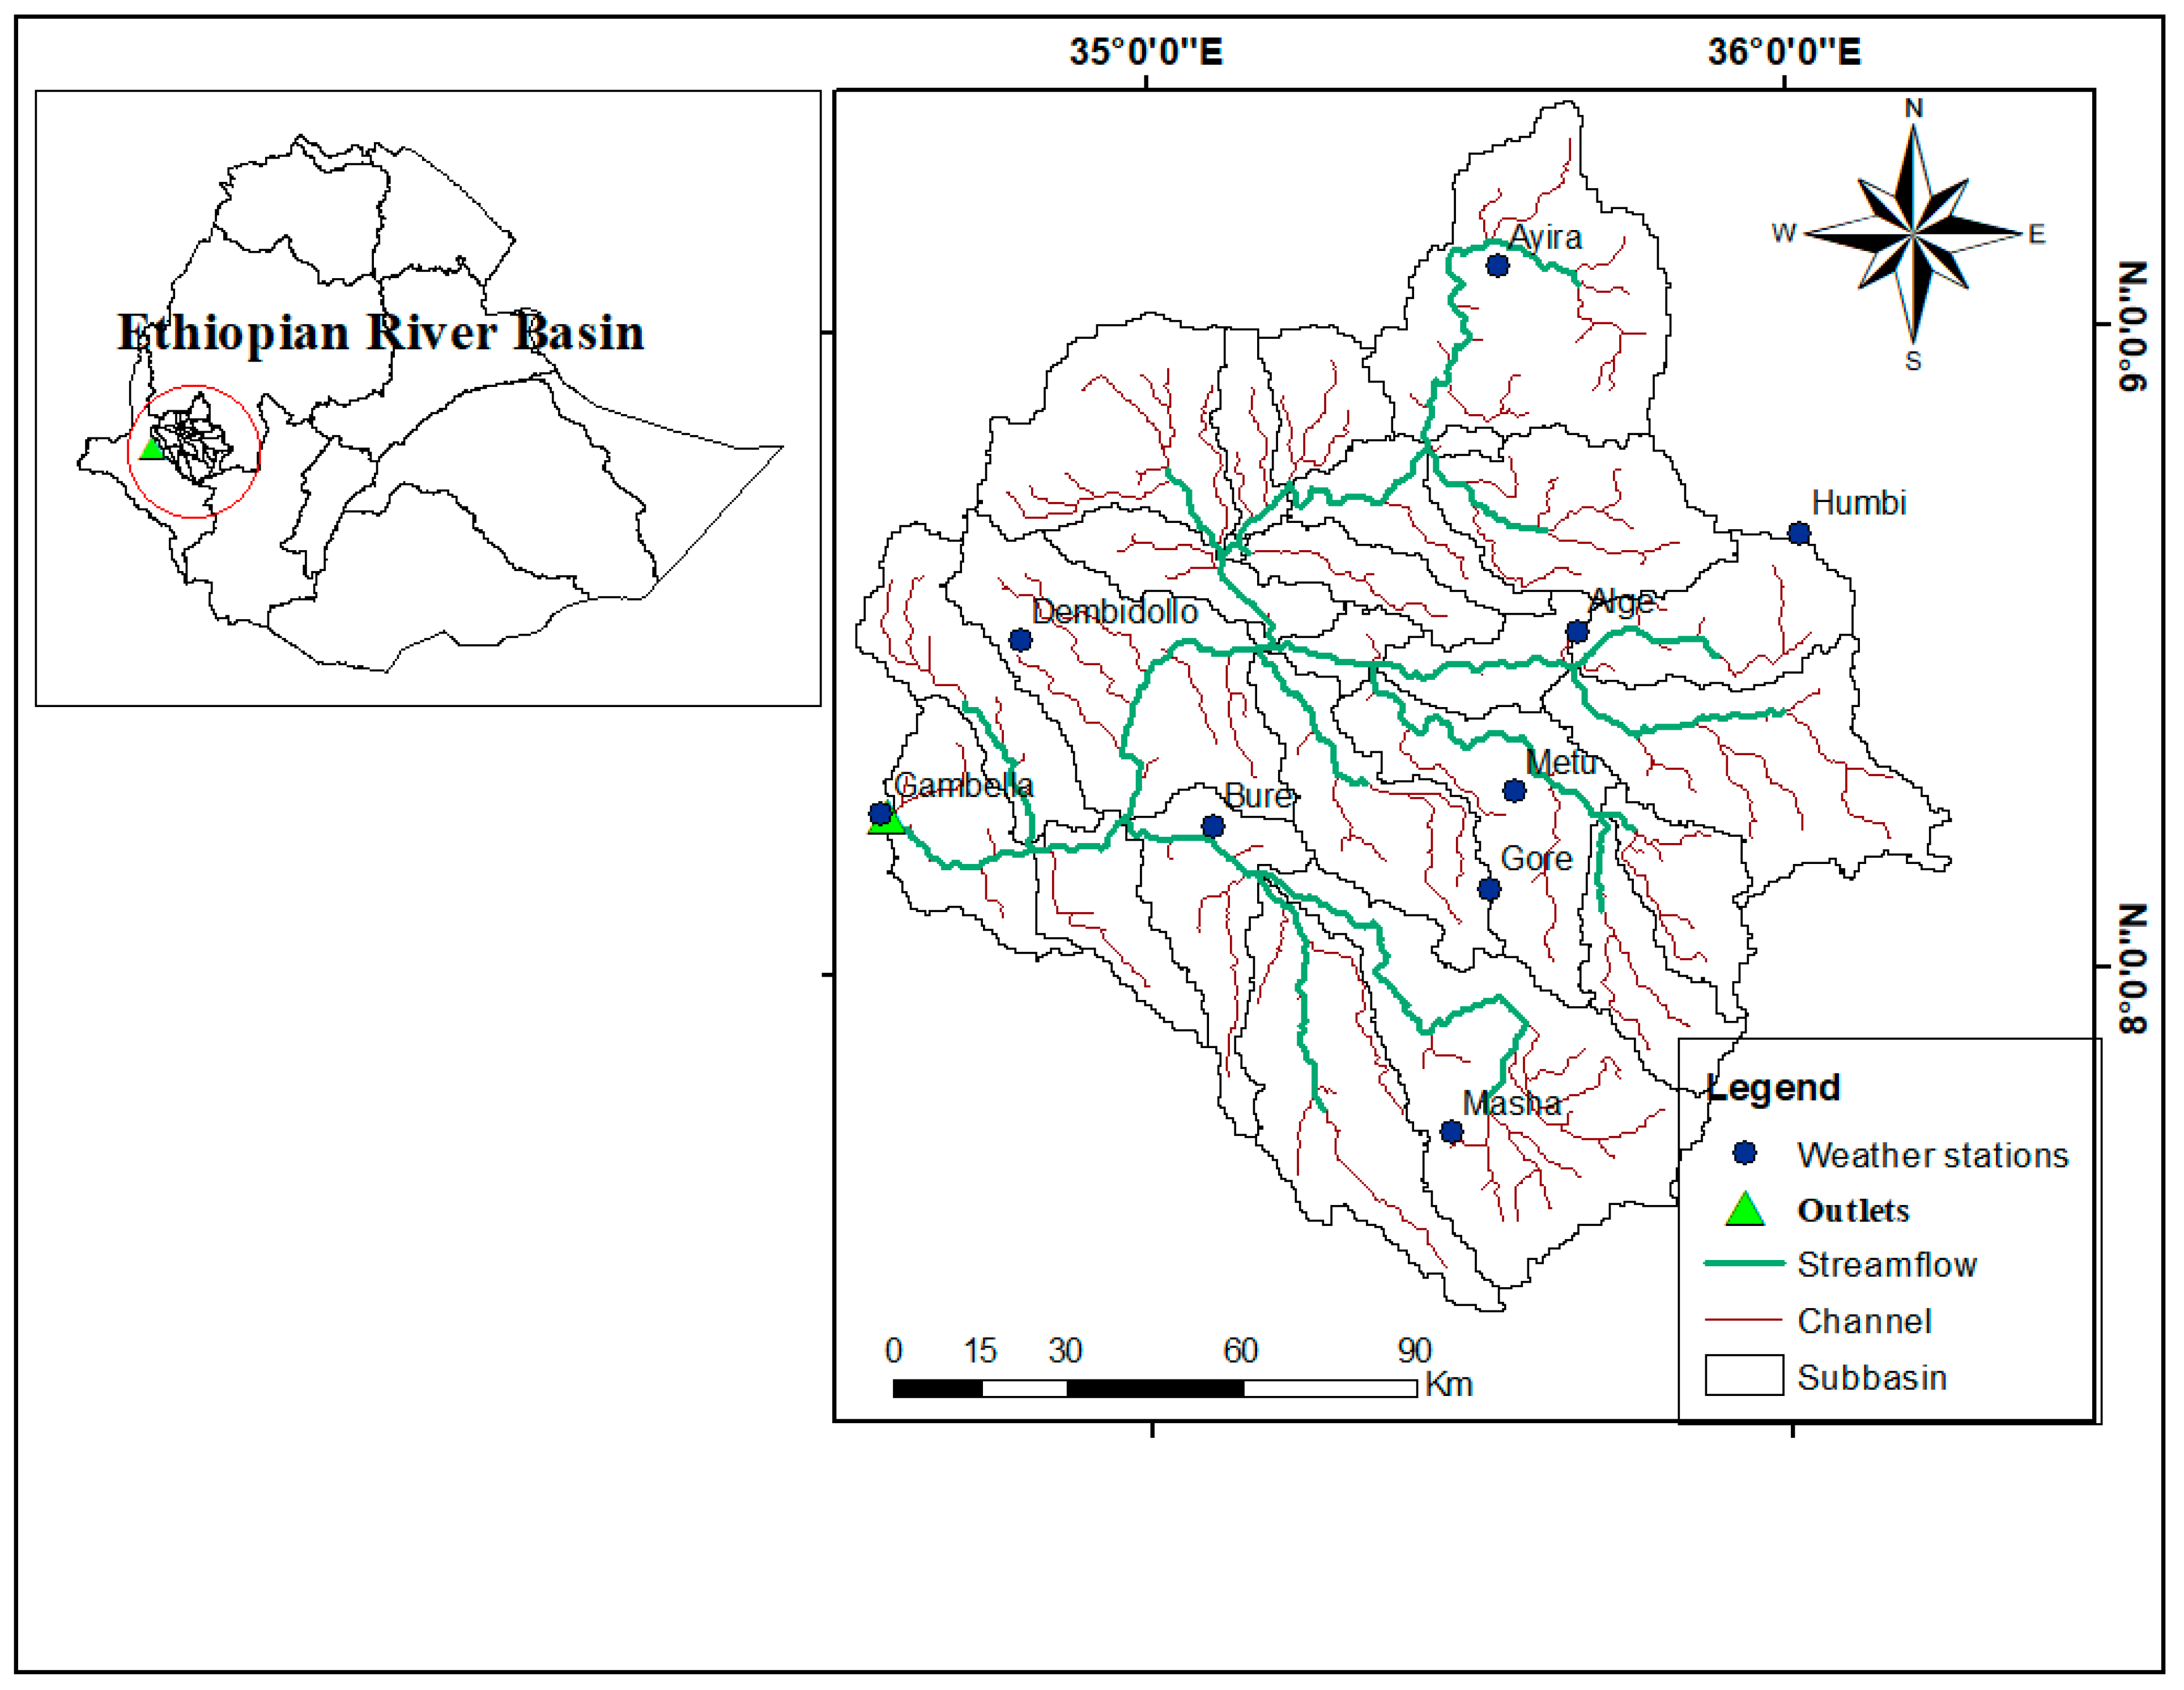
2.1. Study Area

The Baro River is a cross-border river with its source in Ethiopia’s western highlands [25]. It is delimited by latitudes between 7°24′ and 9°25′ and longitudes between 33°20′ and 36°20′ [2] (Figure 1). The basin exhibits a significant elevation gradient, ranging from less than 400 m to over 3260 m, resulting in diverse rainfall and temperature patterns across the basin [2].
The Baro River begins at the merging point of the Birbir and Geba Rivers, situated east of Metu in the Ilu Aba Bora zone of the Oromia region. A north–south escarpment divides the basin into two distinct parts: the upper Baro, characterized by a cool and moist climate, and the lower Baro, characterized by a warm and humid climate [27]. The study area covers 23,400 km2, with its outlet at Gambella, well-known as Upper Baro Basin (UBB). The basin experiences an average annual rainfall of around 1743.5 mm, along with daily mean minimum and maximum temperatures averaging 13.4 °C and 26.8 °C, respectively [23].
Agriculture and forest are the two dominant LULC types in the basin, followed by grassland and shrubland [28]. Around 45% of the UBB is covered by agriculture, followed by forest, which covers around 35% of the area. The remaining land is covered by grassland, shrubland, wetlands, and tea farms. Additionally, the area is characterized by a diverse range of dominant soil types, including vertisols, nitosols, cambisols, and fluvisols, among others [29].

2.2. Methods

2.2.1. Datasets

Observed Hydro-Meteorological Data

The Ministry of Water, Irrigation, and Energy (MOWIE) provided streamflow data for model calibration and validation, while meteorological data for simulating flow from 1985 to 2020 were collected from the National Metrology Institute of Ethiopia (NMIE). The meteorological data were also employed to evaluate the output of the General Circulation Models (GCMs) before utilizing the GCMs for future climate change projections. Five meteorological stations (Masha, Gore, Itang, Gambella, Metu, and Dembidollo) were selected within the basin based on the completeness of their data (Figure 1).
Streamflow data were collected at Gambella, the outlet of the basin. In this study, any gaps in the meteorological data were addressed by employing the Markov Chain Monte Carlo (MCMC) imputation technique through XLSTAT data analysis software Version 2021.1. The quality control of data, which involved examining data availability, identifying outliers, conducting a homogeneity test, and addressing missing data, was carried out within the river basin following the steps recommended in [24].

Geospatial Maps Data

SWAT+ requires the following geo-spatial datasets, including Digital Elevation Model (DEM), soil map, and LULC map. The 30 m-resolution DEM was obtained from the Shuttle Radar Topography Mission (SRTM) and employed in delineating the watershed. Then, the LULC classification for the years 1990, 2000, and 2020 was conducted using the GEE (https://code.earthengine.google.com/ (accessed on 10 September 2023)). During the image classification process, ground truth points and satellite images from Google Earth were employed.
In addition, the LULC map for the year 2020 was collected from the Ethiopian Ministry of Water and Energy (MOWIE) for the validation of the model’s output. Similarly, soil data were collected from the Ethiopian Agricultural Statistics and the information center of the Ethiopian Ministry of Agriculture. These data sources were utilized in various studies to analyze the dynamics of LULC and its environmental impacts in different watersheds across Ethiopia [30,31,32].

2.2.2. Hydrological Modeling Using SWAT+

Currently, research has delved into the utilization of SWAT+ to depict the hydrological impacts of CC and LULCC due to its greater flexibility compared to SWAT [2,13,33]. The advantage of SWAT+ over SWAT encompasses several key improvements [34]. Firstly, it enhances the simulation of landscape position [35], providing finer divisions of sub-basins that enable the separation of upland processes from wetlands. Additionally, SWAT+ allows the computation of land phase processes independently of the Hydrological Response Unit (HRU) area. The model also facilitates the integration of SWAT-MODFLOW for aquifers and HRUs, improving the comprehensive approach to hydrological modeling. Furthermore, SWAT+ offers a more realistic representation of reservoir position and interactions with the landscape. Notably, the model stands out in its ability to comprehensively account for human-induced water usage and management, particularly in the context of irrigation. This suite of advancements establishes SWAT+ as a robust and comprehensive tool for managing watersheds and water resources.

2.2.3. SWAT+ Model Performance Assessment

The SWAT+ model underwent sensitivity analysis, calibration, and validation phases using the SWAT+ Toolbox integrated into the QGIS interface [36]. To determine which model parameters are most sensitive, the SOBOL sensitivity approach was used. This helped to clarify how changes in input parameters impact the model’s output.
Following the identification of sensitive parameters through sensitivity analysis, the calibration process was initiated. Calibration involves adjusting model parameters to enhance the agreement between model simulations and observed data. The sensitivity analysis likely helped identify parameters that have a significant impact on model outcomes. These parameters were then fine-tuned during the calibration process (Table 1).
After calibration, it was essential to validate the model to ensure its robustness and generalizability. Validation included comparing the model’s predictions with independent datasets that were not used during the calibration phase. This step is crucial for assessing the model’s ability to accurately simulate real-world conditions.
Subsequently, the agreement between the model’s simulated flow and observed flow was evaluated using statistical measures, such as Nash–Sutcliffe Efficiency (NSE), percent-bias (PBIAS), root mean square error (RMSE), and the coefficient of determination (R2).

2.3. Design Scenarios

2.3.1. Land Use/Cover Change Scenarios

The classification of images was the first step in LULCC analysis. The LULC analyses for the study area for the periods of 1990, 2000, and 2020 were performed on GEE. For image classification, ground truth data were generated in the field, and satellite images from sources such as Google Earth were utilized. During the classification, a random forest classifier was employed, with 70% of the data used for training and the remaining 30% for validating the model. Subsequently, the model’s accuracy was evaluated using overall accuracy and Kappa accuracy on GEE. Seven separate LULC classes were identified for the basin in this study, including forest, agriculture, urban, grassland, shrubland, wetland, and tea farm (Figure 2).
The land cover for the future scenarios was predicted using the LCM [37] in TerrSet for the 2050s (Table 2). LCM facilitates quick examination of changes in land cover, empirical connections to explanatory factors, and the simulation of potential scenarios for future alterations in land use [38]. LCM follows four steps for forecasting future LULCC, including change analysis, determination of transition potential and explanatory variables, change prediction, and model validation.
Explanatory variables are factors that influence LULC over a certain area, and they were selected based on their impact on the appropriateness of a specific alternative for the concerned activity. The explanatory variables that played a role in historical changes in land cover are anticipated to have a significant impact on future changes. These factors were chosen based on the data at hand and their explanatory abilities [39]. Based on these criteria, elevation and slope were selected as static explanatory variables, whereas distance from road, distance from urban areas, and population density were chosen as dynamic explanatory variables, as their distances vary with time.

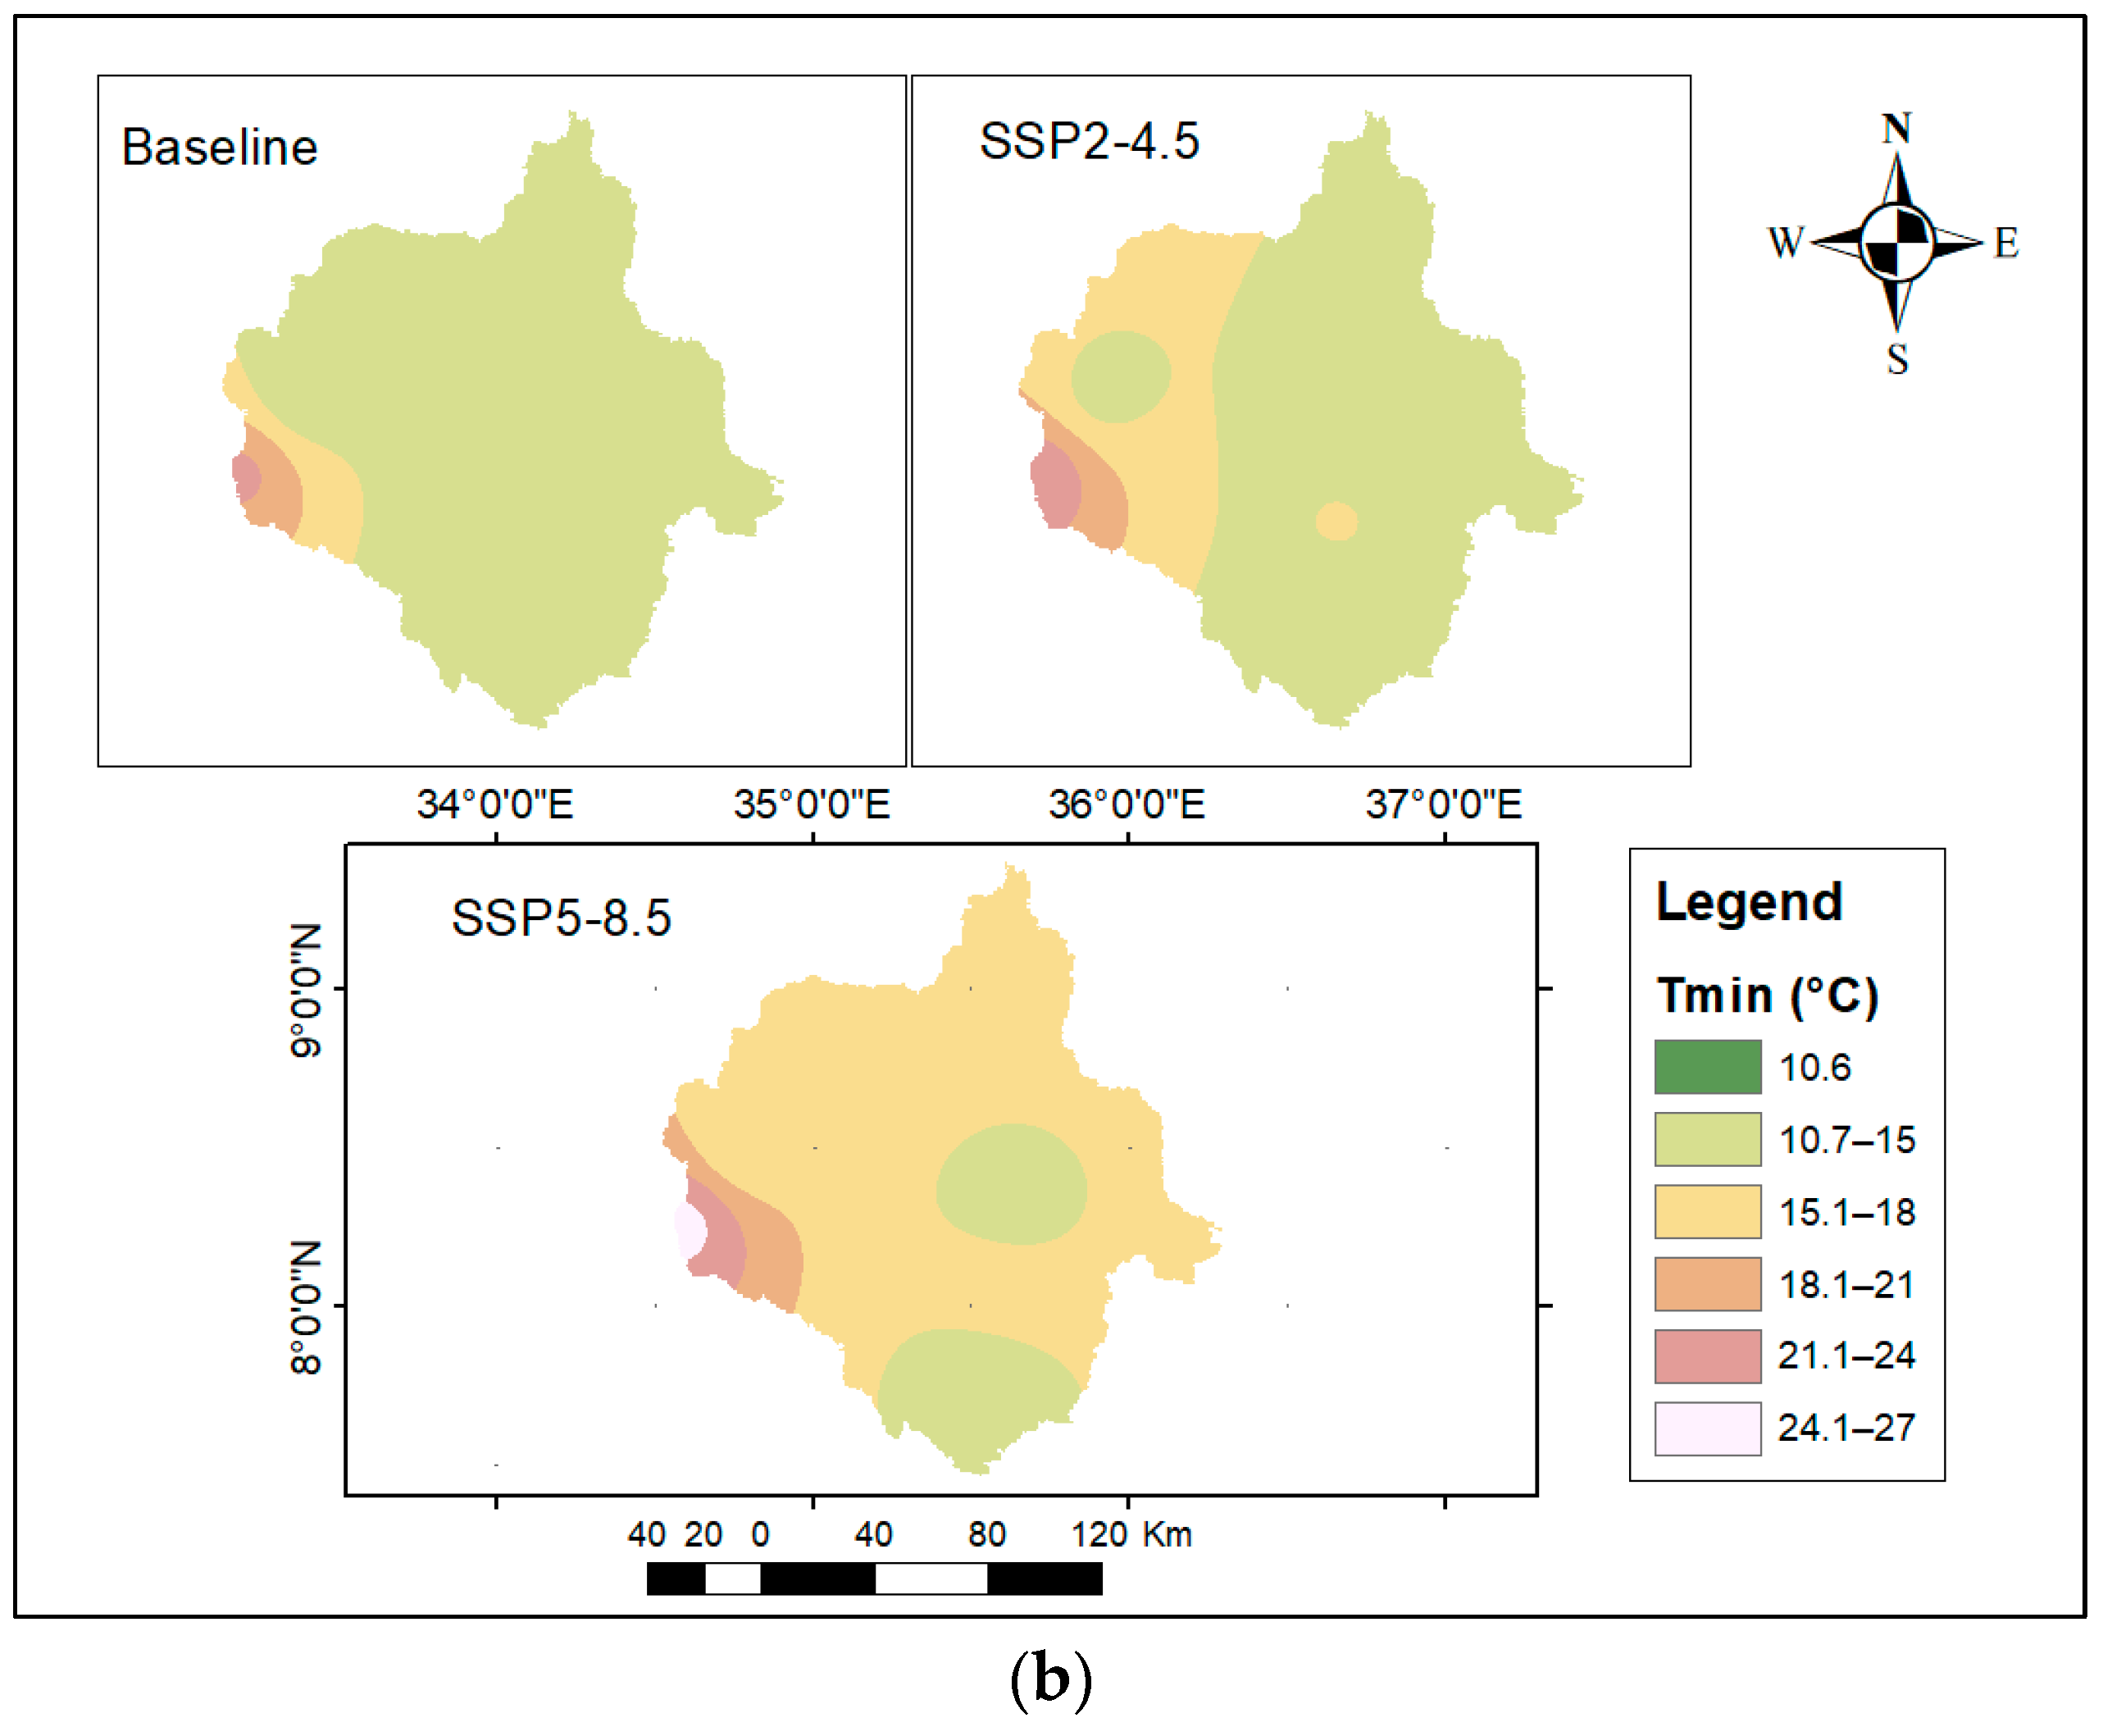
2.3.2. Climate Change Scenarios

Six bias-corrected climate models (MRI-ESM2-0, NorESM2-MM, EC-Earth3-Veg, EC-Earth3-CC, INM-CM5-0, and INM-CM4-8) from the CMIP6 project were selected for the basin based on their data availability and the recommendations by the authors of [2] in their study on the BRB. After evaluating their performance with observed data, this study utilized the ensemble of the four best-performing climate models (EC-Earth3-Veg, EC-Earth3-CC, INM-CM5-0, and INM-CM4-8) for further hydrological impact studies. Distribution mapping methods of bias correction were employed to correct biases in future climate model outputs [2,23,33]. The distribution mapping method integrated in Climate Model data for hydrologic modeling (CMhyd) was selected for bias correction and downscaling due to its effectiveness in adjusting simulated climate model data to match observed values. This method has been widely used for bias correction of precipitation and temperature for various applications [40].
The steps used for downscaling the climate datasets from CMIP6 using CMhyd followed the sequence below. Firstly, preprocessing involved preparing the CMIP6 climate datasets for downscaling, including quality control and formatting to ensure compatibility with CMhyd. Secondly, bias correction using distribution mapping was applied to the datasets to adjust for systematic errors or biases in the data relative to observations. Next, the datasets were downscaled using statistical downscaling techniques to generate projections that capture local-scale variability. It is important to note that in CMhyd, the relationship between downscaling and bias correction involves a sequential process, where bias correction is typically performed before downscaling [41]. Subsequently, the downscaled datasets were validated against observed climate data to assess the accuracy and reliability of the downscaling processes. Finally, post-processing was performed, in which the downscaled datasets were aggregated to different spatial or temporal scales for application in the study area.
This research employed two SSP scenarios (SSP2-4.5 and SSP5-8.5) due to their contrasting depictions of the future [42]. SSP2-4.5 signifies a more moderate and sustainable path, while SSP5-8.5 represents higher emissions. SSP2-4.5 is often considered a middle-ground scenario, representing a future where efforts are made to address CC despite encountering some challenges and uncertainties. In contrast, SSP5-8.5 depicts a future where global warming exceeds 8.5 W/m2 by the end of the century if no significant mitigation measures are implemented [43].

2.3.3. Relative and Combined Contribution Rate of LULC and CC on Streamflow

Streamflow simulations were conducted for the mid-term period (2041–2070) under SSP2-4.5 and SSP5-8.5 scenarios, using projected climate and LULC data as input. The simulations results, by changing one driver while keeping the other constant, isolated the impact of this single factor on hydrological elements [6]. To assess the relative and combined impacts compared to the baseline condition, four scenarios were created: one involving only CC, one involving only land use change, and two combining climate and land use changes (Table 3 and Table 4). The comparison between scenarios with consistent LULC and varying climate conditions provides insight into the effects of diverse climate conditions on streamflow, and vice versa.

3. Results

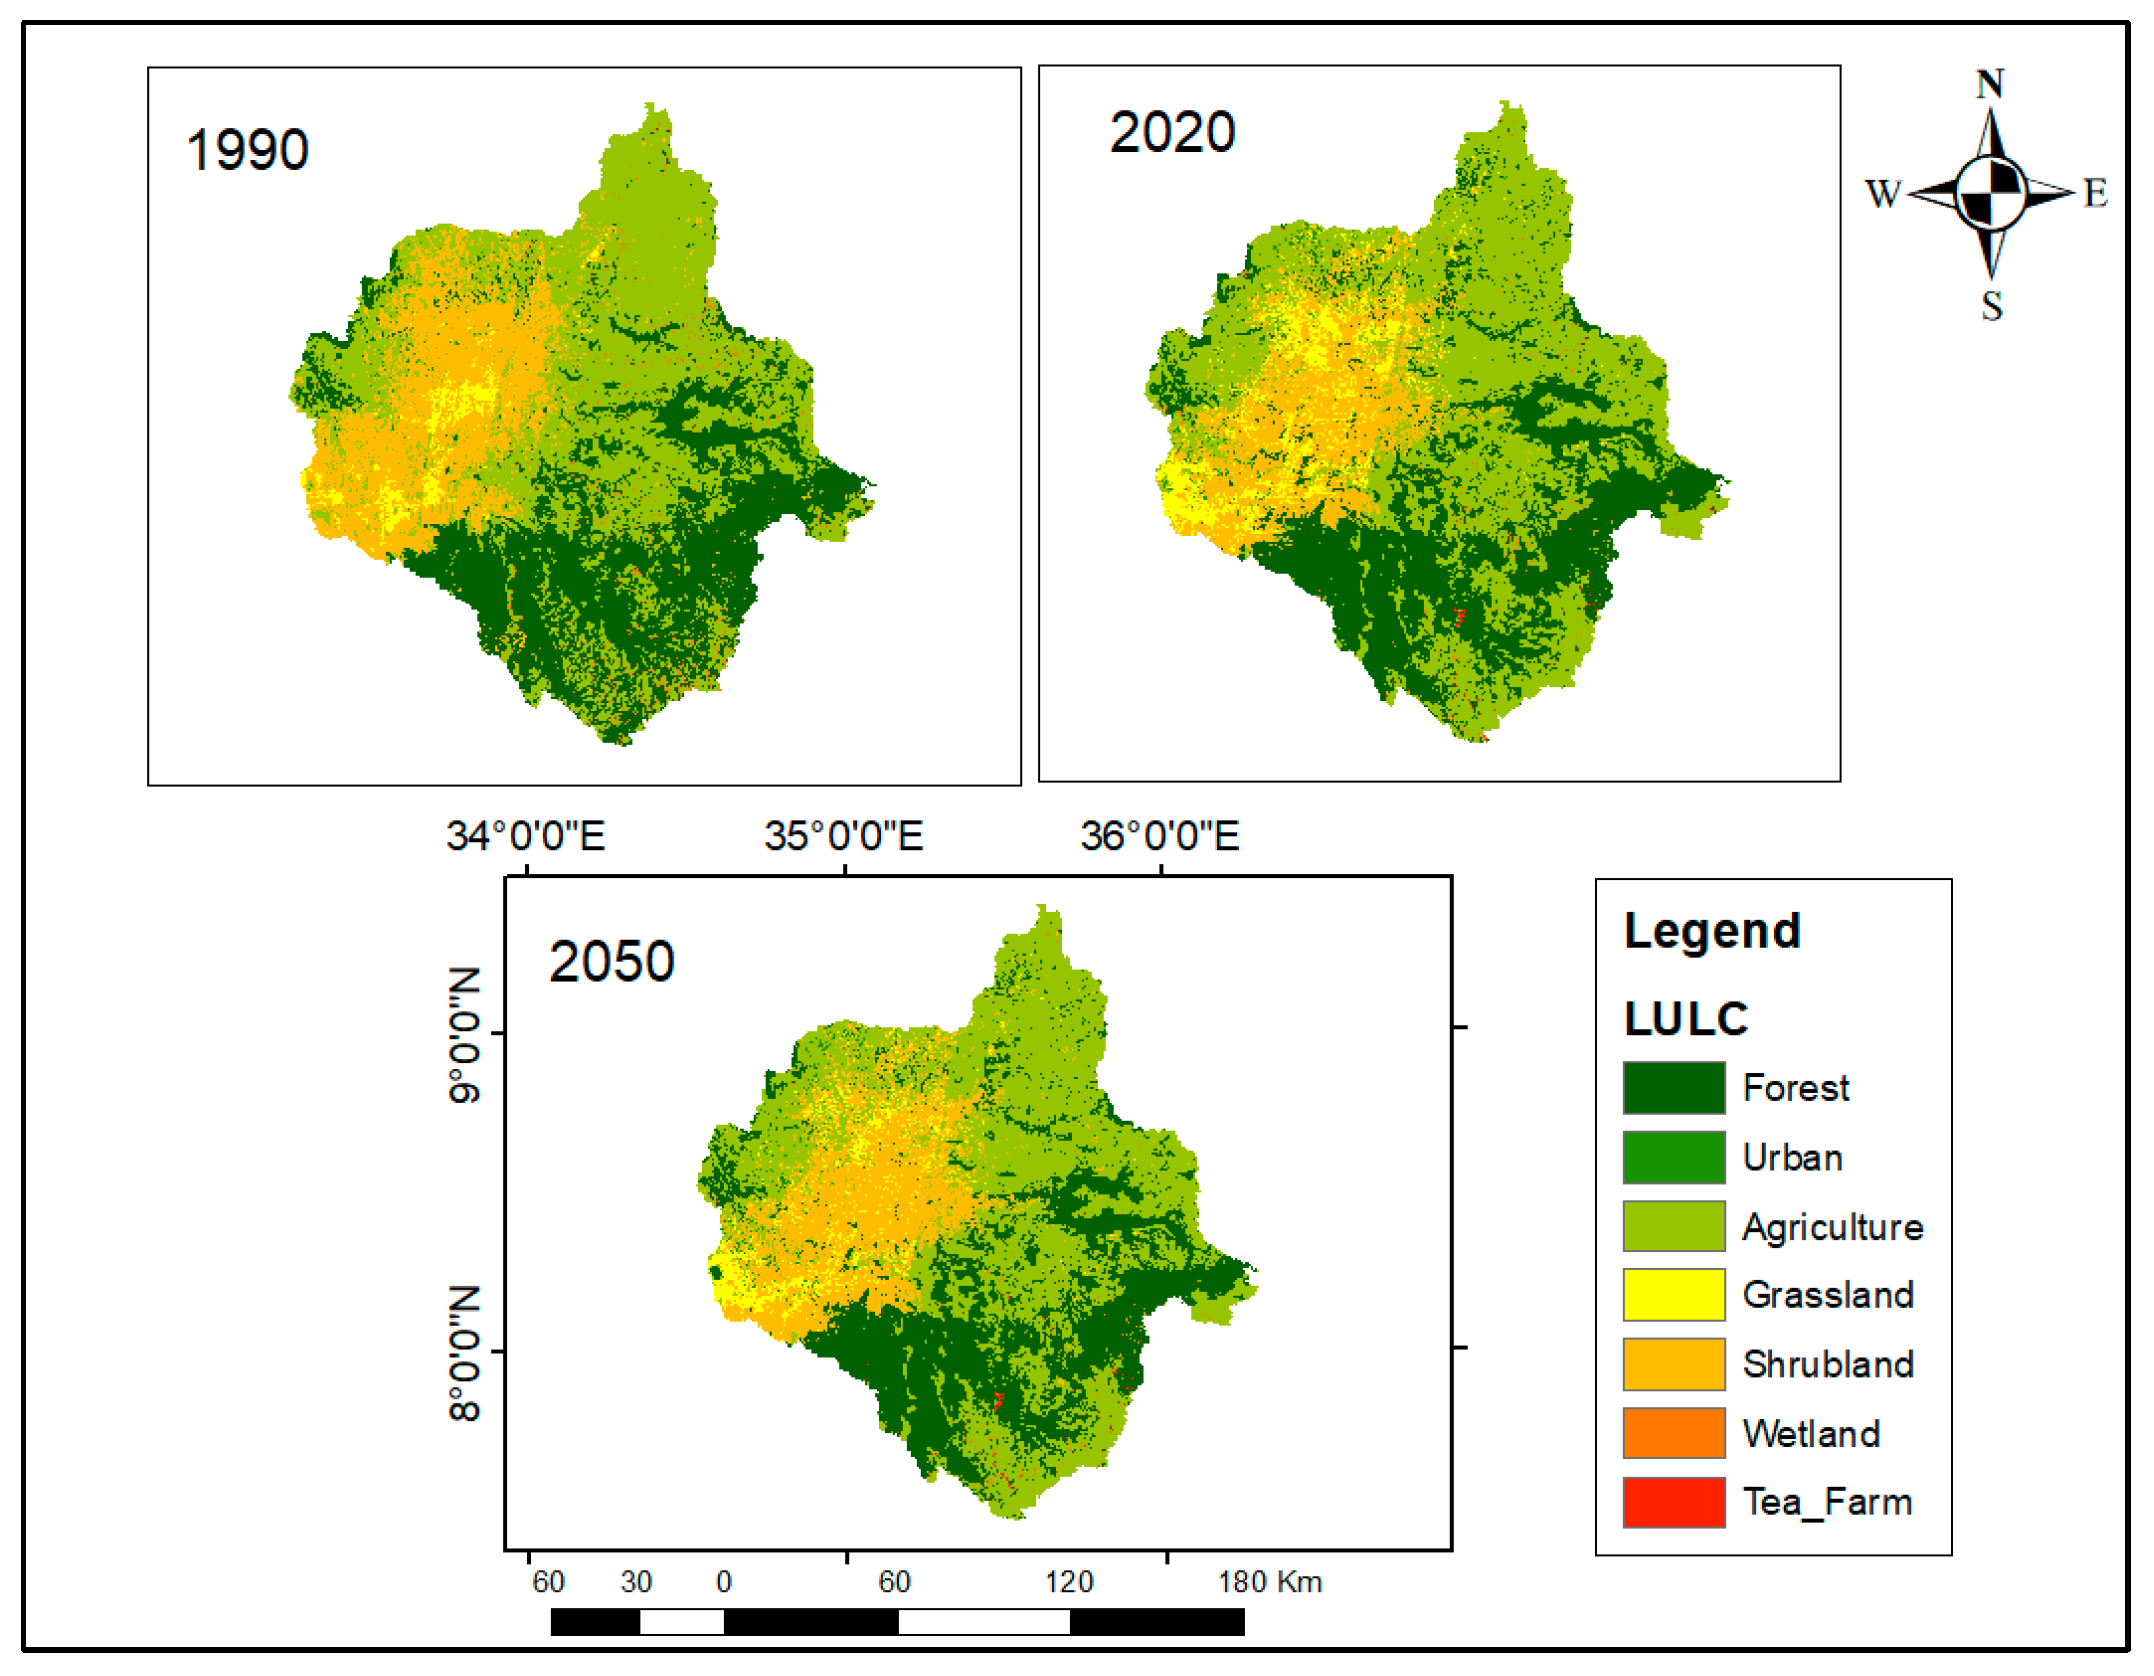
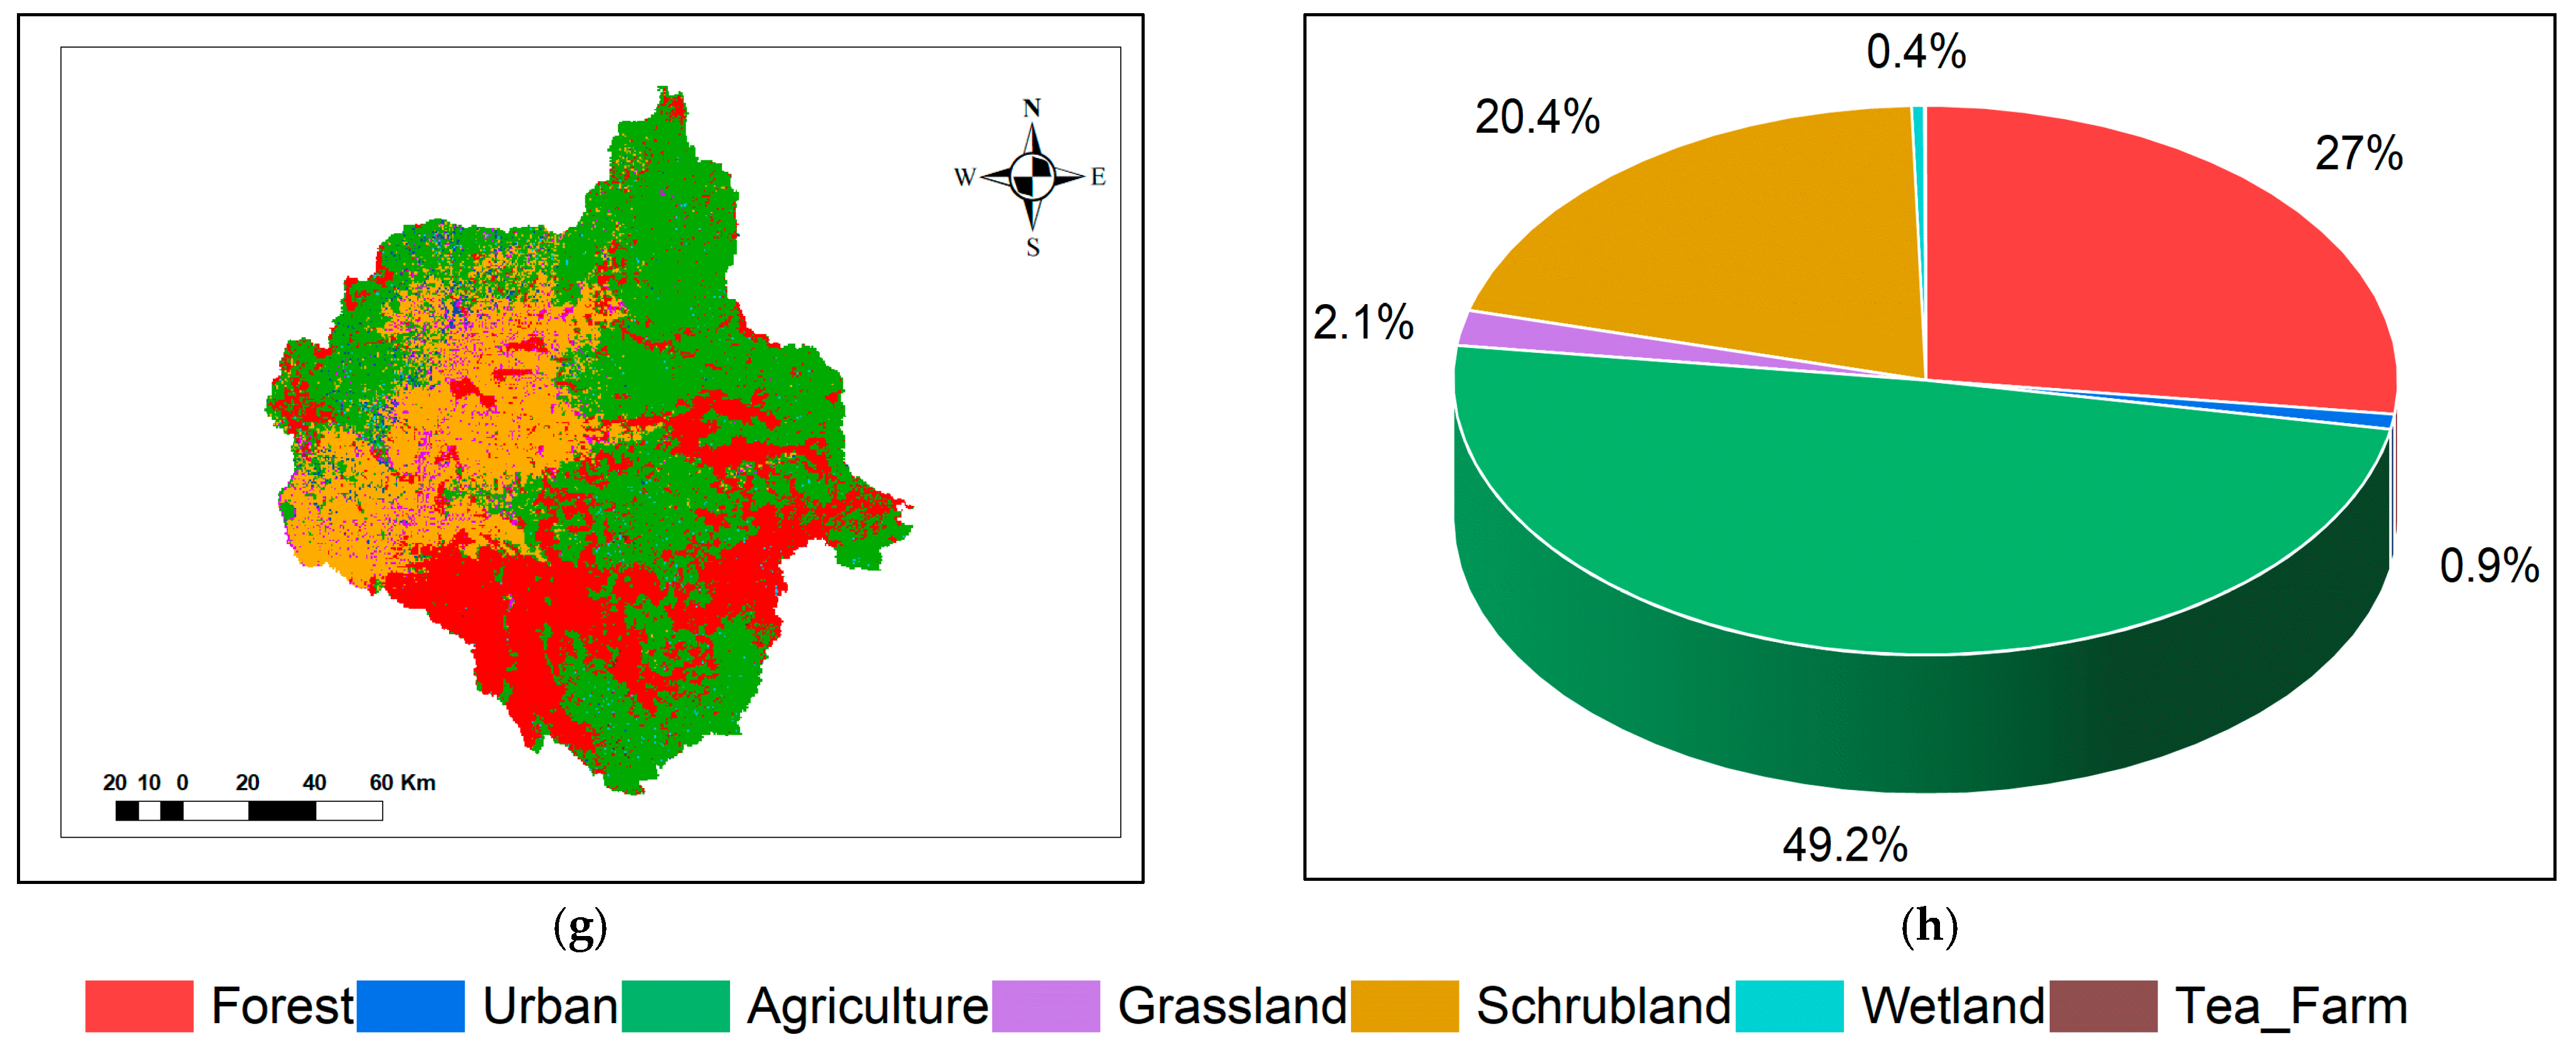
3.1. Land Use/Cover Change Analysis

The LULC for the periods of 1990, 2000, and 2020 was reclassified using GEE. The accuracy of the classification was assessed in GEE using Kappa statistics and overall accuracy for all images, resulting in values of 0.77 and 0.86, 0.8 and 0.88, and 0.82 and 0.89 for 1990, 2000, and 2020, respectively. Accordingly, seven LULC were identified, including forest, agriculture, urban, shrubland, grassland, wetland, and tea farm (Figure 3). From Figure 3, we can observe a reduction in forest cover, while agricultural and shrubland coverage showed an increasing trend. This result was also confirmed in [23]. In general, agriculture, forest, shrubland, and grassland are the dominant LULC types, accounting for around 45%, 31%, 21%, and 2%, respectively, in the basin (Figure 4).
The images from 1990 and 2000 were used to simulate the LULC map of 2020. The simulated land use map was then validated using the 2020 LULC map, which is the actual and recent map. It is important to note that the LCM considers the interval of changes made during the analysis for predicting specific periods [44]. Therefore, for simulating the LULC map of 2020, the LCM considered the pattern and rate of change between 1990 and 2000 twice. This means that the model takes into account the patterns and rates of change observed in the input data over the specified intervals to make predictions for the target year. This helps ensure that the model’s predictions are consistent with the observed changes over time and reflect the dynamics of land use and land cover change. The performance of the model was evaluated using the commonly used Kappa indices, including % of correctness, Koverall, Kloc, and Khisto, and yielded validation results of 84.5, 0.76, 0.92, and 0.83, respectively, describing a good projection ability of the model [37,44].
Then, the LULC for the 2050s was predicted using the LCM based on the validated land use maps of the 2020s. The explanatory variables elevation and slope were selected as static explanatory variables, whereas distance from road, distance from urban, and population density were selected as dynamic explanatory variables, as their distance varies with time. Based on this, it was found that forest cover showed a reduction of 14.4% between 1990 and the 2050s, whereas agriculture coverage increased by 9.1%.

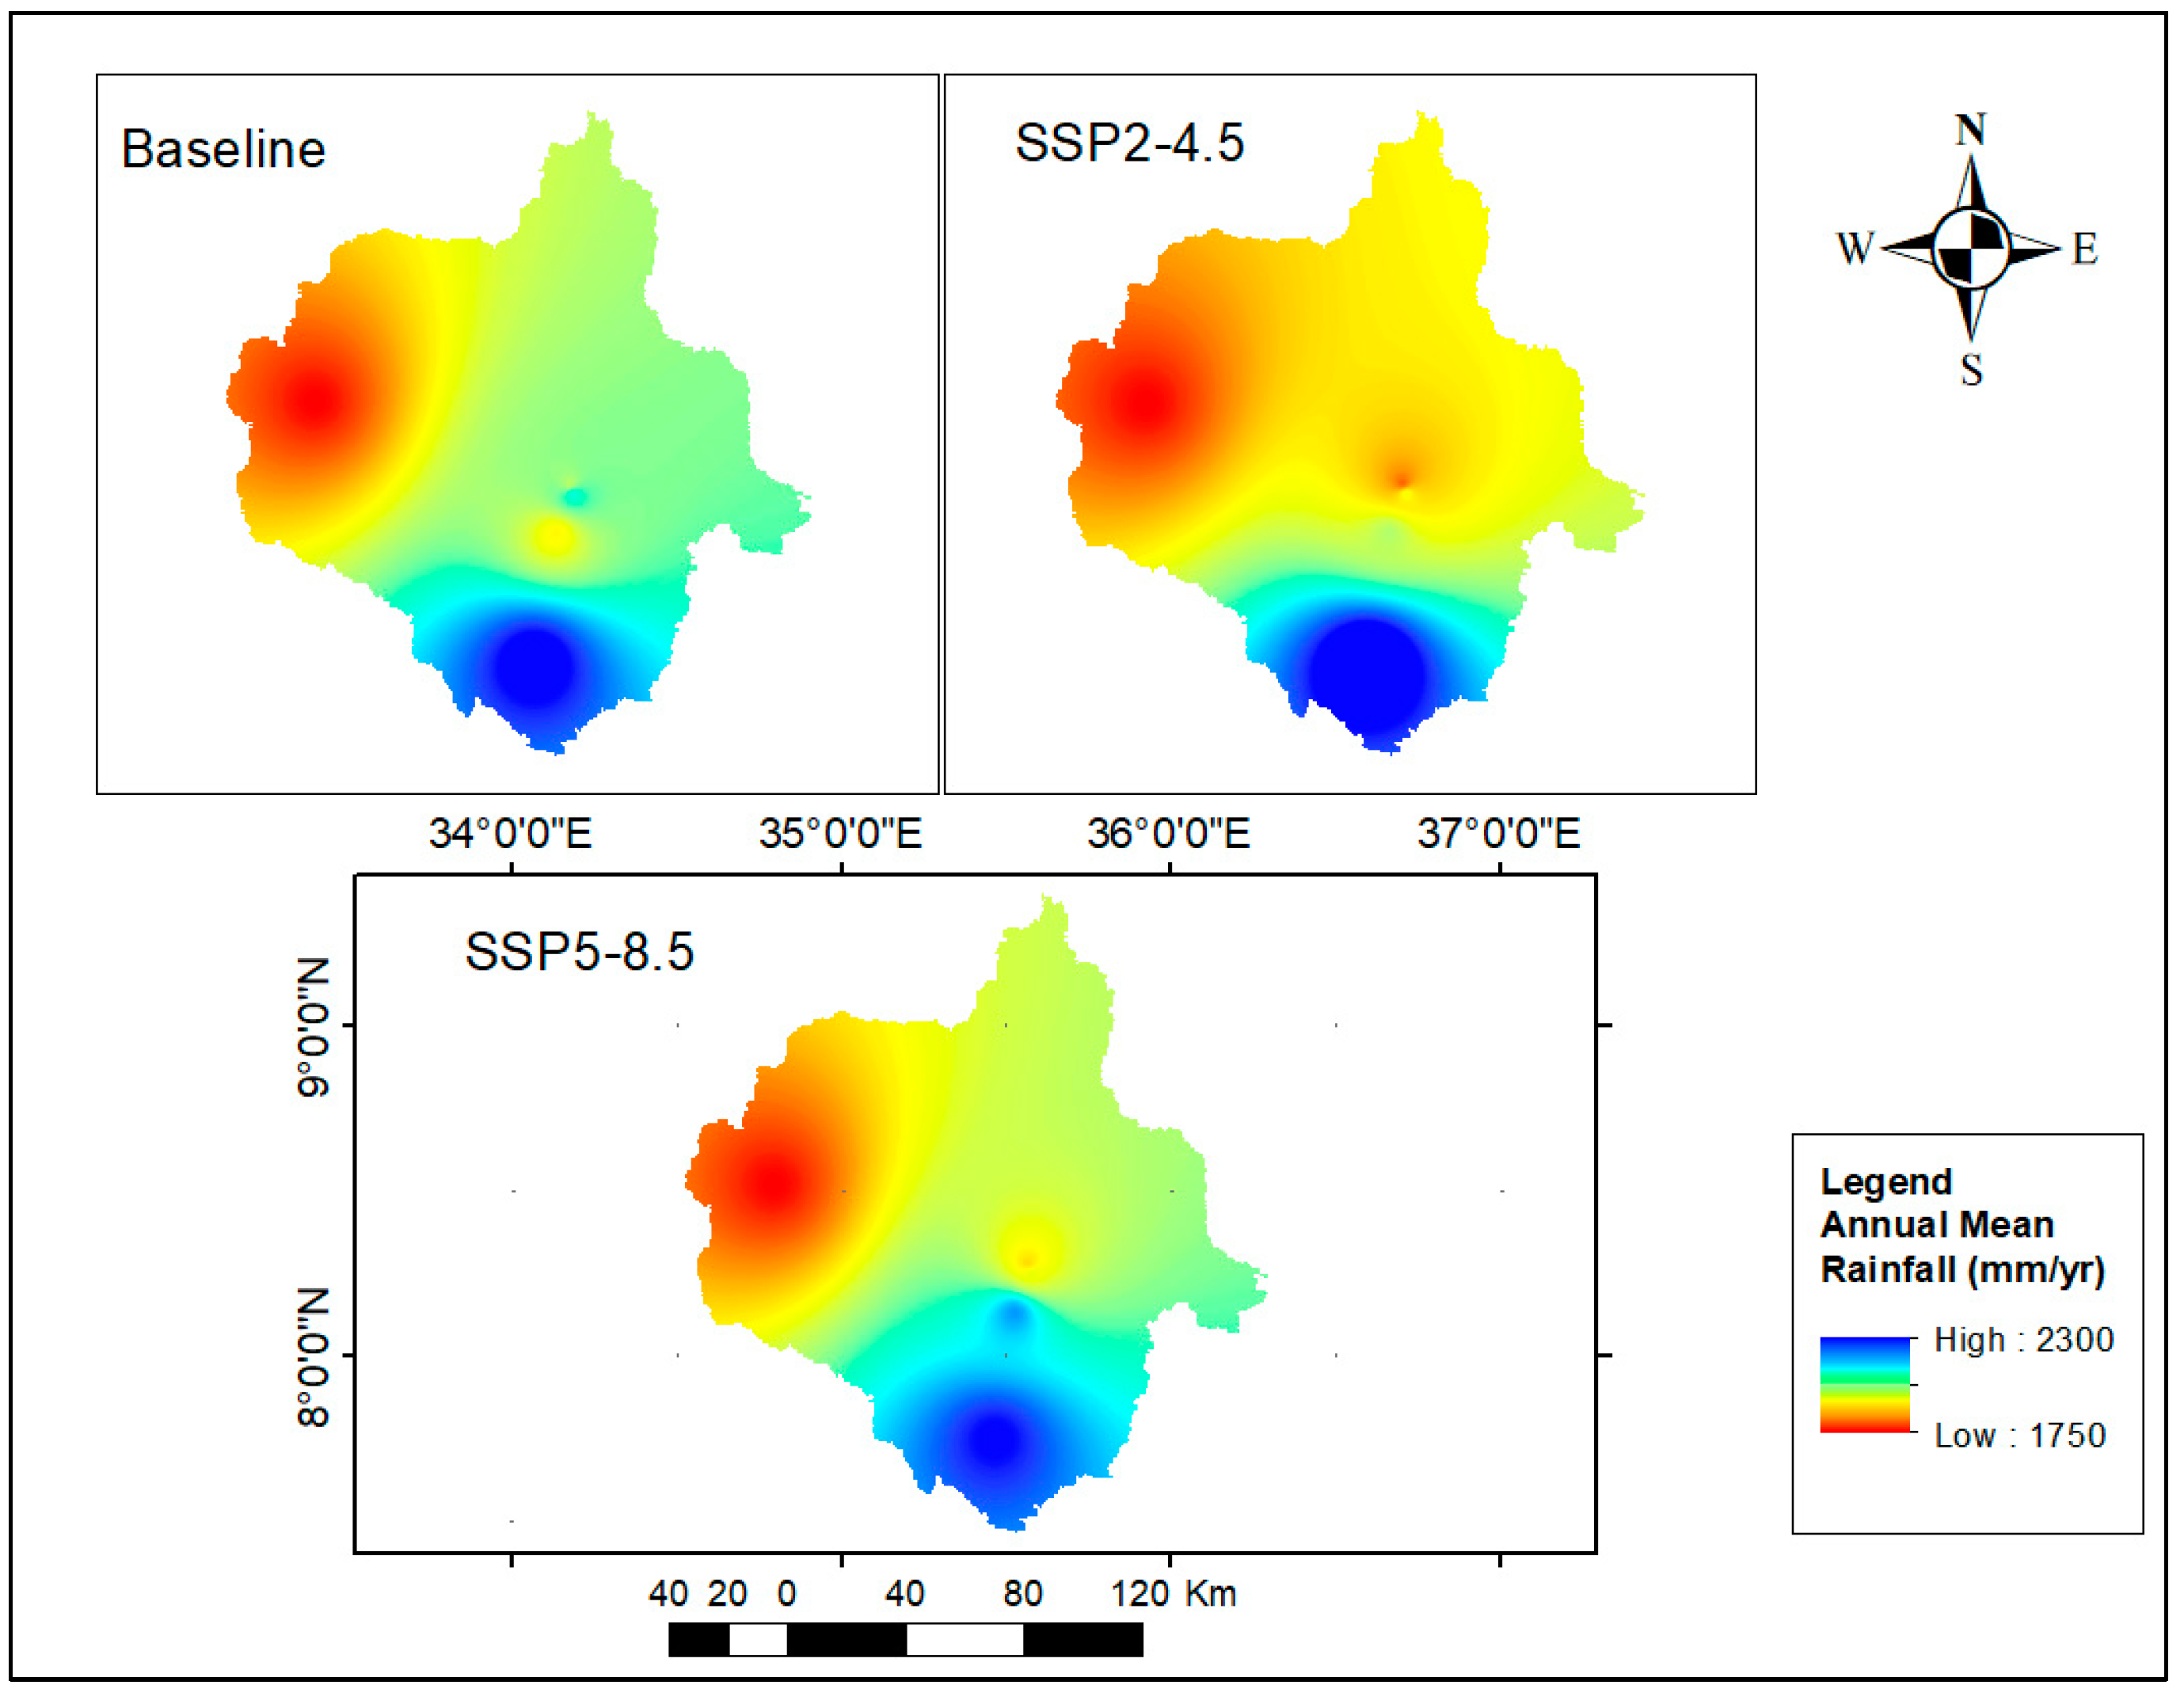
3.2. Climate Change Analysis

The ensemble of four climate models (NorESM2-MM, EC-Earth3-Veg, INM-CM5-0, and INM-CM4-8) from the CMIP6 project was extracted for two SSPs (SSP2-4.5 and SSP5-8.5). Then, downscaling and bias correction of the climate mode outputs for the basin were performed using Climate Model data for hydrologic modeling (CMhyd). The ensemble of these climate models was tested in [2], and this provided a good representation of the basin. In this study, we also applied the ensemble of these four climate models for the analysis of the relative and combined impact of CC and LULCC on streamflow of the BRB.
The spatial distribution of climate data in this study was evaluated using the Inverse Distance Weighting (IDW) method in ArcGIS to analyze the spatial patterns and trends of precipitation and climate data in the basin. This method has been evaluated by different researchers and was found to be an effective method for the spatial analysis of climate data [23,45,46].
As shown in Figure 5, the rainfall in the basin exhibited an increment in both scenarios, with 8% under SSP2-4.5 and 15.4% under SSP5-8.5 scenarios in the 2050s, confirming the results found in [25,47]. The authors of [25] found that the projected annual rainfall showed an increase of 6% and 16.46% under SSP2-4.5 and SSP5-8.5 scenarios, respectively.
Similarly, changes in the maximum and minimum temperatures in the basin were estimated for the future (Figure 6). These projections were compared to the baseline conditions under the SSP2-4.5 and SSP5-8.5 scenarios. The findings revealed that the maximum temperature is expected to rise by 4.4% and 6.3% under the SSP2-4.5 and SSP5-8.5 scenarios, respectively (Figure 6a), while the minimum temperature demonstrated an increase of 12.2% and 22.4% under the SSP2-4.5 and SSP5-8.5 scenarios, respectively (Figure 6b).

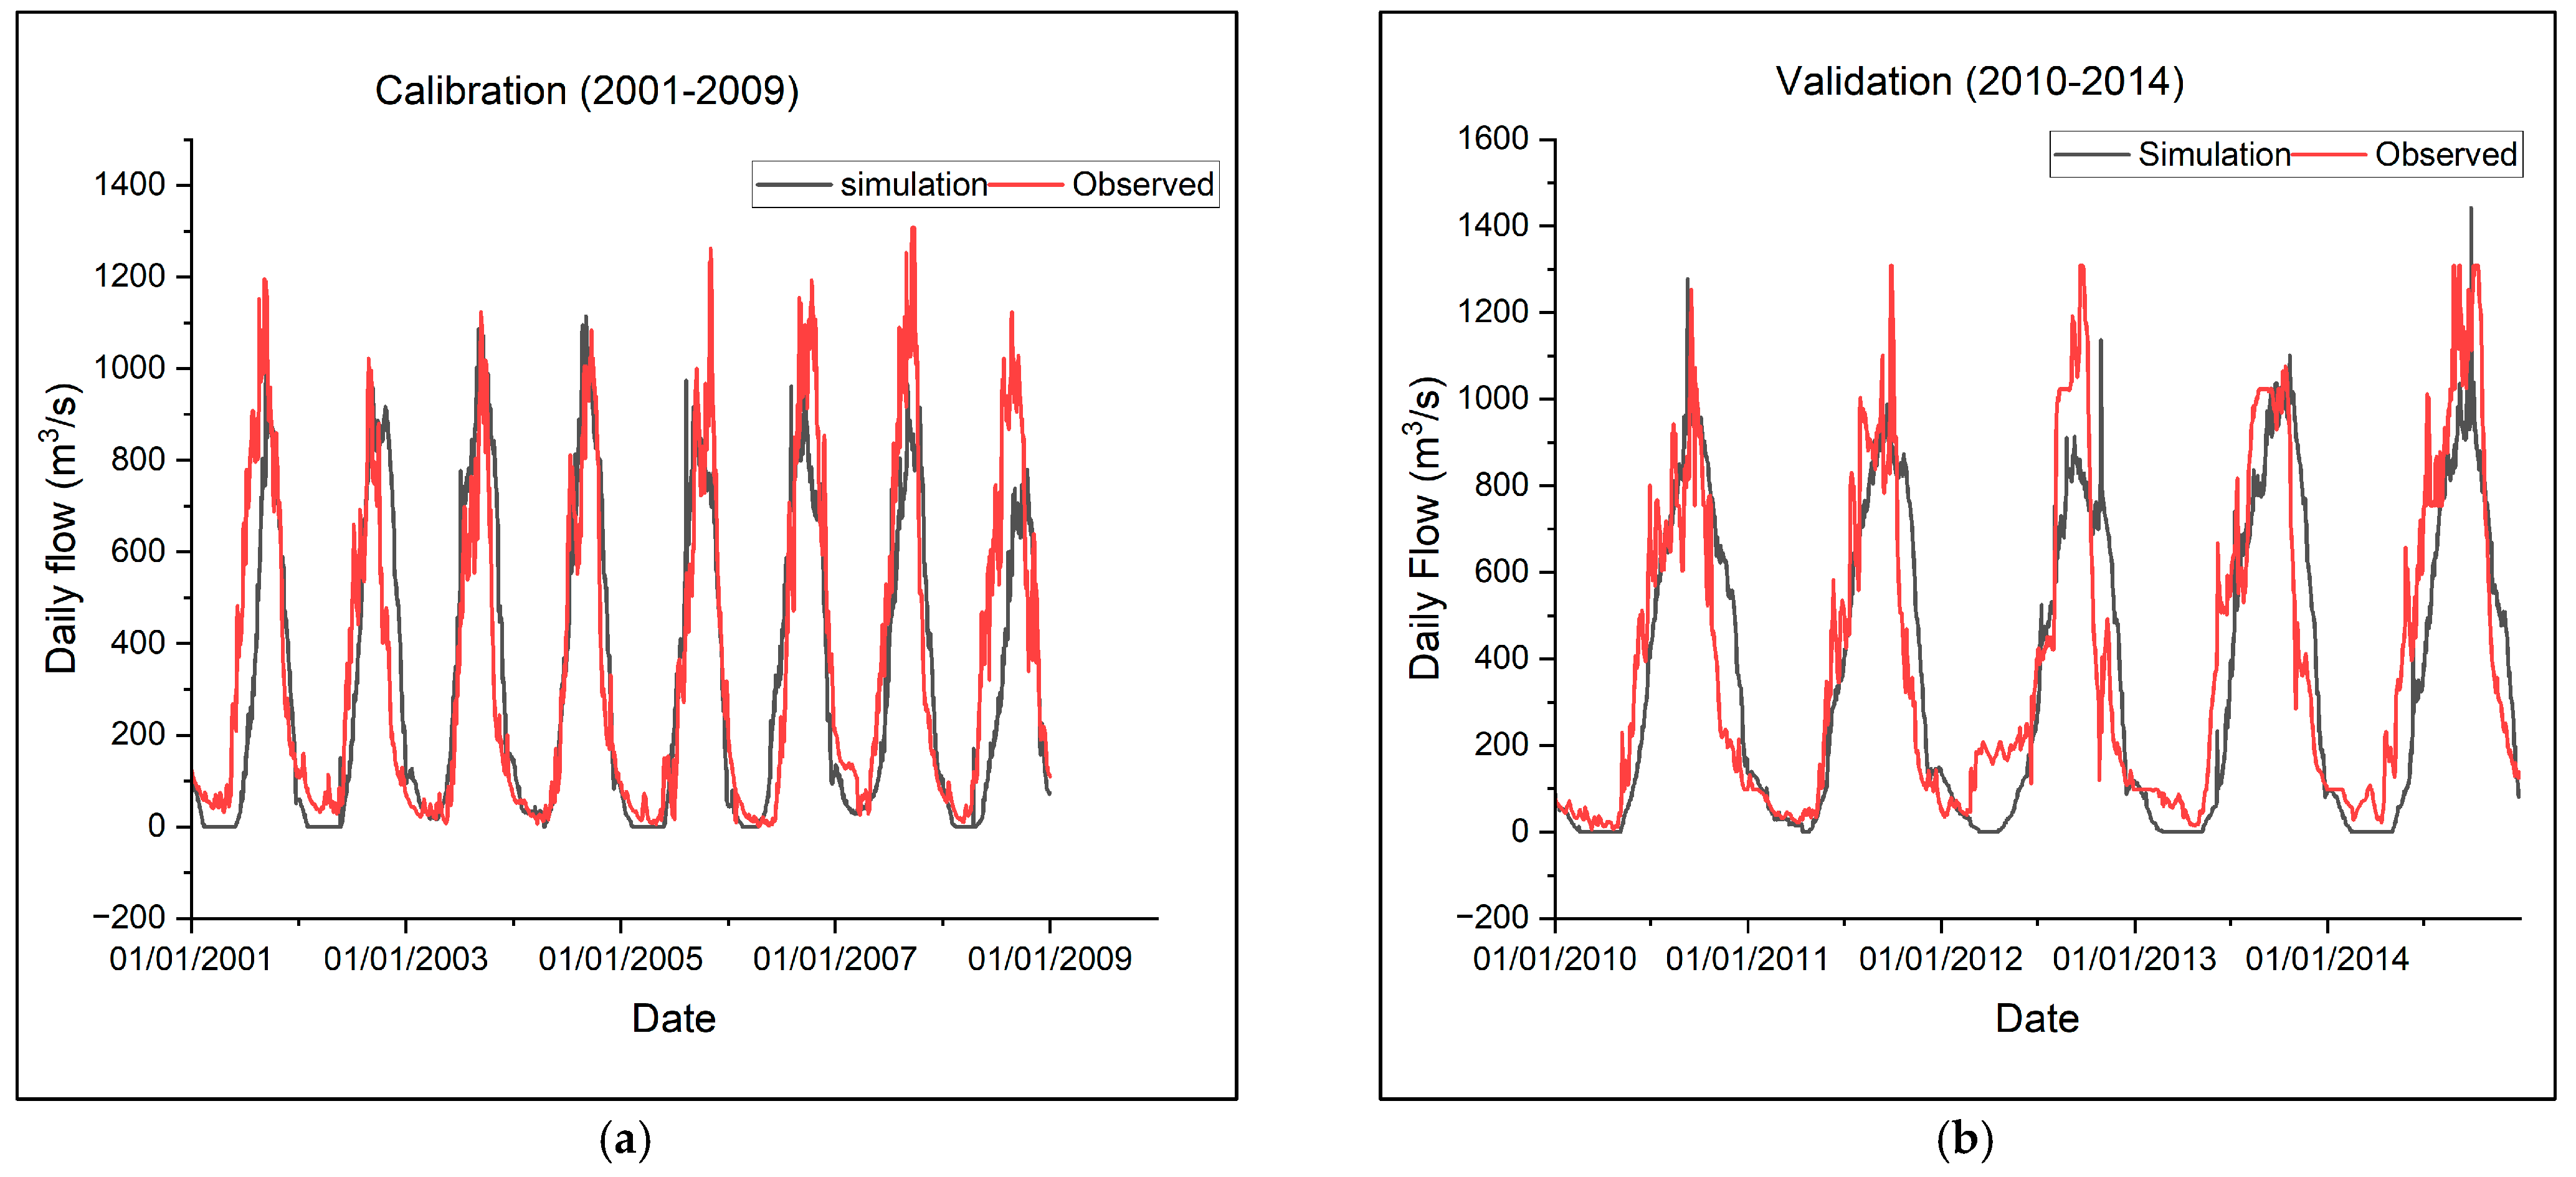
3.3. Hydrological Modeling Using SWAT+

According to the streamflow daily observation data, the time intervals from 2001 to 2009 and 2010 to 2014 were designated as the calibration and validation periods, respectively. The model calibration and validation were based on LULCC 1990 and the baseline climate (1985–2014). The criteria used for model performance evaluations were NSE, RMSE, PBIAS, and R2 (Table 5). The simulated values closely matched the observed data on a daily basis, indicating a strong agreement between the two predicted and observed values in both the calibration (2001–2009) and validation (2010–2014) periods (Figure 7a,b). Hence, the results indicate that the model can be utilized to assess the variability of streamflow within the study area.

3.4. Streamflow Response Modeling under Different Scenarios

Streamflow was then simulated using three scenarios: CC alone, LULCC alone, and their combinations, using the SWAT+ model for historical and future mid-term (2041–2070) scenarios. The LULC of 1990, 2020, and 2050, and climate scenarios of baseline, SSP2-4.5, and SSP5-8.5, were used for simulating the flow.

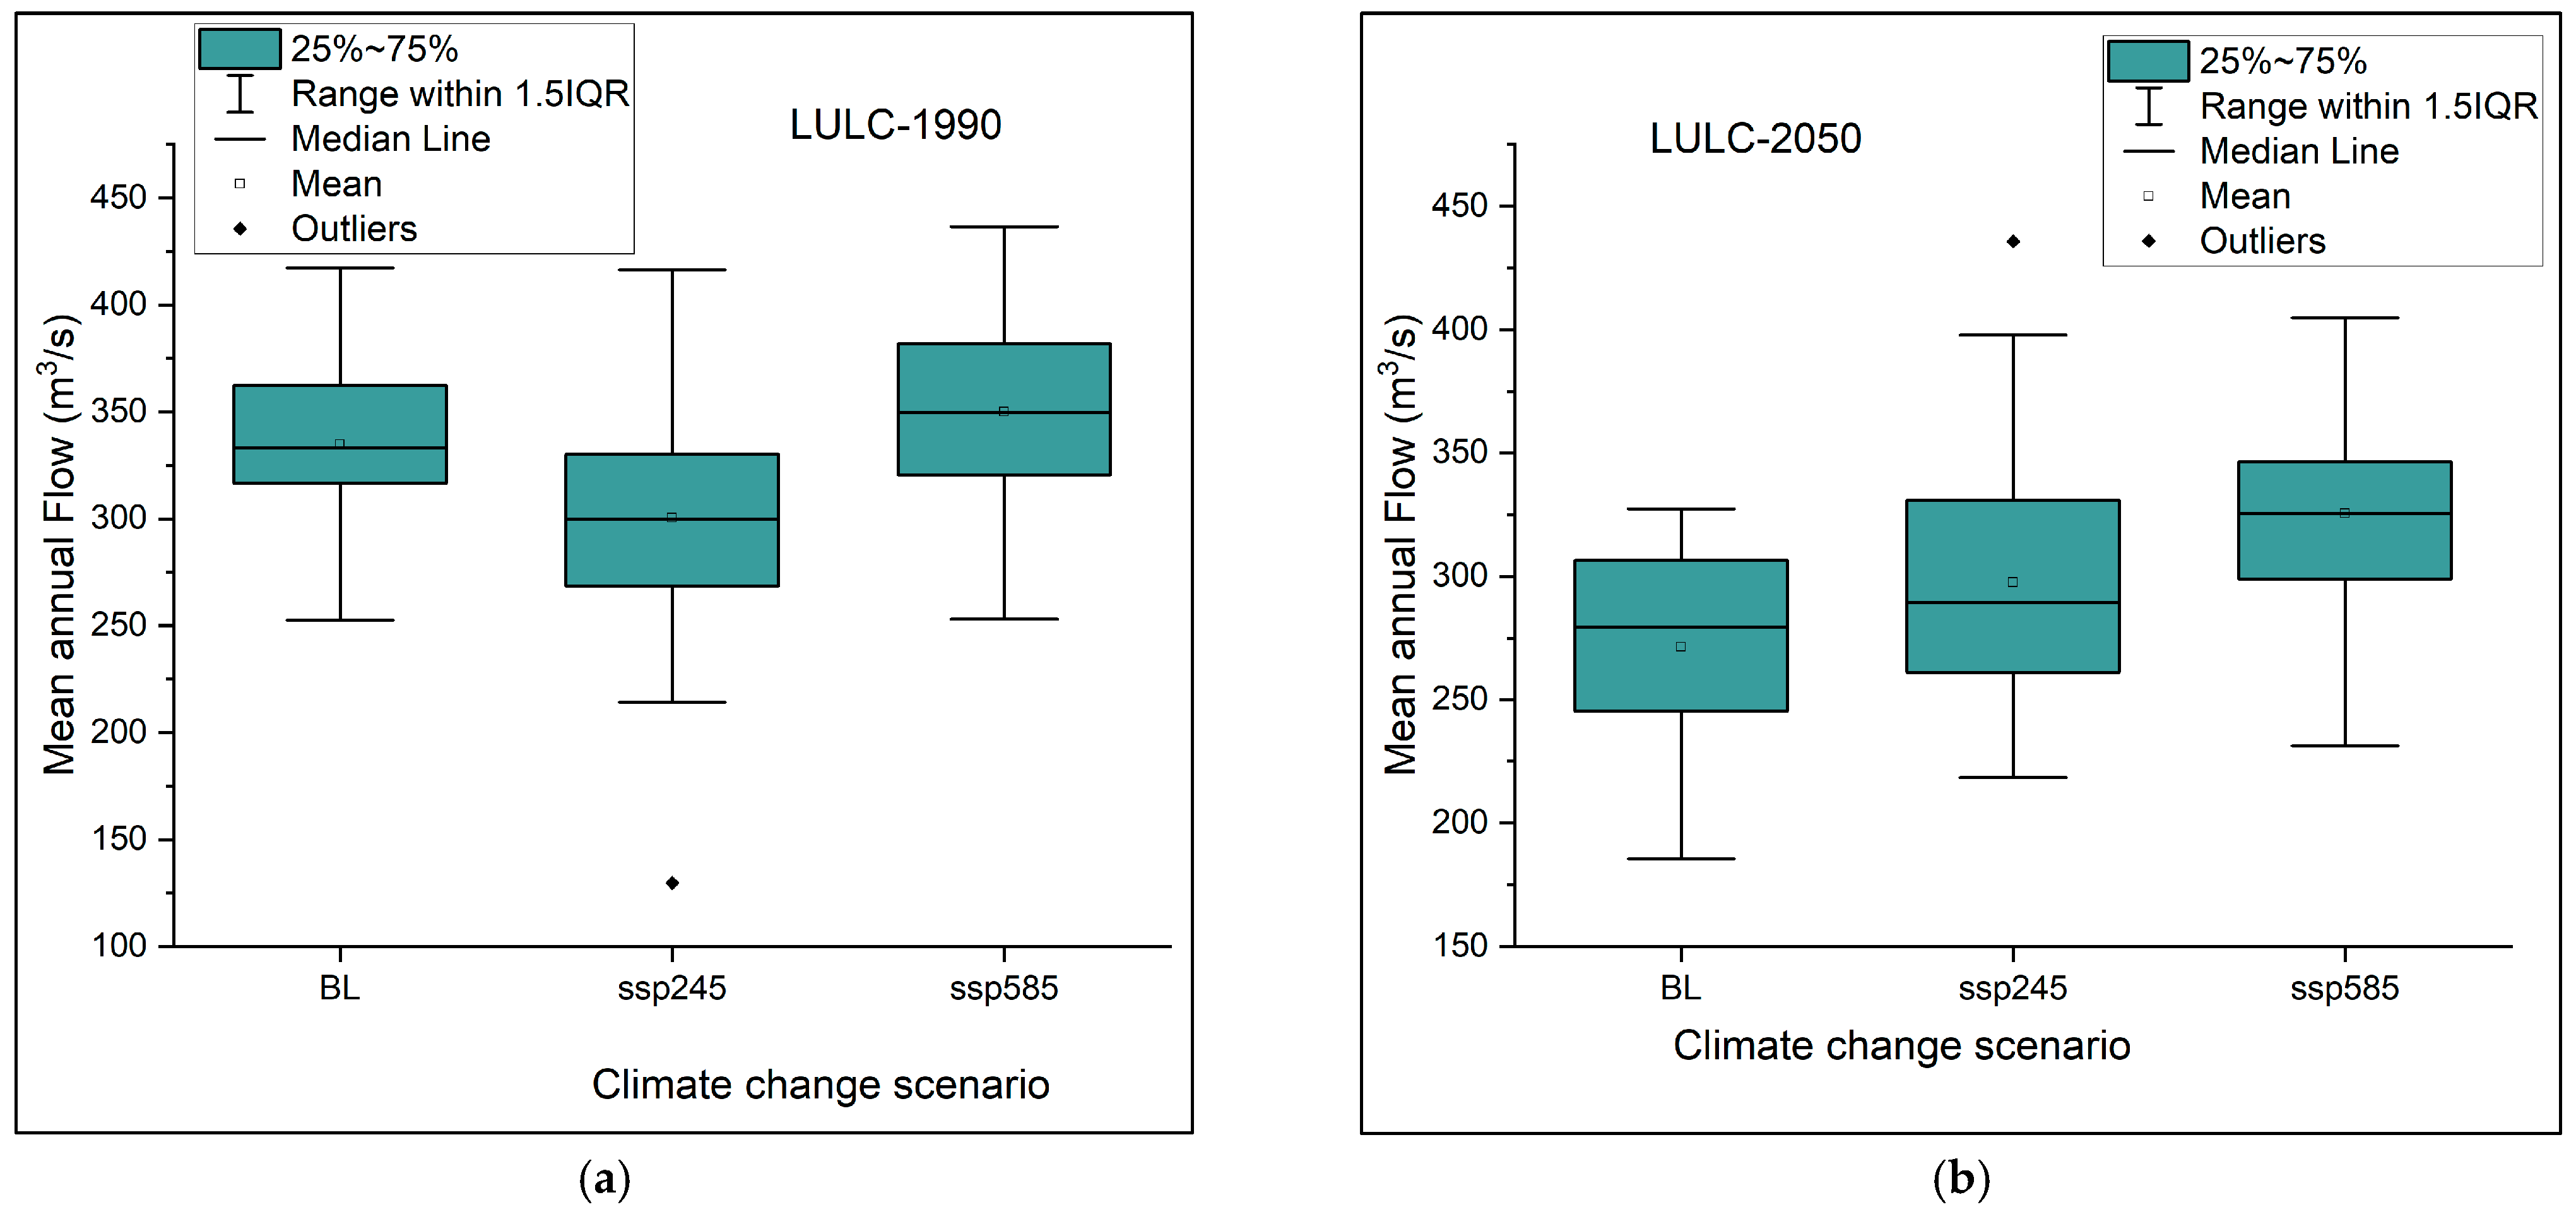
3.4.1. Scenario 1: Constant LULC with Varying Climate Scenarios

In this section, we evaluated the impact of CC on streamflow while keeping LULC constant for the periods of 1990, 2020, and 2050 (Table 6). With the LULC data from 1990, we found mean flows of 334.8, 300.4, and 350.2 m3/s for the baseline (1985–2014), SSP2-4.5 (2041–2070), and SSP5-8.5 (2041–2070) scenarios, respectively (Figure 8). Using the LULC data from 2020, the mean flow of the Baro River was estimated as 275.8, 312.3, and 341.5 m3/s for the baseline, SSP2-4.5, and SSP5-8.5 scenarios, respectively. Meanwhile, for the LULC projected for 2050, the mean flow was determined as 271.7, 318.9, and 325.6 m3/s for the baseline, SSP2-4.5, and SSP5-8.5 scenarios, respectively (Table 6). In general, for constant LULC, the transition from the SSP2-4.5 scenario to SSP5-8.5 demonstrated an overall increase in flow, attributed to heightened rainfall and temperatures in the basin.
Figure 8 indicates a rise in the annual mean flow magnitude for all climate scenarios, with the exception of the land use of 1990 under the SSP2-4.5 scenario. To elaborate further, when conducting flow simulations based on the 1990 LULC, there was a 10.3% decrease in flow magnitude under the SSP2-4.5 scenario, but a 4.6% increase under the SSP5-8.5 scenario. This shows the dominance of LULCC for streamflow under SSP2-4.5 compared to the influence of CC under the SSP5-8.5 scenario.
In general, for consistent LULC, when transitioning from the climate scenario of SSP2-4.5 to SSP5-8.5, there was generally an upward trend observed in streamflow. Based on LULC data from 1990, the minimum and maximum annual mean flow were determined as 252.7 to 417.2 m3/s, 129.6 to 416.7 m3/s, and 253.1 to 436.7 m3/s, with median values of 332.9 m3/s, 300.1 m3/s, and 349.5 m3/s under baseline, SSP2-4.5, and SSP5-8.5 climates, respectively.
Similarly, using the LULC projections for the year 2050, the minimum and maximum annual mean flow were determined as 185.6 to 327.3 m3/s, 218.4 to 435.7 m3/s, and 231.3 to 404.8 m3/s, with median values of 279.5 m3/s, 289.5 m3/s, and 325.5 m3/s for the baseline, SSP2-4.5, and SSP5-8.5 climates, respectively. Similarly, using the LULC of 1990, the minimum and maximum annual mean flow were determined as 252.7 to 417.2 m3/s, 129.6 to 416.7 m3/s, and 253.1 to 436.7 m3/s, with median values of 332.9 m3/s, 300.1 m3/s, and 349.5 m3/s under baseline, SSP2-4.5, and SSP5-8.5 climates, respectively (Figure 9).
The upward trend in streamflow observed when transitioning from SSP2-4.5 to SSP5-8.5 shows the potential influence of CC on hydrological regimes. The trend suggests that under the SSP5-8.5 scenario, representing a high-emission future, there may be an increase in streamflow compared to the SSP2-4.5 scenario, which represents a moderate-emission scenario. This increase in streamflow can have both positive and negative effects in the basin, such as increased water availability for human and ecological needs, as well as an increased risk of flooding and erosion.
The rising pattern in rainfall, as well as maximum and minimum temperatures observed in the basin, validated our anticipated outcome. Furthermore, this result is consistent with the recent research results conducted in the basin, as evident in studies such as [25,48,49].

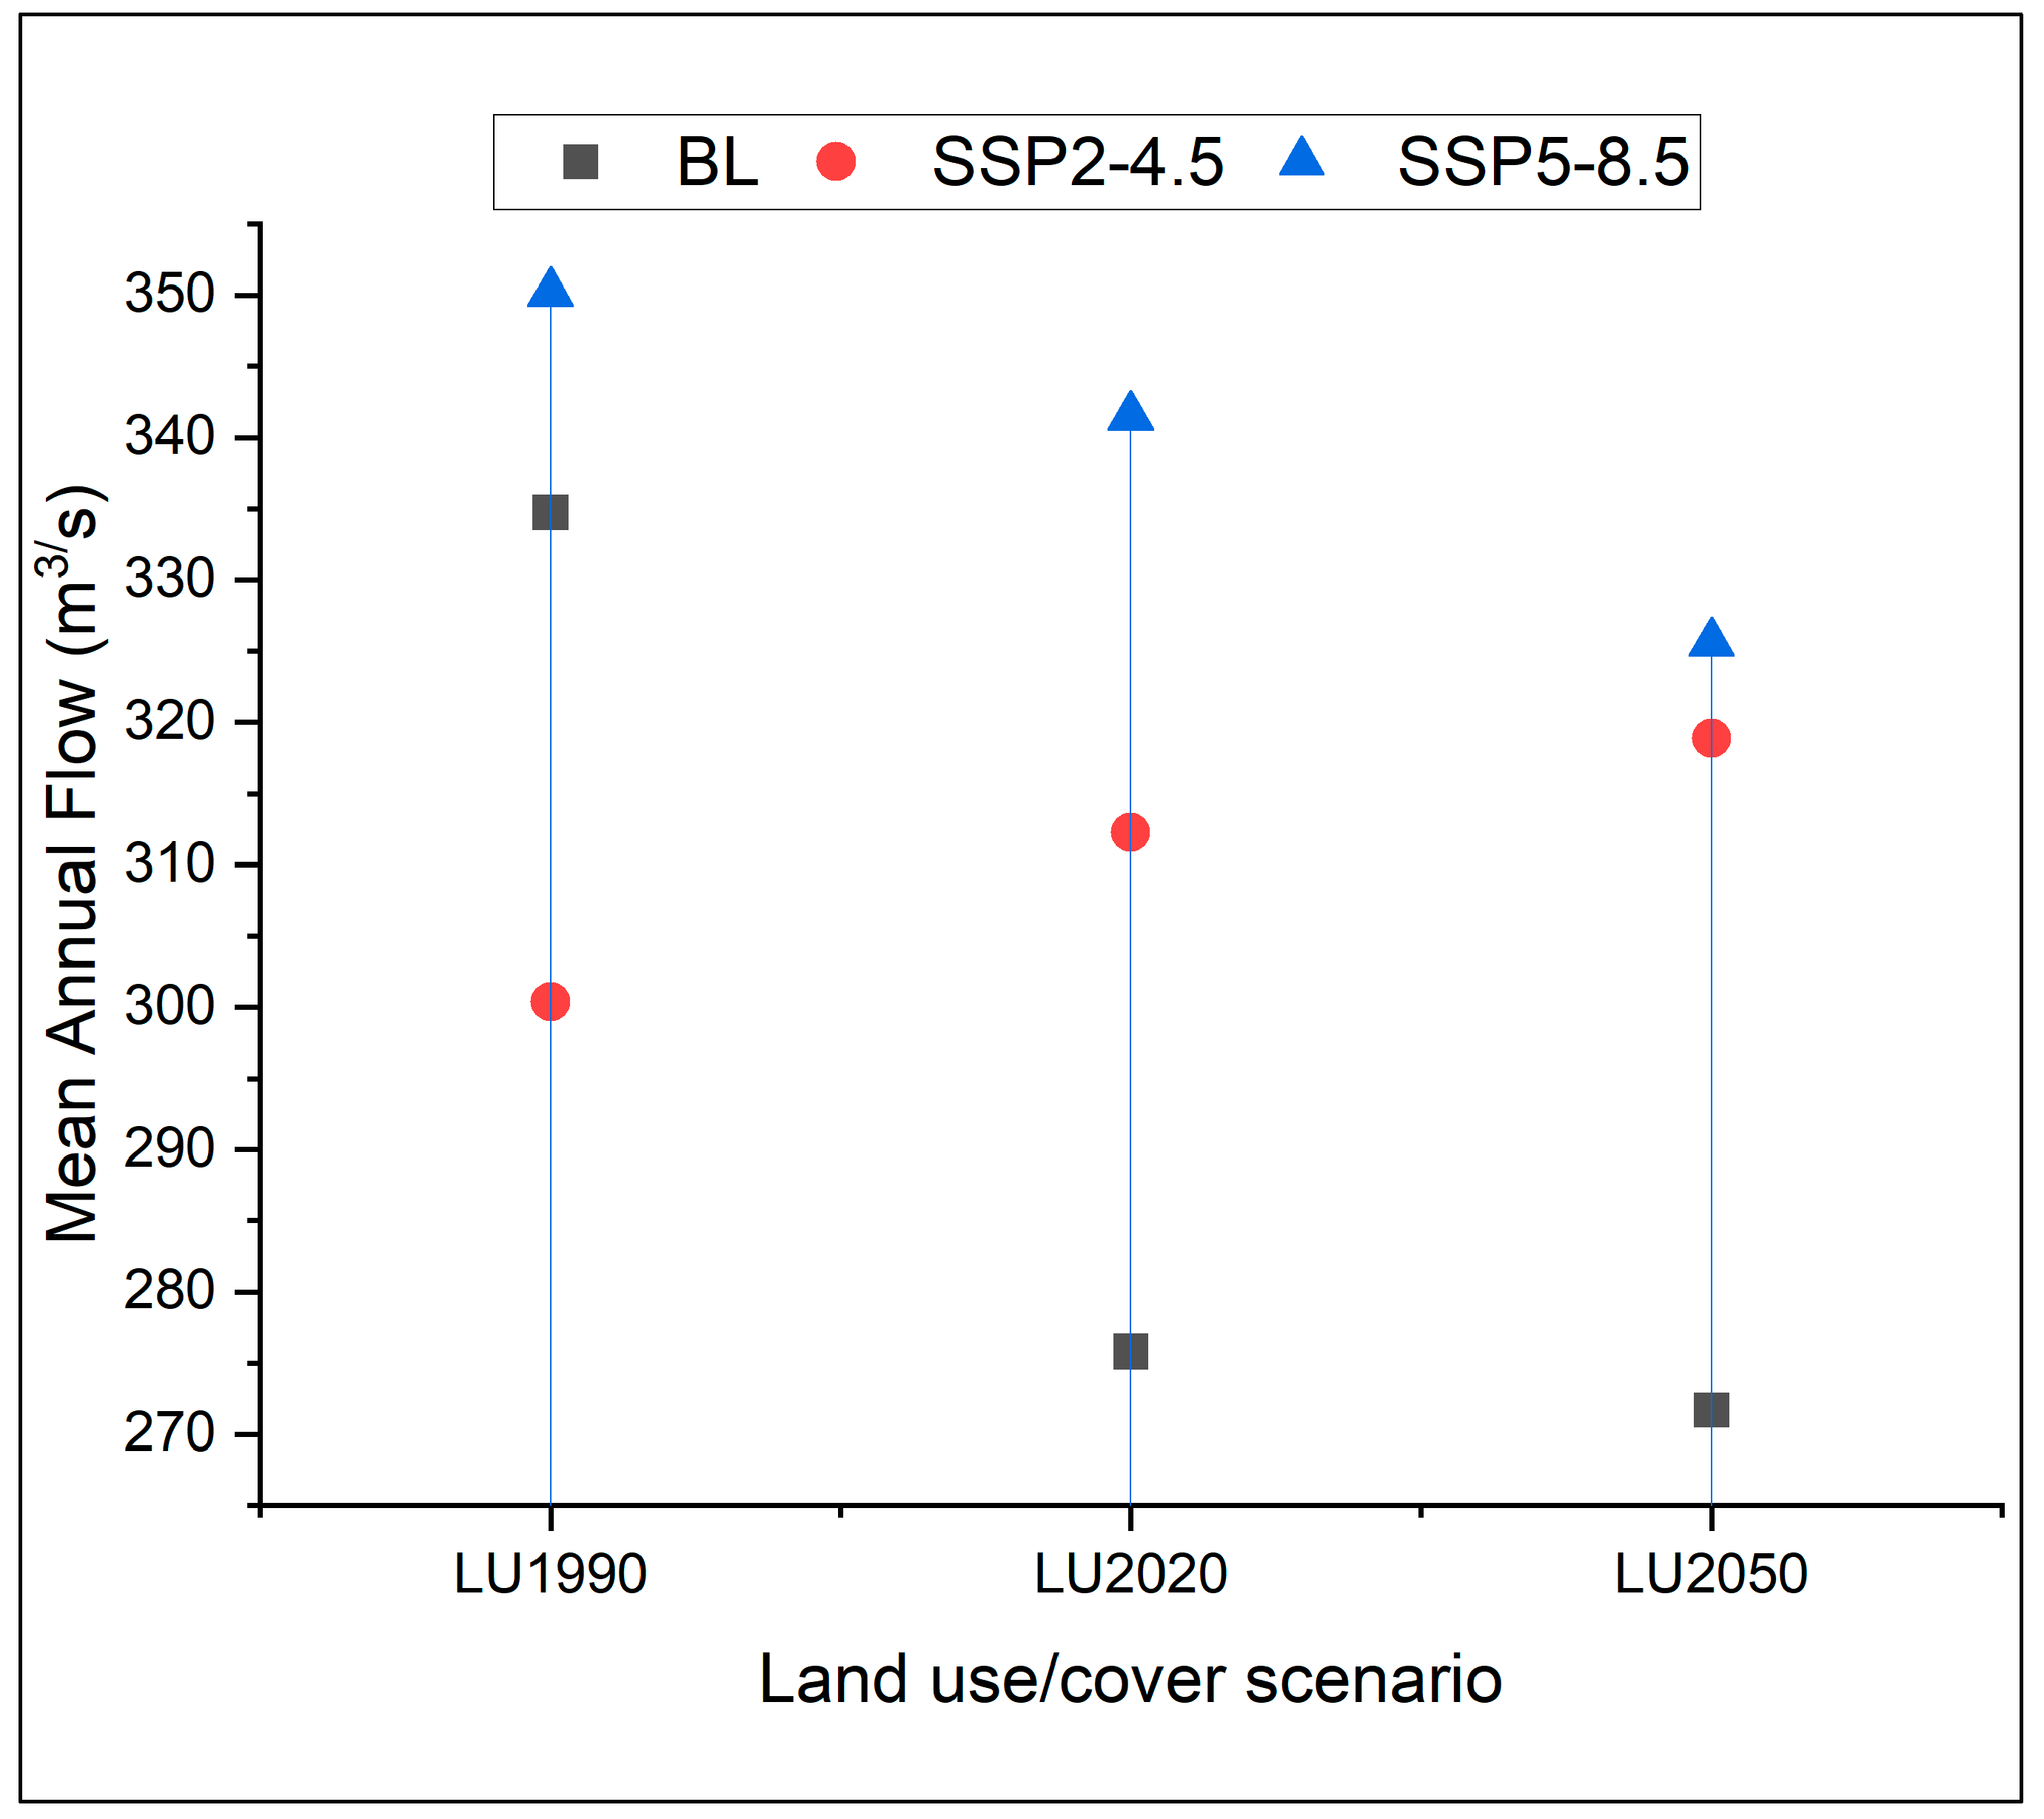
3.4.2. Scenario 2: Constant Climate but Varying LULCC

The variability of flow, while keeping the climate constant but varying LULC, was analyzed in this section (Figure 10). Using the baseline climate (1985–2014), the mean annual flow of the Baro River was found to be 334.8, 275.8, and 271.7 for the LULC periods of 1990, 2020, and 2050, respectively. This shows a reduction of 17.6% and 18.8% under the LULC of 2020 and 2050 compared to the 1990s, respectively.
In general, for constant climate but accounting for potential LULC changes, it was found that the change in LULC from 1990 to 2050 significantly reduced streamflow (Figure 11). For instance, the minimum and maximum mean annual flow ranged from 252.2 to 384 m3/s, 192.9 to 324.1 m3/s, and 183.8 to 324.4 m3/s, with the median values of 330.9 m3/s, 266.2 m3/s, and 259.4 m3/s under the LULC scenarios of 1990, 2020, and 2050, respectively. This indicates that compared to the baseline, the LULC of 2020 and 2050 reduced the flow by 19% and 21.6%, as estimated using the median flow values. These findings underscore that projected LULC changes could significantly impact streamflow and water availability in the basin.

3.4.3. Scenario 3: Streamflow Response to Relative and Combined Impact of CC and LULCC

Streamflow for the future period (2041–2070) was forecasted using two climate scenarios (SSP2-4.5 and SSP5-8.5) and LULCC scenarios of 1990 and 2050 in the BRB, with the reference period being 1985–2014 (Table 6). For evaluating the combined impact, the streamflow was predicted under climate scenarios from 2041 to 2070 and LULCC 2050 scenarios in the BRB, with 1985–2014 as the reference period.
The annual mean streamflow exhibited variations ranging from 289.5 to 435.7 m3/s and 325.6 to 404 m3/s under SSP2-4.5 and SSP5-8.5 with LULC of 2050s, while it ranged from 185.6 to 327.3 m3/s for the baseline climate and LULC of 1990. This indicates that the combined effect resulted in an increase in streamflow compared to the baseline by 9.6% and 19.9% under SSP2-4.5 and SSP5-8.5, respectively. This suggests that in the BRB, CC plays a more significant role in the reduction of flow magnitude in the 2050s compared to the land use change impact, as confirmed in [23].
Generally, comparing the impact of LULC and climate on the variability of streamflow in the basin, it was found that CC had a greater impact (Table 6. For a constant LULC with an increase in climate scenarios from SSP2-4.5 to SSP5-8.5, the streamflow showed a variation from 9.9% to 23.5% in the basin under the LULC of 2050. On the other hand, with a change in LULC from 1990 to 2020 and from 1990 to 2050, the streamflow showed a reduction of 3.4% to 7.8% and 2% to 7.8% under SSP2-4.5 and SSP5-8.5 scenarios, respectively. This finding is supported by the results of [23], where CC was the main driver of the water balance in the basin. According to their findings, CC is expected to have a much greater impact on the amount of streamflow, the resilience of riverine species, and the future availability of water resources, compared to land use change.
Furthermore, an examination of the percentage change in mean seasonal flow for the two scenarios in comparison to the baseline was conducted to comprehend future flow variability. The findings indicated that, in the SSP2-4.5 scenario, the greatest percentage change occurred during the Bega dry season (December, January, and February—DJF), while the smallest flow variation was observed in the Kiremt rainy season (June, July, and August—JJA; Figure 12). Conversely, in the SSP5-8.5 scenario, the most significant difference was noted during the Kiremt season, with the least variation observed in the Tseday season (September, October, and November—SON).

4. Discussion

The study presented a comprehensive analysis of LULC and CC impacts on streamflow in the BRB using the SWAT+ model. The LULC analysis for 1990, 2000, and 2020 revealed a reduction in forest cover, with increasing trends in agriculture and shrubland. Similar studies conducted in the basin also support these findings [22,29,50,51,52]. For example, the study in [22] showed a reduction in forest cover and expansion in agricultural land when comparing the years 1987 and 2017. These significant LULC changes have implications for the basin’s hydrology and ecology. The predicted LULC for the 2050s in this study suggested a further reduction in forest cover and an increase in agriculture, highlighting the ongoing changes in land use patterns.
In terms of climate change analysis, the study utilized an ensemble of climate models for SSP2-4.5 and SSP5-8.5 scenarios. The results showed an increase in rainfall and temperature under both SSP2-4.5 and SSP5-8.5 scenarios, with higher magnitudes projected under SSP5-8.5. These findings are consistent with previous studies [25] and indicated a significant warming and wetting trend in the basin, which can have profound impacts on water resources and ecosystems.
The findings from the streamflow response modeling under different scenarios provided valuable insights into the complex interplay between LULCC and CC in the BRB. Scenario 1, which focuses on the impact of CC while keeping LULC constant, highlighted the dominance of CC compared to LULCC in the streamflow response. This was shown by the overall increase in streamflow when transitioning from the SSP2-4.5 scenario to SSP5-8.5, attributed to heightened rainfall and temperatures. However, the streamflow under SSP2-4.5 with the LULC of 1990 showed a specific reduction, possibly due to the greater impact of LULCC compared to CC. This reduction could be attributed to decreased evapotranspiration and infiltration resulting from the conversion of land use from forest to agriculture in the basin, as supported in [53]. Studies such as [54,55] have similarly found that under the SSP2-4.5 scenario, the influence of LULC dominates on streamflow.
Scenario 2, which examines the impact of varying LULCC under constant climate conditions, showed a significant reduction in streamflow from 1990 to 2050 under the SSP5-8.5 and baseline, indicating that projected CCs could substantially impact water availability in the basin. Conversely, the streamflow showed an increasing magnitude under the SSP2-4.5, indicating that it is dominated by LULCC under this scenario. Lastly, Scenario 3 considered the combined impact of CC and LULCC and found that the combined impact led to an overall increase in streamflow by the 2050s. This showed that the streamflow in the 2050s was more influenced by climate change, as confirmed by the findings of [23] conducted in the basin. According to their findings, the combined impact of LULCC and CC resulted in an overall increase in streamflow, indicating that CC had a greater influence than LULCC in the basin. Overall, our findings underscored the importance of considering both CC and LULCC in water resource management strategies for the BRB, especially in anticipating future changes in streamflow and water availability.
From this finding, it was observed that streamflow showed a reduction due to LULC change in the basin. Therefore, effective catchment management is needed to overcome this, focusing on sustainable land use practices. Implementing riparian buffer zones can stabilize streambanks and reduce erosion, helping to maintain streamflow. Afforestation and reforestation efforts can increase infiltration and groundwater recharge, sustaining streamflow. Promoting sustainable agriculture practices, such as conservation tillage and agroforestry, can reduce soil erosion and maintain soil moisture, benefiting streamflow. Additionally, community engagement and education can raise awareness about responsible water use and land management practices, further supporting sustainable streamflow in catchments affected by land use changes.

5. Conclusions

The impacts of LULC and CC in the BRB were assessed using the SWAT+ hydrological modeling. LULC change was analyzed on GEE and predicted into the future using the LCM. Climate data for future scenarios of SSP2-4.5 and SSP5-8.5 were obtained from the CMIP6 project. The performances of the LCM in predicting future land use changes and SWAT+ in simulating future streamflow were evaluated statistically, showing a high level of agreement.
The results of this study showed that the mean annual rainfall indicated an increment in the basin of 8% and 15.4% under SSP2-4.5 and SSP5-8.5 scenarios, respectively. Similarly, both maximum and minimum temperatures showed an increase of 4.4% and 12.2% under the SSP2-4.5 scenario, and 6.3% and 22.4% under the SSP5-8.5 scenario, respectively. On the other hand, the LULC change in the basin for the period between 1990 and 2050 showed a reduction in forest coverage and wetlands by 14.5% and 61%, whereas an increase in agriculture, grassland, and shrubland by 9.2%, 2.3%, and 1.8%, respectively.
The streamflow was then simulated for the future using the relative and combined impacts of LULC and CC on streamflow. When evaluating the streamflow for the baseline climate, comparing the 1990 and 2050 land use changes, it was found that the mean annual streamflow showed a decreasing trend, by 18.8%. On the other hand, for the constant LULC of 1990, the mean annual streamflow showed an increase under the SSP2-8.5 scenario, whereas there was no clear trend found under the SSP2-4.5 scenario. This showed that effective catchment management, which includes sustainable land use practices, is needed to overcome the challenges faced in the reduction of streamflow for the future. Catchment management practices may include implementing riparian buffer zones, afforestation, sustainable agricultural practices that will reduce soil erosion, and community engagement in land management practices.
On the other hand, evaluating the combined impact, it was observed that the streamflow showed an increasing magnitude, as compared to the baseline, by 9.6% and 19.9% under SSP2-4.5 and SSP5-8.5 scenarios, respectively. This indicated that the impact of CC outweighed that of LULC in the basin. In general, the decrease in flow was attributed to LULCC in the basin, while the increase in flow was attributed to the impact of CC. Therefore, developing and implementing polices that address both CC and LULCC, including sustainable land use practices, regulations to reduce greenhouse gas emissions, and measures to enhance water security in the face of changing climate and land use patterns, is essential to manage the hydrological extremes. In summary, the results of this study not only provided valuable information for the local community to adapt to changing conditions but also contribute to the broader scientific knowledge base, guiding future research and informing sustainable policies and practices.

Author Contributions

S.M.K. conceptualized the study, performed data analysis, and wrote the manuscript; T.T. and G.T., review, editing, and supervision; A.T.H. and D.A.M., review and editing. All authors have read and agreed to the published version of the manuscript.

Funding

This study did not receive any financial support from external sources.

Institutional Review Board Statement

Not applicable.

Institutional Consent Statement

Not applicable.

Data Availability Statement

All data models and code produced or employed throughout the paper are included in the submitted article.

Acknowledgments

The Africa Center of Excellence for Water Management (ACEWM), hosted by Addis Ababa University, provided financial support for this study. The authors express their gratitude to the National Meteorological Agency (NMA) for supplying pertinent data.

Conflicts of Interest

The authors declare no conflicts of interest.

References

  1. Kayitesi, N.M.; Guzha, A.C.; Mariethoz, G. Impacts of Land Use Land Cover Change and Climate Change on River Hydro-Morphology-a Review of Research Studies in Tropical Regions. J. Hydrol. 2022, 615, 128702. [Google Scholar] [CrossRef]
  2. Kassaye, S.M.; Tadesse, T.; Tegegne, G.; Hordofa, A.T. Quantifying the Climate Change Impacts on the Magnitude and Timing of Hydrological Extremes in the Baro River Basin, Ethiopia. Environ. Syst. Res. 2024, 13, 2. [Google Scholar] [CrossRef]
  3. Hung, C.-L.J.; James, L.A.; Carbone, G.J.; Williams, J.M. Impacts of Combined Land-Use and Climate Change on Streamflow in Two Nested Catchments in the Southeastern United States. Ecol. Eng. 2020, 143, 105665. [Google Scholar] [CrossRef]
  4. Shrestha, S.; Bhatta, B.; Shrestha, M.; Shrestha, P.K. Integrated Assessment of the Climate and Landuse Change Impact on Hydrology and Water Quality in the Songkhram River Basin, Thailand. Sci. Total Environ. 2018, 643, 1610–1622. [Google Scholar] [CrossRef] [PubMed]
  5. Iqbal, M.; Wen, J.; Masood, M.; Masood, M.U.; Adnan, M. Impacts of Climate and Land-Use Changes on Hydrological Processes of the Source Region of Yellow River, China. Sustainability 2022, 14, 14908. [Google Scholar] [CrossRef]
  6. Cao, C.; Sun, R.; Wu, Z.; Chen, B.; Yang, C.; Li, Q.; Fraedrich, K. Streamflow Response to Climate and Land-Use Changes in a Tropical Island Basin. Sustainability 2023, 15, 13941. [Google Scholar] [CrossRef]
  7. Sharma, S.K.; Sinha, R.K.; Eldho, T.I.; Patel, H.M. Individual and Combined Impacts of Land Use/Cover and Climate Change on Water Balance Components of a Tropical River Basin. Environ. Model. Assess. 2023, 29, 67–90. [Google Scholar] [CrossRef]
  8. Kundu, S.; Khare, D.; Mondal, A. Individual and Combined Impacts of Future Climate and Land Use Changes on the Water Balance. Ecol. Eng. 2017, 105, 42–57. [Google Scholar] [CrossRef]
  9. Wang, S.; Zhang, Z.; McVicar, T.R.; Guo, J.; Tang, Y.; Yao, A. Isolating the Impacts of Climate Change and Land Use Change on Decadal Streamflow Variation: Assessing Three Complementary Approaches. J. Hydrol. 2013, 507, 63–74. [Google Scholar] [CrossRef]
  10. Ayalew, A.D.; Wagner, P.D.; Tigabu, T.B.; Sahlu, D.; Fohrer, N. Hydrological Responses to Land Use and Land Cover Change and Climate Dynamics in the Rift Valley Lakes Basin, Ethiopia. J. Water Clim. Change 2023, 14, 2788–2807. [Google Scholar] [CrossRef]
  11. Guo, Y.; Fang, G.; Xu, Y.-P.; Tian, X.; Xie, J. Identifying How Future Climate and Land Use/Cover Changes Impact Streamflow in Xinanjiang Basin, East China. Sci. Total Environ. 2020, 710, 136275. [Google Scholar] [CrossRef]
  12. Mohseni, U.; Agnihotri, P.G.; Pande, C.B.; Durin, B. Understanding the Climate Change and Land Use Impact on Streamflow in the Present and Future under CMIP6 Climate Scenarios for the Parvara Mula Basin, India. Water 2023, 15, 1753. [Google Scholar] [CrossRef]
  13. Kiprotich, P.; Wei, X.; Zhang, Z.; Ngigi, T.; Qiu, F.; Wang, L. Assessing the Impact of Land Use and Climate Change on Surface Runoff Response Using Gridded Observations and Swat+. Hydrology 2021, 8, 48. [Google Scholar] [CrossRef]
  14. Li, Z.; Liu, W.Z.; Zhang, X.C.; Zheng, F.L. Impacts of Land Use Change and Climate Variability on Hydrology in an Agricultural Catchment on the Loess Plateau of China. J. Hydrol. 2009, 377, 35–42. [Google Scholar] [CrossRef]
  15. Wedajo, G.K.; Muleta, M.K.; Awoke, B.G. Impacts of Combined and Separate Land Cover and Climate Changes on Hydrologic Responses of Dhidhessa River Basin, Ethiopia. Int. J. River Basin Manag. 2021, 22, 57–70. [Google Scholar] [CrossRef]
  16. Mekonnen, D.F.; Duan, Z.; Rientjes, T.; Disse, M. Analysis of Combined and Isolated Effects of Land-Use and Land-Cover Changes and Climate Change on the Upper Blue Nile River Basin’s Streamflow. Hydrol. Earth Syst. Sci. 2018, 22, 6187–6207. [Google Scholar] [CrossRef]
  17. Liu, Z.; Cuo, L.; Li, Q.; Liu, X.; Ma, X.; Liang, L.; Ding, J. Impacts of Climate Change and Land Use/Cover Change on Streamflow in Beichuan River Basin in Qinghai Province, China. Water 2020, 12, 1198. [Google Scholar] [CrossRef]
  18. Nie, N.; Zhang, W.; Liu, M.; Chen, H.; Zhao, D. Separating the Impacts of Climate Variability, Land-Use Change and Large Reservoir Operations on Streamflow in the Yangtze River Basin, China, Using a Hydrological Modeling Approach. Int. J. Digit. Earth 2021, 14, 231–249. [Google Scholar] [CrossRef]
  19. Tesfaw, B.A.; Dzwairo, B.; Sahlu, D. Assessments of the Impacts of Land Use/Land Cover Change on Water Resources: Tana Sub-Basin, Ethiopia. J. Water Clim. Change 2023, 14, 421–441. [Google Scholar] [CrossRef]
  20. Tenagashaw, D.Y.; Muluneh, M.; Metaferia, G.; Mekonnen, Y.A. Land Use and Climate Change Impacts on Streamflow Using SWAT Model, Middle Awash Sub Basin, Ethiopia. Water Conserv. Sci. Eng. 2022, 7, 183–196. [Google Scholar] [CrossRef]
  21. Assfaw, M.T.; Neka, B.G.; Ayele, E.G. Modeling the Impact of Climate Change on Streamflow Responses in the Kessem Watershed, Middle Awash Sub-Basin, Ethiopia. J. Water Clim. Change 2023, 14, 4837–4859. [Google Scholar] [CrossRef]
  22. Woube, M. Flooding and Sustainable Land-Water Management in the Lower Baro-Akobo River Basin, Ethiopia. Appl. Geogr. 1999, 19, 235–251. [Google Scholar] [CrossRef]
  23. Mengistu, A.G.; Woldesenbet, T.A.; Dile, Y.T.; Bayabil, H.K.; Tefera, G.W. Modeling Impacts of Projected Land Use and Climate Changes on the Water Balance in the Baro Basin, Ethiopia. Heliyon 2023, 9, e13965. [Google Scholar] [CrossRef] [PubMed]
  24. Kassaye, S.M.; Tadesse, T.; Tegegne, G.; Tadesse, K.E. The Sensitivity of Meteorological Dynamics to the Variability in Catchment Characteristics. Water 2022, 14, 3776. [Google Scholar] [CrossRef]
  25. Terefe, B.; Dibaba, W.T. Corrected Proof Evaluation of Historical CMIP6 Model Simulations and Future Climate Change Projections in the Baro River Basin. J. Water Clim. Change 2023, 14, 2680–2705. [Google Scholar] [CrossRef]
  26. Muleta, T.N. Climate Change Scenario Analysis for Baro-Akobo River Basin, Southwestern Ethiopia. Environ. Syst. Res. 2021, 10, 24. [Google Scholar] [CrossRef]
  27. Moges, S.A.; Taye, M.T. Regional Flood Frequency Curves for Remote Rural Areas of the Nile River Basin: The Case of Baro-Akobo Drainage Basin, Ethiopia; Elsevier Inc.: Amsterdam, The Netherlands, 2019; ISBN 9780128159989. [Google Scholar]
  28. Kassaye, S.M.; Tadesse, T.; Tegegne, G.; Hordofa, A.T. Integrated Impact of Land Use/Cover and Topography on Hydrological Extremes in the Baro River Basin. Environ. Earth Sci. 2024, 83, 49. [Google Scholar] [CrossRef]
  29. Tilahun, A.K.; Haregeweyn, N.; Pingale, S.M. Landscape Changes and Its Consequences on Soil Erosion in Baro River Basin, Ethiopia. Model. Earth Syst. Environ. 2018, 4, 793–803. [Google Scholar] [CrossRef]
  30. Yirgu, T.; Yihunie, Y.; Assele, A.; Wogayehu, T. Land Use/Land Cover Dynamics and Its Environmental Impacts in Kulfo Watershed, Gamo Highlands, South Western Ethiopia. J. Geogr. Environ. Earth Sci. Int. 2020, 24, 1–11. [Google Scholar] [CrossRef]
  31. Belay, H.T. Evaluating Soil Loss Using Geographical Information System and Remote Sensing for Soil and Water Resource Conservation: The Case of Yisir Watershed, Northwestern Ethiopia. J. Resour. Dev. Manag. 2020, 66, 13–24. [Google Scholar]
  32. Mihiretie, A.A. Suitable Solid Waste Disposal Site Selection Using Geographical Information System: A Case of Debre Markos Town, Ethiopia. J. Environ. Earth Sci. 2020, 9, 1–8. [Google Scholar]
  33. Hordofa, A.T.; Leta, O.T.; Alamirew, T.; Chukalla, A.D. Climate Change Impacts on Blue and Green Water of Meki River Sub-Basin. Water Resour. Manag. 2023, 37, 2835–2851. [Google Scholar] [CrossRef]
  34. Bieger, K.; Arnold, J.G.; Rathjens, H.; White, M.J.; Bosch, D.D.; Allen, P.M.; Volk, M.; Srinivasan, R. Introduction to SWAT+, a Completely Restructured Version of the Soil and Water Assessment Tool. J. Am. Water Resour. Assoc. (JAWRA) 2017, 53, 115–130. [Google Scholar] [CrossRef]
  35. Kakarndee, I.; Kositsakulchai, E. Comparison between SWAT and SWAT+ for Simulating Streamflow in a Paddy-Field-Dominated Basin, Northeast Thailand. E3S Web Conf. 2020, 187, 06002. [Google Scholar] [CrossRef]
  36. de Carvalho, J.W.L.T.; Iensen, I.R.R.; dos Santos, I. Resilience of hydrologic similarity areas to extreme climate change scenarios in an urban watershed. Urban Water J. 2021, 18, 817–828. [Google Scholar] [CrossRef]
  37. Leta, M.K.; Demissie, T.A.; Tränckner, J. Modeling and Prediction of Land Use Land Cover Change Dynamics Based on Land Change Modeler (Lcm) in Nashe Watershed, Upper Blue Nile Basin, Ethiopia. Sustainability 2021, 13, 3740. [Google Scholar] [CrossRef]
  38. Eastman, J.R. Land Change Modeler, Terraset 2020. Available online: https://clarklabs.org/ (accessed on 5 September 2023).
  39. Roy, H.G.; Fox, D.; Emsellem, K.; Roy, H.G.; Fox, D.; Emsellem, K.; Land, P.; Change, C.; Roy, H.G.; Fox, D.M.; et al. Predicting Land Cover Change in a Mediterranean Catchment at Different Time Scales. Trans. Comput. Sci. 2014, 8582, 315–330. [Google Scholar]
  40. Yeboah, K.A.; Akpoti, K.; Kabo-bah, A.T.; Ofosu, E.A.; Siabi, E.K.; Mortey, E.M.; Okyereh, S.A. Assessing Climate Change Projections in the Volta Basin Using the CORDEX-Africa Climate Simulations and Statistical Bias-Correction. Environ. Chall. 2022, 6, 100439. [Google Scholar] [CrossRef]
  41. Rathjens, H.; Bieger, K.; Srinivasan, R.; Arnold, J.G. CMhyd User Manual Documentation for Preparing Simulated Climate Change Data for Hydrologic Impact Studies; SWAT: Grapevine, TX, USA, 2016; 16p. [Google Scholar]
  42. Usta, D.B.; Teymouri, M.; Chatterjee, U. Assessment of Temperature Changes over Iran during the Twenty-First Century Using CMIP6 Models under SSP1-26, SSP2-4.5, and SSP5-8.5 Scenarios. Arab. J. Geosci. 2022, 15, 416. [Google Scholar] [CrossRef]
  43. Eyring, V.; Bony, S.; Meehl, G.A.; Senior, C.A.; Stevens, B.; Stouffer, R.J.; Taylor, K.E. Overview of the Coupled Model Intercomparison Project Phase 6 (CMIP6) Experimental Design and Organization. Geosci. Model Dev. 2016, 9, 1937–1958. [Google Scholar] [CrossRef]
  44. Motlagh, S.K.; Sadoddin, A.; Haghnegahdar, A.; Razavi, S.; Salmanmahiny, A.; Ghorbani, K. Analysis and Prediction of Land Cover Changes Using the Land Change Modeler (LCM) in a Semiarid River Basin, Iran. Land Degrad. Dev. 2021, 32, 3092–3105. [Google Scholar] [CrossRef]
  45. Alipbeki, O.; Alipbekova, C.; Mussaif, G.; Grossul, P.; Zhenshan, D.; Muzyka, O.; Turekeldiyeva, R.; Yelubayev, D.; Rakhimov, D.; Kupidura, P.; et al. Analysis and Prediction of Land Use/Land Cover Changes in Korgalzhyn District, Kazakhstan. Agronomy 2024, 14, 268. [Google Scholar] [CrossRef]
  46. Ren, Z.; Zhao, H.; Shi, K.; Yang, G. Spatial and Temporal Variations of the Precipitation Structure in Jiangsu Province from 1960 to 2020 and Its Potential Climate-Driving Factors. Water 2023, 15, 4032. [Google Scholar] [CrossRef]
  47. Wenyu, W.; Xiaoqun, M.; Xiaoyi, C.; Bin-fang, H. Establishment of Spatial Distribution Models and Spatial Interpolation for Thermal Resources in Anhui Province. J. Northwest A&F Univ. 2009, 37, 175–181. [Google Scholar]
  48. Kebede, A. An Assessment of Temperature and Precipitation Change Projections Using a Regional and a Global Climate Model for the Baro-Akobo Basin, Nile Basin, Ethiopia. J. Earth Sci. Clim. Change 2013, 04, 133. [Google Scholar] [CrossRef]
  49. Chakilu, G.G.; Sándor, S.; Zoltán, T.; Phinzi, K. Climate Change and the Response of Streamflow of Watersheds under the High Emission Scenario in Lake Tana Sub-Basin, Upper Blue Nile Basin, Ethiopia. J. Hydrol. Reg. Stud. 2022, 42, 101175. [Google Scholar] [CrossRef]
  50. Chimdessa, K.; Quraishi, S.; Kebede, A.; Alamirew, T. Effect of Land Use Land Cover and Climate Change on River Flow and Soil Loss in Didessa River Basin, South West Blue Nile, Ethiopia. Hydrology 2019, 6, 2. [Google Scholar] [CrossRef]
  51. Getu Engida, T.; Nigussie, T.A.; Aneseyee, A.B.; Barnabas, J. Land Use/Land Cover Change Impact on Hydrological Process in the Upper Baro Basin, Ethiopia. Appl. Environ. Soil Sci. 2021, 2021, 6617541. [Google Scholar] [CrossRef]
  52. Kasaye, A. Land Use Land Cover Change and Its Implication on Surface Runoff: A Case Study of Baro River Basin in South Western Ethiopia Land Use Land Cover Change and Its Implication on Surface Runoff: A Case Study of Baro River Basin in South Western Ethiopia. J. Environ. Earth Sci. 2015, 5, 7. [Google Scholar]
  53. Alemayehu, T.; Kebede, S.; Liu, L.; Nedaw, D. Groundwater Recharge under Changing Landuses and Climate Variability: The Case of Baro-Akobo River Basin, Ethiopia. J. Environ. Earth Sci. 2016, 6, 78–95. [Google Scholar]
  54. Panikkar, U.R.; Srivastav, R.; Srivastava, A. Multiscale Variability of Hydrological Responses in Urbanizing Watershed. Remote Sens. 2023, 15, 796. [Google Scholar] [CrossRef]
  55. Rani, S. Land Use/Land Cover: Status and Changes BT-Climate, Land-Use Change and Hydrology of the Beas River Basin, Western Himalayas; Rani, S., Ed.; Springer International Publishing: Cham, Switerland, 2023; pp. 137–151. ISBN 978-3-031-29525-6. [Google Scholar]
Figure 1. Map indicating the geographical scope of the study area.
Earth 05 00008 g001
Figure 2. LULC classes for the BRB using GEE.
Earth 05 00008 g002
Figure 3. LULCC for 1990, 2000, 2020, and 2050 in the BRB.
Earth 05 00008 g003
Figure 4. Projected land use maps for (a) 1990, (c) 2000, (e) 2020, and (g) 2050, and proportions of each land use/cover types under (b) 1990, (d) 2000, (f) 2020, and (h) 2050.
Earth 05 00008 g004aEarth 05 00008 g004b
Figure 5. Distribution of the annual average rainfall in the basin.
Earth 05 00008 g005
Figure 6. Spatial distribution of (a) maximum temperature and (b) minimum temperature of the BRB.
Earth 05 00008 g006aEarth 05 00008 g006b
Figure 7. Comparison of observed and simulated daily streamflow for (a) the calibration period (2001–2009) and (b) the validation period (2010–2014).
Earth 05 00008 g007
Figure 8. Graph showing the variability of mean annual flow under constant land use/cover but varying climate scenarios.
Earth 05 00008 g008
Figure 9. Boxplot showing the range of annual mean flow under different climate scenarios using (a) the LULC of 1990 and (b) the LULC of 2050.
Earth 05 00008 g009
Figure 10. Graph showing the variability of mean annual flow under constant climate but different land use/cover scenarios.
Earth 05 00008 g010
Figure 11. Boxplot showing the range of annual mean flow using baseline climate under different land use/cover change scenarios.
Earth 05 00008 g011
Figure 12. Seasonal mean flow percentage change between SSP2-4.5 and SSP5-8.5 with baseline.
Earth 05 00008 g012
Table 1. SWAT+ calibration parameters employed in the BRB.
ParameterDescriptionRangeBest Value
CN2SCS runoff curve number II28–9869.17
ESCOSoil evaporation compensation factor0.01–10.585
EPCOPlant uptake compensation factor0–10.755
PERCOAmount of water percolating out of root zone (mm H2O)0–10.884
ALPHABaseflow alpha factor (days)0–10.644
CHKEffective hydraulic conductivity in channel (mm/h)0.01–500272.9
AWCAvailable water content of the soil layer (mm H2O/mm)0.01–10.228
KSaturated hydraulic conductivity (mm/h)0.0001–20001689.453
Table 2. LULC change for the reference and predicted periods, where the area is in square kilometer.
LULC1990200020202050
Forest6974671661525973
Urban54149196196
Agriculture997110,41710,76410,881
Grassland448985606458
Shrubland4442377243324523
Wetland247707596
Tea_Farm0311411
Table 3. LULC and CC impact analysis on streamflow variability of the BRB.
Impact Analysis for Streamflow VariabilityInput Simulations
Land use effect analysisPredicted LULC of 2020 and 2050 with baseline climate data of 1985–2014
Climate change effect analysisProjected climate for 2041–2070 with baseline LULC data of 1990 under SSP2-4.5 and SSP5-8.5 scenarios
Relative and combined effect of land use and climate change on streamflowProjected climate for 2041–2070 with LULC of 2050 under both scenarios, SSP2-4.5 and SSP5-8.5
Table 4. Summary of SWAT+ scenario analysis under SSP2-4.5 and SSP5-8.5.
Modeled ScenariosLULC-1990LULC-2020sLULC-2050
Baseline climateClimate 1985–2014 and LULC-1990Climate 1985–2014 and LULC-2020Climate 1985–2014 and LULC-2050
2050s ClimateClimate (2041–2070) and LULC-1990Climate 2041–2070 and LULC-2020Climate 2041–2070 and LULC-2050
Table 5. SWAT+ model performance indicators based on daily streamflow values.
Period/Evaluation CriteriaNSEPBIASRMSER2
Calibration (2001–2009)0.680.030.60.7
Validation (2010–2014)0.730.010.170.74
Table 6. Annual mean flow under different climate and LULC scenarios.
ScenarioLU1990LU2020LU2050Description
Baseline climate (1985–2014)334.8275.8271.7LULC effect analysis
SSP2-4.5 climate (2041–2070)300.4312.3318.9Combined effect
SSP5-8.5 climate (2041–2070)350.2341.5325.6
DescriptionClimate change effect analysisCombined effect
Disclaimer/Publisher’s Note: The statements, opinions and data contained in all publications are solely those of the individual author(s) and contributor(s) and not of MDPI and/or the editor(s). MDPI and/or the editor(s) disclaim responsibility for any injury to people or property resulting from any ideas, methods, instructions or products referred to in the content.

