Abstract
The explosion of e-commerce creates new opportunities for courier companies to thrive, making the industry one of the success stories, due to its sustainability and resilience during the pandemic. As customers become more familiar with COVID-19, they adopt new online purchasing behaviors toward branding preferences. The purpose of this paper is to analyze the impact of risk familiarization on courier companies’ digital branding. This paper investigates the application of the psychometric paradigm by Fischhoff ho suggested risk novelty as a key factor for the level of risk perception. Five big companies with global trading activities were selected and analyzed on a three-period time: the year before, the first year, and the second year of the COVID-19 pandemic, by using passive crowdsourcing data. The results indicate that after the first year of the pandemic, online customers’ risk perception of COVID-19 hazards decreased, and consumers returned to their pre-COVID-19 behavior regarding brand preference. However, the dramatic escalation of new infections caused by new COVID-19 mutations reversed their online purchasing attitude from non-branded to branded preferences. The outcomes of the research can be used by scientists and supply chain risk managers to redefine risk mitigation strategies, COVID-related information marketing strategies and innovation investments within the industry. The research further introduces dynamic simulation modeling to be used as a risk management tool in favor of courier companies’ proper resource allocation and digital optimization.
Keywords:
digital branding; risk perception; courier; big data; simulation; risk management; supply chains 1. Introduction
The COVID-19 pandemic has forced customers to move to online shopping at a faster pace, changing their purchasing behavior from conventional to digital [1]. As it appears so far, this rapid explosion of e-commerce has no limits, posing challenges to the courier industry, but also driving innovation [2,3]. As the last-mile ecosystem challenges soared dramatically during the pandemic, so did customers’ expectations for rapid fulfillment regarding courier services, such as the speed of the services provided, contactless transactions and digital signatures, to name a few [4]. This shift in customers’ online shopping patterns created new priorities when choosing courier companies, not only in terms of safety, but for convenience as well [5]. Either way, it becomes of the essence that these priorities persist long after the pandemic disappears, motivating the need for alternatives in the last-mile landscape.
As customers adjust their consumption behavior toward e-shopping, they also deal with remote-shopping-related risks [6]. The perceived risk of choosing products or services online is affected by different factors. According to a study on risk perception in online auctions, consumers rely on personalized information and word-of-mouth communication to make purchases, with the brand having a major impact on consumers’ perceived risk [7]. Electronic word-of-mouth (eWoM), in the form of customers’ reviews on social media or dedicated platforms, has also been suggested to significantly affect consumers’ brand loyalty and perceived risk [8]. Although the customers’ risk perception and eWoM link is well established [9], studies underline the very important role of the review-source trustworthiness on the caused effect [10]. A related study [11], reported a negative link between consumers’ trust and perceived risk, implying that customers’ trust is positively associated with an Internet vendor’s reputation level. However, other studies imply no significant connection between brand name and online consumers’ perceived risk [12]. Site quality and the user’s entire web experience are two of the most important aspects that determine trust levels. As noted by Tzavlopoulos et al. [13], the overall quality of the e-commerce dimensions, such as the ease of use of websites, the design, responsiveness and security, leads to higher levels of customer satisfaction, mitigating their perceived risk. Collaborating with trusted business partners and positive word-of-mouth are also considered successful risk-reducing strategies, highlighting the direct relationship between brand name and low-risk perception [14].
One major challenge for the future of courier services and the entire last-mile ecosystem is to build resilience in their supply chains and operations, by paying attention to specific key factors: fulfilment timeline, types of goods and achieving routing efficiency [15]. For instance, the product type, such as grocery and home food, is more likely to experience a decrease in demand and be replaced by physical presence [16]. Therefore, in order to ensure resilience, courier companies need to rapidly scale up their capacity and consistently ensure high-quality services, while monitoring risk and implementing mitigation strategies simultaneously. Since technology and digital formats influence consumer behavior, businesses are suggested to further include digital transformations in their processes [17].
Although e-shopping has been reported to be in a rising trajectory even before the COVID-19 crisis [18], the shift in consumer behavior toward online shopping has been highlighted by many studies [17,18,19,20,21,22,23,24]. As an expected consequence, buyers have increased their interaction with e-payment platforms as well, replacing the flow of physical currency with digital money transactions [18]. New regulations and procedures set during the pandemic are expected to further modify consumer behavior even when the COVID-19 wave retreats [22]. Studies suggest that these alternations in shopping patterns are highly affected by consumers’ income, age, and sector of occupation [25]. In a different approach, researchers introduce the theory that customers’ buying intentions could be predicted by anxiety and COVID-related fear (necessities), as well as depression levels (non-necessities) [26]. Consumers’ turn to well-established brands during the pandemic has been spotted [19]; however, companies’ inability to satisfy customers during the pandemic has been suggested to lead to low customer loyalty [24]. Exposure of customers to an unusual load of online information has been reported to cause information overload and cyberchondria, triggering a state where buyers demonstrate an increased intention to make unusual purchases and voluntarily self-isolate [27].
Even though multiple studies on consumers’ behavioral change during the COVID era exists, little attention has been addressed to the level at which familiarity contributes to the adoption of new purchasing pattern behaviors. It has been two years since COVID-19’s invasion and people appear to accept pandemic life as the new reality [28]. This acceptance signals that familiarity with COVID-19 has become a state of mind. Familiarity leads to higher levels of trust, which in turns impacts social behavior [29,30]. Although risk familiarity has been researched by academia in terms of its relationship with mental health [31] and outgoing behaviors [32], little attention has been paid to its impact on customers’ online behavior and branding preferences on courier companies. To this end, the current paper focuses on analyzing the role of risk familiarity on courier companies’ digital branding. The novelty of the current research lies on the employment of a precise methodology, containing pioneering content, aiming to provide useful insights concerning risk familiarization and digital branding, based on passive crowdsourcing. In addition, a comprehensive dynamic simulation model has been developed to be used as a valuable tool for risk prediction.
The paper proceeds as follows: First, the theoretical background is presented. In this section, related literature is introduced leading to the articles’ research question formulation and to the suggested conceptual framework of this study. The article then analyzes the materials and methods used and presents the results of the estimation techniques utilized. Moreover, discussion of the results follows, as well as the conclusion of the study including the various implications of the findings. Finally, the research limitations as well as future research proposals are presented.
2. Theoretical Background
2.1. Risk Management and Supply Chains
The linking platform via which items, finances and information flow from suppliers through distributors to end customers is known as the supply chain. In a highly unstable and dynamic environment, low-risk supply chains are the only method to maintain uninterrupted and lucrative commercial activities, since a single supply chain link failure could result in economic disaster for the businesses involved. Several studies have suggested definitions of supply chain risk management (SCRM) [33,34,35,36]. The definition introduced by Ho et al. [37] describes SCRM as ‘an inter-organizational collaborative endeavor utilizing quantitative and qualitative risk management methodologies to identify, evaluate, mitigate, and monitor unexpected macro- and micro-level events or conditions, which might adversely impact any part of a supply chain’. Categorization of SCRM risks is rather specialized despite the undisputed connection between SCRM and the general risk management theory. Researchers have used different approaches to classify SCRM risks. In a more detailed approach, SCRM risks could be categorized into the following 11 groups of risks:
(1) Strategic, (2) operations, (3) supply, (4) customer, (5) asset impairment, (6) competitive, (7) reputation, (8) financial, (9) fiscal, (10) regulatory, and (11) legal risks.
In another relevant study [38], supply chain risks were separated into “flow”-related groups, defined as “material flow risks”, “financial flow risks”, and “information flow risks”. Finally, by adopting a different approach, other researchers [35] separated organizational risks from network-related and environmental risks.
2.2. Risk Perception
2.2.1. Risk Perception Dominant Theories
The risk level is a rather subjective term since it expresses the perceived possibility of losing or winning a specific value due to hazards or opportunities in the company’s environment. Risk perception is a crucial factor for successful risk management since effective risk perception and communication are the main prerequisites for decreasing risk across all levels within an organization [39]. The factors affecting the way different people perceive specific hazards as carrying a higher or lower level of risk have been attempted to be described by different researchers. Although most scholars explain risk perception as the result of an individual’s cognitive process, one may argue that various factors other than the individual influence the ultimate decision. These elements include the individual’s social and cultural network, which is formed by his or her history, symbols, values and ideology [40].
The complicated nature of risk perception is expressed by the two dominant explanatory theories. A novel method of risk perception research was suggested by cultural theory [41] which proposes that risk perceptions are culturally biased. Individuals are expected to view society’s dangers in such a way that their ideas and commitments to social function and order are reinforced [42]. The psychometric paradigm [43] has had the most influence in the scientific field of risk analysis [44]. This theory proposes an explanatory model of how laypeople perceive diverse risks based on a “mental map” of hazards. This theory, on the other hand, puts people into only two categories: “experts” and “laypeople,” with no other distinctions established between either groups or individuals [45]. In terms of predicting and explaining perceived risk, the psychometric paradigm is considered fairly successful. Dread and familiarity were established as two characterizing elements for risks by Fischhoff, Slovic, and Lichtenstein [1]. Over 70% of the variance in risk perception was due to familiarity and dread. The findings of several studies confirm this suggestion [46,47,48].
2.2.2. Risk Familiarity Effects on Perception of General Risks
Several researchers have investigated familiarity when it comes to risk perception in general. The proposition that familiarization with a hazard will result in a lower risk perception has been introduced by many studies and in different concepts. Many discussions have been made regarding “risk diffusion” within a group, where discussion of risk among team members is expected to result in lower risk perception. The concept of the risk familiarity effect on risk perception has long been a research question. A study by Wallach, Kogan, and Bem [49] reported that when a group discusses and agrees on decisions that involve genuine risks and payoffs, more risk is taken than when there is no such debate and agreement. Diffusion or spreading of responsibility is the suggested mechanism that underpins this group-induced change toward greater risk-taking. These findings were later supported by other researchers [50]; however, challenges to this theory have also been reported [51]. Weber, Siebenmorgen, and Weber [52] reported a positive connection between risk familiarization and increased risk perception, although, this study was related to understanding short-term risk rather than to long-term familiarization with a risk. Many researchers have also studied risk familiarity in the concept of educating people about a risk concluding that knowledge is crucial in the formation of attitudes and perceptions [53,54]; however, the familiarization effect of individuals with a risk after a long-exposure period, such as the COVID-19 pandemic, on risk perception has not been adequately studied.
2.3. Consumer Behavior and Dominant Consumer Behavior Models
A definition suggested by Schiffman, Kanuk, Kumar, and Wisenblit, describes consumer behavior “as the behavior that consumers display in searching for, purchasing, using, evaluating and disposing of products, services, and ideas which they expect will satisfy their needs” [55]. In general terms, the decisions individuals make on how they will spend their limited resources of time and money can be called consumer behavior and involves questions regarding what they buy and why they buy it, when and how often they buy it, where they buy it, as well as how often they use it [56]. Modern consumer behavior theories include the ‘Engel–Kollat–Blackwell’ model, which concerns consumer behavior as a conscious problem-solving and learning model [57], as well as the ‘Howard–Sheth’ model, which explains consumer product choice using the stimulus-response paradigm [58]. The ‘stimulus-response’ model also belongs to the modern consumer behavior approaches, primarily reliant on marketing stimuli that, once placed into the buyer’s “black box,” produce replies [59]. The ‘Nicosia’ model, which focuses on communication between the consumer and the company, also supports this “marketing-dependent” viewpoint [60].
More traditional theories of consumer behavior have rather mainstream approaches such as the ‘learning’ model that describes consumer behavior as a need-driven element, oriented by the necessity to satisfy basic needs such as shelter and learned needs such as fear [56], and the ‘economic’ model [61] stating that consumer behavior is dictated by the need to acquire the maximum benefits from the minimum cost. The sociological theory gives great importance to the impact of the consumer on society [62] as well as the psychoanalytic approach taking into account the fact that both the conscious and unconscious mind has an impact on consumer behavior [63] could also be classified as “traditional” theories.
2.4. Web Analytics
2.4.1. Web Analytics and Passive Crowdsourcing
The collection and utilization of data produced by online users during their everyday internet and social media activity are described as passive crowdsourcing [64]. The fact that these datasets are produced unintentionally and without any additional effort by the online users, makes this crowdsourcing strategy valuable for government or political purposes since these organizations are highly interested in gathering data from online resources, in order to gain a better grasp of public opinion [65]. This concept of users passively uploading data that scientists can gather and analyze in a way that is different than users’ initial intentions, created a set of novel terms such as “citizen sourcing”, “Citizen Science” and “Neogeography“ [66]. This research technology is highly applicable to environmental research since it can generate a continuous and direct flow of data related to human activities, comparable to data collected by surveillance and tracking devices and autonomous sensors [67]. Nevertheless, this data-productive research approach faces some serious limitations regarding data quality and data relevance as well as challenges related to time and cost [68].
Web analytics is a type of passive crowdsourcing that makes use of Big Data generated by internet users during their normal online activities [69] and is described as the monitoring and recording of websites’ user activity as well as websites’ technical performance for enterprises to have a clear perspective of the intricate interactions that occur between internet users and websites [70]. These raw and rather unmanageable data are converted to usable, simple to calculate, compare and track overtime variables named key performance indicators (KPIs). These indicators can greatly assist an organization in identifying and optimizing its website’s strengths and weaknesses [71]. Researchers have proposed Web data mining as a possibly helpful way for identifying Web customer behavior [72] as well as a beneficial approach for optimizing the complicated seller–buyer interaction process through digital marketing [73]. The dynamic perspective of Web analytics has stimulated e-commerce organizations to allocate substantial resources to improving conventional data-limited Web usage methods by creating efficient assessing tools through KPIs [74]. Necessary user privacy has triggered serious criticism regarding the ethics of web analytics data. This reaction resulted in the development of anti-tracking tools and legislation with a consequence decline in web analytics data quality. Researchers, on the other hand, have proposed circumventing this limitation by employing technologies that deliver Web analytics without tracking [75].
2.4.2. Utilization of Web Analytics in SCRM
Web analytics have sparked increased scientific interest in their possible applications in SCRM [76], yet a study of existing SCRM literature reveals that data-driven approaches receive only sporadic attention. The dominating viewpoint of supply chain digitalization emerges the challenge of developing smart data-driven SCRM [77]. The importance of relevant data is undeniable, nevertheless, organizations and stakeholders project justifiable concerns related to confidentiality and privacy. This limitation triggered several improvements in data management and analysis that ensure advanced data security during the whole storage-processing-sharing cycle [78].
The utilization of web analytics for SCRM is supported by several studies in several applications. Studies focus on the potential benefits of collecting, analyzing, and monitoring both internal and external data for the company [79]. Researchers also recommend that special attention should be paid to the interaction among big data information systems and users. Taking the same approach, Miao He et al. proposed in their study the utilization of both internal and external data to detect and predict supply problems [80]. Supply chain risk assessment and forecasting, in the form of transportation risk, was also studied by Shang, Dunson, and Song who used Big Data mined from 6 months of activities of 20 cargo airlines [81]. Data collection from multiple sources is highly valued by many researchers. In a relevant study, researchers suggested a thorough approach to obtaining usable information from unstructured data through the systematic gathering, processing, and monitoring of supply chain risk data from diverse information sources [82]. However, because it was tested on a single example company, their method is difficult to generalize. Approaching the same problem from a different angle, the problem of managing the vast data number to a controllable variable through mathematically based automated inspection methods was introduced by another research team [80].
2.4.3. Web Analytics in SCRM during the COVID-19 Crisis
Several studies have been conducted in respect of the impact of COVID-19 on the supply chain [83,84,85,86,87], highlighting the severe consequences of the pandemic to numerous trade sectors and suggesting ways to cope with the “new normal with COVID”. More and more research tend to use Big Data to explain the impact of the pandemic on the supply chain [88,89,90,91]. In this context, crowdsourcing services prove to be useful, due to the large amount of available, organized and unstructured data from multiple sources [20] which is of paramount importance for a supply chain so as to improve perceptibility, predict future behavioral attitudes, and moderate potential negative influence of the pandemic.
The pandemic forced global logistics to rapidly shift and adapt to the new crisis environment, indicating the urgent need for companies to respond to ensure sustainability [92,93]. An interesting study was conducted on the logistics, specifically cross-border trade in parcels, explaining thoroughly the critical role of helping people and firms during the pandemic [94]. Challenges, policies, and regulations have been extensively researched, indicating the great contribution of this trade to firms, especially smaller ones, to maintain economic activities.
Although Big Data and logistics have aroused the interest of the scientific community from different perspectives [95,96,97], there is little research on how risk familiarity impacts the purchasing behavior of online users. Research by Iglesias-Sanchez et al. [98] regarding branding strategies, compared two periods during and after the lockdown, to elucidate the need for social advertising campaigns. To this end, the originality of the current study lies in examining three different periods so as to acknowledge the role of familiarization with COVID-19 on online purchasing behaviors. It is a novel topic that will lead the way for more research regarding risk familiarity. Further, the study highlighted the effectiveness of Big Data and dynamic simulation modelling as a risk management tool for supply chain companies, regarding resource allocation and risk mitigation strategies during a novel crisis.
2.5. Problem Formulation and Research Hypotheses
The continuing COVID-19 epidemic has had a wide-ranging impact on global supply networks. Many of these changes are yet unclear since customer behavior is continually altering in response to the dynamic nature of the crisis. Customers’ elevated risk perception about the pandemic has driven them to e-commerce solutions, resulting in greater traffic and enhanced global ranking for e-commerce websites. This effect was more noticeable for courier companies since the global self-isolation restrictions increased the demand for courier services.
Almost two years after the start of the pandemic, daily cases increased dramatically; however, vaccination and less severe viral mutations keep death rates at a rather low level. Civilians’ two-year familiarization with the COVID-19 hazard has led them to embed mask usage and self-distancing in their daily routine and has resulted in lower risk perception of the COVID-19 virus. Following our previous research findings [20] where courier companies’ customers demonstrated a clear tendency for preferring branded options as the crisis escalated, we formulated three core questions. Firstly, is there any difference in courier companies’ website traffic between the first and last 12-month period of the pandemic? Do people after a 2-year familiarization with the hazard still prefer well-known brands rather than less established choices? What does the effect of COVID-19 risk familiarization have on courier companies’ digital branding?
Answering these questions can highlight the effectiveness of using passive crowdsourcing data as a risk management tool for supply chain companies since they can provide answers to risk managers regarding resource allocation and risk mitigation strategy development during a crisis after people have familiarized themselves with the initial hazard. To provide answers to the questions above we developed fivefour research hypotheses:
Hypothesis 1 (H1).
During the 2nd 12-month period of the COVID-19 pandemic, courier companies’ customers’ online behavior will not be significantly affected by COVID-19 daily new infection numbers.
As people become more familiarized with the risk of COVID-19 infection, it is expected that the perceived risk level will decrease, and the effect of crisis level fluctuation will be less decisive on their consuming behavior. This hypothesis will help companies clarify the effect of crisis duration and risk familiarization on consumer decisions.
Hypothesis 2 (H2).
During the 2nd 12-month period of the COVID-19 pandemic, branded traffic will significantly decrease, and non-branded traffic will significantly increase compared to the 1st 12-month period of the COVID-19 pandemic.
As consumers perceive a lower risk level for the COVID-19 crisis, it is expected that the effect of the crisis on their consuming behavior will be retracted, and they will demonstrate a tendency to restore their old consuming habits. Answering this question will assist companies in predicting consumer behaviors within a time of enduring dynamic crisis with COVID-19 pandemic characteristics.
Hypothesis 3 (H3).
During the 2nd 12-month period of the COVID-19 pandemic, the global ranking will be significantly affected by the increase in organic keywords.
The 2nd 12-month period of the COVID-19 pandemic is expected to be dominated by pre-COVID consuming tendencies. Following this notion, we expect consumers to perform more “organic” research for their preferred services and less to follow pathways through branded advertisements. The outcomes of this research question will support courier companies in efficiently allocating their resources during a long-term crisis.
Hypothesis 4 (H4).
During the last 6 months of the 2nd 12-month period of the COVID-19 pandemic, courier companies’ customers’ online behavior will be significantly affected by the COVID-19 daily new infection numbers.
Although familiarization with the COVID-19 risk is expected to lower the perceived risk, the very rapid and high increase in new infection cases, as well as the domination of more infectious viral mutations may exceed a cognitive threshold and trigger a new “crisis behavioral” pattern that will be significantly affected by the crisis escalation numbers. This hypothesis will significantly assist companies to adapt to crisis-level oscillations that may occur during long-term crises.
The proposed conceptual framework of the cognitive mechanism related to the courier services e-customers’ behavior during the COVID-19 crisis is described in Figure 1.
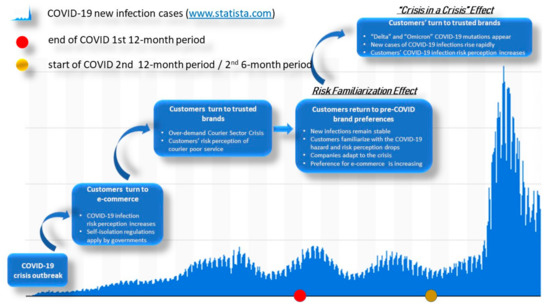
Figure 1.
Proposed conceptual framework.
3. Materials and Methods
3.1. Research Design
To investigate our research questions, we utilized passively crowdsourced Big Data, mined through dedicated web-analytics platforms and data bases. This process provided our research with a large amount of worldwide internet users’ unstructured data, increasing our results’ credibility and applicability.
In order for our data to be statistically manageable, they were processed into seven dependent (KPI-related) and one independent (COVID-19 related) variable that underwent a three-level quantitative experimental approach. In the initial level of our hypotheses investigation, we used independent sample t-tests to identify significant differences between the samples from the different periods. Results would provide us with information to investigate H2. Furthermore, Pearson’s correlation coefficient statistical analysis was applied among all variables of each period to study H1, H3 and H4 through highlighting possible cause–effect connections between the sets of variables.
Following the descriptive statistical analysis, Pearson’s correlation coefficient statistical analysis results were used to create a fuzzy cognitive map (FCM), simulating the cognitive mechanism of the investigated process. FCM simulating scenarios deployment was used to assist our deeper hypotheses investigation through different result comparisons.
Dynamic simulation modeling of the whole process was the last estimation technique used in this study. This method allowed further analysis of the investigated hypotheses through examination of the possible solution impacts or market environmental changes on the studied system, introducing this approach as a dynamic risk management and decision-making tool.
3.2. Data Collection Method
For our study, we defined three time periods of one year each (Figure 2). We specified the 1st of April 2020 as the starting date of our study period because most effects of the pandemic had already settled in since most countries had applied border control laws and self-isolating policies for almost one month. The first period (1st of April 2019 to 31st of March 2020) represented the year before the COVID-19 pandemic (pre-COVID period). The second period (1st of April 2020 to 31st of March 2021) signified the first year of the COVID-19 pandemic (COVID 1st 12-month period). The third period (1st of April 2021 to 31st of March 2022) denoted the 2nd year of the COVID-19 pandemic (COVID 2nd 12-month period). For the investigation of H4 we also highlighted the last 6-month period of our timeline where the COVID-19 daily infection cases spiked.
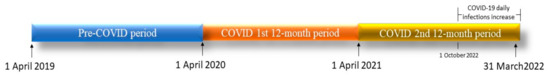
Figure 2.
Explanatory timeline of the periods used for the study.
For the three periods, we acquired passive crowdsourcing data from five sample courier company root domains through a web analytics platform [99]. The mined data formed seven dependent variables that expressed monthly values of selected KPIs (Table 1).

Table 1.
Description of the KPIs that formed the dependent variables of the study.
To achieve more efficient data processing and statistical analysis, we collected every KPI value from the sample companies and formed a representative KPI-related variable based on the average value. An arithmetic mean value was chosen in order to simulate the behavior of an average company representing the highest percentage of market capitalization in the courier companies’ sector. Additionally, this process (Figure 3), applied to all seven KPIs, allowed us to compare our results with studies that have used similar methodologies [20,69,76].
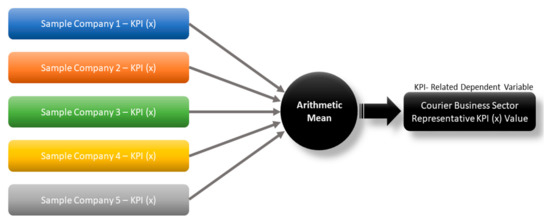
Figure 3.
Initial-data process methodology.
For the second and third studied periods, we acquired data regarding the global daily confirmed cases of COVID-19 as recorded by the STATISTA database (“COVID-19 New Cases Worldwide by Day” 2022). For better accuracy and compatibility with the dependent variables of the study, these data were processed into an average daily value for every month, forming the independent variable of the study (COVID cases).
3.3. Sample Strategy and Sample Size
Our sample was created by taking into consideration the courier companies’ market capitalization value as of the 1 January 2020 [104]. We selected from the top ten companies, five to form a representative sample of the respective business sector based on their global trading activities and the existence of a fully functional website. The companies that consisted our representative sample were UPS [105], Royal Mail [106], FedEx [107], DHL [108], and S.F. Express [109].
As described, the sample collection method was based on passively crowdsourced Big Data mining and not in more traditional methods such as, for example, questionnaires. This element made the sample demography parameter not applicable for this study; however, the fact that the selected organizations were based in three different continents (America, Europe and Asia) increased the global representation of the investigated sample.
4. Results
4.1. Statistical Analysis
4.1.1. Independent Samples t-Tests
All variables were categorized into two sets, the ‘COVID 1st 12-month period’ set (regarding the first year of the crisis) and the ‘COVID 2nd 12-month period’ set (regarding the second year of the crisis). A third set was formulated from the variables related to the period before the crisis, labeled as ‘pre-COVID’.
Independent samples t-tests were applied between all three data sets to clarify the statistically significant differences (Table 2, Table 3 and Table 4).
Table 2.
Independent sample t-tests results between the pre-COVID and COVID 1st 12-month period data sets.
Table 3.
Independent sample t-tests results between the pre-COVID and COVID 2nd 12-month period data sets.
Table 4.
Independent sample t-tests results between the COVID 1st 12-month period and COVID 2nd 12-month period data sets.
Global ranking, organic traffic, organic keywords as well as branded and non-branded traffic variables resulted in statistically significant differences before and after the COVID-19 pandemic outbreak.
All seven dependent variables demonstrated statistically significant differences between the two periods.
Five of the seven dependent variables demonstrated statistically significant differences between the two periods. Branded traffic had no significant difference from the COVID-1st to COVID-2nd period as well as paid keyword. COVID cases demonstrated a statistically significant increase.
To investigate H4, independent samples t-tests were applied within the COVID 2nd 12-month period data set, between the first and last six months in order to reveal statistically significant differences within the data set (Table 5).
Table 5.
Independent sample t-tests results within the COVID 2nd 12-month period data set.
COVID-19 cases, global ranking as well as brand traffic and non-branded traffic revealed statistically significant differences within the COVID-2nd data set.
Independent sample t-test outcomes suggested that e-customers familiarization with the COVID-19-related risks resulted in significant changes to their purchasing behavior regarding brand preferences, driving them to behave in a “non-COVID” pattern. However, when new infection cases demonstrated an intense increase, e-customers responded to the crisis escalation by shifting their preferences to more trusted brands, although they were familiarized with the crisis-related risks. This effect could be described as a “crisis within a crisis effect”.
4.1.2. Pearson Correlation Coefficient Statistical Analysis
To clarify any possible linear connections between pairs of variables during the COVID 2nd 12-month period, we used a Pearson’s correlation coefficient (PCC–r) statistical analysis on our data sets. Several statistically significant connections were discovered, with some of them indicating a very strong linear link. (Table 4). PCC analysis revealed 17 statistically significant correlations between the variables, nine of which were significant at the 0.01 level and eight at the 0.05 level (two-tailed) (Table 6, Table 7 and Table 8).
Table 6.
Statistically significant correlation matrix after PCC–r analysis (COVID 2nd 12-month period).
Table 7.
Statistically significant correlation matrix after PCC-r analysis (COVID 2nd 12-month period/1st semi-period).
Table 8.
Statistically significant correlation matrix after PCC–r analysis (COVID 2nd 12-month period/2nd semi-period).
Pearson correlation coefficient statistical analysis results suggested that during the two 6-month semi-periods of the COVID-19 crisis’ 2nd year (risk familiarization year), e-customer behaviors were driven by different stimuli. Outcomes provided a strong indication that during the second six-month period, e-customers’ turn to branded options was significantly and positively correlated with new COVID infection cases indicating that the risk familiarization effects could be suppressed in the case of a new escalation of the familiarized risk and e-customers will tune their behavior to risk level fluctuations (“crisis within a crisis effect”).
4.2. Fuzzy Cognitive Mapping Analysis
For the second level of analysis, we developed a fuzzy cognitive map (FCM) of the dynamic relationships between the elements of the system created by the COVID-19- and KPI-related variables investigated in our study (Figure 4). By building enough rules with proper input and output membership functions, it is possible to identify the structure of fuzzy systems. The discovered model can then be used to describe as well as forecast the behavior of the target system [110]. Relationship rules between variables are graphically represented with arrows symbolizing the cause–effect relationship and different line widths demonstrating the strength of the causal relationship. The color of the arrows indicates a negative or positive correlation between the variables. Fuzzy cognitive mapping of this volatile crisis environment can be a powerful tool for creating effective and efficient suggestions about our studied hypotheses.
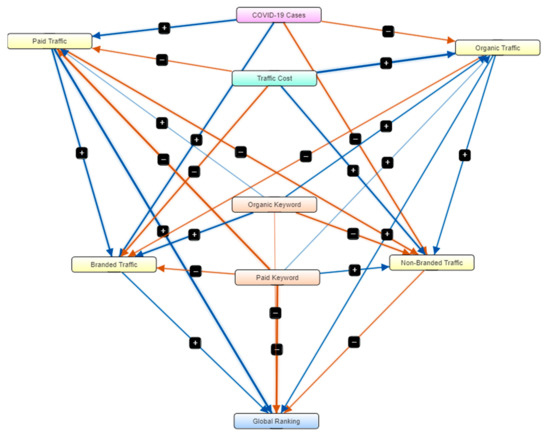
Figure 4.
Fuzzy cognitive mapping (FCM) of the variables studied during the “crisis within a crisis effect” period. Blue and red arrows signify positive and negative correlations between variables respectively.
To further study our model we developed three scenarios simulating different states of the crisis during a “crisis within a crisis effect” period. For scenario 1 (Figure 5) we simulated a high level of COVID-19 cases (0.9 of the maximum recorded value). Scenario results suggested that the digital branding of the courier companies is negatively affected by a 3% increase in global ranking KPI.
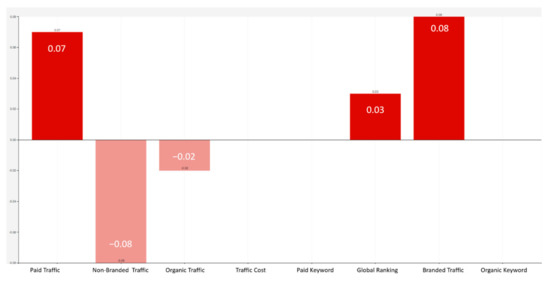
Figure 5.
Scenario 1 results (COVID-19 cases at 0.9).
For scenario 2 (Figure 6) we simulated a high level of COVID-19 cases (0.9 of the maximum recorded value) combined with a moderate (0.6 of the maximum recorded value) increase in paid keywords. Scenario outcomes indicated that digital branding decrease can be minimized by increasing the paid keywords.
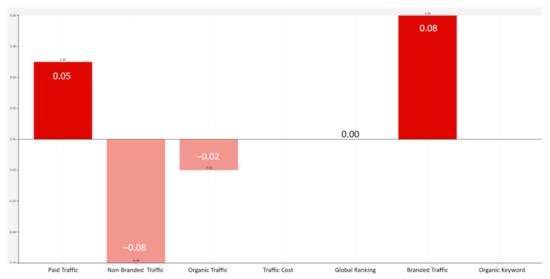
Figure 6.
Scenario 2 results (COVID-19 cases at 0.9, paid keywords at 0.6).
For scenario 3 (Figure 7) we simulated the same level of COVID-19 cases (0.9 of the maximum recorded value) combined with a very high increase in paid keywords (0.95 of the maximum recorded value). Simulation results supported the results of scenario 2 and further suggested that a higher resource allocation for paid keywords during a “crisis within a crisis effect” phase can reverse the negative impacts of crisis escalation on digital branding.
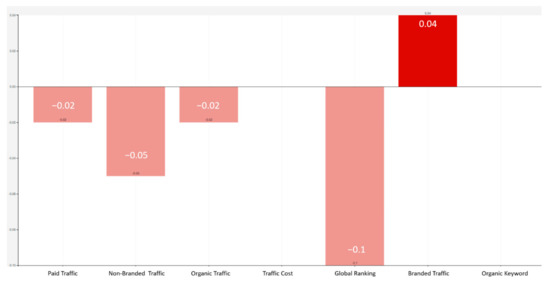
Figure 7.
Scenario 2 results (COVID-19 cases at 0.9, paid keywords at 0.95).
FCM scenario results supported statistical analysis outcomes by simulating the COVID-19 new infection cases effect on e-customers’ branding preferences during a “crisis within a crisis effect” period. FCM scenarios were also able to simulate the effect of possible organization’s responses to the decreasing digital branding level. These results introduce significant indications that Big Data processing through fuzzy cognitive mapping techniques could potentially assist organizations’ decision-making systems and risk mitigation strategies via simulating and forecasting responses to crisis scenarios and changes to a crisis environment.
4.3. Predictive and Simulation Model Development
The complex and critical environment of e-commerce has posed a range of challenges that constrain effective business performance. Dynamic simulation modelling (DSM) acts as a scenario-development tool, which examines the impact of possible solutions and further evaluates the effectiveness of interventions in real-time environmental conditions. Computational methods have been extensively used in both industries and academia in an attempt to run real-time scenarios.
Holistic modelling efforts have been recorded in high-tech laboratories [111,112], non-profit organizations [113], academic conferences [114,115], and the banking sector [116], among others.
Extensive research has been developed on the supply chain [117,118,119]. Adhitya et al. [120] investigated risk management in the supply chain, suggesting that “consequence analysis can be conducted using a dynamic simulation model of the supply chain operations”. Mielczarek and Uziałko-Mydlikonska [121] focused on Big Data and DSM in healthcare delivery systems, stating that those two variables are synergistic. Research by Johnson et al. [122] further supported the interrelationship between Big Data and DSM as being an important “what if” value. In research by Sarlis et al. [123], the authors developed a dynamic simulation model for the advancement of websites’ visibility. In essence, Big Data and DSM have received much attention lately, highlighting their great contribution to predicting, evaluating, and responding to crises.
The current research focused on the development of a dynamic simulation (DS) model that integrates the variables identified in the analysis of Big Data from five top courier companies. To this view, the proposed DS model incorporated the variables that could affect the brand name of a courier company. This DS model aimed to present an advanced decision support tool for dynamic risk assessment in the supply chain. The model is flexible to run in multiple scenarios, based on users’ online purchasing behavior, as explored in the Big Data analysis.
Based on the results of the present study, online users tended to alter their e-shopping attitude once they were familiar with the COVID-19 hazards. Similarly, their online purchasing behavior changed again, within the same period, when there was a dramatic escalation of daily new infections. As their risk perception increased, the inclination towards well-established brands is highlighted.
In such an uncertain era, it is hard for risk managers to precisely predict and instantly respond to users’ online behavior. The proposed model, due to its dynamic nature, is a valuable tool to manage future risks more effectively and offer better risk mitigation strategies. It also provides valuable information to risk managers and solutions for the proper allocation of a company’s resources. In essence, it is an important management tool that allows courier companies to predict the impact of risks and instantly respond, by developing “what if” scenarios and implementing risk mitigation measures, essential in minimizing online buyers’ risk perception, and advancing risk familiarity and enhancing brand awareness and trust.
4.4. Dynamic Simulation of “Crisis in a Crisis Effect”
In order to create the dynamic simulation model (DMS) for the “crisis within a crisis effect”, a significant outcome of the present study, we used some of the iThink features, presented below in Figure 8 combined with all the variables that significantly affect the second semi-period. Once the model was implemented [Appendix A], we performed a “run” to evaluate the outcomes of the statistical analysis and verify its efficiency.
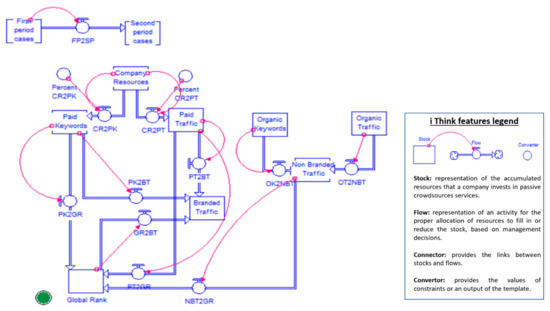
Figure 8.
Dynamic simulation model implementation.
The company allocates resources to the stocks “paid traffic” and “paid keywords” in order to advance their digital branding in crisis situations. These two stocks increase the stock “branded traffic”, which increases the stock “global rank” accordingly. The stock “non-branded traffic” further impacts the stock “global rank”; however, in a negative way since online users tend to prefer less-established brands when the risk perception during a crisis is lower and, therefore, crisis familiarity becomes a state of mind. The outcomes produced by the DSM are presented in Table 9 and Figure 9.
Table 9.
“Crisis within a crisis effect” outcomes from dynamic simulation modeling.
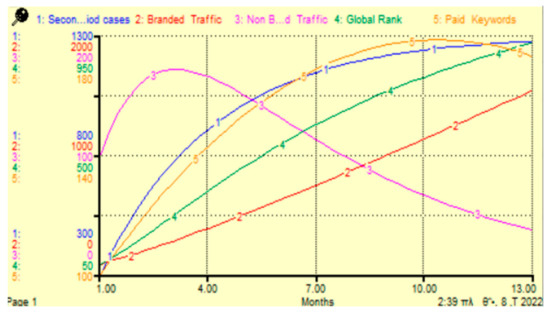
Figure 9.
“Crisis within a crisis effect” dynamic simulation (FCM scenario 3).
During the first semi-period, considered the familiarity period, online users adopted their pre-COVID behavior, toward less-established brands. This is obvious from the pink line in Figure 9, where there was a slight but transient increase in non-branded traffic. However, during the second semester of the COVID-2 period, the “omicron” new COVID mutation generated new confirmed cases, as the blue line demonstrates this sudden escalation in new infections, greatly affecting the online attitude of courier customers. During this period of uncertainty, online users shifted from less-known brands to established ones, leading to an impressive increase in branded traffic (as apparent in red line). Figure 9 clearly demonstrates this behavioral change and further confirms the positive contribution of paid keywords (rising yellow line) to well-established branding preferences. As paid keyword increased, branded traffic further increased, which favors the global rank of well-established courier companies (green line). This outcome provides support to the positive correlation between customers’ trust and companies’ reputation level [124].
This is exactly the point where the management of courier services should invest in paid advertising activities in an attempt to increase paid traffic, which consequently increases global ranking. The company should allocate more resources to the stock “paid keywords” rather than to the stock “paid traffic”, as the results clearly demonstrate the efficiency of this marketing activity. This is a once-in-a-lifetime opportunity for courier companies to highlight the superiority of their services through new product development, service innovation, offers, and discounts, as is evident from the outputs of the DSM. If the company misses this opportunity, online users will once again shift their behavior when the “omicron mutation” becomes familiar again to online users.
When it comes to the supply chain ecosystem, branding optimization can be inferred by expanding users’ engagement metrics in the DSM. The DSM provides a plethora of advantages for courier companies’ marketers and strategists. By investing resources in decision support systems based on behavioral KPIs and adapting them in micro-level environments, brands could enhance their online visibility and achieve higher conversion rates. The DSM recreates complex systems and predicts human behaviors during crisis periods, only when thorough examination of the correct variables is achieved.
Based on the outcomes of the current statistical analysis and following scenario 3 of the FCM, the company can allocate more resources to paid keywords, in an attempt to reverse the existing negative environment and enhance branding. When cases are escalating, the company can constantly evaluate the online behavior of users, based on the variables that mainly affect their purchasing behavior, and through the validation of KPIs, the marketing activities are directed at users’ behavioral change.
Results of the DSM provided a real-time perception of variable fluctuations and verified to a significant extent the outcomes of the statistical analysis and FCM scenarios. Multiple studies have revealed the importance of DSM as a tool for proactive and optimal decision-making [125,126,127]. DMS results of this study provide further support to the fact that DSM facilitates the optimization of operation functionality and could be a significant risk management tool for the sustainability and vitality of courier companies during crises. By running multiple scenarios and constantly monitoring passive crowdsourcing services, the management teams of courier companies will be able to better allocate the company’s resources to concrete marketing activities, from incipient to full-scale crises, in favor of digital optimization, brand credibility and customer loyalty.
5. Discussion
As the literature reveals, the pandemic has forced companies to adapt to online shopping and, in most cases, abandon brick-and-mortar sales, even after regulations have been lifted [128]. COVID-19 has changed previous patterns of buying behavior, from traditional to more digitalized online attitudes [129]. The results of a survey conducted at the end of 2020 by the European Commission indicate that 71% of consumers have shifted to e-commerce sales [130], clarifying the tendency of customers to use online services.
According to the present study’s hypotheses, it is estimated that the ongoing COVID-19 pandemic has modified the way that online users purchase when selecting courier services. Indeed, the rising popularity of delivery services during the pandemic indicate that people have turned to delivery services not only for convenience, but also for safety reasons [131]. According to Sakas et al. [20], during periods of uncertainty, customers tend to trust familiar brands, raising concerns regarding how customers select courier services and the role of brands during crisis escalation. Following this research outcome, the current research investigated the role of branding when selecting courier services and the level to which familiarization affects this variable through our hypotheses. Based on the outcomes of the current research, the daily number of infections has not changed online users’ e-shopping attitude from the COVID-1st to COVID-2nd period, confirming H1. That is to say that customers remain loyal in using courier services, even if countries have relaxed rules and scaled back testing, indicating that the new coronavirus has shifted customers purchasing behavior to be loyal to digitalized services [132] The pandemic has been challenging for the industry, requesting innovative ways to serve their audience [133]. The new trend of courier services in constantly providing innovative solutions based on flexibility, freedom of decision-making, and health and safety is an indication that customer will still rely on delivery services after the crisis is over [134].
However, the familiarity with COVID-19 hazards has directed online customers into adopting their pre-COVID behaviors for less-established brands, confirming H2. As people become more familiar with COVID-19, adaptiveness is one key factor that shapes their online purchasing behavior [24]. According to Guthrie et al. [135] during the coping phase of the pandemic, customers adopt new habits that will become the “new normal” during the adapting phase. This means that although there is a tendency for consumers to keep using delivery services, there are several factors that affect their brand preferences [5], among which trust in a brand is of the essence [136]. When familiarity becomes the “new normal”, customers of courier services tend to use brands they may trust less, if other factors, such as delivery time [137] and payment methods [5] better satisfy their needs. The tendency of consumers to prefer less-established brands is further supported by H3, in which global ranking during the COVID-2nd period decreased, positively affecting digital branding for less known courier companies.
However, during the 2nd year, the dramatic escalation of new infections caused by new COVID-19 mutations reversed their online purchasing attitude from non-branded to branded preferences. Indeed, during crisis situations, purchasing behaviors are greatly affected by customers’ product familiarity [138]. This is a significant outcome, which leads us to the conclusion that when risk perception revives from scratch within the same period, through the explosion of new infections, consumers adopt their “crisis online behavior” with reliability [139] and brand image [140] positively affecting customers’ preferences. This “crisis within a crisis effect” similarly affects consumers’ risk perception at the beginning of the pandemic. It becomes essential that, when there is an increase in infections within a crisis period, the employment of risk-reduction strategies should be based on well-established brands.
Risk perception, brand credibility, and past experience have been the focus of multiple studies, indicating the importance of branding [141,142]. Although people tend to underestimate familiar risks, the current research revealed that when a crisis revives, they shift their branding preferences from less-established brands (COVID-1st period online purchasing behavior) to popular brands (COVID-2nd period online purchasing behavior), to eliminate their risk perceptions. This outcome confirms H4 and emphasizes the tendency and emotional connection of online users to choose trustworthy and reliable services [143]. H4 confirmation was also supported by the FCM scenario results indicating that although during a “crisis within a crisis effect” phase of a pandemic crisis, branding is highly affected by the escalation of the crisis, this effect can be reversed by proper allocation of resources for the enhancement of traffic to the organization’s root domain.
In essence, during situations of high uncertainty, online consumers are not merely buying name brands but are in fact seeking assurance. Risk managers of courier companies should allocate resources to advancing the dynamics of branded traffic and organic keywords, through media advertising and social media marketing, among others, so as to increase brand awareness, attract new online users and achieve high conversion rates. Big Data should be seen as an important risk management tool for digital branding, where risk is the core product to invest in and reverse existing high-risk perceptions of risk familiarity.
6. Conclusions
COVID-19 should be the re-starting point for the supply chain as it has brought to light previous vulnerabilities and accelerated many pre-existing trends. Physical distancing and confinement measures have accelerated the already growing trends in online shopping. Millions of online customers have changed their behavior, a fact that puts a considerable strain on e-commerce. While many would argue that the COVID-19 pandemic as a once-in-a-lifetime event, waiting for normality, it brought priorities, such as visibility and digitalization that are not only temporarily needed, but requirements that are here to stay.
6.1. Theoretical Implications
The role of risk familiarity in customers’ purchasing behavior and branding preferences has been the point of research for the current study. It provides support to multiple studies, regarding the impact of COVID-19 to online e-commerce and the use of courier services [5,130,132,133,140,144]. What is most important is that the purchasing behavior of consumers toward well- or less-established brands greatly depends on the level of their familiarity risk. The more familiar with COVID-19 customers are, the more they adopt their pre-COVID consuming habits and shift toward less-known brands, a fact that raises concerns regarding the correlation between customers’ trust and an internet vendor’s reputation level [12]. Due to the nature of the industry itself that is related to the transportation of products, it is estimated that customers put more attention into selecting branded products when shopping online, rather than selecting a well-established courier service. However, as the crisis escalates, customers tend to choose well-established brands, due to their need to mitigate their high levels of risk perceptions. To the best of our knowledge, this is among the first studies to prove that the logistics sector, and especially courier services, are evaluated differently by consumers, since they assess delivery punctuality and quality of courier services as important factors for their satisfaction [145]. When crises occur, potential delays or non-deliveries, make customers more anxious in selecting trusted brands that will successfully execute the delivered promise.
Moreover, a comprehensive dynamic simulation model was developed to offer deep insights into how online consumers shift their attitudes toward less-established brands as their risk perception lowers and the COVID-19 hazards become a more familiar context. Previous studies have been devoted to supply chain simulation modeling, highlighting its uniqueness to visualize, understand and quantify such dynamics [146,147]. To this end, the present study invested in the development of a dynamic simulation model as an important risk management tool to forecast and optimize the performance of courier services during crisis situations.
6.2. Managerial Implications
The need for safety and hygiene was, and still is, of paramount importance during the pandemic. As a result, several courier companies immediately responded to the new challenging environment by developing new services. Even if some COVID-19-related innovations have a predicted short-life cycle, risk managers must continue to optimize efficiencies with the intention to create brand loyalty. New online activities, based on choices, the pool of alternatives, and flexibility, should be developed so that courier companies to continue delivering the promised brand. As people become more familiar with the use of delivery services, courier companies should keep developing new strategies to make operations and services easier for both the industry and customers. Reusable packaging, deliveries by drones and deliveries to cars are just a few innovations that should become the norm in the industry [133].
Globally, as of the 14 October 2022, there have been 620,878,405 confirmed cases of COVID-19, including 6,543,138 deaths [148]. However, most countries have lifted COVID-related restrictions, while customers still use courier services [133]. Since familiarity with COVID-19 plays a significant role in customers’ purchasing behavior, courier companies should allocate more resources to developing marketing activities that will inform the audience both at the beginning and during the crisis. The faster the customers move from the reacting phase to the coping and adapting one, the easier the new consuming habits become the “new normal” [134]. Sharing relevant online content that informs, educates, and facilitates consumers offers a great opportunity for risk managers to quickly convey true information about hazards. The pandemic has changed the way consumers view brands [149] and therefore courier companies’ marketing communications, as part of a country’s communication strategy, should invest in knowledge distribution [150]. This communication channel will enable online customers to become familiar with the COVID-19 risks and move at a rapid pace into the adapting phase.
Perhaps the most important aspect for courier companies is to initially establish a strong brand name since consumers tend to ignore less-known brands, even if they offer the same benefits [151]. Especially, when there is a second wave of crisis, consumers tend to trust well-establish brands [20].
As a consequence, enhancing brand credibility should be the priority in courier companies’ marketing strategies. In some cases, the unexpected growing demand for courier services has pressured e-commerce distribution channels, leading to delays or non-deliveries. To make the brand trustworthy, risk managers should establish stronger policies to solve customer problems and provide high-quality services related to delivery issues. Evaluation programs, pre-defined upgrades, and customer support are essential approaches to reducing users’ perceived risk [141]. Establishing a long-term relationship with online users, both post-sale and after-sale is also valuable to risk mitigation. To do so courier companies should invest in Big Data analysis as a key pillar of corporate resilience. Big Data analysis offers a great opportunity for courier companies to harness their data and use it to identify new opportunities and trends.
What seems obvious today, after 2 years of the pandemic, is the risk familiarity that customers have related to COVID-19 hazards, which leads to the adoption of pre-COVID branding preferences. However, when a “crisis within a crisis” occurs, there is an urgent need to develop crystal clear steps for identifying, analyzing, and planning responses as an antidote to online customers’ higher perceived risk. This “crisis within a crisis effect” would remain an uncovered hidden pattern without the contribution of crowdsourcing services. If companies want to achieve rapid recovery and continuous growth, the analysis of the real-time data and their adaption to simulation modeling is of great importance. Especially, the latter provides safe and efficient solutions to real-time problems.
6.3. Societal Implication
According to Statista, 61% of respondents chose home delivery, either at their door or in their mailbox, making home package delivery the most used method worldwide in 2021 [152]. During COVID-19, courier services manage to cope with a vast range of clients, allowing businesses to operate, despite the confinement measures imposed [136]. Therefore, courier companies greatly contributed to business viability and resilience.
Since the outcomes of the present study revealed that customers continue to use courier services, despite lifting COVID-19 restrictions, it is more than imperative for courier companies to invest in innovative services that will allow both employees and customers to better experience the services delivered. On one hand, employees face safety and health risks while at work [153,154], so online payments, contactless deliveries, or autonomous delivery systems, among others, will contribute to mitigating health issues and reductions in traffic collisions and emissions. On the other hand, as the research suggests, risk familiarity plays an important role in branding preferences, implying the employment of educational policies to increase customers’ knowledge so as to reduce or eliminate maladaptive beliefs [155].
7. Research Limitations and Future Research Proposals
The main focus of this paper was to acknowledge the importance of using Big Data and simulation modeling to identify the effect of COVID-19 familiarity risk on courier companies’ digital branding. However, the findings of this study must be seen in light of some limitations. Five top courier companies have been examined in three different periods, the pre-COVID year, and the 1st and 2nd year of the pandemic. Although the sample was sufficient enough for the needs of the current study, more courier companies should be thoroughly studied, to confirm our hypotheses.
In addition, for the purpose of the current study, the periods under examination were on an annual basis. As the weeks go by and the COVID-19 cases are constantly increasing and decreasing, it would be of extreme importance to examine more periods, for instance on a monthly or six-month basis, to verify the newly introduced term “crisis within a crisis effect”. This will further shed light on online users’ behavior toward brand preferences, during a novel crisis and why customers tend to choose less-known brands when the risk familiarity level is low, whereas they choose well-established brands when the level of risk familiarity is relatively low.
Eventually, our proposed methodology and framework could be enforced with more discursive analysis, since Big Data offers a vast amount of information. What would be real help to risk managers is to examine our proposed methodology in other sectors within the same industry, such as procurement and production logistics, so as to see if e-shopping attitudes remain the same across markets. Under this perspective, more research is recommended by using product segmentation. The authors of the current study suggest that online users’ behavior may be different regarding risk perception and familiarity, depending on the type of product they order.
Last, more investigation is required in the development of dynamic simulation models, for the current study’s credibility and confirmation within the supply chain. More scenarios would provide deeper insight into the proper allocation of resources and the optimization of digital branding strategies.
Author Contributions
Conceptualization, D.P.S., I.D.G.K. and M.C.T.; methodology, D.P.S., I.D.G.K. and M.C.T.; software, D.P.S., I.D.G.K. and M.C.T.; validation, D.P.S., I.D.G.K. and M.C.T.; formal analysis, D.P.S., I.D.G.K. and M.C.T.; investigation, D.P.S., I.D.G.K. and M.C.T.; resources, D.P.S., I.D.G.K. and M.C.T.; data curation, D.P.S., I.D.G.K. and M.C.T.; writing—original draft preparation, D.P.S., I.D.G.K. and M.C.T.; writing—review and editing, D.P.S., I.D.G.K. and M.C.T.; visualization, D.P.S., I.D.G.K. and M.C.T.; supervision, D.P.S., I.D.G.K. and M.C.T.; project administration, D.P.S., I.D.G.K. and M.C.T.; funding acquisition, D.P.S., I.D.G.K. and M.C.T.; All authors have read and agreed to the published version of the manuscript.
Funding
This research received no external funding.
Institutional Review Board Statement
Not applicable.
Informed Consent Statement
Not applicable.
Data Availability Statement
The data presented in this study are available on request from the corresponding author. The data are not publicly available because they include details regarding financial organizational activities.
Conflicts of Interest
The authors declare no conflict of interest.
Appendix A
Table A1.
iThink coding routine for defining branding through global rank.
Table A1.
iThink coding routine for defining branding through global rank.
| Branded__Traffic(t) = Branded__Traffic(t − dt) + (PK2BT + PT2BT + GR2BT) * dtINIT | |
| Branded__Traffic = PT2BT + PK2BT | |
| INFLOWS: | PK2BT = Paid__Keywords * 0.5 |
| PT2BT = Paid__Traffic * 0.3 | |
| GR2BT = Global_Rank * 0.05 | |
| Company__Resources(t) = Company__Resources(t − dt) + (−CR2PK − CR2PT) * dtINIT | |
| Company__Resources = 10,000 | |
| OUTFLOWS: | CR2PK = Company__Resources * (Percent__CR2PK/100) |
| CR2PT = Company__Resources * (Percent_CR2PT/100) | |
| Global_Rank(t) = Global_Rank(t − dt) + (PK2GR + PT2GR + NBT2GR − GR2BT) * dtINIT | |
| Global_Rank = PK2GR + PT2GR + NBT2GR | |
| INFLOWS: | PK2GR = Paid__Keywords * 0.5 |
| PT2GR = Paid__Traffic * 0.3 | |
| NBT2GR = Non_Branded__Traffic * 0.2 | |
| OUTFLOWS: | GR2BT = Global_Rank * 0.05 |
| Non_Branded__Traffic(t) = Non_Branded__Traffic(t − dt) + (OK2NBT + OT2NBT − NBT2GR) * dtINIT Non_Branded__Traffic = OK2NBT + OT2NBT | |
| INFLOWS: | OK2NBT = Organic__Keywords * 0.4 |
| OT2NBT = Organic__Traffic * 0.6 | |
| OUTFLOWS: | NBT2GR = Non_Branded__Traffic * 0.2 |
| Organic__Keywords(t) = Organic__Keywords(t − dt) + (−OK2NBT) * dtINIT | |
| Organic__Keywords = 100 | |
| OUTFLOWS: | OK2NBT = Organic__Keywords * 0.4 |
| Organic__Traffic(t) = Organic__Traffic(t − dt) + (−OT2NBT) * dtINIT Organic__Traffic = 100 | |
| OUTFLOWS: | OT2NBT = Organic__Traffic * 0.6 |
| Paid__Keywords(t) = Paid__Keywords(t − dt) + (CR2PK − PK2GR − PK2BT) * dtINIT | |
| Paid__Keywords = CR2PK | |
| INFLOWS: | CR2PK = Company__Resources * (Percent__CR2PK/100) |
| OUTFLOWS: | PK2GR = Paid__Keywords * 0.5 |
| PK2BT = Paid__Keywords * 0.5 | |
| Paid__Traffic(t) = Paid__Traffic(t − dt) + (CR2PT − PT2BT − PT2GR) * dtINIT Paid__Traffic = CR2PT | |
| INFLOWS: | CR2PT = Company__Resources * (Percent_CR2PT/100) |
| OUTFLOWS: | PT2BT = Paid__Traffic * 0.3 |
| PT2GR = Paid__Traffic * 0.3 | |
References
- Adibfar, A.; Gulhare, S.; Srinivasan, S.; Costin, A. Analysis and Modeling of Changes in Online Shopping Behavior Due to COVID-19 Pandemic: A Florida Case Study. Transp. Policy 2022, 126, 162–176. [Google Scholar] [CrossRef] [PubMed]
- Srivatsa Srinivas, S.; Marathe, R.R. Moving towards “Mobile Warehouse”: Last-Mile Logistics during COVID-19 and Beyond. Transp. Res. Interdiscip. Perspect. 2021, 10, 100339. [Google Scholar] [CrossRef]
- Osakwe, C.N.; Hudik, M.; Říha, D.; Stros, M.; Ramayah, T. Critical Factors Characterizing Consumers’ Intentions to Use Drones for Last-Mile Delivery: Does Delivery Risk Matter? J. Retail. Consum. Serv. 2022, 65, 102865. [Google Scholar] [CrossRef]
- Dones, R.L.E.; Young, M.N. Demand on the of Courier Services during COVID-19 Pandemic in the Philippines. In Proceedings of the 2020 7th International Conference on Frontiers of Industrial Engineering (ICFIE), Singapore, 27–29 September 2020; pp. 131–134. [Google Scholar]
- Kunytska, O.; Comi, A.; Danchuk, V.; Vakulenko, K.; Yanishevskyi, S. Optimizing Last Mile Delivering Through the Analysis of Shoppers’ Behaviour. In Decision Support Methods in Modern Transportation Systems and Networks; Sierpiński, G., Macioszek, E., Eds.; Lecture Notes in Networks and Systems; Springer International Publishing: Cham, Switzerland, 2021; Volume 208, pp. 129–147. ISBN 978-3-030-71770-4. [Google Scholar]
- Rosillo-Díaz, E.; Blanco-Encomienda, F.J.; Crespo-Almendros, E. A Cross-Cultural Analysis of Perceived Product Quality, Perceived Risk and Purchase Intention in e-Commerce Platforms. J. Enterp. Inf. Manag. 2019, 33, 139–160. [Google Scholar] [CrossRef]
- Ha, H.-Y. The Effects of Consumer Risk Perception on Pre-Purchase Information in Online Auctions: Brand, Word-of-Mouth, and Customized Information. J. Comput.-Mediat. Commun. 2002, 8, JCMC813. [Google Scholar] [CrossRef]
- Praharjo, A. The Impact of Electronic Word of Mouth on Repurchase Intention Mediated by Brand Loyalty and Repurchase Intention. Ph.D. Thesis, Universitas Brawijaya, Malang, Indonesia, 2016. [Google Scholar]
- Huifeng, P.; Ha, H.-Y. Temporal Effects of Online Customer Reviews on Restaurant Visit Intention: The Role of Perceived Risk. J. Hosp. Mark. Manag. 2021, 30, 825–844. [Google Scholar] [CrossRef]
- Huifeng, P.; Ha, H.-Y.; Lee, J.-W. Perceived Risks and Restaurant Visit Intentions in China: Do Online Customer Reviews Matter? J. Hosp. Tour. Manag. 2020, 43, 179–189. [Google Scholar] [CrossRef]
- Teo, T.S.H.; Liu, J. Consumer Trust in E-Commerce in the United States, Singapore and China. Omega 2007, 35, 22–38. [Google Scholar] [CrossRef]
- Huang, W.; Schrank, H.; Dubinsky, A.J. Effect of Brand Name on Consumers’ Risk Perceptions of Online Shopping. J. Consum. Behav. Int. Res. Rev. 2004, 4, 40–50. [Google Scholar] [CrossRef]
- Tzavlopoulos, Ι.; Gotzamani, K.; Andronikidis, A.; Vassiliadis, C. Determining the Impact of E-Commerce Quality on Customers’ Perceived Risk, Satisfaction, Value and Loyalty. Int. J. Qual. Serv. Sci. 2019, 11, 576–587. [Google Scholar] [CrossRef]
- Corbitt, B.J.; Thanasankit, T.; Yi, H. Trust and E-Commerce: A Study of Consumer Perceptions. Electron. Commer. Res. Appl. 2003, 2, 203–215. [Google Scholar] [CrossRef]
- Suguna, M.; Shah, B.; Raj, S.K.; Suresh, M. A Study on the Influential Factors of the Last Mile Delivery Projects during COVID-19 Era. Oper. Manag. Res. 2022, 15, 399–412. [Google Scholar] [CrossRef]
- Wang, X.; Kim, W.; Holguín-Veras, J.; Schmid, J. Adoption of Delivery Services in Light of the COVID Pandemic: Who and How Long? Transp. Res. Part A Policy Pract. 2021, 154, 270–286. [Google Scholar] [CrossRef]
- Hassan, S.; Awan, M.; Bhaumik, A. COVID-19-Quarantine-and-Consumer-Behavior-That-Change-the-Trends-of-Business-Sustainability-Development. Acad. Strateg. Manag. J. 2020, 19, 577. [Google Scholar]
- Roggeveen, A.L.; Sethuraman, R. How the COVID-19 Pandemic May Change the World of Retailing. J. Retail. 2020, 96, 169–171. [Google Scholar] [CrossRef]
- Sakas, D.P.; Kamperos, I.D.G.; Reklitis, P. Estimating Risk Perception Effects on Courier Companies’ Online Customer Behavior during a Crisis, Using Crowdsourced Data. Sustainability 2021, 13, 12725. [Google Scholar] [CrossRef]
- Sheth, J. Impact of COVID-19 on Consumer Behavior: Will the Old Habits Return or Die? J. Bus. Res. 2020, 117, 280–283. [Google Scholar] [CrossRef] [PubMed]
- Zwanka, R.J.; Buff, C. COVID-19 Generation: A Conceptual Framework of the Consumer Behavioral Shifts to Be Caused by the COVID-19 Pandemic. J. Int. Consum. Mark. 2021, 33, 58–67. [Google Scholar] [CrossRef]
- Rahmanov, F.; Mursalov, M.; Rosokhata, A. Consumer Behavior in Digital Era: Impact of COVID 19. Mark. Manag. Innov. 2021, 5, 243–251. [Google Scholar] [CrossRef]
- Gu, S.; Ślusarczyk, B.; Hajizada, S.; Kovalyova, I.; Sakhbieva, A. Impact of the COVID-19 Pandemic on Online Consumer Purchasing Behavior. J. Theor. Appl. Electron. Commer. Res. 2021, 16, 2263–2281. [Google Scholar] [CrossRef]
- Mason, A.; Narcum, J.; Mason, K. Changes in Consumer Decision-Making Resulting from the COVID-19 Pandemic. J. Cust. Behav. 2020, 19, 299–321. [Google Scholar] [CrossRef]
- Valaskova, K.; Durana, P.; Adamko, P. Changes in Consumers’ Purchase Patterns as a Consequence of the COVID-19 Pandemic. Mathematics 2021, 9, 1788. [Google Scholar] [CrossRef]
- Di Crosta, A.; Ceccato, I.; Marchetti, D.; La Malva, P.; Maiella, R.; Cannito, L.; Cipi, M.; Mammarella, N.; Palumbo, R.; Verrocchio, M.C.; et al. Psychological Factors and Consumer Behavior during the COVID-19 Pandemic. PLoS ONE 2021, 16, e0256095. [Google Scholar] [CrossRef] [PubMed]
- Laato, S.; Islam, A.K.M.N.; Farooq, A.; Dhir, A. Unusual Purchasing Behavior during the Early Stages of the COVID-19 Pandemic: The Stimulus-Organism-Response Approach. J. Retail. Consum. Serv. 2020, 57, 102224. [Google Scholar] [CrossRef]
- Ventriglio, A.; Watson, C.; Bhugra, D. Pandemics, Panic and Prevention: Stages in the Life of COVID-19 Pandemic. Int. J. Soc. Psychiatry 2020, 66, 733–734. [Google Scholar] [CrossRef] [PubMed]
- Gefen, D. E-Commerce: The Role of Familiarity and Trust. Omega 2000, 28, 725–737. [Google Scholar] [CrossRef]
- Oliveira, T.; Alhinho, M.; Rita, P.; Dhillon, G. Modelling and Testing Consumer Trust Dimensions in E-Commerce. Comput. Hum. Behav. 2017, 71, 153–164. [Google Scholar] [CrossRef]
- Qiu, R.; Zhu, X. The Relationship Between Public Risk Familiarity and Mental Health During the COVID-19 Epidemic: A Moderated Mediation Model. Front. Psychol. 2022, 13, 945928. [Google Scholar] [CrossRef] [PubMed]
- Mori, T.; Nagata, T.; Ikegami, K.; Hino, A.; Tateishi, S.; Tsuji, M.; Matsuda, S.; Fujino, Y.; Mori, K.; The CORoNaWork Project. Effect of COVID-19 Infection Related Experiences on Outing Behaviors When a State of Emergency Is Declared: A Cohort Study. medRxiv 2021. [Google Scholar] [CrossRef]
- Thun, J.-H.; Hoenig, D. An Empirical Analysis of Supply Chain Risk Management in the German Automotive Industry. Int. J. Prod. Econ. 2009, 131, 242–249. [Google Scholar] [CrossRef]
- Tang, C.S. Perspectives in Supply Chain Risk Management. Int. J. Prod. Econ. 2006, 103, 451–488. [Google Scholar] [CrossRef]
- Jüttner, U.; Peck, H.; Christopher, M. Supply Chain Risk Management: Outlining an Agenda for Future Research. Int. J. Logist. Res. Appl. 2003, 6, 197–210. [Google Scholar] [CrossRef]
- Goh, M.; Lim, J.; Meng, F. A Stochastic Model for Risk Management in Global Supply Chain Networks. Eur. J. Oper. Res. 2007, 182, 164–173. [Google Scholar] [CrossRef]
- Ho, W.; Zheng, T.; Yildiz, H.; Talluri, S. Supply Chain Risk Management: A Literature Review. Int. J. Prod. Res. 2015, 53, 5031–5069. [Google Scholar] [CrossRef]
- Tang, O.; Musa, N. Identifying Risk Issues and Research Advancements in Supply Chain Risk Management. Int. J. Prod. Econ. 2011, 133, 25–34. [Google Scholar] [CrossRef]
- Chionis, D.; Karanikas, N. Risk Perception and Risk Communication from a Systems Perspective: A Study on Safety Behavioural Intervention Frameworks and Functions. Syst. Pr. Action Res. 2022, 35, 711–746. [Google Scholar] [CrossRef]
- Weinstein, N.D. Unrealistic Optimism about Future Life Events. J. Personal. Soc. Psychol. 1980, 39, 806–820. [Google Scholar] [CrossRef]
- Douglas, M.; Wildavsky, A. Risk and Culture: An Essay on Selection of Technological and Environmental Dangers. Rev. Fr. Sociol. 1982, 28, 178–181. [Google Scholar]
- Kahan, D.M. Cultural Cognition as a Conception of the Cultural Theory of Risk. In Handbook of Risk Theory: Epistemology, Decision Theory, Ethics, and Social Implications of Risk; Roeser, S., Hillerbrand, R., Sandin, P., Peterson, M., Eds.; Springer: Dordrecht, The Netherlands, 2012; pp. 725–759. ISBN 978-94-007-1433-5. [Google Scholar]
- Fischhoff, B.; Slovic, P.; Lichtenstein, S.; Read, S.; Combs, B. How Safe Is Safe Enough? A Psychometric Study of Attitudes Toward Technological Risks and Benefits. Policy Sci. 1978, 9, 127–152. [Google Scholar] [CrossRef]
- Siegrist, M.; Keller, C.; Kiers, H.A.L. A New Look at the Psychometric Paradigm of Perception of Hazards. Risk Anal. 2005, 25, 211–222. [Google Scholar] [CrossRef]
- Marris, C.; Langford, I.; Saunderson, T.; O’Riordan, T. Exploring the “Psychometric Paradigm”: Comparisons between Aggregate and Individual Analyses. Risk Anal. 1997, 17, 303–312. [Google Scholar] [CrossRef]
- Bronfman, N.C.; Cifuentes, L.A. Risk Perception in a Developing Country: The Case of Chile. Risk Anal. 2003, 23, 1271–1285. [Google Scholar] [CrossRef]
- Wiegman, O.; Gutteling, J.M.; Cadet, B. Perception of Nuclear Energy and Coal in France and the Netherlands. Risk Anal. 1995, 15, 513–521. [Google Scholar] [CrossRef] [PubMed]
- Poumadere, M.; Mays, C.; Slovic, P.; Flynn, J.; Johnson, S. What Lies behind Public Acceptance? Comparison of US and French Perceptions of the Nuclear Power Option. In Proceedings of the International Atomic Energy Agency Meeting of the Nuclear Power Option, Vienna, Austria, 7 September 1995. [Google Scholar]
- Wallach, M.A.; Kogan, N.; Bem, D.J. Diffusion of Responsibility and Level of Risk Taking in Groups. J. Abnorm. Soc. Psychol. 1964, 68, 263–274. [Google Scholar] [CrossRef] [PubMed]
- Flanders, J.P.; Thistlethwaite, D.L. Effects of Familiarization and Group Discussion upon Risk Taking. J. Personal. Soc. Psychol. 1967, 5, 91–97. [Google Scholar] [CrossRef]
- Teger, A.I.; Pruitt, D.G.; Jean, R.S.; Haaland, G.A. A Reexamination of the Familiarization Hypothesis in Group Risk Taking. J. Exp. Soc. Psychol. 1970, 6, 346–350. [Google Scholar] [CrossRef]
- Weber, E.U.; Siebenmorgen, N.; Weber, M. Communicating Asset Risk: How Name Recognition and the Format of Historic Volatility Information Affect Risk Perception and Investment Decisions. Risk Anal. 2005, 25, 597–609. [Google Scholar] [CrossRef] [PubMed]
- Mullet, E.; Ciutad, N.; Rivière-Shafighi, S. Cognitive Processes Involved in the Assessment of Health Hazards’ Severity. Health Risk Soc. 2004, 6, 277–288. [Google Scholar] [CrossRef]
- Royne, M.B.; Fox, A.K.; Deitz, G.D.; Gibson, T. The Effects of Health Consciousness and Familiarity with DTCA on Perceptions of Dietary Supplements. J. Consum. Aff. 2014, 48, 515–534. [Google Scholar] [CrossRef]
- Schiffman, L.G.; Kanuk, L.L.; Kumar, S.R.; Wisenblit, J. Consumer Behavior. 10th edition. Available online: https://repository.iimb.ac.in/handle/2074/12722 (accessed on 18 March 2022).
- Jisana, T.K. Consumer Behaviour Models: An Overview. Sai Om J. Commer. Manag. 2014, 1, 34–43. [Google Scholar]
- Tidwell, P. Compensatory Versus Non-Compensatory Choice Strategies in Limited Problem Solving Consumer Behavior: Engel-Kollat-Blackwell Versus Howard Models. In Proceedings of the 1996 Academy of Marketing Science (AMS) Annual Conference; Wilson, E.J., Hair, J.F., Eds.; Developments in Marketing Science: Proceedings of the Academy of Marketing Science; Springer International Publishing: Cham, Switzerland, 2015; pp. 220–224. ISBN 978-3-319-13143-6. [Google Scholar]
- Reddipalli, R. Howard Sheth Model of Consumer Behaviour on Buying a Smartphone. SSRN J. 2020. [CrossRef]
- Sherman, E.; Mathur, A.; Smith, R.B. Store Environment and Consumer Purchase Behavior: Mediating Role of Consumer Emotions. Psychol. Mark. 1997, 14, 361–378. [Google Scholar] [CrossRef]
- Vignali, C. Benetton’s Brand Position Explored and Developed through Nicosia’s Consumer-Behaviour Model. J. Text. Inst. 1999, 90, 48–59. [Google Scholar] [CrossRef]
- Zaichkowsky, J.L. Consumer Behavior: Yesterday, Today, and Tomorrow. Bus. Horiz. 1991, 34, 51–59. [Google Scholar] [CrossRef]
- Dimanche, F.; Havitz, M.E. Consumer Behavior and Tourism:: Review and Extension of Four Study Areas. J. Travel Tour. Mark. 1995, 3, 37–57. [Google Scholar] [CrossRef]
- Sirgy, M.J. Self-Concept in Consumer Behavior: A Critical Review. J. Consum. Res. 1982, 9, 287. [Google Scholar] [CrossRef]
- Borgo, R.; Micallef, L.; Bach, B.; McGee, F.; Lee, B. Information Visualization Evaluation Using Crowdsourcing. Comput. Graph. Forum 2018, 37, 573–595. [Google Scholar] [CrossRef]
- Loukis, E.; Charalabidis, Y.; Androutsopoulou, A. Evaluating a Passive Social Media Citizensourcing Innovation. In Proceedings of the Electronic Government; Tambouris, E., Janssen, M., Scholl, H.J., Wimmer, M.A., Tarabanis, K., Gascó, M., Klievink, B., Lindgren, I., Parycek, P., Eds.; Springer International Publishing: Cham, Switzerland, 2015; pp. 305–320. [Google Scholar]
- Connors, J.P.; Lei, S.; Kelly, M. Citizen Science in the Age of Neogeography: Utilizing Volunteered Geographic Information for Environmental Monitoring. Ann. Assoc. Am. Geogr. 2012, 102, 1267–1289. [Google Scholar] [CrossRef]
- Arts, K.; Melero, Y.; Webster, G.; Sharma, N.; Tintarev, N.; Tait, E.; Mellish, C.; Sripada, S.; MacMaster, A.-M.; Sutherland, H.; et al. On the Merits and Pitfalls of Introducing a Digital Platform to Aid Conservation Management: Volunteer Data Submission and the Mediating Role of Volunteer Coordinators. J. Environ. Manag. 2020, 265, 110497. [Google Scholar] [CrossRef]
- Ciceri, E. Humans in the Loop: Optimization of Active and Passive Crowdsourcing, Politecnico Di Milano. Ph.D. Thesis, Polytechnic University of Milan, Milan, Italy, 2015. [Google Scholar]
- Sakas, D.P.; Giannakopoulos, N.T. Harvesting Crowdsourcing Platforms’ Traffic in Favour of Air Forwarders’ Brand Name and Sustainability. Sustainability 2021, 13, 8222. [Google Scholar] [CrossRef]
- Weischedel, B.; Matear, S.; Deans, K.R. The Use of Emetrics in Strategic Marketing Decisions: A Preliminary Investigation. Int. J. Internet Mark. Advert. 2005, 2, 109. [Google Scholar] [CrossRef]
- Kirsh, I.; Joy, M. Splitting the Web Analytics Atom: From Page Metrics and KPIs to Sub-Page Metrics and KPIs. In Proceedings of the 10th International Conference on Web Intelligence, Mining and Semantics, Biarritz, France, 30 June 2020; Association for Computing Machinery: New York, NY, USA; pp. 33–43. [Google Scholar] [CrossRef]
- Mani, V.; Delgado, C.; Hazen, B.; Patel, P. Mitigating Supply Chain Risk via Sustainability Using Big Data Analytics: Evidence from the Manufacturing Supply Chain. Sustainability 2017, 9, 608. [Google Scholar] [CrossRef]
- Järvinen, J.; Karjaluoto, H. The Use of Web Analytics for Digital Marketing Performance Measurement. Ind. Mark. Manag. 2015, 50, 117–127. [Google Scholar] [CrossRef]
- Phippen, A.; Sheppard, L.; Furnell, S. A Practical Evaluation of Web Analytics. Internet Res. 2004, 14, 284–293. [Google Scholar] [CrossRef]
- Akkus, I.E.; Chen, R.; Hardt, M.; Francis, P.; Gehrke, J. Non-Tracking Web Analytics. In Proceedings of the 2012 ACM conference on Computer and communications security, New York, NY, USA, 16 October 2012; Association for Computing Machinery: New York, NY, USA; pp. 687–698. [Google Scholar]
- Sakas, D.P.; Reklitis, D.P. The Impact of Organic Traffic of Crowdsourcing Platforms on Airlines’ Website Traffic and User Engagement. Sustainability 2021, 13, 8850. [Google Scholar] [CrossRef]
- Schlüter, F. Procedure Model for Supply Chain Digitalization Scenarios for a Data-Driven Supply Chain Risk Management. In Revisiting Supply Chain Risk; Zsidisin, G.A., Henke, M., Eds.; Springer Series in Supply Chain Management; Springer International Publishing: Cham, Switzerland, 2019; Volume 7, pp. 137–154. ISBN 978-3-030-03812-0. [Google Scholar]
- Baryannis, G.; Validi, S.; Dani, S.; Antoniou, G. Supply Chain Risk Management and Artificial Intelligence: State of the Art and Future Research Directions. Int. J. Prod. Res. 2019, 57, 2179–2202. [Google Scholar] [CrossRef]
- Fan, Y.; Heilig, L.; Voß, S. Supply Chain Risk Management in the Era of Big Data. In Design, User Experience, and Usability: Design Discourse; Marcus, A., Ed.; Lecture Notes in Computer Science; Springer International Publishing: Cham, Switzerland, 2015; Volume 9186, pp. 283–294. ISBN 978-3-319-20885-5. [Google Scholar]
- He, M.; Ji, H.; Wang, Q.; Ren, C.; Lougee, R. Big Data Fueled Process Management of Supply Risks: Sensing, Prediction, Evaluation and Mitigation. In Proceedings of the Winter Simulation Conference 2014, Savanah, GA, USA, 7–10 December 2014; pp. 1005–1013. [Google Scholar]
- Shang, Y.; Dunson, D.; Song, J.-S. Exploiting Big Data in Logistics Risk Assessment via Bayesian Nonparametrics. Oper. Res. 2017, 65, 1574–1588. [Google Scholar] [CrossRef]
- Er Kara, M.; Oktay Fırat, S.Ü.; Ghadge, A. A Data Mining-Based Framework for Supply Chain Risk Management. Comput. Ind. Eng. 2020, 139, 105570. [Google Scholar] [CrossRef]
- Aday, S.; Aday, M.S. Impact of COVID-19 on the Food Supply Chain. Food Qual. Saf. 2020, 4, 167–180. [Google Scholar] [CrossRef]
- Rizou, M.; Galanakis, I.M.; Aldawoud, T.M.S.; Galanakis, C.M. Safety of Foods, Food Supply Chain and Environment within the COVID-19 Pandemic. Trends Food Sci. Technol. 2020, 102, 293–299. [Google Scholar] [CrossRef]
- Armani, A.M.; Hurt, D.E.; Hwang, D.; McCarthy, M.C.; Scholtz, A. Low-Tech Solutions for the COVID-19 Supply Chain Crisis. Nat. Rev. Mater. 2020, 5, 403–406. [Google Scholar] [CrossRef] [PubMed]
- Sarkis, J. Supply Chain Sustainability: Learning from the COVID-19 Pandemic. Int. J. Oper. Prod. Manag. 2020, 41, 63–73. [Google Scholar] [CrossRef]
- Mollenkopf, D.A.; Ozanne, L.K.; Stolze, H.J. A Transformative Supply Chain Response to COVID-19. J. Serv. Manag. 2021, 32, 190–202. [Google Scholar] [CrossRef]
- Bag, S.; Dhamija, P.; Luthra, S.; Huisingh, D. How Big Data Analytics Can Help Manufacturing Companies Strengthen Supply Chain Resilience in the Context of the COVID-19 Pandemic. Int. J. Logist. Manag. 2021. [Google Scholar] [CrossRef]
- Chatterjee, S.; Chaudhuri, R.; Shah, M.; Maheshwari, P. Big Data Driven Innovation for Sustaining SME Supply Chain Operation in Post COVID-19 Scenario: Moderating Role of SME Technology Leadership. Comput. Ind. Eng. 2022, 168, 108058. [Google Scholar] [CrossRef]
- Gupta, R.; Srivastava, P.; Sharma, S.; Alrasheedi, M. Leveraging Big Data to Accelerate Supply Chain Management in COVID-19. In The Big Data-Driven Digital Economy: Artificial and Computational Intelligence; Musleh Al-Sartawi, A.M.A., Ed.; Studies in Computational Intelligence; Springer International Publishing: Cham, Switzerland, 2021; Volume 974, pp. 1–19. ISBN 978-3-030-73056-7. [Google Scholar]
- Sheng, J.; Amankwah-Amoah, J.; Khan, Z.; Wang, X. COVID-19 Pandemic in the New Era of Big Data Analytics: Methodological Innovations and Future Research Directions. Br. J. Manag. 2021, 32, 1164–1183. [Google Scholar] [CrossRef]
- Rinaldi, M.; Murino, T.; Bottani, E. The Impact Of COVID-19 On Logistic Systems: An Italian Case Study. IFAC-Pap. 2021, 54, 1035–1040. [Google Scholar] [CrossRef]
- Nagao, T.; Ijuin, H.; Yamada, T.; Nagasawa, K.; Zhou, L. COVID-19 Disruption Strategy for Redesigning Global Supply Chain Network across TPP Countries. Logistics 2021, 6, 2. [Google Scholar] [CrossRef]
- OECD. Available online: https://www.oecd.org/coronavirus/policy-responses/conectando-empresas-y-consumidores-durante-covid-19-trade-in-parcels-d18de131/ (accessed on 14 April 2022).
- Brandtner, P.; Darbanian, F.; Falatouri, T.; Udokwu, C. Impact of COVID-19 on the Customer End of Retail Supply Chains: A Big Data Analysis of Consumer Satisfaction. Sustainability 2021, 13, 1464. [Google Scholar] [CrossRef]
- Jin, D.-H.; Kim, H.-J. Integrated Understanding of Big Data, Big Data Analysis, and Business Intelligence: A Case Study of Logistics. Sustainability 2018, 10, 3778. [Google Scholar] [CrossRef]
- Li, D.; Wang, X. Dynamic Supply Chain Decisions Based on Networked Sensor Data: An Application in the Chilled Food Retail Chain. Int. J. Prod. Res. 2017, 55, 5127–5141. [Google Scholar] [CrossRef]
- Iglesias-Sánchez, P.P.; Jambrino-Maldonado, C.; de Las Heras-Pedrosa, C.; Frías Villegas, N.; Olivares-Delgado, F. Brand’s Communications in COVID-19. Social Role during and after Lockdown. Cogent Soc. Sci. 2022, 8, 2053271. [Google Scholar] [CrossRef]
- Semrush-Online Marketing Can Be Easy. Available online: https://www.semrush.com/ (accessed on 21 March 2022).
- SEO Glossary|Semrush. Available online: https://www.semrush.com/kb/925-glossary (accessed on 18 March 2022).
- What Is Organic Traffic? Definition-Omniconvert. Available online: https://www.omniconvert.com/what-is/organic-traffic/ (accessed on 18 May 2021).
- Bagdasarova, I. What Is Branded Traffic and How to Increase It. Available online: https://www.promodo.com/blog/branded-traffic-why-its-crucial-for-ecommerce-and-how-to-increase-it/ (accessed on 18 May 2021).
- Burby, J.; Brown, A. WAA Standards Committee Web Analytics Definitions, Version 4.0; Web Analytics Association: Washington, DC, USA, 2007. [Google Scholar]
- World Top Courier Companies by Market Value as on 2020. Available online: https://www.value.today/world-top-companies/courier?title=&field_headquarters_of_company_target_id&field_company_category_primary_target_id&field_market_value_jan_2020_value_1=&page=0 (accessed on 18 May 2021).
- Global Shipping & Logistics Services|UPS-United States. Available online: https://www.ups.com/us/en/Home.page (accessed on 21 March 2022).
- Royal Mail|Royal Mail Group Ltd. Available online: https://www.royalmail.com/ (accessed on 21 March 2022).
- The New FedEx.Com-Tracking, Shipping & Locations. Available online: https://www.fedex.com/en-us/home.html (accessed on 21 March 2022).
- Global Logistics-International Shipping |DHL Home|. Available online: https://www.dhl.com/us-en/home.html (accessed on 21 March 2022).
- Track & Trace. Available online: https://www.sf-express.com/cn/en/dynamic_function/waybill/ (accessed on 21 March 2022).
- Ceylan, R.; Özbay, Y. Comparison of FCM, PCA and WT Techniques for Classification ECG Arrhythmias Using Artificial Neural Network. Expert Syst. Appl. 2007, 33, 286–295. [Google Scholar] [CrossRef]
- Terzi, M.C.; Sakas, D.P.; Vlachos, D. Marketing Dynamic Simulation Modelling in High Tech Laboratories. Key Eng. Mater. 2011, 495, 23–27. [Google Scholar] [CrossRef]
- Dimitrios, N.K.; Sakas, D.P.; Vlachos, D.S. The Contribution of Dynamic Simulation Model of Depiction of Knowledge, in the Leading Process of High Technology Companies. Key Eng. Mater. 2013, 543, 406–409. [Google Scholar] [CrossRef]
- Dimitrios, N.K.; Sakas, D.P.; Vlachos, D.S. Analysis of Strategic Leadership Simulation Models in Non-Profit Organizations. Procedia-Soc. Behav. Sci. 2013, 73, 276–284. [Google Scholar] [CrossRef][Green Version]
- Dimitrios, N.K.; Sakas, D.P.; Vlachos, D.S. Modeling the Scientific Dimension of Academic Conferences. Procedia-Soc. Behav. Sci. 2014, 147, 576–585. [Google Scholar] [CrossRef][Green Version]
- Sakas, D.P.; Vlachos, D.S.; Nasiopoulos, D.K. Modeling the Development of the Online Conference’s Services. Libr. Rev. 2016, 65, 160–184. [Google Scholar] [CrossRef]
- Sakas, D.P.; Konstantopoulos, N.; Triantafyllopoulos, Y.; Simos, T.E.; Maroulis, G. Contribution of the Executives in Bank Sector Mergers: Application with a Simulation Model. In Proceedings of the AIP Conference Proceedings, Corfu, Greece, 25–30 September 2007; Volume 963, pp. 1054–1057. [Google Scholar]
- Reiner, G. Customer-Oriented Improvement and Evaluation of Supply Chain Processes Supported by Simulation Models. Int. J. Prod. Econ. 2005, 96, 381–395. [Google Scholar] [CrossRef]
- Georgiadis, P.; Vlachos, D.; Iakovou, E. A System Dynamics Modeling Framework for the Strategic Supply Chain Management of Food Chains. J. Food Eng. 2005, 70, 351–364. [Google Scholar] [CrossRef]
- Pitty, S.S.; Li, W.; Adhitya, A.; Srinivasan, R.; Karimi, I.A. Decision Support for Integrated Refinery Supply Chains. Comput. Chem. Eng. 2008, 32, 2767–2786. [Google Scholar] [CrossRef]
- Adhitya, A.; Srinivasan, R.; Karimi, I.A. Supply Chain Risk Management through HAZOP and Dynamic Simulation. In Computer Aided Chemical Engineering; Elsevier: Amsterdam, The Netherlands, 2008; Volume 25, pp. 37–42. ISBN 978-0-444-53227-5. [Google Scholar]
- Mielczarek, B.; Uziałko-Mydlikowska, J. Application of Computer Simulation Modeling in the Health Care Sector: A Survey. Simulation 2012, 88, 197–216. [Google Scholar] [CrossRef]
- Johnson, O.A.; Hall, P.S.; Hulme, C. NETIMIS: Dynamic Simulation of Health Economics Outcomes Using Big Data. PharmacoEconomics 2016, 34, 107–114. [Google Scholar] [CrossRef] [PubMed]
- Sarlis, A.S.; Drivas, I.C.; Sakas, D.P. Implementation and Dynamic Simulation Modeling of Search Engine Optimization Processes. Improvement of Website Ranking. In Strategic Innovative Marketing; Kavoura, A., Sakas, D.P., Tomaras, P., Eds.; Springer Proceedings in Business and Economics; Springer International Publishing: Cham, Switzerland, 2017; pp. 437–443. ISBN 978-3-319-56287-2. [Google Scholar]
- Oghazi, P.; Karlsson, S.; Hellström, D.; Mostaghel, R.; Sattari, S. From Mars to Venus: Alteration of Trust and Reputation in Online Shopping. J. Innov. Knowl. 2021, 6, 197–202. [Google Scholar] [CrossRef]
- Sakas, D.; Vlachos, D.; Nasiopoulos, D. Modelling Strategic Management for the Development of Competitive Advantage, Based on Technology. J. Syst. Inf. Technol. 2014, 16, 187–209. [Google Scholar] [CrossRef]
- Videira, N.; Antunes, P.; Santos, R. Engaging Stakeholders in Environmental and Sustainability Decisions with Participatory System Dynamics Modeling. In Environmental Modeling with Stakeholders; Gray, S., Paolisso, M., Jordan, R., Gray, S., Eds.; Springer International Publishing: Cham, Switzerland, 2017; pp. 241–265. ISBN 978-3-319-25051-9. [Google Scholar]
- Lie, H.; Rich, K.M.; Burkart, S. Participatory System Dynamics Modelling for Dairy Value Chain Development in Nicaragua. Dev. Pract. 2017, 27, 785–800. [Google Scholar] [CrossRef]
- Ali, B. Impact of COVID-19 on Consumer Buying Behavior toward Online Shopping in Iraq. J. Econ. Stud. 2020, 18, 267–280. [Google Scholar]
- Sajid, S.; Rashid, R.M.; Haider, W. Changing Trends of Consumers’ Online Buying Behavior During COVID-19 Pandemic With Moderating Role of Payment Mode and Gender. Front. Psychol. 2022, 13, 919334. [Google Scholar] [CrossRef]
- European Commission New Consumer Survey Shows Impact of COVID-19 and Popularity of ‘greener’ Choices. Available online: https://ec.europa.eu/commission/presscorner/detail/en/ip_21_1104 (accessed on 16 October 2022).
- Liew, P.S.; Liew, W.N.; Lim, C.S.; Lin, J.Y.; Qonitah, S.I. The Impact of COVID-19 Pandemic on Consumer Behavior: J&T Express Courier Services in Malaysia and Indonesia. Asia Pac. J. Manag. Educ. (APJME) 2022, 5, 65–78. [Google Scholar] [CrossRef]
- Gruenwald, H. Parcel Delivery Services Boom during COVID-19. 2020. Available online: https://www.researchgate.net/profile/Hermann-Gruenwald/publication/343674544_Parcel_Delivery_Services_boom_during_Covid-19/links/5f37d517458515b7292288b3/Parcel-Delivery-Services-boom-during-Covid-19.pdf (accessed on 15 July 2022).
- Izzah, N.; Dilaila, F.; Yao, L. The Growth of Reliance towards Courier Services through E-Business Verified during COVID-19: Malaysia. J. Phys. Conf. Ser. 2021, 1874, 012041. [Google Scholar] [CrossRef]
- Sułkowski, Ł.; Kolasińska-Morawska, K.; Brzozowska, M.; Morawski, P.; Schroeder, T. Last Mile Logistics Innovations in the Courier-Express-Parcel Sector Due to the COVID-19 Pandemic. Sustainability 2022, 14, 8207. [Google Scholar] [CrossRef]
- Guthrie, C.; Fosso-Wamba, S.; Arnaud, J.B. Online Consumer Resilience during a Pandemic: An Exploratory Study of e-Commerce Behavior before, during and after a COVID-19 Lockdown. J. Retail. Consum. Serv. 2021, 61, 102570. [Google Scholar] [CrossRef]
- Ejdys, J.; Gulc, A. Trust in Courier Services and Its Antecedents as a Determinant of Perceived Service Quality and Future Intention to Use Courier Service. Sustainability 2020, 12, 9088. [Google Scholar] [CrossRef]
- Rajendran, S.; Harper, A. Simulation-Based Algorithm for Determining Best Package Delivery Alternatives under Three Criteria: Time, Cost and Sustainability. Transp. Res. Interdiscip. Perspect. 2021, 12, 100484. [Google Scholar] [CrossRef]
- Dewi, H.E.; Aprilia, A.; Hardana, A.E.; Pariasa, I.I.; Sofianti, D.Y.; Prasetyaningrum, D.I. The Impact of Product Familiarity on the Purchase Decisions of Fruits and Vegetables during COVID-19 Pandemic. IOP Conf. Ser. Earth Environ. Sci. 2021, 733, 012060. [Google Scholar] [CrossRef]
- Samad, N.S.A.; Mohamad, S.W.; Muhamad, S.F.; Shaari, N.F.; Rahmat, R. Customer Satisfaction of Pos Laju Malaysia Service During Pandemic COVID-19. In Financial Technology (FinTech), Entrepreneurship, and Business Development; Alareeni, B., Hamdan, A., Eds.; Lecture Notes in Networks and Systems; Springer International Publishing: Cham, Switzerland, 2022; Volume 486, pp. 427–438. ISBN 978-3-031-08086-9. [Google Scholar]
- Maftuchach, V.; Kusnuranti, A.L. The Effect Of Brand Image On Customer Satisfaction Through Quality Of Courier Services During The COVID-19 Pandemic In Indonesia (SAP Express Depok Case Study). Int. J. Soc. Manag. Stud. 2021, 2, 29–39. [Google Scholar] [CrossRef]
- Jun, S.-H. The Effects of Perceived Risk, Brand Credibility and Past Experience on Purchase Intention in the Airbnb Context. Sustainability 2020, 12, 5212. [Google Scholar] [CrossRef]
- Rahmi, S.; Ilyas, G.B.; Tamsah, H.; Munir, A.R. Perceived Risk and Its Role in the Influence of Brand Awareness on Purchase Intention: Study of Shopee Users. J. Siasat Bisnis 2022, 26, 97–109. [Google Scholar] [CrossRef]
- Chi, H. The Impact of Brand Awareness on Consumer Purchase Intention: The Mediating Effect of Perceived Quality and Brand Loyalty. J. Int. Manag. Stud. 2009, 4, 135–144. [Google Scholar]
- Rokicki, T.; Bórawski, P.; Bełdycka-Bórawska, A.; Szeberényi, A.; Perkowska, A. Changes in Logistics Activities in Poland as a Result of the COVID-19 Pandemic. Sustainability 2022, 14, 10303. [Google Scholar] [CrossRef]
- Salim, A.; Dinidiastri, D.I.; An, C.; Affiat, M.R. Effect of Punctuality of Delivery of Goods and Quality of Courier Services on Satisfaction of Customer at JNE Express in the COVID-19 Pandemic. Adv. Transp. Logist. Res. 2021, 4, 924–934. [Google Scholar] [CrossRef]
- Hermann, J.W.; Lin, E.; Pundoor, G. Supply Chain Simulation Modeling Using the Supply Chain Operations Reference Model. In Proceedings of the Volume 1: 23rd Computers and Information in Engineering Conference, Parts A and B, Chicago, IL, USA, 1 January 2003; American Society of Mechanical Engineer: New York, NY, USA; pp. 461–469. [Google Scholar]
- Cope, D.; Fayez, M.S.; Mollaghasemi, M.; Kaylani, A. Supply Chain Simulation Modeling Made Easy: An Innovative Approach. In Proceedings of the 2007 Winter Simulation Conference, Washington, DC, USA, 9–12 December 2007; pp. 1887–1896. [Google Scholar]
- WHO Coronavirus (COVID-19) Dashboard|WHO Coronavirus (COVID-19) Dashboard With Vaccination Data. Available online: https://covid19.who.int/ (accessed on 18 May 2021).
- Kirk, C.P.; Rifkin, L.S. I’ll Trade You Diamonds for Toilet Paper: Consumer Reacting, Coping and Adapting Behaviors in the COVID-19 Pandemic. J. Bus. Res. 2020, 117, 124–131. [Google Scholar] [CrossRef] [PubMed]
- Clements, J.M. Knowledge and Behaviors Toward COVID-19 Among US Residents During the Early Days of the Pandemic: Cross-Sectional Online Questionnaire. JMIR Public Health Surveill. 2020, 6, e19161. [Google Scholar] [CrossRef] [PubMed]
- Lawu, B.J.L. Pengaruh Elemen Brand Knowledge Dan Brand Equity Terhadap Repurchase Intention. J. Manaj. Maranatha 2015, 14. [Google Scholar]
- Statista Package Delivery Methods Worldwide 2021. Available online: https://www.statista.com/statistics/722366/package-delivery-methods-among-millennials-worldwide/ (accessed on 19 October 2022).
- Egozi, L.; Reiss-Hevlin, N.; Dallasheh, R.; Pardo, A. Couriers’ Safety and Health Risks before and during the COVID-19 Pandemic. Int. Arch. Occup. Env. Health 2022, 95, 589–598. [Google Scholar] [CrossRef]
- Rim, S.-C.; Jung, M.-C. Evaluation of Workloads of Package Deliverers Focusing on Their Pickup and Delivery Tasks in Republic of Korea. Sustainability 2022, 14, 5229. [Google Scholar] [CrossRef]
- Miller, L.M.S.; Gee, P.M.; Katz, R.A. The Importance of Understanding COVID-19: The Role of Knowledge in Promoting Adherence to Protective Behaviors. Front. Public Health 2021, 9, 581497. [Google Scholar] [CrossRef]


Publisher’s Note: MDPI stays neutral with regard to jurisdictional claims in published maps and institutional affiliations. |
© 2022 by the authors. Licensee MDPI, Basel, Switzerland. This article is an open access article distributed under the terms and conditions of the Creative Commons Attribution (CC BY) license (https://creativecommons.org/licenses/by/4.0/).