Article

Order Distribution and Routing Optimization for Takeout Delivery under Drone–Rider Joint Delivery Mode

School of Economics and Management, Yanshan University, Qinhuangdao 066004, China
*
Author to whom correspondence should be addressed.
J. Theor. Appl. Electron. Commer. Res. 2024, 19(2), 774-796; https://doi.org/10.3390/jtaer19020041
Submission received: 20 February 2024 / Revised: 29 March 2024 / Accepted: 2 April 2024 / Published: 3 April 2024
(This article belongs to the Section e-Commerce Analytics)

Abstract

:
Order distribution and routing optimization of takeout delivery is a challenging research topic in the field of e-commerce. In this paper, we propose a drone–rider joint delivery mode with multi-distribution center collaboration for the problems of limited-service range, unreasonable distribution, high delivery cost, and tight time windows in the takeout delivery process. The model is constructed with the minimum delivery cost and the overall maximum customer satisfaction as the objective function, and a two-stage heuristic algorithm is designed to solve the model. In the first stage, Euclidean distance is used to classify customers into the regions belonging to different distribution centers, and the affinity propagation (AP) clustering algorithm is applied to allocate orders from different distribution centers. The second stage uses an improved tabu search algorithm for route optimization based on specifying the number of rider and drone calls. This paper takes China’s Ele.me and Meituan takeout as the reference object and uses the Solomon data set for research. The experimental results show that compared with the traditional rider delivery mode, the drone–rider joint delivery mode with multiple distribution center collaboration can effectively reduce the number of riders used, lower the delivery cost, and improve the overall customer satisfaction.

1. Introduction

Takeout delivery consists of the basic functions of traditional e-commerce and the value-added functions of delivery services, corresponding to online contracting and offline fulfillment, respectively. As a third-party platform between catering sellers and consumers, takeout delivery platforms provide both parties with network business premises, transaction aggregation, and information dissemination services through the Internet and other information networks. The platform brings together various types of restaurants, fresh food supermarkets, and drug stores so that customers can place orders at any time, providing a convenient shopping channel. In recent years, with the development of Internet technology and the accelerated pace of urban life, more and more people tend to consume online, making the takeout industry develop rapidly. However, the expansion of user scale does not necessarily mean high profits. Firstly, the location of merchants and delivery cost constraints limit the range that delivery services can cover. Secondly, the delivery process has problems [1] such as a high number of riders and low per capita delivery volume, which leads to low delivery efficiency, low customer satisfaction, high cost, and the inability to significantly improve profits. To overcome the above problems and meet customers’ expectations for rapid order arrival, platforms are continuously improving their delivery technologies and exploring drone delivery scenarios. For example, Meituan drone delivery is exploring the construction of an urban low altitude delivery network. By the end of August 2023, Meituan drones had planned 17 drone routes in Shenzhen and Shanghai in China, with a total of more than 184,000 orders. Many large online retailers, such as Amazon and Alibaba [2],are researching how to use drones for parcel delivery. Compared with rider delivery, the drone delivery speed is faster, and the transportation cost is lower. It can easily avoid the traditional roads, effectively meeting the customer’s demand for faster and more convenient food delivery service. Therefore, the use of drones and riders for the joint delivery of takeout has become a highly promising solution.
According to research, the shorter the average daily delivery distance of riders, the higher the delivery efficiency [3,4]. Considering the problems of tight customer time windows and large numbers of orders during peak hours, it is a considerable challenge to realize the collaboration between different distribution centers and seek an order distribution and route optimization scheme with low delivery cost and high customer satisfaction. This paper proposes a drone–rider joint takeout delivery mode in multiple distribution centers, which aims to reduce the number of riders, lower the delivery cost, and improve customer satisfaction. A two-stage heuristic algorithm is designed to achieve order allocation and routing optimization. The Solomon dataset is processed using Ele.me and Meituan Takeout in China as reference objects. The effectiveness of the model is verified by comparing it against the traditional rider delivery model.
Section 2 presents the related literature. Section 3 deals with the model construction. Section 4 deals with the algorithm design. Section 5 deals with the simulation experiments, including the comparison of the experimental results and the comparative analysis of the algorithms. Finally, in Section 6, the paper is concluded and possible extensions are discussed.

2. Literature Review

2.1. Order Distribution Intended Freight Distribution in an Urban Area

Order distribution is an important part of business operations that directly affects efficiency, customer satisfaction, and profits. Firdausiyah et al. [5] research modelled the behavior of freight carriers and an urban consolidation center (UCC) operator using multi-agent simulation-adaptive dynamic programming based reinforcement learning (MAS-ADP based RL) to evaluate a joint delivery system in an uncertain environment. Ortiz-Astorquiza et al. [6] present a modeling framework with two integer linear programming formulations. Jiang et al. [7] to solve the problems of improper order allocation and the lack of a carbon emission constraint system in the road freight transportation industry, established an order allocation optimization model with carbon tax constraints. Azad et al. [8] developed a mixed-integer nonlinear programming model and solved it using a suggested genetic algorithm (GA). Taillard [9] proposed a linearithmic (n log n) randomized method based on a partial optimization metaheuristic under special intensification conditions. B. Yu et al. [10] proposed a novel mathematical formulation for combined order selection and a periodic vehicle routing problem with time windows for perishable products, and they designed a branch-and-price algorithm base on a set-partitioning model to solve this problem. Battaglia et al. [11] presents a descriptive model that has been specified, calibrated, and validated. Abdollahi et al. [12] proposed a partially time-windowed dynamic routing approach. Zhen et al. [13] studied a heterogeneous delivery order scheduling problem and developed a column generation model and heuristic solution procedure to solve the problem. Diabat et al. [14] studied the zero-inventory-ordering (ZIO) replenishment strategy for the IRP and developed branch-and-cut algorithms to solve it.

2.2. Takeout Delivery

The takeout delivery problem is essentially a pick-up and delivery vehicle routing problem with a time window (PDVRPTW) [15]. The issue of pickup and delivery was first raised by Psarafis [16] in 1980, and Dumas [17] added the concept of time windows. At present, there are many studies [18] in the existing literature on the problem of pick-up and delivery vehicle routing with time windows. Some authors have proposed accurate solution methods for PDVRPTW, and common solution methods include tabu search [19,20], genetic algorithm [21,22], simulated annealing [23,24], ant colony algorithm [25,26,27], and other intelligent algorithms. In addition, some new algorithms have been used to solve this problem. Wen et al. [28] proposing a novel meta-heuristic optimization algorithm called colony search optimization algorithm (CSOA). Yan et al. [29] designed a hybrid metaheuristic algorithm of discrete particle swarm optimization (DPSO) and Harris hawks optimization (HHO). Lu et al. [30] studied a hybrid beetle swarm optimization algorithm (HBSO). Different scholars have studied the original problem from different angles. Lu et al. [31] designed an ant colony system–improved grey wolf optimization (ACS–IGWO) to solve it. Zhou et al. [32] studied a two-level vehicle distribution mode based on a time window and simultaneous pick-up, and they designed a variable neighborhood tabu search algorithm to solve it. Song W et al. [33] established a vehicle delivery problem model considering the delivery time window and variable service time for the delivery problem in community group buying. Wu et al. [27] proposed an ant colony optimization algorithm with a destroy and restoration strategy to solve the problem.
With the development of the takeout delivery industry, the takeout delivery route problem has the characteristics of pick-up and delivery, strong dynamics, and a large scale compared with PDVRPTW. Some researchers have paid more attention to the constraints of time windows; for instance, Schyns, M [34] considered the importance of responsiveness—that is completing delivery as quickly as possible within the customer time window—based on ant colony algorithms and added strategies to adapt to the responsiveness framework to solve the problem. Sun et al. [35] re-established a dynamic vehicle route planning model for pick-up and delivery according to the impact of four dynamic events on vehicle route planning and distribution services, and they designed a dynamic algorithm framework to solve it. Cui et al. [36] proposed a vehicle routing problem model considering two types of customer time windows under time-dependent road networks, and they designed a memetic algorithm combined with genetic algorithm and variable neighborhood search to solve the problem. Bi et al. [37] proposed an improved ant lion optimizer (IALO) to solve the problem. Tang et al. [38] proposed the one-to-many distribution mode and realized the new distribution mode through a two-stage multi- objective optimization algorithm.
In order to bring the research closer to reality, many scholars have studied the dynamics of takeout orders: Kuo et al. [39] studied the route problem under dynamic orders to maximize the amount of customer service and minimize the average customer waiting time to establish a model. Liu et al. [40] studied the real-time routes of drone meal pickup and delivery in the dynamic environment of random orders, and they proposed a MIP-based heuristic algorithm to solve it. Ulmer et al. [41] proposed an anticipatory customer allocation strategy for dynamic orders, which made order allocation more flexible. Gmira. M et al. [20] considered the problem of adjusting in real-time a time-dependent delivery plan to respond to dynamic changes in travel times. Fan et al. [42] comprehensively considered the constraints of customer order time, merchant meal preparation time, rider waiting time, and customer service time to establish an optimization model, and they adopted the method of periodic optimization to dynamically adjust the delivery route according to the rider and order status changes in different stages.
There are also scholars who have studied the problem from other angles; for instance, Zhao et al. [43] proposed the drone–rider joint takeout delivery model. The spatiotemporal distance measurement method was introduced, the routing optimization model was established with the goal of minimizing the cost of meal delivery, and a two-stage heuristic algorithm was designed to solve it. Li et al. [44] studied a remote takeout order splitting strategy based on transit stations, established a mixed integer programming model for the takeout delivery route problem, and solved it using an adaptive large neighborhood search algorithm.

2.3. Drone Delivery

Compared to vehicle delivery, delivery by drone can be faster, offers lower transportation costs, and can easily avoid traditional roads; however, they are limited by their battery life [45,46], distance, and parcel size [47]. Therefore, most of the studies use a model combining trucks and drone delivery to overcome the weaknesses of vehicles and drones. Wang et al. [48] studied the use of trucks, truck–drone combined transportation, and drone systems to build a more effective truck–drone logistics and delivery system. Felix et al. [49] considered the use of truck and drone joint delivery to complete the logistics of last-mile delivery, and they proposed a new mixed integer linear programming model. Kuo et al. [50] constructed a mixed integer programming model considering the customer time window for the optimization of truck and drone joint delivery routes, and they proposed a simple and effective variable neighborhood search algorithm as a solver. Salama et al. [51] studied the problem of coordinating one truck and multiple heterogeneous drones for last-mile parcel delivery. A hybrid integer linear programming model was established to minimize the delivery completion time, and a two-stage search algorithm with enhanced optimization of hybrid simulated annealing and variable neighborhood search was designed. Mulumba and Diabat [52] studied a last-mile pickup and delivery problem with truck-–drone synchronization, and they proposed a novel heuristic solution approach based on the classic Clarke–Wright savings heuristic. The articles are summarized in Table 1.
In summary, with the deepening of takeout delivery as well as drone research, drone–rider joint delivery is beginning to be proposed, but there are fewer studies, so the routing optimization study of drone–rider joint delivery is yet to be deepened. Considering the impact of rider delivery distance on delivery efficiency, this paper proposes a drone–rider joint delivery mode with collaboration between multiple distribution centers. The routing optimization model is constructed with minimum delivery cost and maximum customer satisfaction as the objective function, and a two-stage heuristic algorithm is designed to solve the problem. In the first stage, Euclidean distance is used to divide customers into the regions belonging to different distribution centers, and AP clustering algorithm is used to allocate orders in the regions of different distribution centers. In the second stage, the appropriate numbers of riders and drones are called, and an improved tabu search algorithm is designed for routing optimization. In numerical experiments and analyses, we take China’s Ele.me and Meituan takeout as reference objects and process the Solomon dataset.

3. Problem Description and Model Establishment

3.1. Problem Description

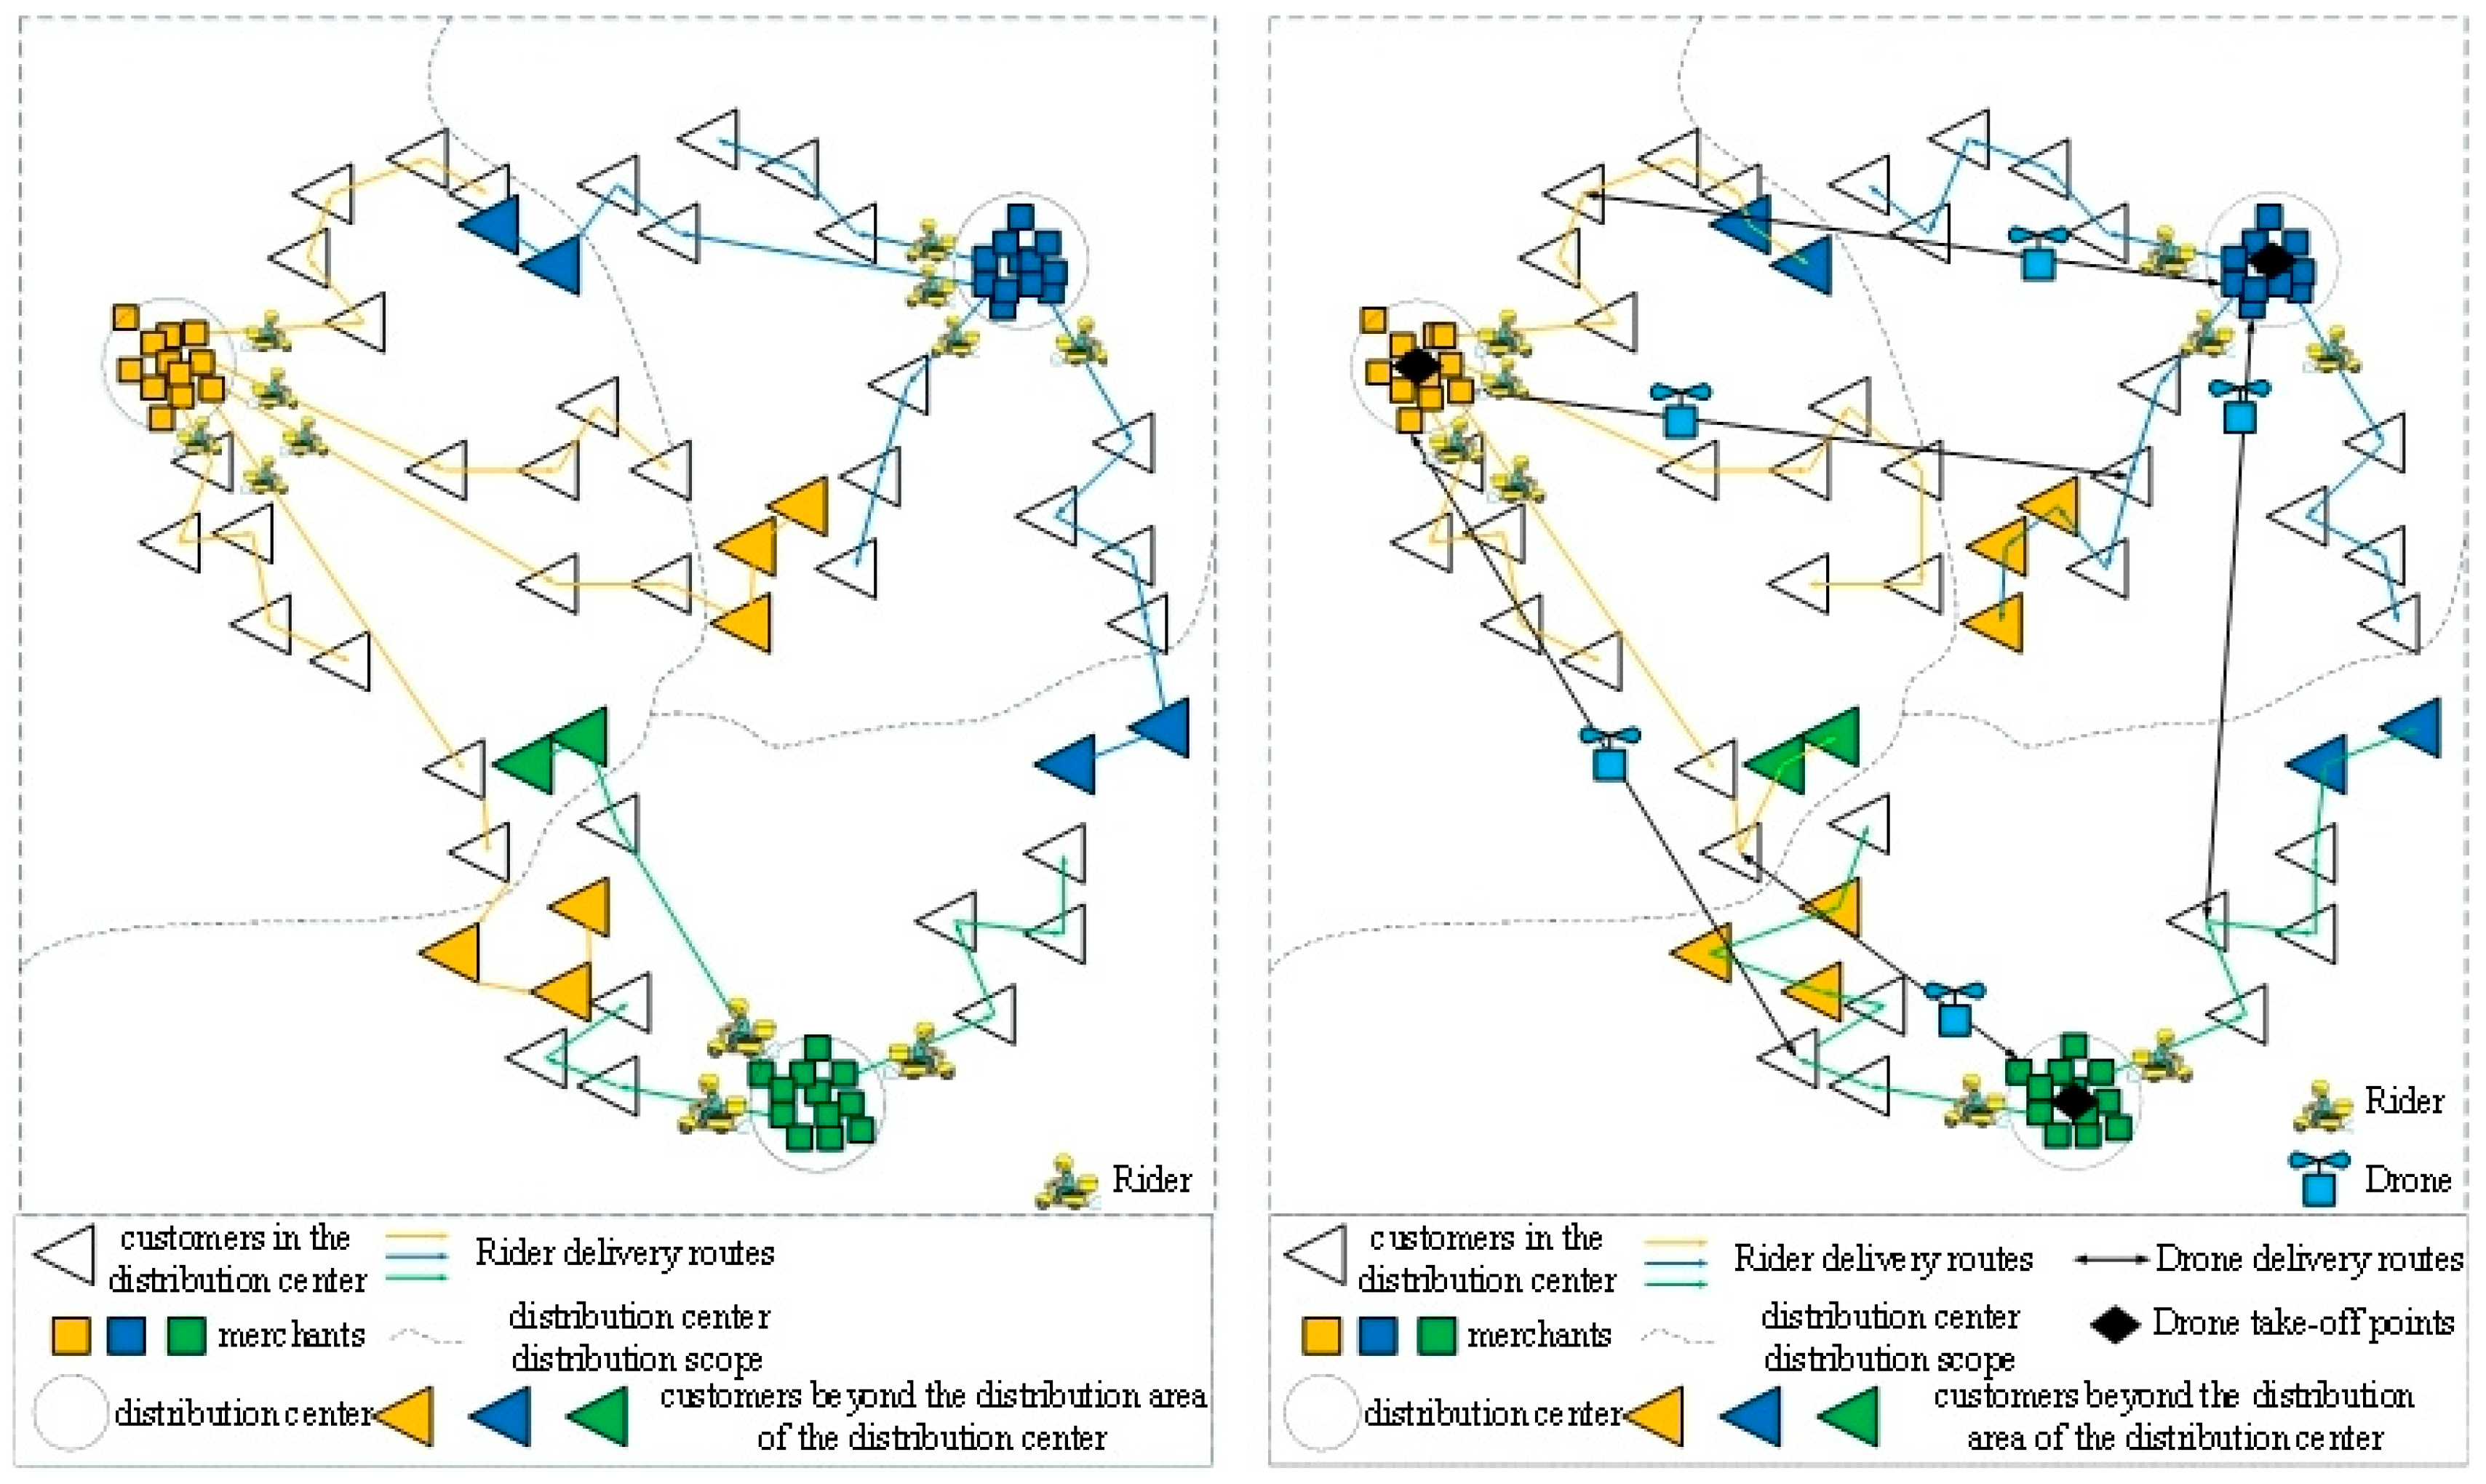
We take China’s Ele.me and Meituan takeout as reference objects. There are multiple merchant aggregation points in a city, and different merchants in a merchant aggregation point can be approximated as distribution centers due to their close proximity to each other. Considering that the delivery efficiency of the riders is affected by the average daily delivery distance, the Euclidean distance is used to group the orders into the regions belonging to different distribution centers, to shorten the delivery distance of the riders so that the riders only turnover and deliver in the same region. For orders where the customer location of the order exceeds the delivery range of the distribution center, the drones in the distribution center are used to pick up the meal from the corresponding merchant of the order and deliver it to the rider in the corresponding region; finally, the rider completes the process of delivering the meal to the customer, as shown in Figure 1. The traditional rider delivery mode and the drone–rider joint delivery mode studied in this paper can be visualized in Figure 2.

3.2. Assumptions

(1)
Rider delivery capacity is the same and there is no constraint on the maximum mileage traveled, regardless of the electric vehicle’s range. There is a certain service time for the rider to pick up and deliver the goods, and the time is set to a fixed value.
(2)
A one-to-one correspondence is assumed between merchant points and customer points. Multiple customers placing orders with the same merchant are set to multiple merchant points with the same coordinates. If the same customer places orders with multiple merchants, it will be set as multiple customer points with the same coordinates.
(3)
Electric vehicles and drones travel at a constant speed.
(4)
In the delivery process, the weather, accidents, and other circumstances are not considered, and the delivery can be carried out normally.

3.3. Model Establishment

3.3.1. Model Notation Definition

The symbols used in the model are shown in Table 2.

3.3.2. Customer Satisfaction Function

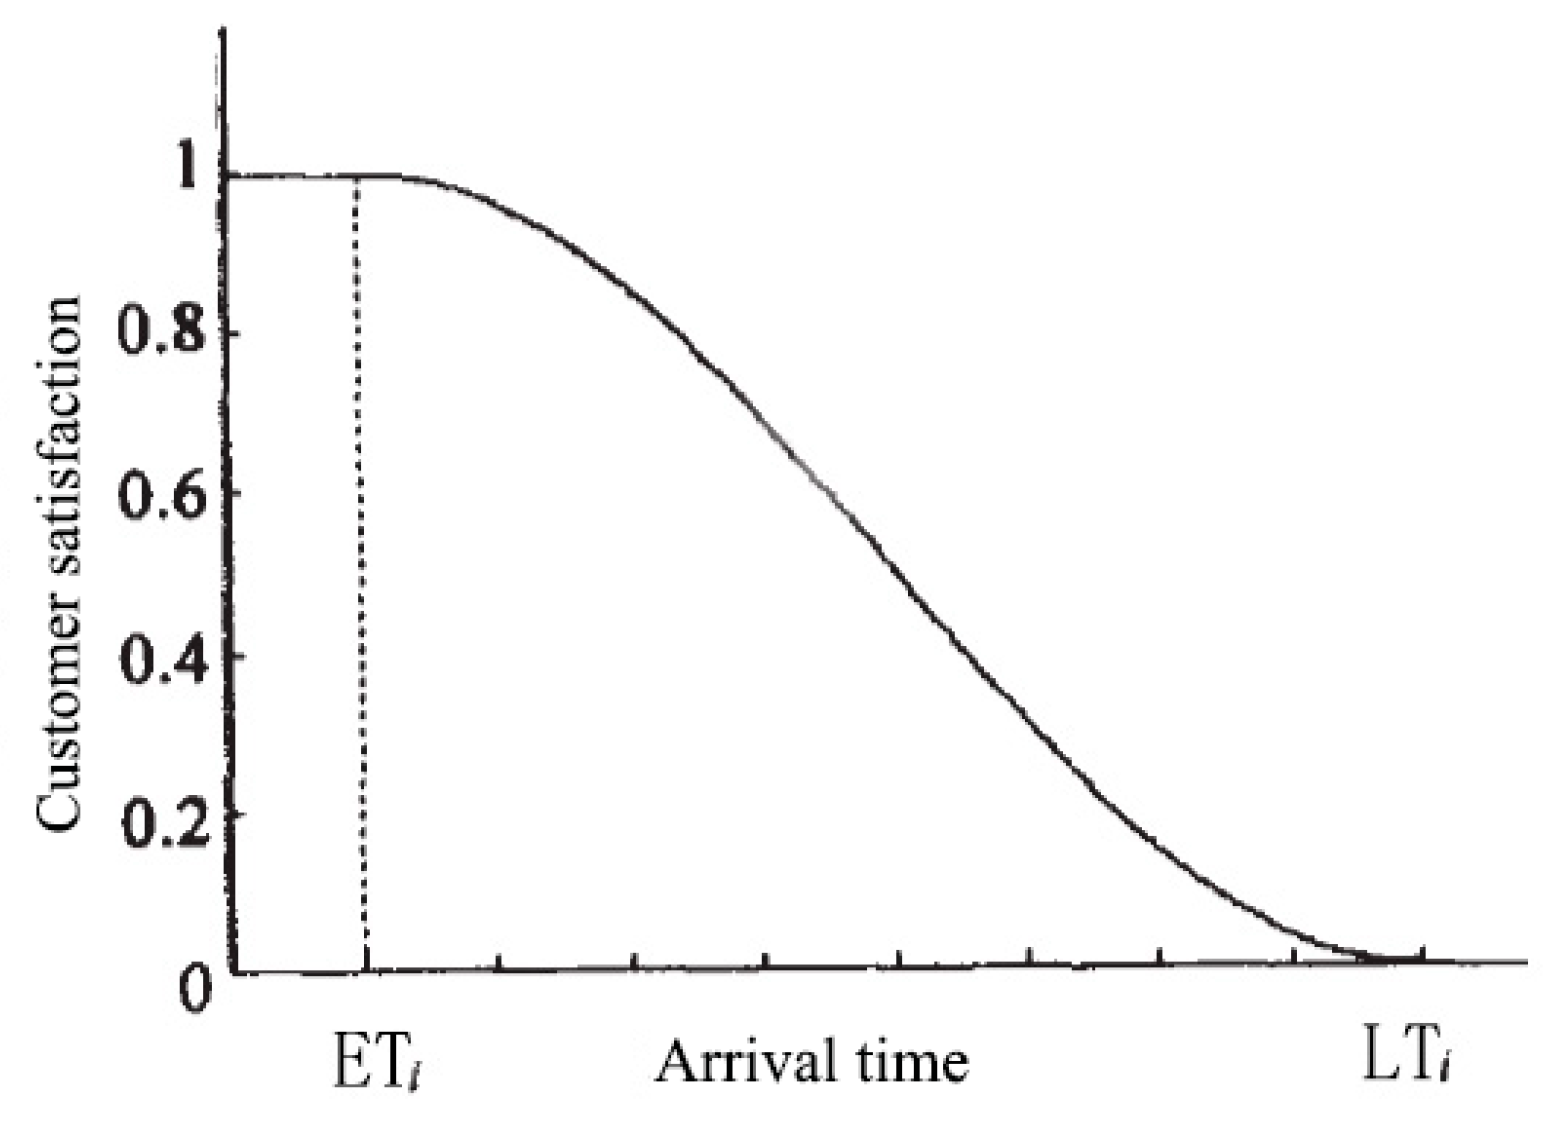
Customer satisfaction mainly depends on the delivery time of takeout; riders need to try to deliver takeouts to the corresponding customers within the specified time. If the takeout delivery time exceeds the expected time, customer satisfaction will decline. There are many functions for portraying satisfaction; this paper uses the cosine distribution time satisfaction function to characterize customer satisfaction, as shown in Figure 3.
Customer i satisfaction si calculation formula is as follows:
s i = 1 i f   t i k m < E T i 1 2 + 1 2 cos ( π L T i E T i ( t i k m L T i + E T 2 ) + π 2 ) i f   E T i t i k m L T i 0 i f   t i k m > L T
The time tikm for rider K to reach node i can be expressed by the time taken for the rider to reach the previous node plus the service time of the rider in the previous node and the travel time from the previous node to the current node; the calculation formula of tikm is as follows:
d i j = | x i x j | + | y i y j |
t i k m = t i k m 1 + d i j / v p + t s

3.3.3. Drone Energy Consumption

The symbols used in the model are shown in Table 3.
When the drone returns to its take-off point after the meal delivery, it is in the no-load state [53]. The energy consumption formula in the horizontal state of the drone at this time is
f 1 = ( m t + m b ) g μ 3600 ϑ v η d i j a , i G , j O
The process of the drone picking up and delivering the meal to the drone stop is in the state of load. The energy consumption formula in the horizontal state of the drone at this time is
f 2 = ( m t + m b + q a m ) g μ 3600 ϑ v η d i j a , i O , j G , a A , m J a
Therefore, the total energy consumption of the drone is
f = i O j G a = 1 A m J a ( f 1 + f 2 )

3.3.4. Multi-Objective Optimization Model

Objective function:
min Z 1 = i V j V k = 1 K c p 2 d i j x i j k + 2 i O j G a = 1 A c u 2 d i j a x i j a + k c p 1 + a c u 1 + c f
max Z 2 = i I s i
The objective function (7) indicates that the minimum meal delivery cost is the sum of the total travel cost of the rider and the drone, the fixed use cost of the rider and drone, and the cost of replacing the battery each time the drone returns to the take-off point. The objective function (8) indicates that the overall customer satisfaction is maximal.
In order to better solve the problem, this paper converts multi-objective processing into single-objective processing, and it uses the staged penalty function to convert customer satisfaction into penalty cost, which is expressed as follows:
p i = 0 i f   s i = 1 ω 1 * ( t i k m E T i ) i f   0 < s i < 1 ω 1 * ( L T i E T i ) + ω 2 * ( t i k m L T i ) i f   s i = 0
When customer satisfaction si = 1, rider k arrives at customer i within customer i’s time window; there is no penalty cost. Furthermore, 0 < si < 1 indicates that the rider exceeds the expected delivery time ETi, but does not exceed customer i’s latest acceptable arrival time LTi, and a penalty cost emerges; ω1 is the unit time penalty cost for this stage. si = 0 indicates that the arrival time exceeds the latest acceptable time LTi, and the penalty cost increases sharply; ω2 is the unit time penalty cost for this stage, where ω2 > ω1 > 0.
Adding the penalty cost to the objective function (7) proceeds as follows:
min Z = i V j V k = 1 K c p 2 d i j x i j k + 2 i O j G a = 1 A c u 2 d i j a x i j a + k c p 1 + a c u 1 + c f + i I p i
Constraints:
k = 1 K j V x i j a = 1 , i V
k = 1 K i V x i j k = 1 , j V
a = 1 A j J a x i j a = 1 , i J a
a = 1 A i J a x i j a = 1 , j J a
i V x i z k j V x z j k = 0 , z V , k K
i V j V q i k x i j k W max k , k K
i J a j J a q i a x i j a W max u , a A
i S j S x i j k | S | 1 , S V , k K
r i j t i k r i j t j k , i J k , j I
r i j t i a r i j t m a r i j t j k , i J a , m G , j I
( m t + m b + q a m ) g μ 3600 ϑ v η d i j a + ( m t + m b ) g μ 3600 ϑ v η d i j a Q max a / μ , i O , j G
Constraints (11) and (12) indicate that a customer point or merchant point is only visited by one rider. Constraints (13) and (14) indicate that a merchant point is only visited by one drone. Constraint (15) indicates that the rider’s route starts and ends continuously. Constraint (16) indicates that the rider cannot deliver more meals than its maximum capacity. Constraint (17) indicates that the drone’s meal delivery volume cannot exceed its maximum capacity. Constraint (18) indicates the elimination of subcircuits in the rider’s route. Constraint (19) indicates that the rider picks up the meal before delivering it. Constraint (20) indicates that the rider picks up the meal at the drone stop before continuing the delivery. Constraint (21) indicates that the energy consumed by the drone to complete a delivery should not exceed the maximum energy storage of its battery.

4. Two-Stage Heuristic Algorithm

A two-stage heuristic algorithm is designed to solve the routing optimization problem of drone–rider joint delivery via collaboration between multiple distribution centers. In the first stage, considering the impact of rider delivery distance on delivery efficiency, Euclidean distance is used to classify customers into regions belonging to different distribution centers, and an AP clustering algorithm is applied to allocate orders within different regions. In the second stage, because the traditional tabu search algorithm is sensitive to the initial value, the global development ability is weak and we can only search for the local optimal solution. The initial routes of pickup and delivery for riders and drones are generated by the sorting method, and several neighborhood operators are designed to optimize the pickup and delivery routes of riders and drones by incorporating the idea of changing the set of neighborhood structures in variable neighborhood search algorithms to expand the search range and obtain the optimal solution.

4.1. In the First Stage: AP Clustering Algorithm

The AP (affinity propagation) clustering algorithm was proposed by [54] Frey and Dueck in 2007. The basic idea is to view the data as nodes in a network and keep modifying the number and position of clustering centers by passing messages between data points until the similarity of the whole dataset is maximized. At the same time, high clustering centers are generated and the remaining points are assigned to the corresponding clusters. Since the algorithm does not need to formulate the number of final clustered clusters, multiple executions of the algorithm give exactly the same results, and there is no requirement for symmetry of the initial similarity matrix data. The results are characterized by a small squared error, robustness, and accuracy. Therefore, the AP clustering algorithm is used for order allocation. The specific operation process is as follows:
Step 1: Enter the customer set and initialize the similarity matrix S (similarity), the attraction matrix R (responsibility), and the attribution matrix A (availability).
Step 2: Calculate the R matrix. Here, a (i, k′) represents the attribution degree value of other customer points to i customer points besides k customer points; s (i, k′) indicates the attractiveness of other customer points (except k customer points) to i customer points; and r (i, k) indicates the cumulative proof that customer point k becomes the clustering center of customer point i. The expression is as follows:
r t + 1 ( i , k ) = s ( i , k ) max k k { a t ( i , k ) + s ( i , k ) }
Step 3: Calculate the A matrix. Here, r (i′, k) represents the similarity value of customer point k as the clustering center of other customer points (except customer point i):
a t + 1 ( i , k ) = min { 0 , r t ( k , k ) + i { i , k } max { 0 , r t ( i , k ) } } , i k
a t + 1 ( k , k ) = i { i , k } max { 0 , r t ( i , k ) } } , i = k
Step 4: Update the R matrix and A matrix. To avoid oscillation, the AP algorithm introduces the damping factor λ when updating the information. The damping factor λ is a real number between 0 and 1. Thus,
r t + 1 ( i , k ) = ( 1 λ ) * r t + 1 ( i , k ) + λ * r t ( i , k )
a t + 1 ( i , k ) = ( 1 λ ) * a t + 1 ( i , k ) + λ * a t ( i , k )
Step 5: Calculate the value of E = R + A; if the maximum value of the i-th customer row is located at the k-th customer point, it means that the clustering center of customer i is at the sample k. If the value of E does not change for a long time, exit the loop; otherwise, jump to Step 2.
Step 6: End of the algorithm. Output the clustering result of the customer set and the coordinate result of the cluster center k.

4.2. In the Second Stage: Improved Tabu Search Algorithm

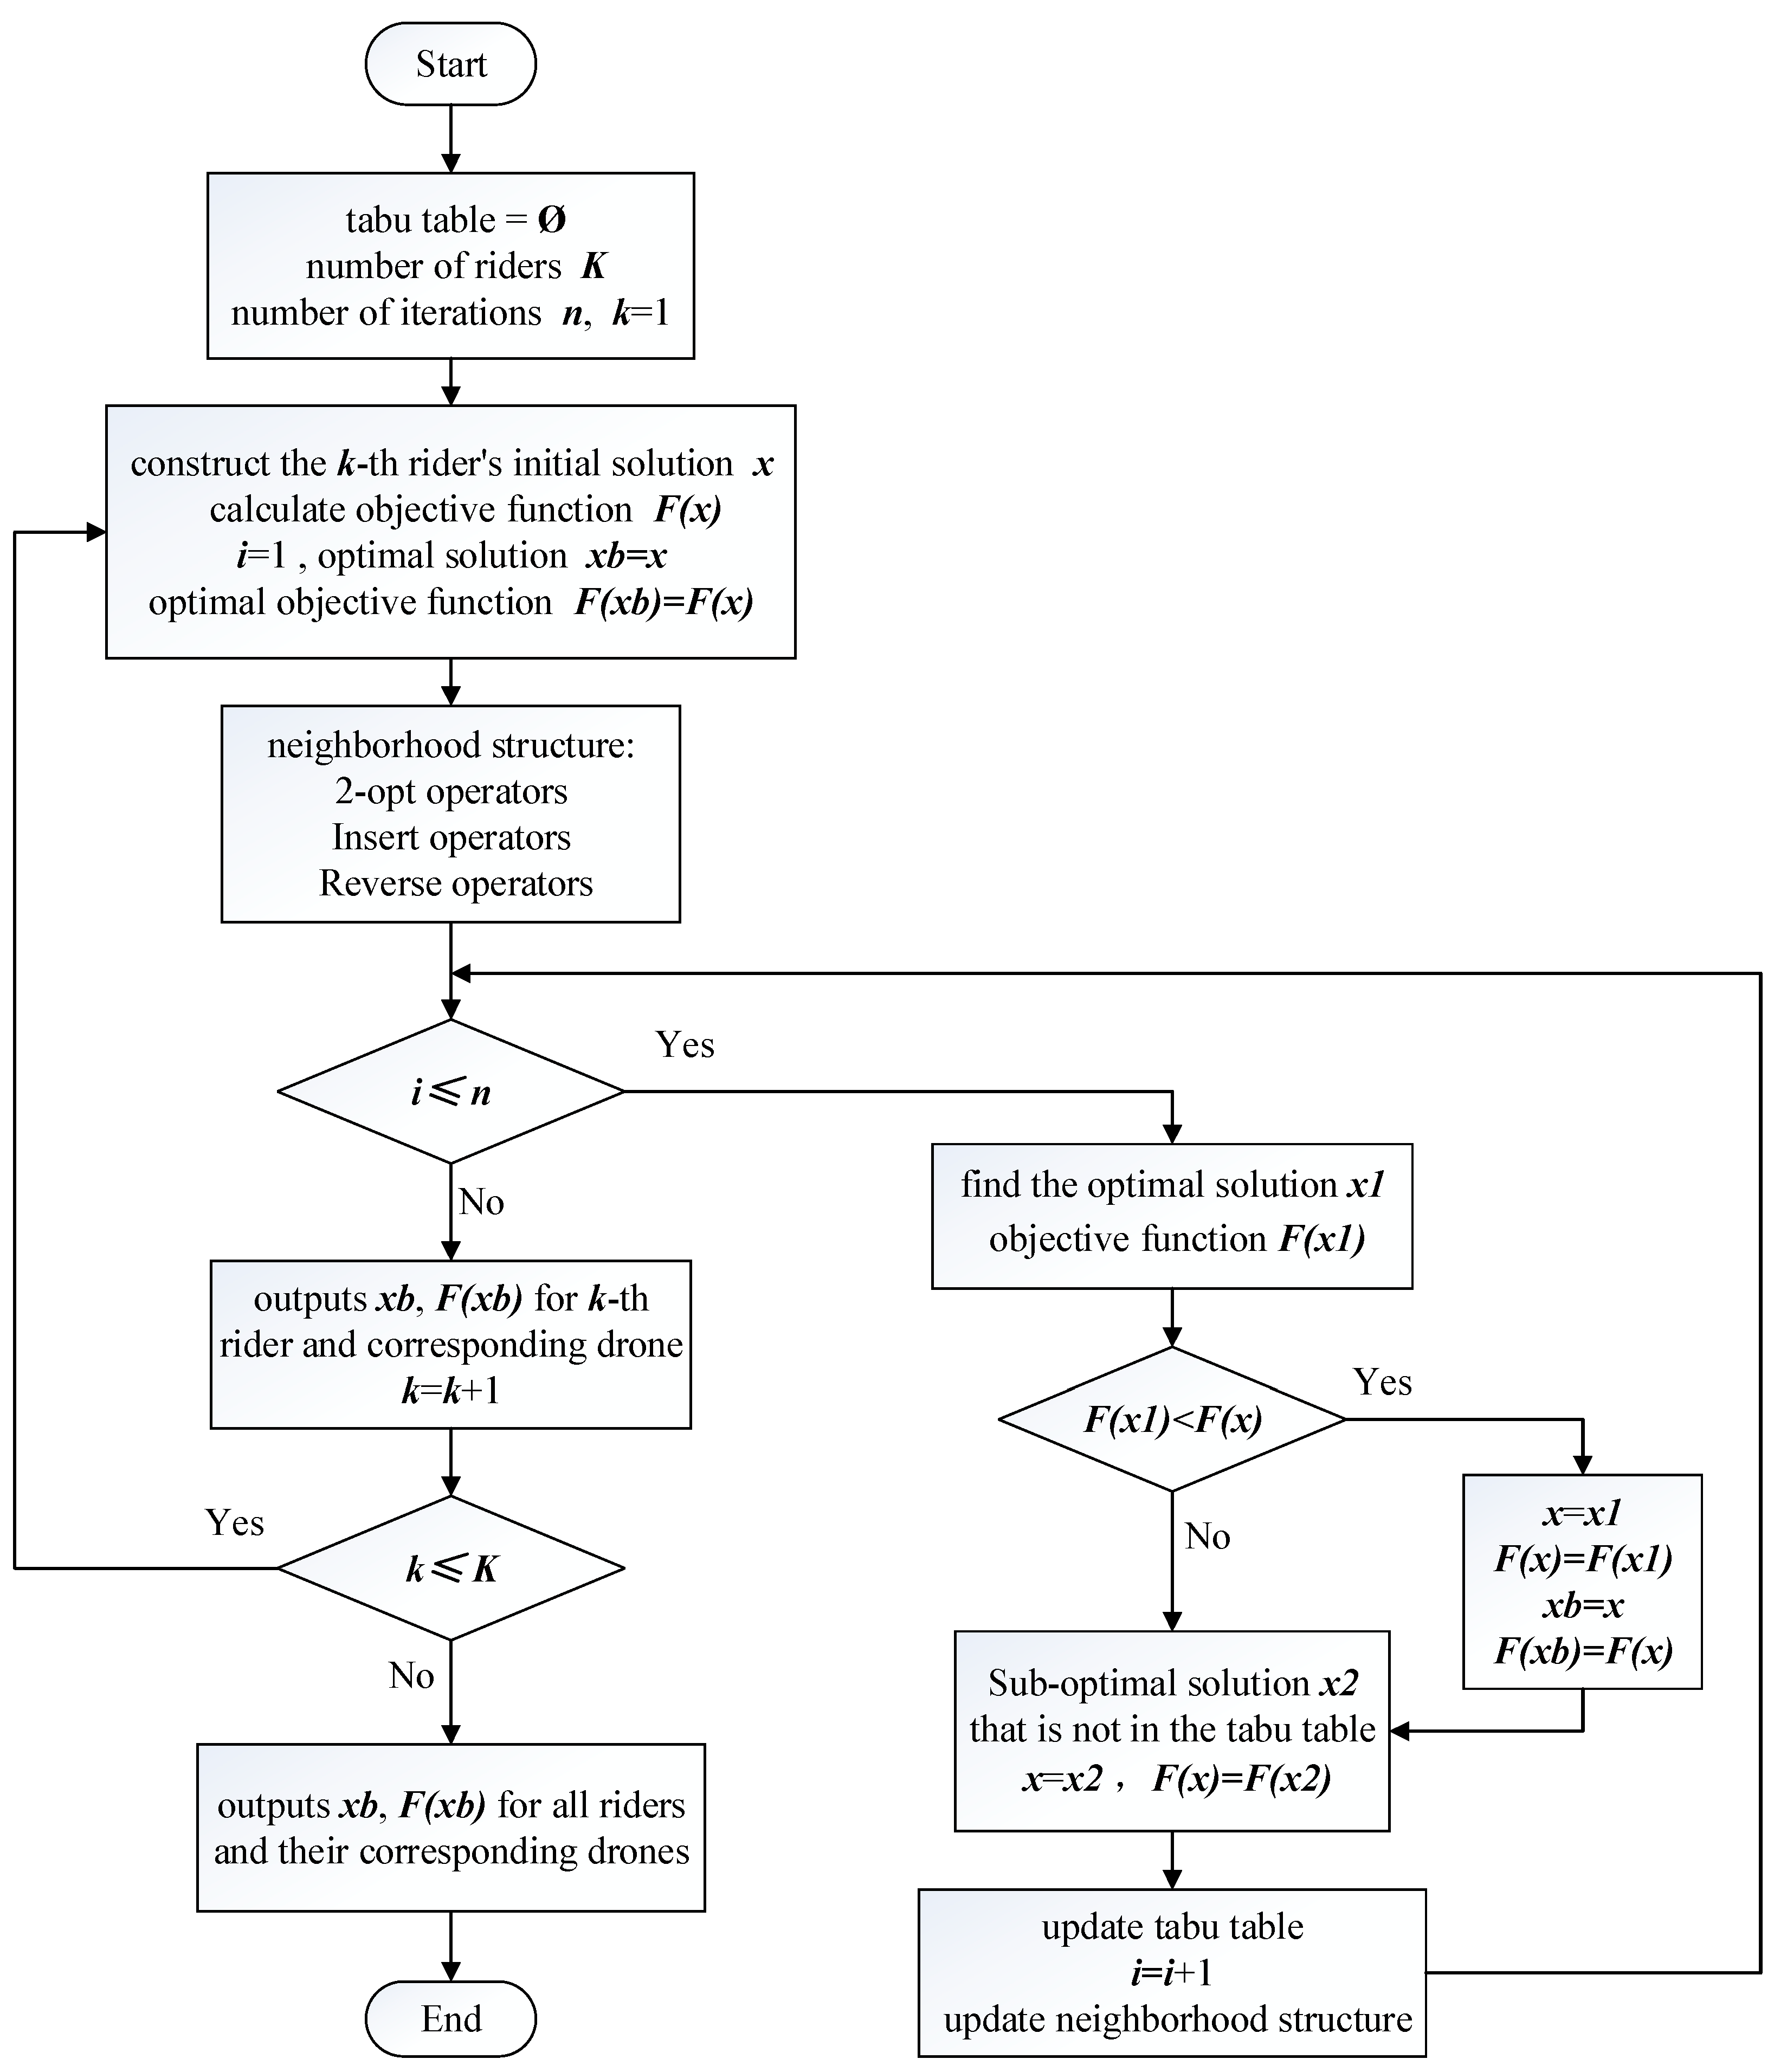
The tabu search algorithm is a meta-heuristic algorithm based on local neighborhood search. Its basic idea is to store the recent historical search process in the tabu table in the search process, to prevent the algorithm from entering repeatedly, so as to effectively prevent the cycle in the search process and obtain the optimal solution. The traditional tabu search algorithm is sensitive to the initial value; the global development ability is weak and can only search for the local optimal solution. Therefore, in this paper, for the joint delivery of riders and drones in the takeout delivery process, the traditional tabu search algorithm is improved in terms of generating the initial solution, the neighborhood structure, and the tabu length. As shown in Figure 4.
(a)
Generate initial solution
In this paper, real number encoding is used. The order of real numbers is used as the route of the rider and drone delivery order. For example, (1-4)-1-2-3-4 indicates that the rider completes picking up the meal from merchants at 1 and 4 and then delivers the meal to customers as 1, 2, 3, and 4 in turn; (2-3)-0-2-0 indicates that after picking up the meals from the merchants at 2 and 3, the drone departs from the distribution center and returns to the distribution center by delivering the meal at the handover point 2. In this paper, Euclidean distance ordering is used to generate the initial pickup and delivery routes of the rider and the drone.
(b)
Neighborhood structure
A very important component of the optimization process of the tabu search algorithm is the neighborhood structure: its role is to generate a new solution from a previous solution and increase the search range. This paper combines the idea of changing the neighborhood structure set in the variable neighborhood search algorithm, to expand the search range and obtain the optimal solution; it uses 2-opt operators, insert operators, and reverse operators to construct neighborhood structures.
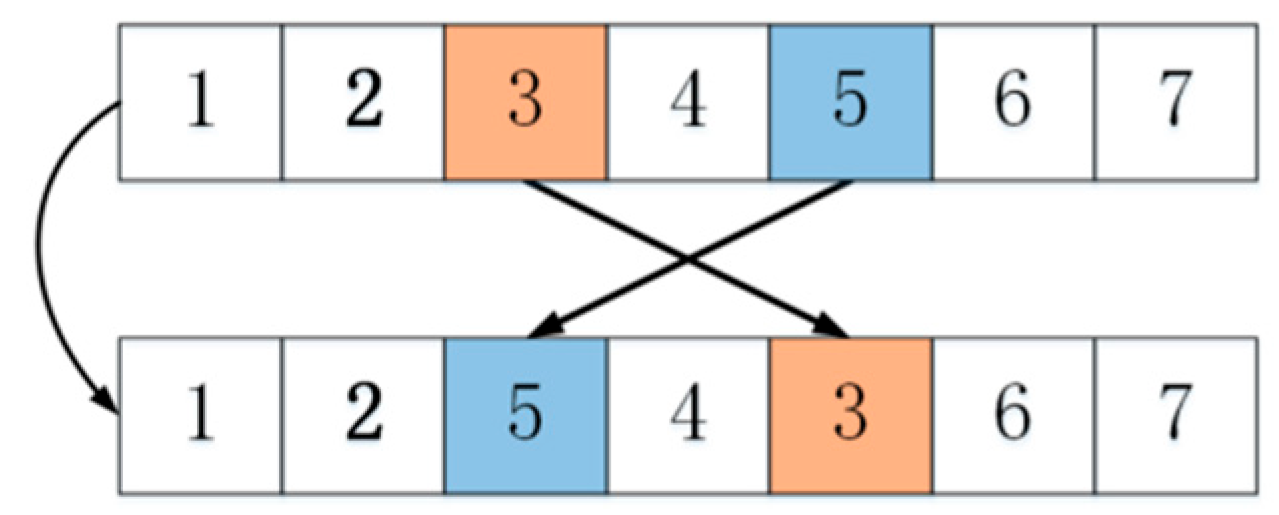
2-opt operators: swap the position of the two elements, as shown in Figure 5. The order of the numbers indicates the solution and the colors indicate the change of the solution during the update process.
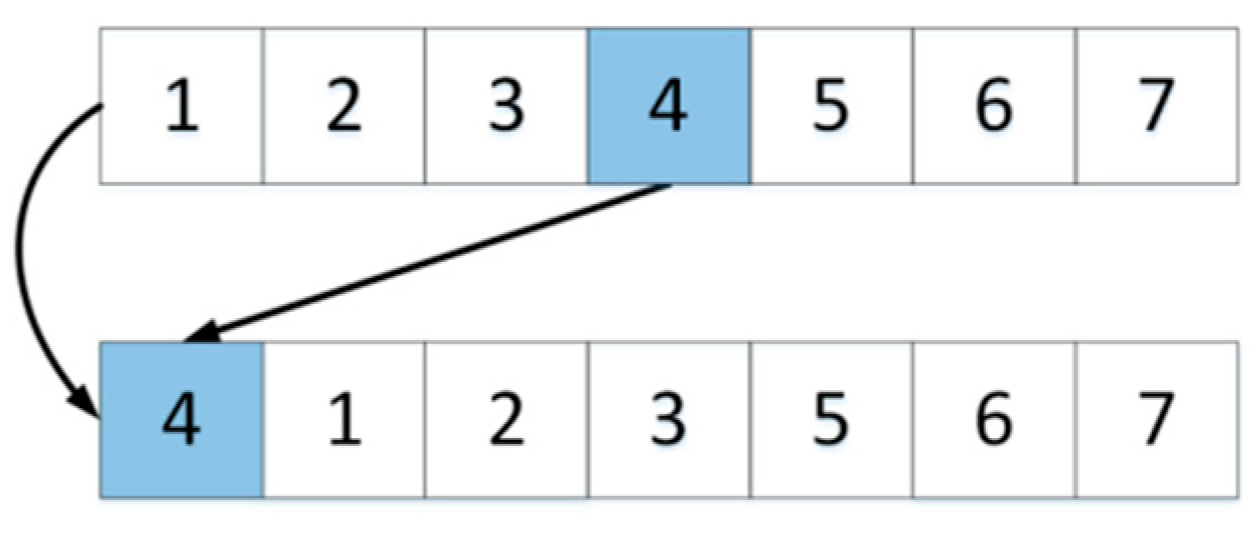
Insert operators: randomly select an element to insert at the very beginning and move the other elements back in turn, as shown in Figure 6.
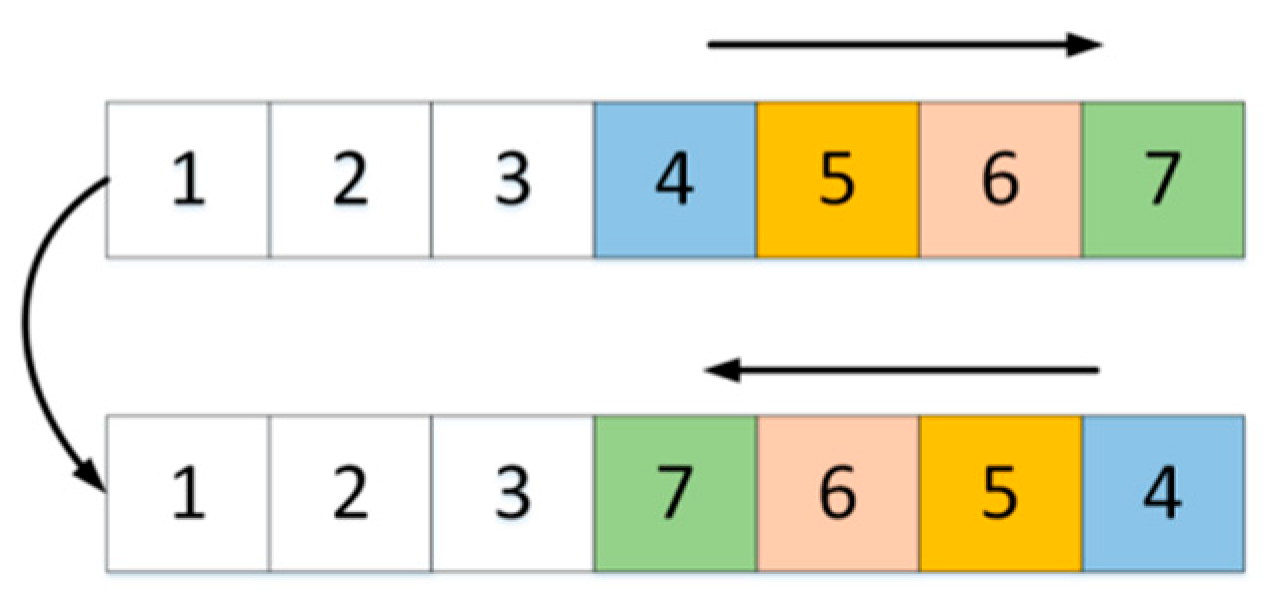
Reverse operators: flip the order of a segment randomly, as shown in Figure 7.
(c)
Length of tabu table
The tabu objects of the tabu search algorithm refer to those local optimal solutions that are tabu in the tabu table. This article puts the best solution obtained from each iteration into the tabu table as a tabu object. The shorter the tabu length, the higher the probability of obtaining an excellent solution; however, at the same time, it increases the roundabout search, and it is difficult to explore other effective search routes. In the study of this paper, the contraindication length was set to N ( N 1 ) / 2 .
(d)
Fitness function
In order to filter out the solutions that do not meet the constraints and improve the convergence speed of the algorithm, this paper processes the objective function so that the values of the solutions that do not meet the constraints are inf, so as to improve the optimization ability of the solution sets for future generations:
r i j t m k r i j t j k , m G , j J a
F ( x ) = inf i f   r i j t m k > r i j t j k Z i f   r i j t m k r i j t j k
Constraint (27) indicates that the rider must first go through the drone stop to pick up food before delivering the order carried by the drone. Constraint (28) indicates that the solution that satisfies the conditions of Constraint (27) is solved according to the objective function (10), otherwise, the value is assigned inf.
(e)
Stop guidelines
This paper adopts the number of iterations of the algorithm as the termination criterion, so the total number of iteration steps does not exceed this number, and the number of iteration steps of the algorithm in advance can effectively control the running time of the algorithm.

4.3. Two Times Clustering

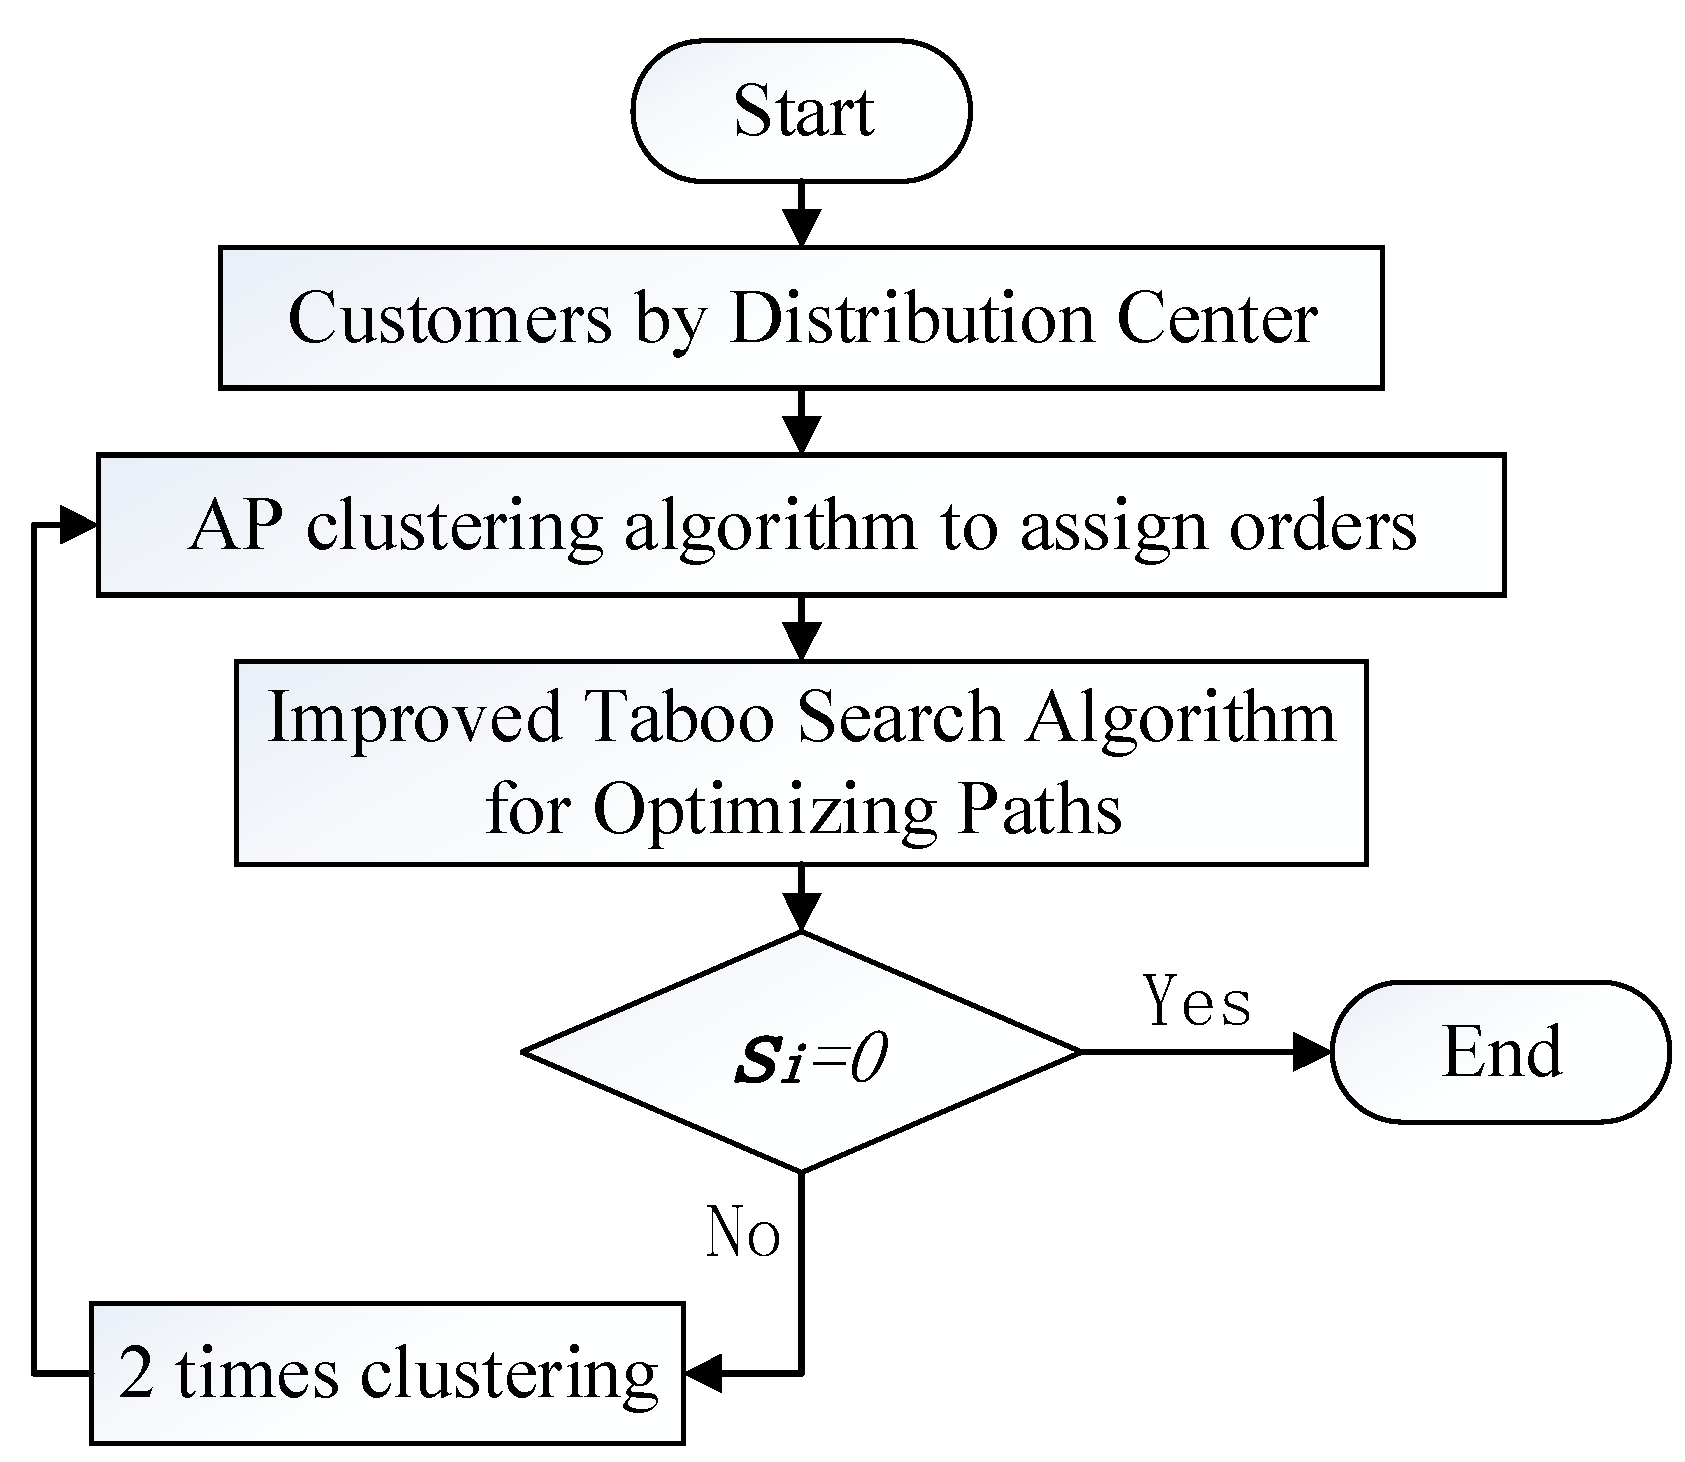
In order to improve customer satisfaction and reduce the cost of punishment, this paper makes a judgment on customer satisfaction in the result after obtaining the optimal route formed by the 1-time clustering result. If customer satisfaction si = 0 because of the delivery of the order of the rider at this time, there is an unreasonable phenomenon of order allocation, and the rider’s order requires 2-times clustering. The two-stage heuristic algorithm flowchart is shown in Figure 8.

5. Simulation Experiment and Result Analysis

5.1. Data Sources and Experimental Settings

The paper takes China’s Ele.me and Meituan takeout as a reference objects; according to the existing literature and the survey data, the average daily order delivery distance [3,4] of merchants is about 1.5 km, and the average daily order delivery time is about 31.6 min. In this paper, the Solomon dataset is processed with three distribution centers, and five sets of calculations with order quantities of 50, 75, 100, 125, and 150 are used as instances for the calculations. The algorithm programming adopts MATLAB R2020a, the operating system is Windows 10, the computer memory is 8 GB, and the CPU is Intel(R) Core (TM) i5-8250U. The main frequency is 1.80 GHz. The experimental parameter settings are shown in Table 4.

5.2. Comparison of Experimental Results

5.2.1. Comparison of the Two Modes

This paper selects the instance R1(50) to make a specific explanation of the experimental solution process. The coordinates of the drone take-off point are shown in Table 5, and the orders information of R1(50) is shown in Table 6.
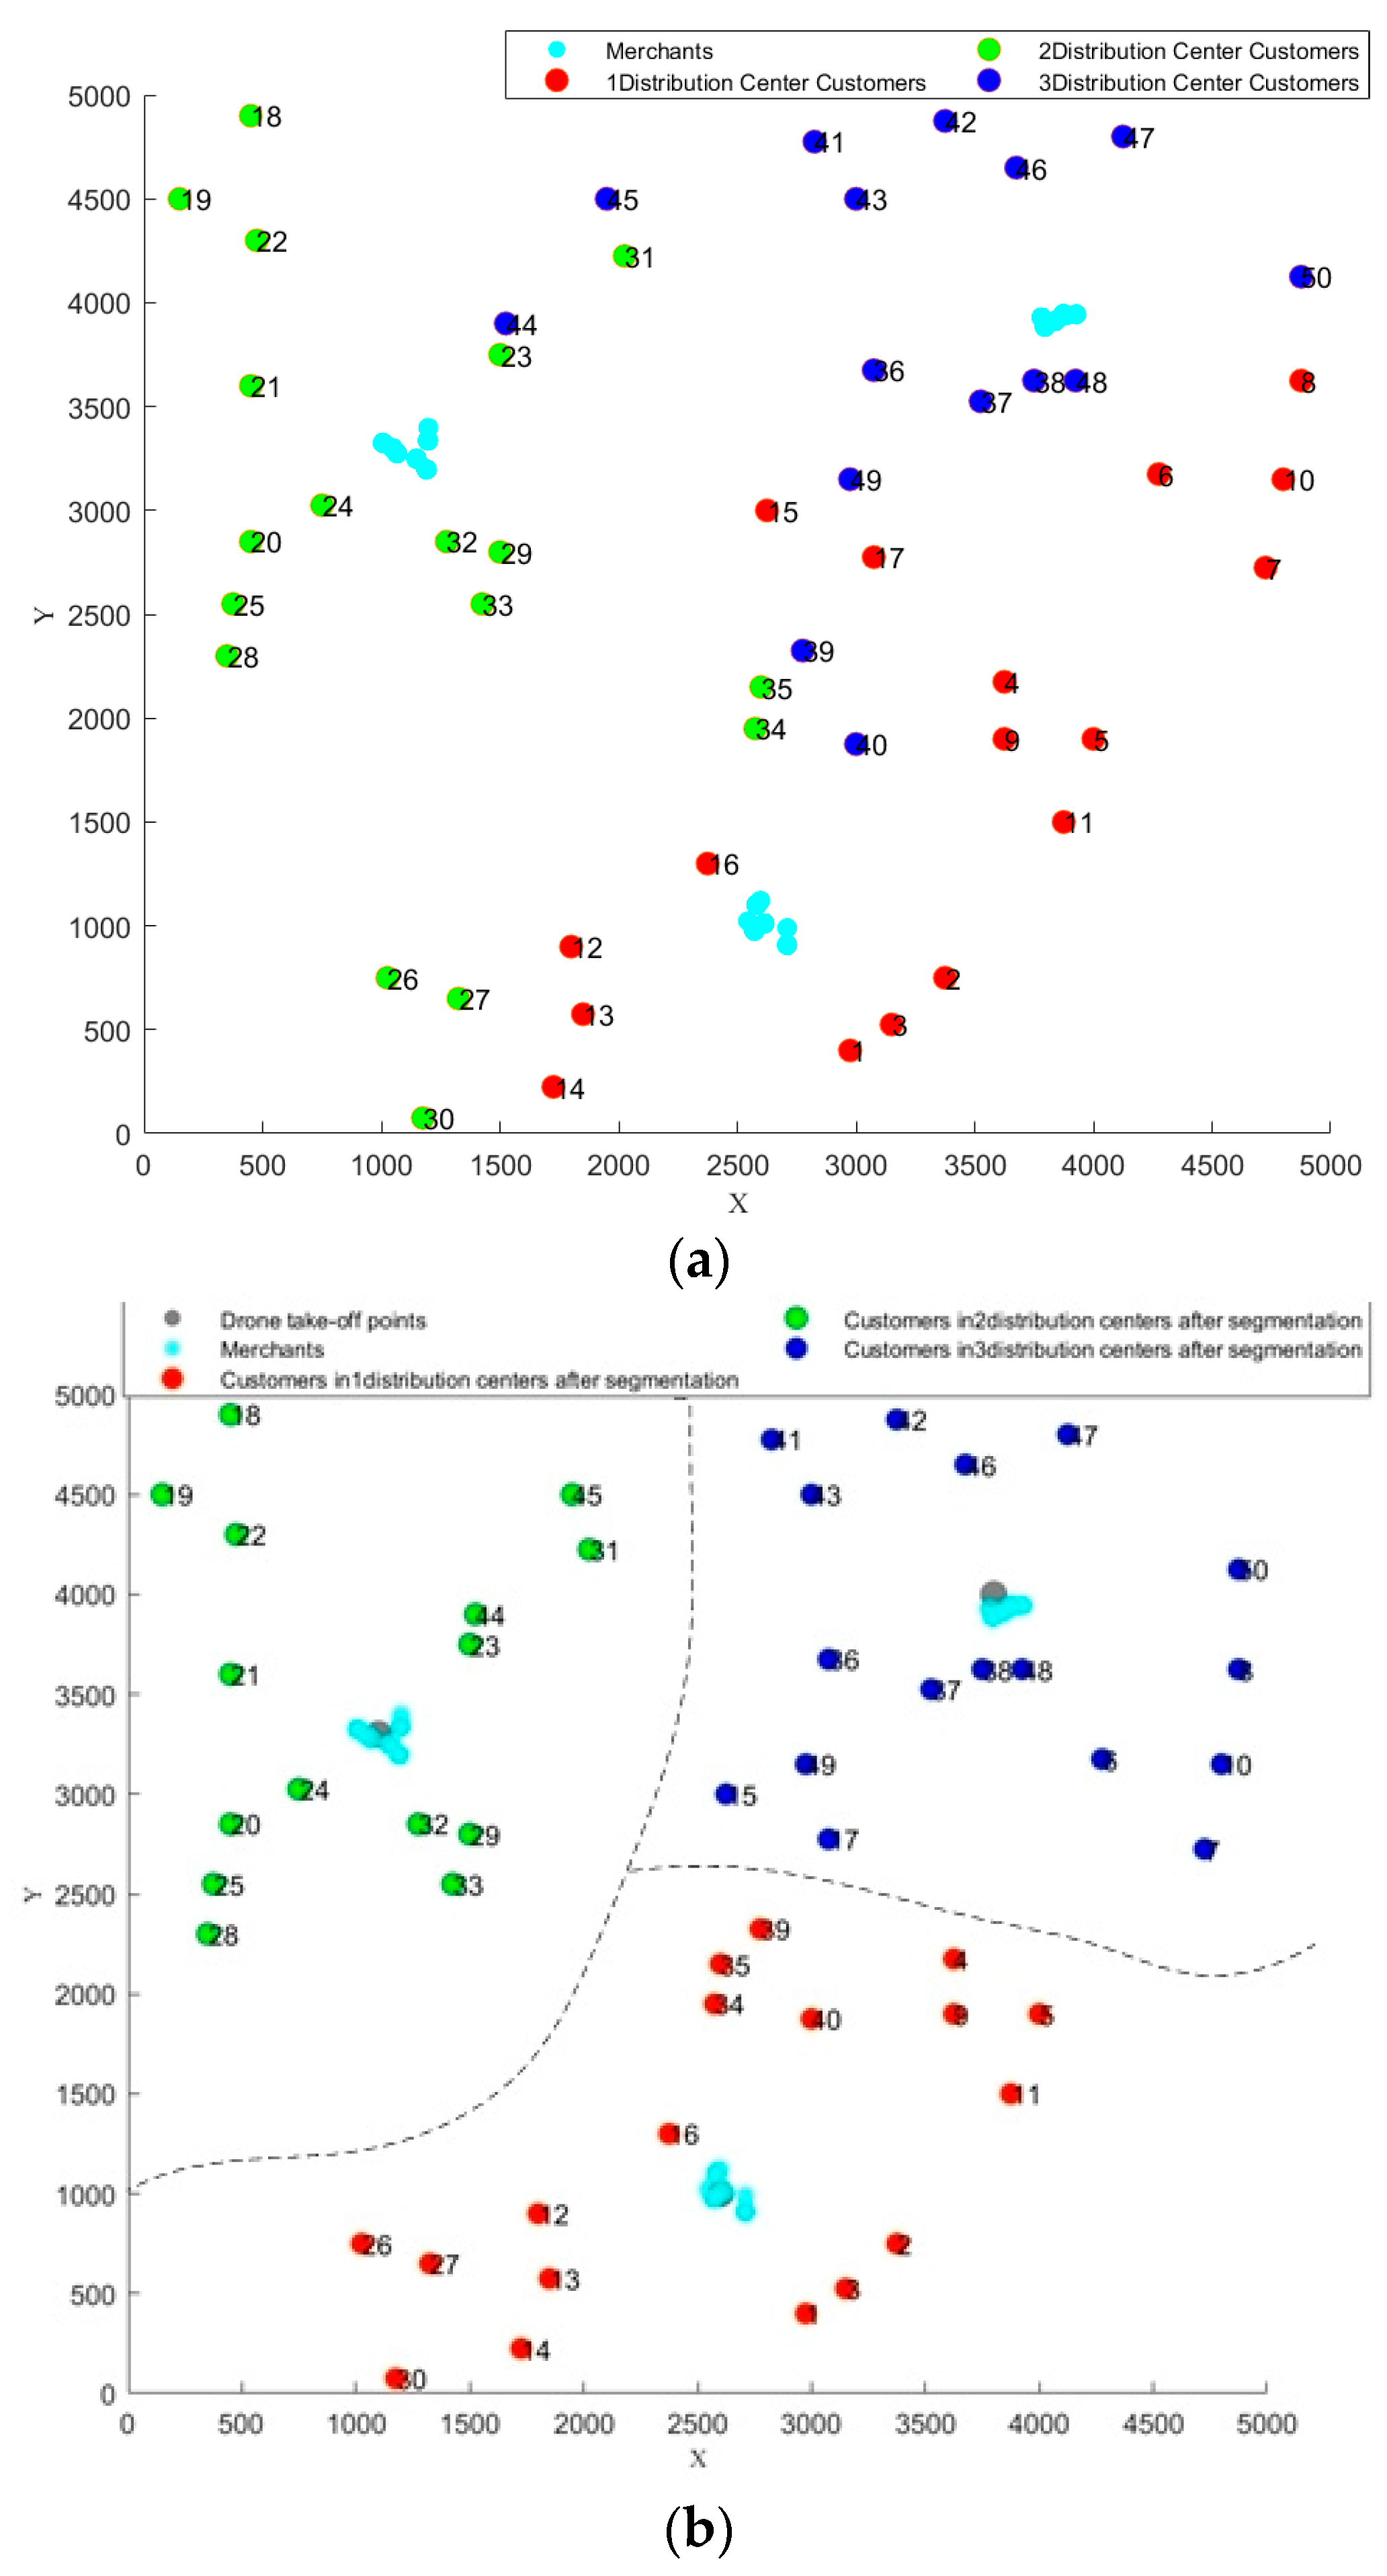
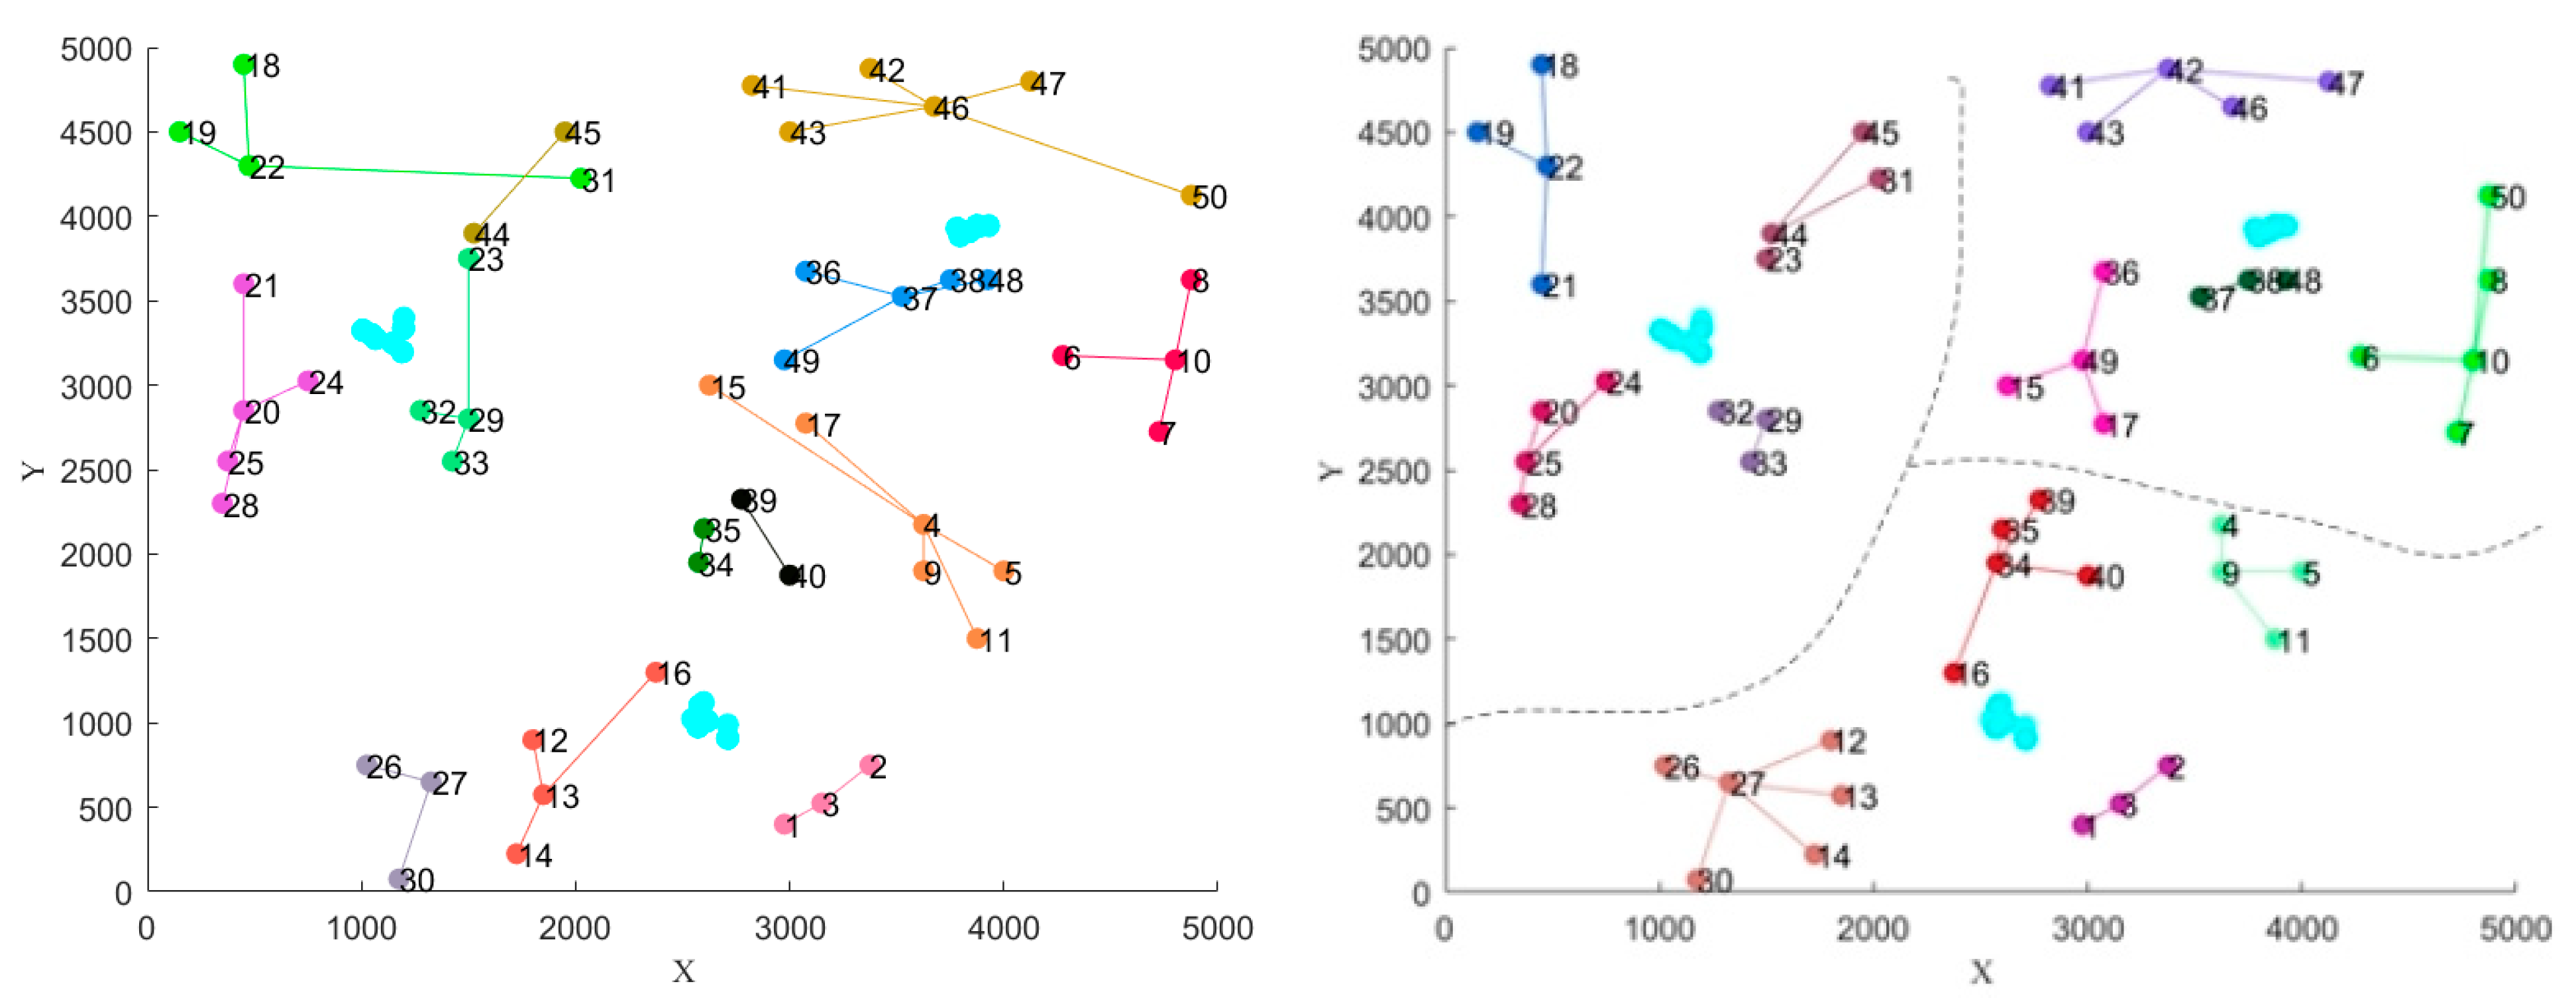
In Figure 9, (a) shows the customer order information received by the merchant in each distribution center, and the rider delivers the order after picking up the food from the merchant; (b) shows how the Euclidean distance is used to divide the region into different distribution centers. The rider is only responsible for the distribution center region of the order. The orders to a customer location beyond the distribution center region of the order are picked up by the drone and delivered to the rider, who ultimately completes the delivery of the meal.
The data of the instance are brought in, and the results of the orders distribution under the traditional rider delivery mode and the drone–rider joint delivery mode are solved separately using the AP clustering algorithm, as shown in Figure 10.
The initial routes of the rider and the drone are generated by the sorting method, and the initial routes are optimized using the improved tabu search algorithm to obtain the delivery scheme of the rider in both modes. The penalty cost is used to determine whether it is necessary to carry out 2-times clustering, to reduce the penalty cost and obtain greater customer satisfaction.
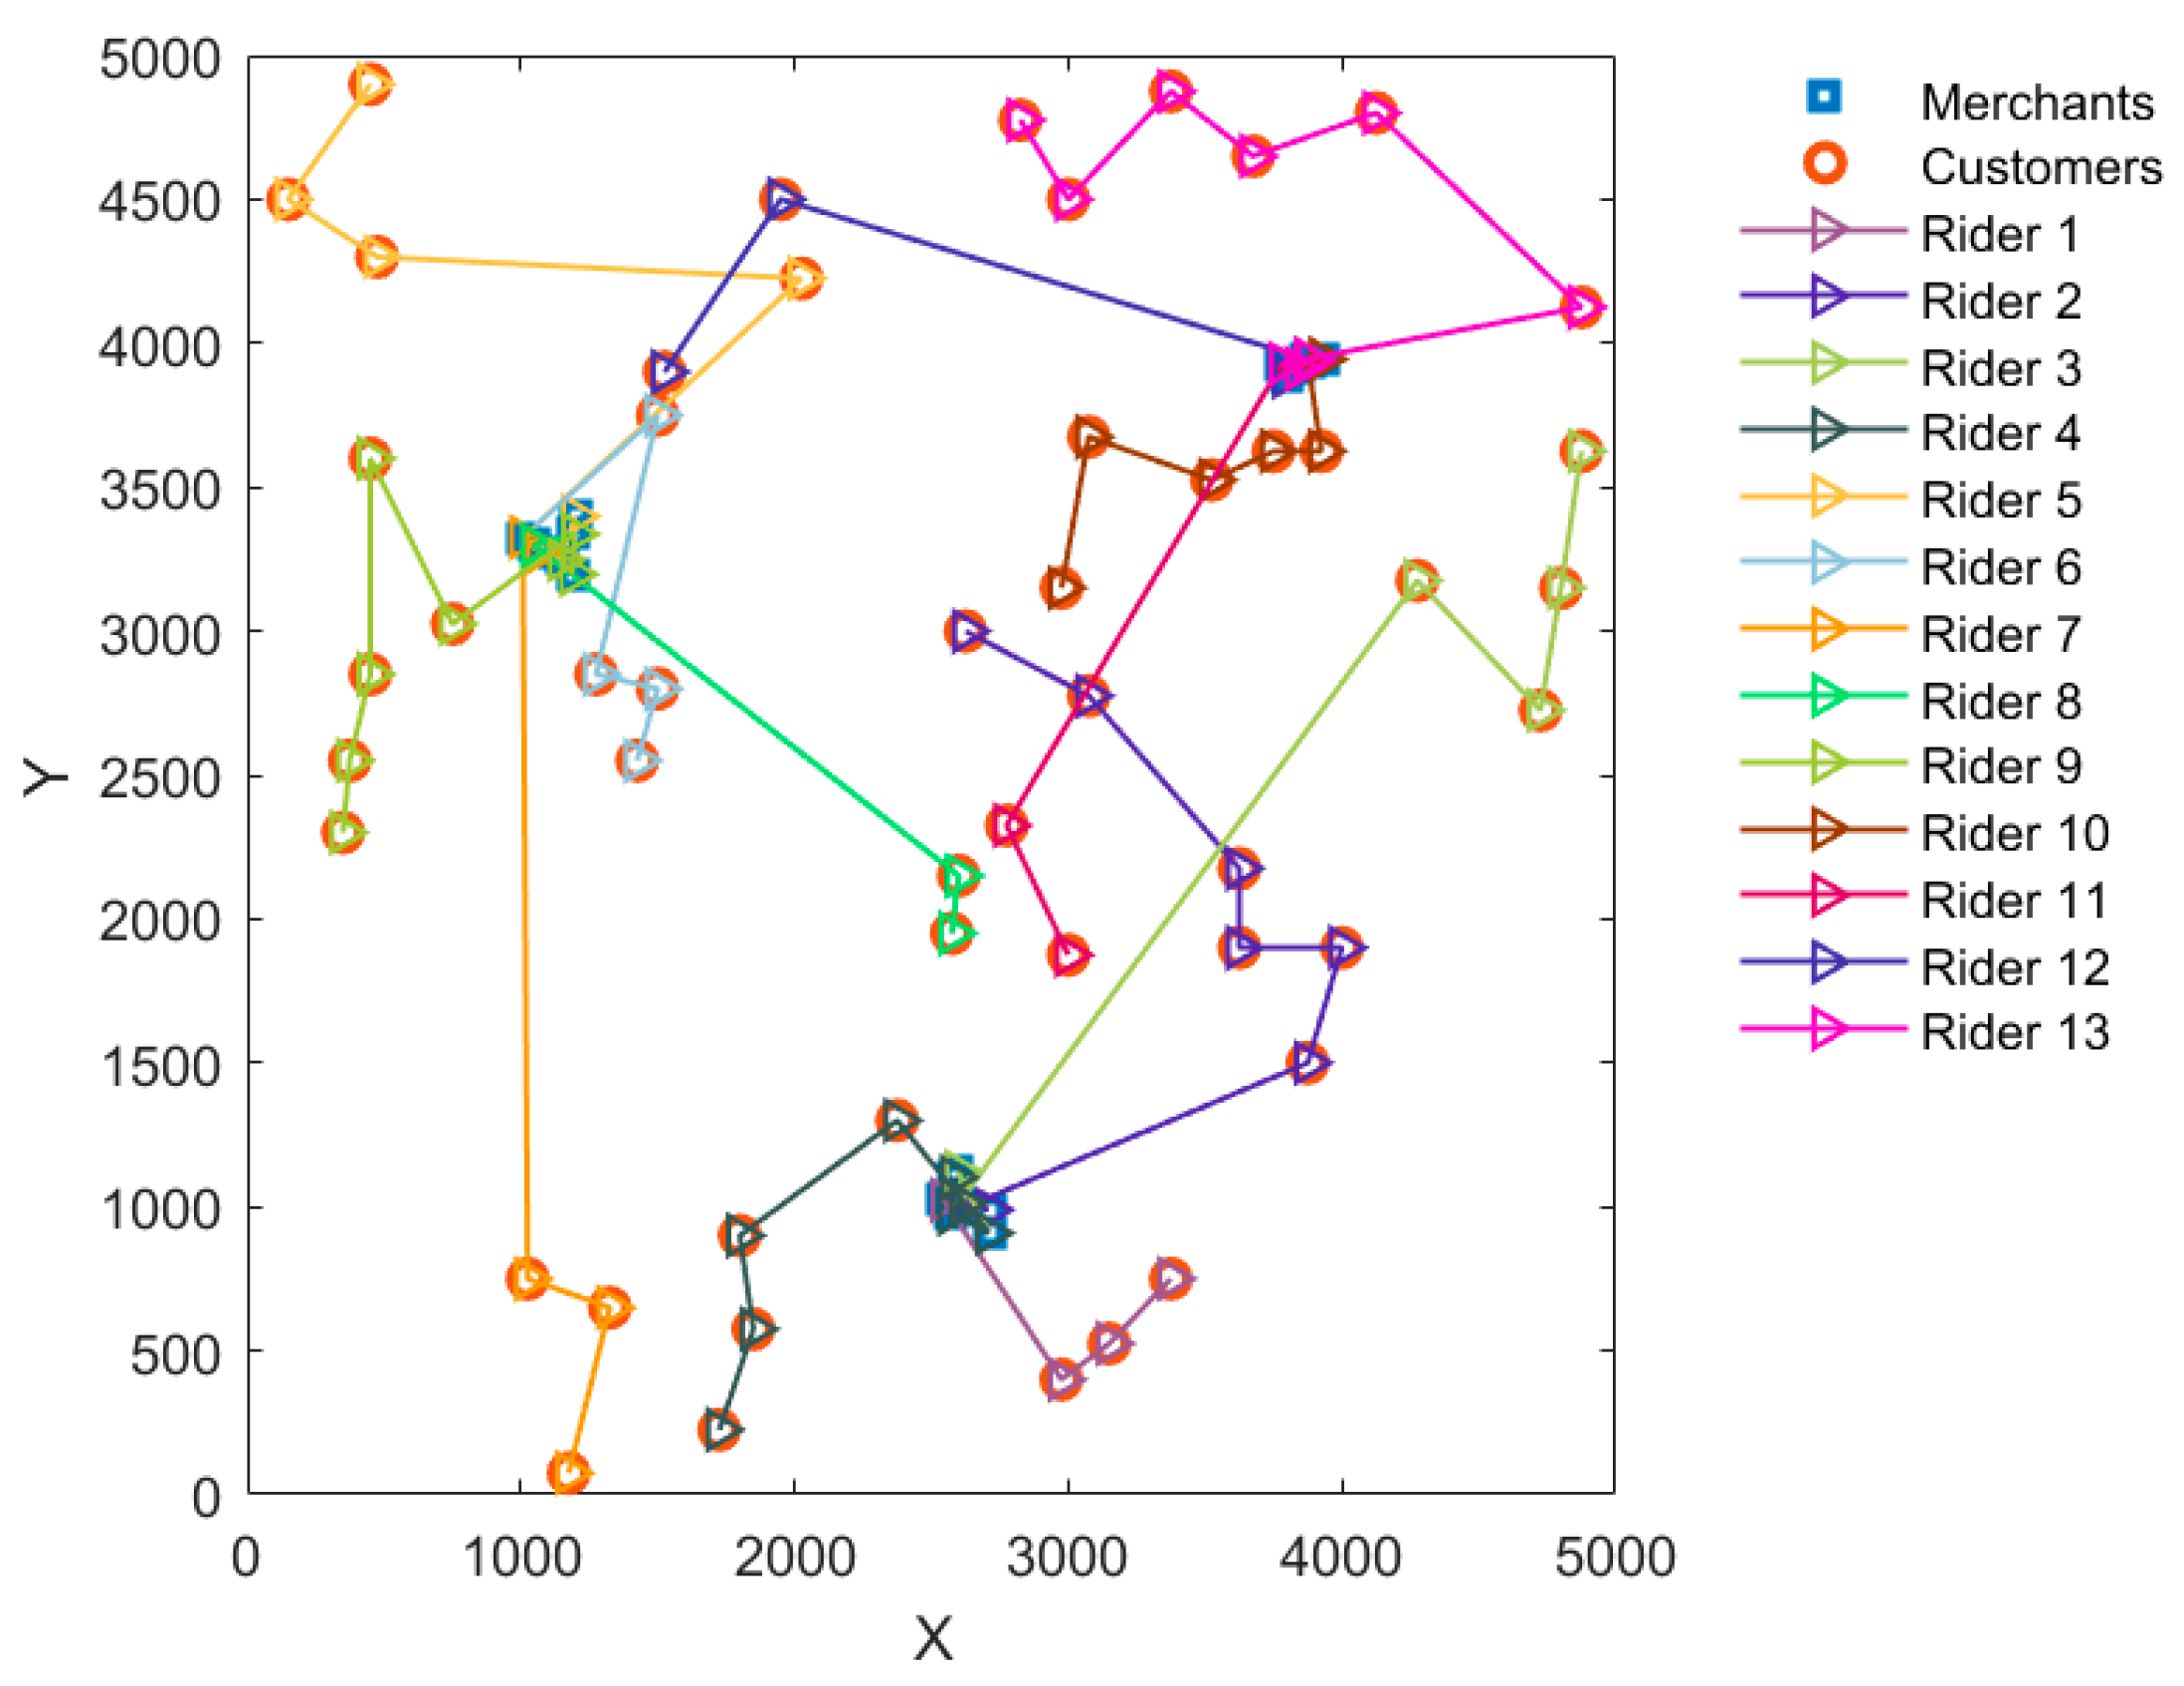
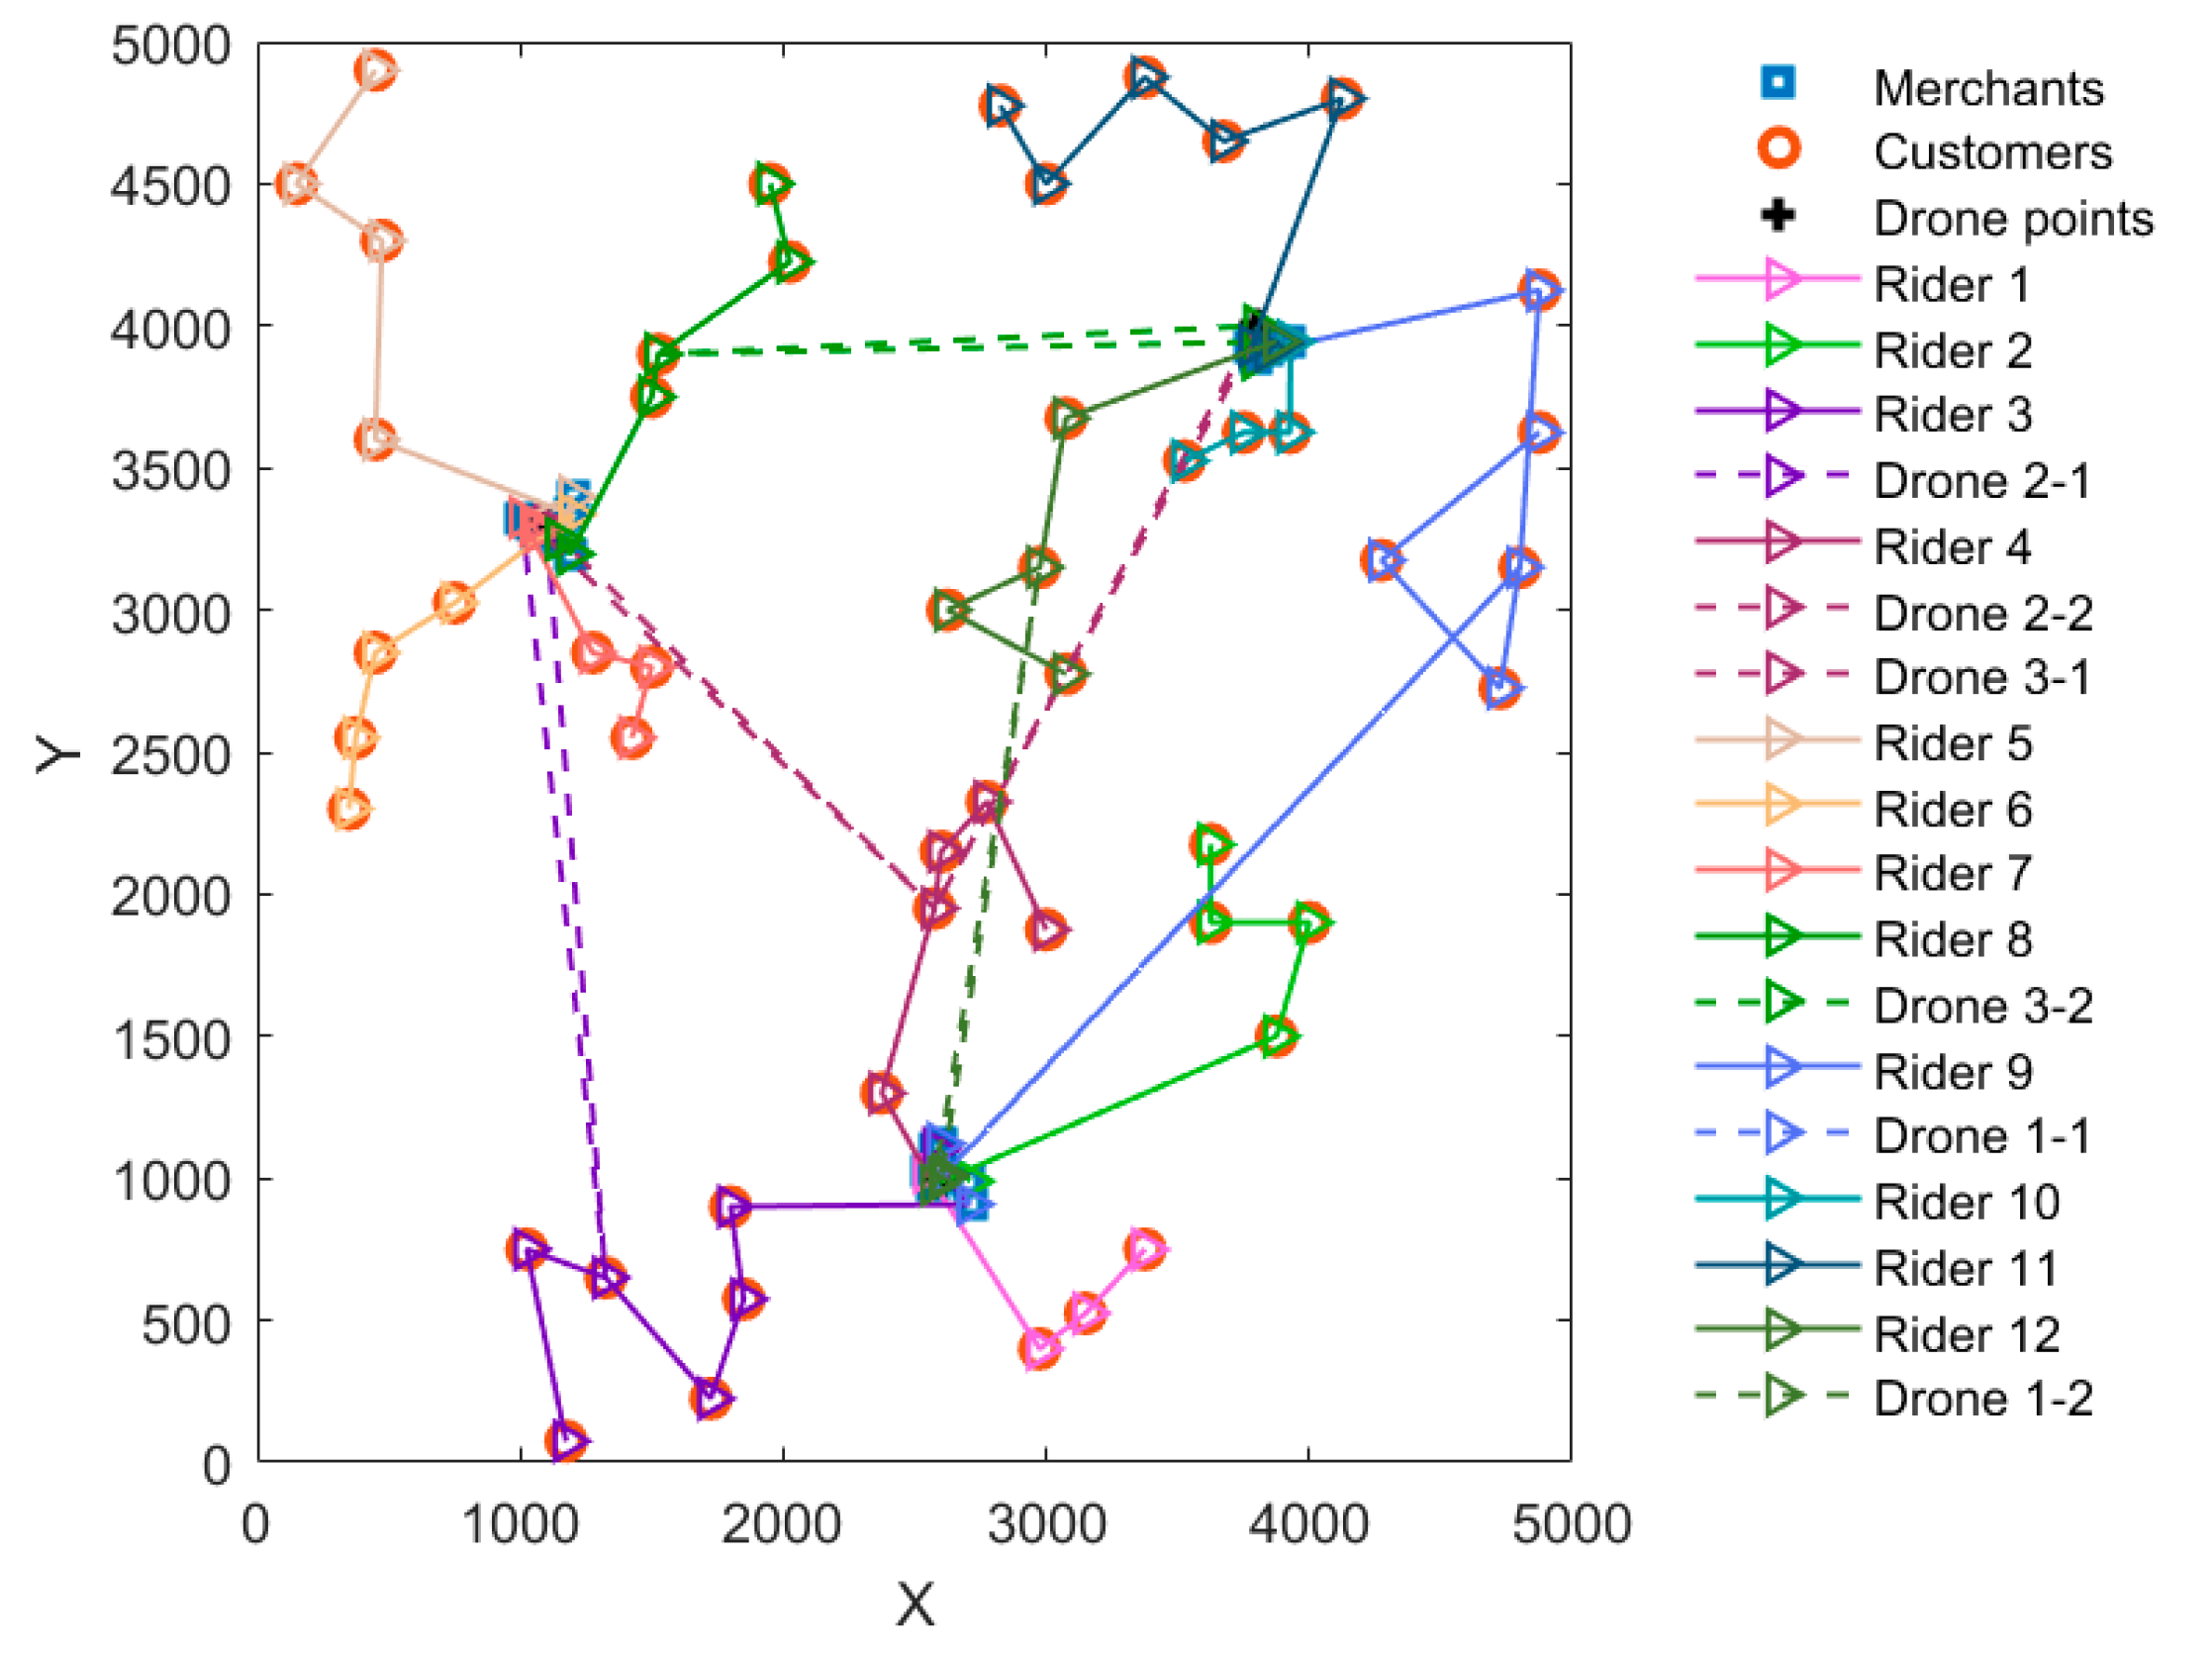
It can be seen from Table 7 that compared with traditional rider delivery, the delivery cost of the drone–rider joint delivery mode is reduced by 2.86%, the number of riders used is reduced, there are no penalty costs, and customer satisfaction is increased by 1.9926%. The rider delivery routes in both modes are shown in Table 8, where (…) denotes the intersection point between the rider and the drone. For example, 12-13-14-(27)-26-30 means that after picking up the meal from the merchant, the rider delivers the meal to customer Nos. 12, 13, and 14 in turn, goes to customer No. 27 to pick up the order carried by the drone, and then carries out the delivery of the meal to customer Nos. 27, 26, and 30.
Figure 11 and Figure 12 show the traditional rider delivery route diagram and the drone–rider joint delivery route diagram, respectively. By comparing the route diagrams of the two delivery modes, the Euclidean distance is used to divide customers into areas belonging to different distribution centers and then complete the delivery jointly through the drone and rider. This can effectively reduce the problems of unreasonable order distribution and low delivery efficiency in the process of rider delivery. The serial number of the rider represents the number of riders used and the delivery route of the rider. The serial number of the drone represents the number of flights of the drone under the distribution center and the flight route. Drone 2-1 indicates the drone in the second distribution center delivers a meal once.

5.2.2. Comparison of Different Instances

In order to verify the effectiveness of multiple distribution center collaboration in improving delivery efficiency and overall customer satisfaction, as well as the superiority of the drone–rider joint delivery mode compared to the traditional rider delivery mode, this paper solves the above five sets of instances R1(50), R2(75), R3(100), R4(125), and R5(150), and the experimental results are as follows.
It can be seen from Table 9 that the two takeout delivery models gradually increase the penalty cost as the order volume increases, and the overall customer satisfaction decreases. This means that when faced with a large influx of orders, the larger the order quantity, the weaker the ability to process orders. By comparing the instances of 150 and 50, the overall customer satisfaction of rider delivery decreased by 5.3977%, the overall customer satisfaction of drone–rider combined delivery decreased by 2.8658%, and the difference between the customer satisfaction of the two delivery modes increased from 1.9926% to 4.5245%. Compared with the traditional rider delivery mode, the customer satisfaction growth value of the drone–rider joint delivery mode increased from 1.9926% to 4.5245%, the reduction value of delivery cost increased from 2.86% to 17.18%, the number of riders used decreased by 20.69% in 150 instances, and the results were more significant. Therefore, the drone–rider joint delivery mode for multiple distribution centers, as proposed in this paper, can effectively reduce the pressure of rider delivery, reduce the number of riders and delivery costs, and improve customer satisfaction.

5.3. Damping Factor λ

The rapidity and convergence of the AP clustering algorithm are mainly determined by the damping factor λ, so the value of λ has a sizeable influence on the final experimental results. In order to obtain the optimal objective function value, this paper first adds λ from 0.1 to 0.9, and the value of damping factor λ is determined according to the experimental results. Selecting instance R1(50) to specifically explain the solution process according to the different values of damping factor λ, the clustering results generated are seen to differ. By conducting 30 experimental simulations, the optimal objective function as well as the corresponding customer satisfaction and number of riders for different values are recorded, and the results are as follows:
It can be seen from Table 10 that when the damping factor λ is 0.3 or 0.6–0.9, the clustering result of traditional rider delivery is the same, and the minimum delivery cost obtained by the clustering result is lower than that of other damping factor λ values. When the damping factors λ are 0.3 and 0.4, the minimum delivery cost obtained by the clustering results of drone–rider joint delivery is lowest. Therefore, combined with the results of the optimal objective function values of the two delivery modes, the damping factor λ in this paper takes a value of 0.3.

5.4. Algorithm Performance Comparison

In order to verify the effectiveness of the improved tabu search algorithm (ITS) algorithm for solving this problem, the traditional tabu search algorithm (TS), variable neighborhood search algorithm (VNS), whale optimization algorithm (WOA) [55], genetic algorithm (GA), and particle swarm algorithm (PSO) were used to solve the experimental instances of R1, R3, and R5, respectively; the experimental results were run 50 times each, and the experimental results are shown in Table 11. Comparing the solution results of the six algorithms at different scales, the optimal value, worst value, average value, standard deviation, and average customer satisfaction of ITS are the best.
As shown in Figure 13, as the scale increases, the calculation time of each algorithm becomes longer, and the level of customer satisfaction decreases. Compared with other comparison algorithms, the operation time of the improved tabu search algorithm is slightly higher than that of the traditional tabu search algorithm, but it is significantly lower than that of other comparison algorithms. In the 50 experimental instances, the customer satisfaction of each algorithm is basically the same. When the experimental study increases to 100, the customer satisfaction of the PSO algorithm decreases significantly; the customer satisfaction decline of the rest of the comparison algorithm is close to that of ITS, but the results of ITS are still higher than other comparison algorithms. When the experimental example increases to 150, it can be seen that the customer satisfaction of ITS is significantly higher than that of other comparison algorithms.
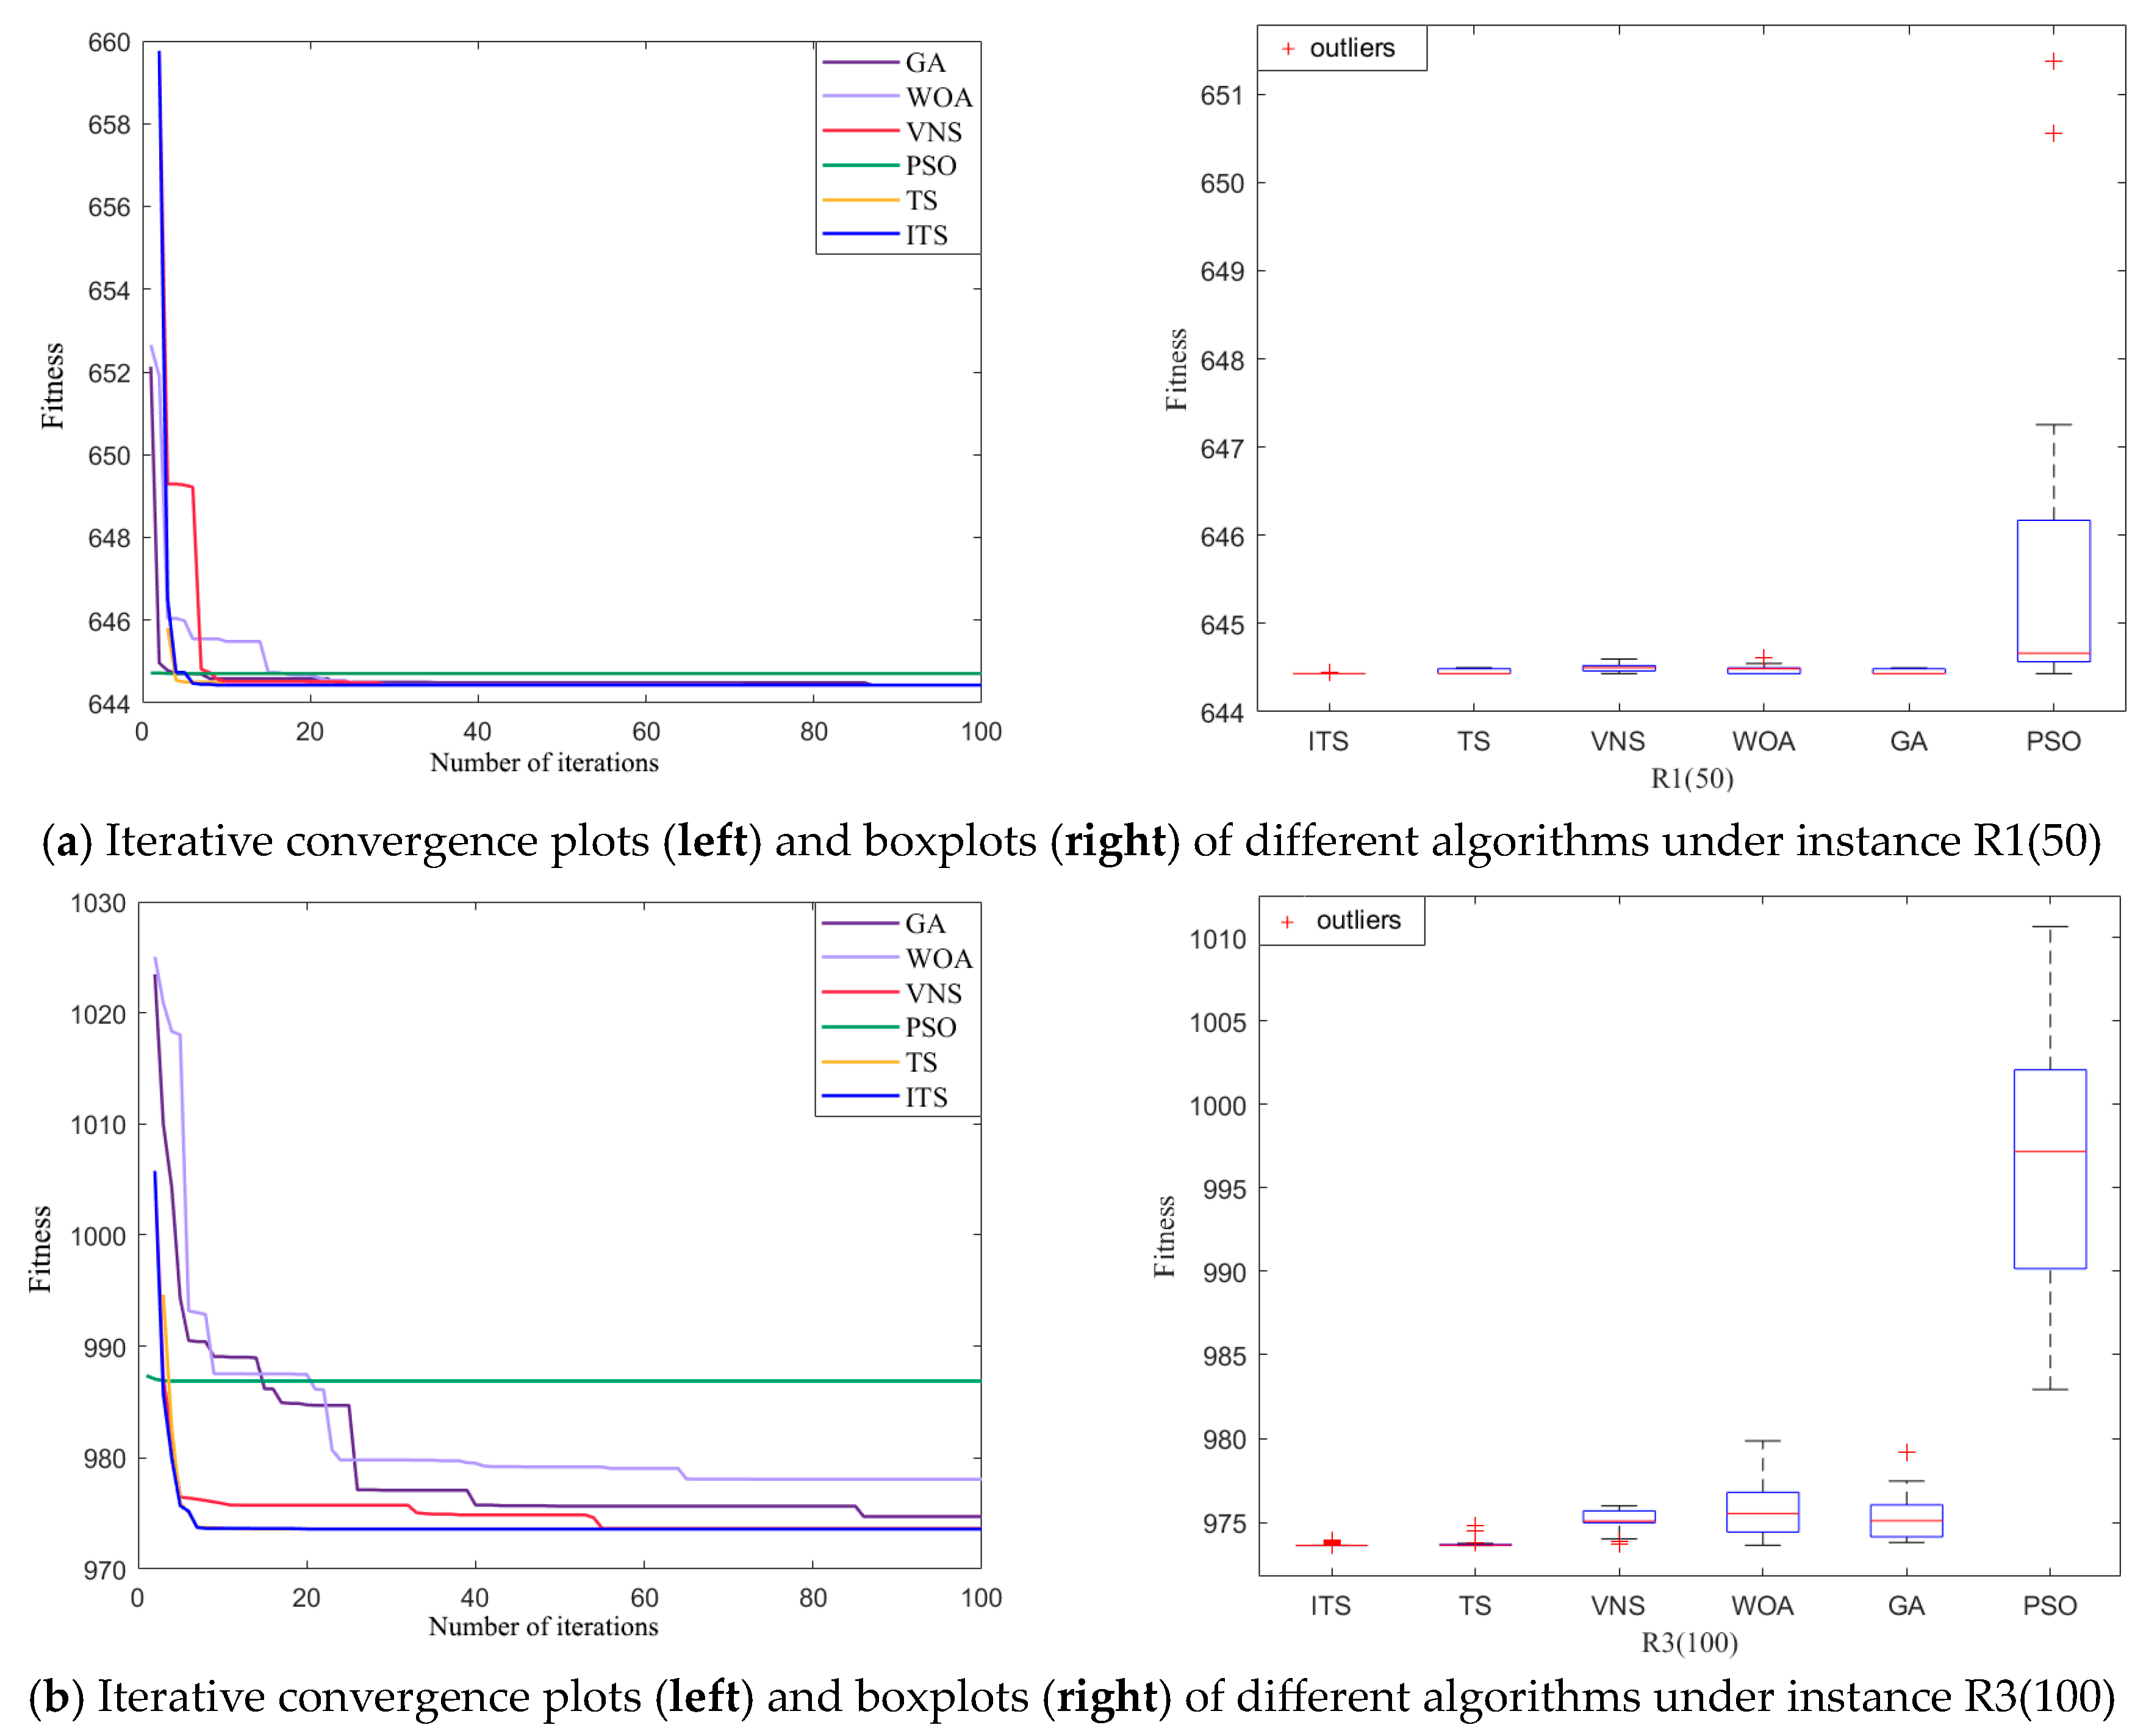
It can be seen from Figure 14 that under any instance, the improved tabu search algorithm can converge to a better optimal solution, and the convergence speed is faster. It can be seen from the box plots that ITS has better stability than the results of running 50 times under other comparison algorithms. Furthermore, with the increase of scale, the optimal objective fitness obtained by ITS is significantly better than the optimal objective fitness obtained by other comparison algorithms.
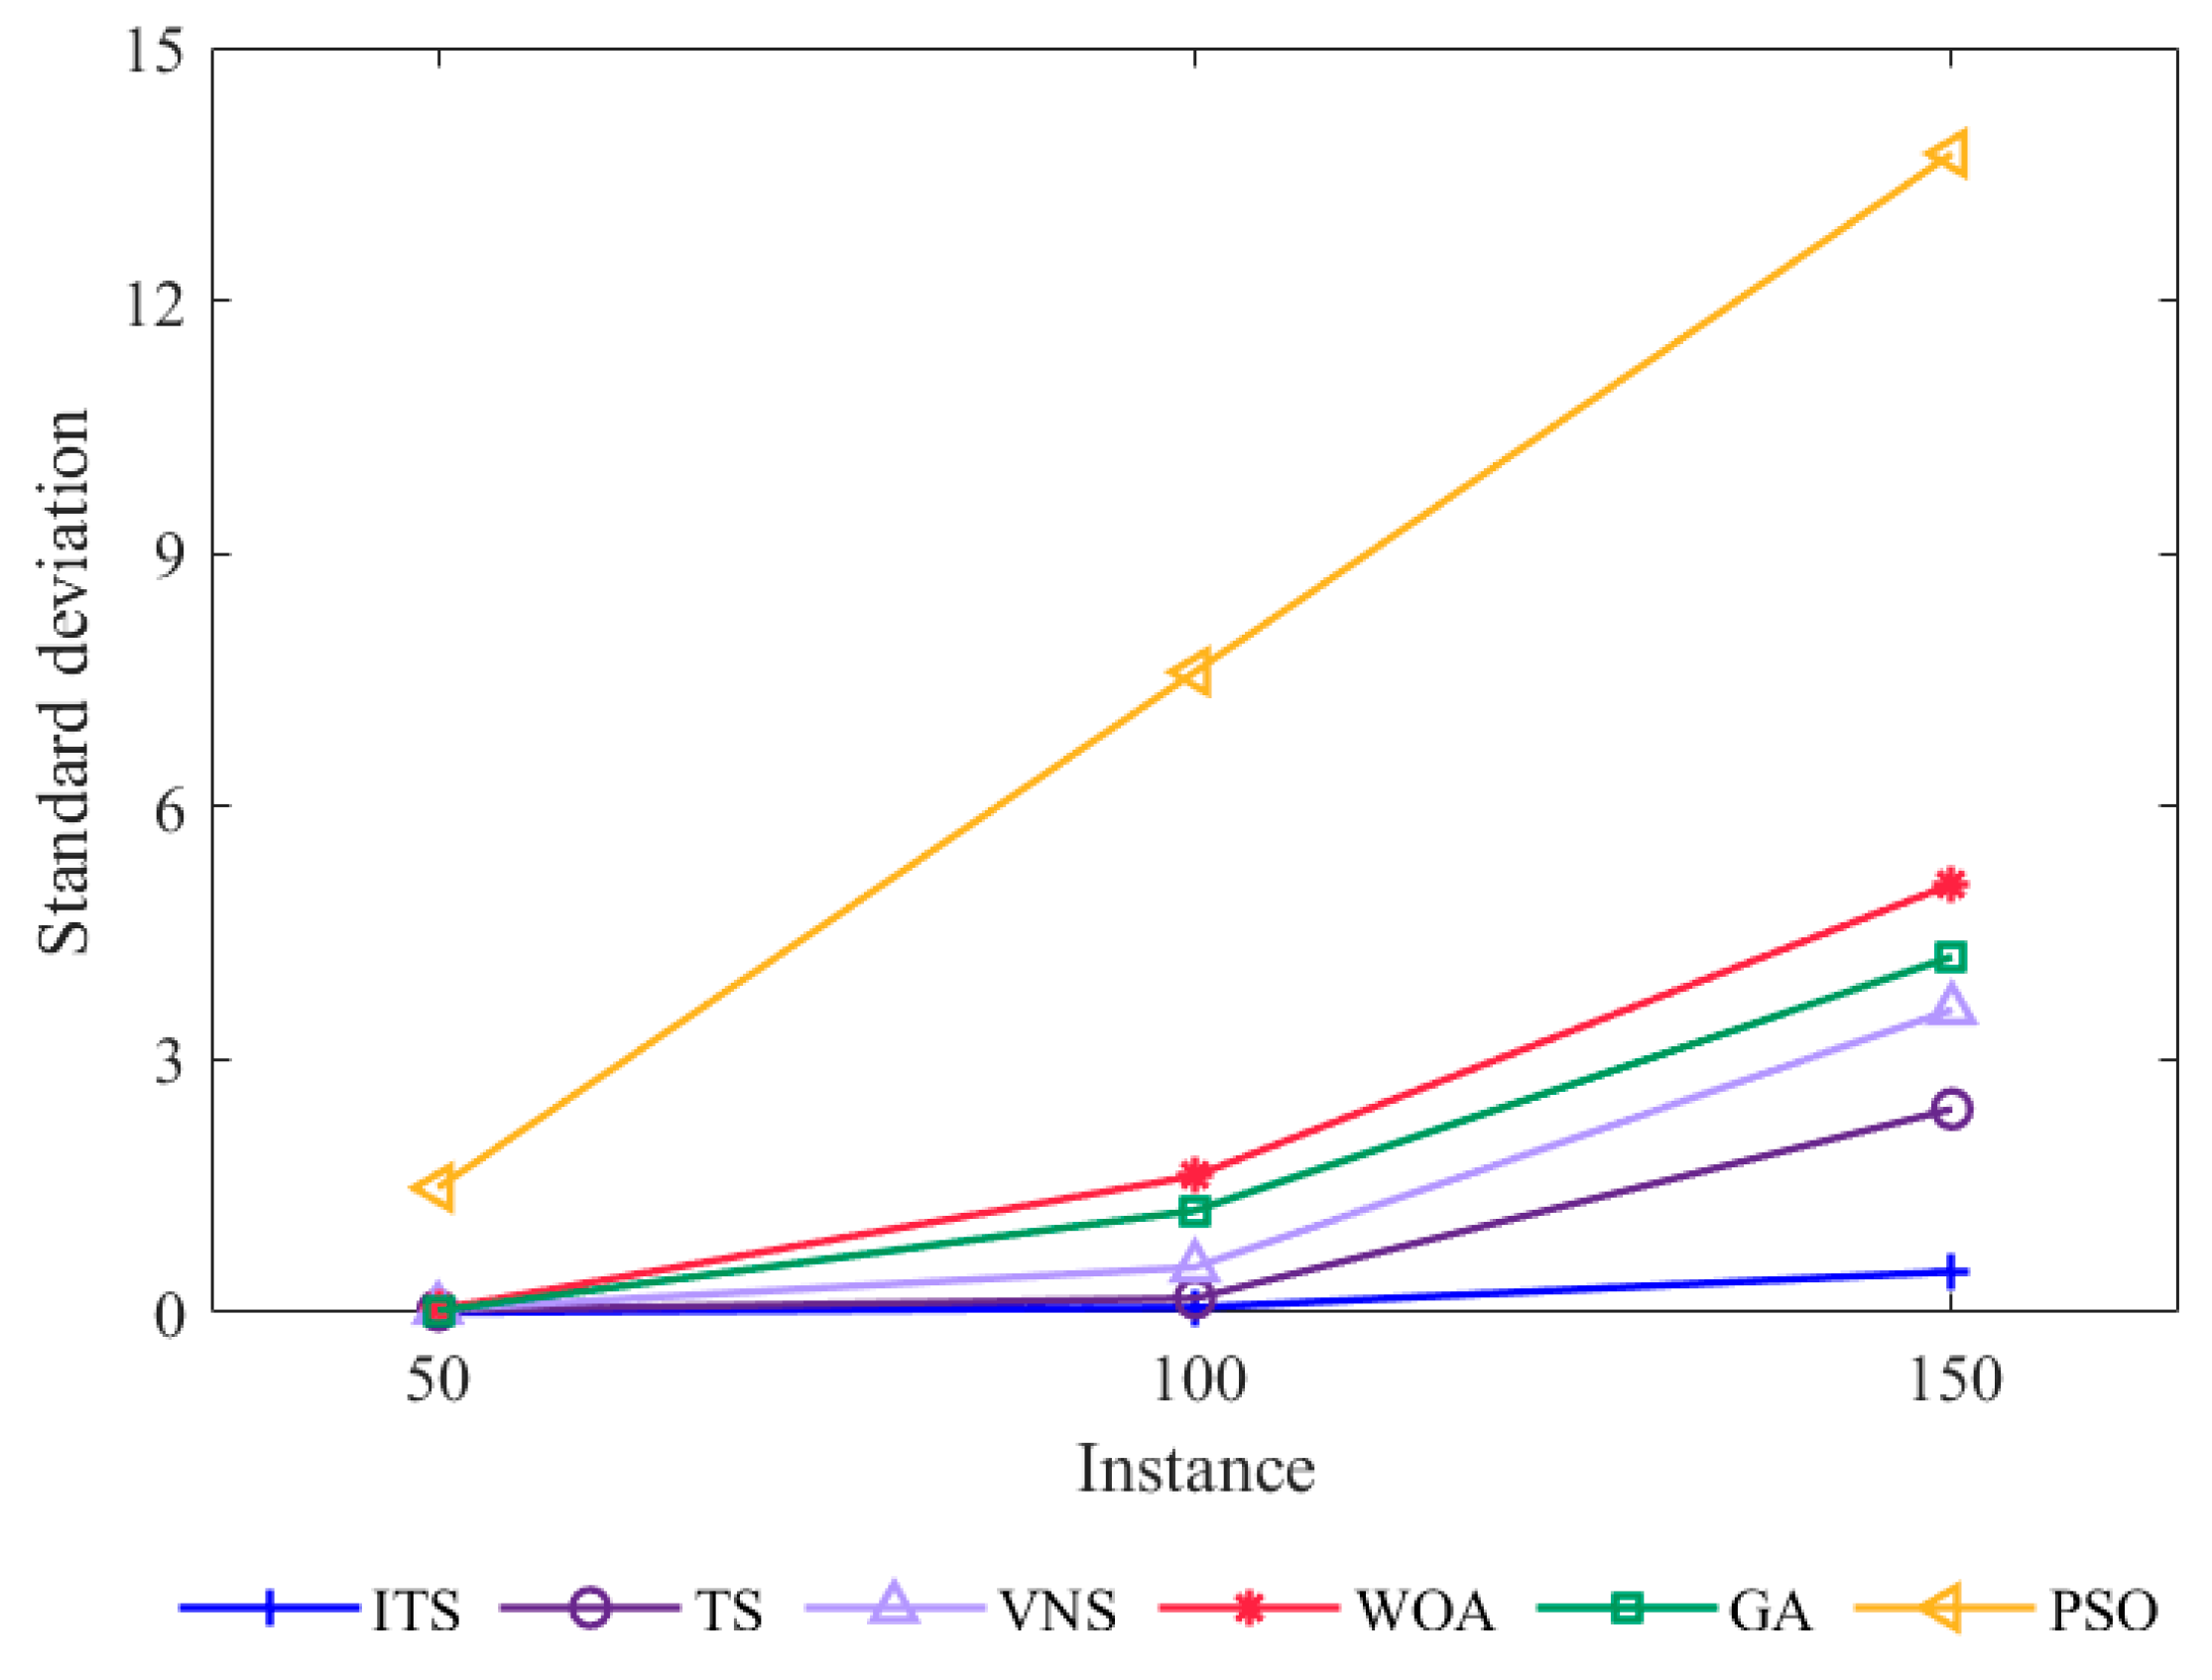
From the comparison of the standard deviation of different algorithms under the three different instances of Figure 15, the standard deviation of the improved tabu search algorithm with the increase of scale is significantly lower than that of other algorithms and has better stability. Therefore, the above experimental results confirm the rationality and effectiveness of the improved tabu search algorithm in solving this problem.

6. Conclusions

To solve the problems of high delivery cost, low delivery order volume, low delivery efficiency, and low profit of merchants in the delivery process, the order distribution and delivery route optimization problems of a takeout platform are studied. The drone–rider joint delivery model with multiple distribution centers is constructed with the objective function of minimum delivery cost and overall maximum customer satisfaction. A two-phase heuristic algorithm is designed for this model. In the first phase, Euclidean distance is used to classify customers into the regions belonging to different distribution centers, and the AP clustering algorithm is used to allocate the orders from different distribution centers. In the second stage, to compensate for the defects of the tabu search algorithm, an improved tabu search algorithm is designed to perform routing optimization to enhance the optimality seeking ability. This paper uses China’s Ele.me and Meituan takeout as reference objects and uses the Solomon dataset for research. The relevant conclusions obtained are as follows:
(1)
Starting from the actual situation, we consider the collaboration of multiple distribution centers to make the service scope of merchants wider and at the same time satisfy the customers’ requirements on order delivery time. Through the study of order allocation and delivery route optimization problems, the platform reduces the distribution cost and gains profit while attracting more customers, in line with reality.
(2)
We propose the mode of drone–rider joint delivery and compare it with the traditional delivery mode. The analysis concludes that the mode can effectively reduce the number of riders used, reduce the transportation cost, and improve customer satisfaction.
(3)
The effectiveness of the algorithm proposed in this paper is verified through experimental cases. The value of the damping factor λ in the AP clustering algorithm plays an important role in the solution of the model, so the running results are optimized by debugging its assignment. As the size of the case increases, the running results of ITS have better stability compared to other algorithms.
However, there are still some areas for improvement in the current research: considering obstacle avoidance during drone flight, considering the uncertainty of the time of delivery, traffic conditions in the takeout delivery process, a small number of emergencies, new orders joining, etc. These will be considered in subsequent studies.

Author Contributions

Conceptualization, F.L.; methodology, H.B.; validation, Z.G.; formal analysis, R.J.; investigation, R.J.; data curation, R.J.; writing—original draft preparation, R.J. and F.L.; writing—review and editing, H.B.; supervision, H.B. and Z.G.; funding acquisition, F.L. All authors have read and agreed to the published version of the manuscript.

Funding

This work is supported by the National Key R&D Program of China under Grant No. 2020YFB1712802, the Research Program of the Regional Economic Development Research Center of Yanshan University under Grant No JJ2208, and the Key Applied Research Program of Social Science of Qinhuangdao under Grant No. 2023LX044.

Institutional Review Board Statement

Not applicable.

Informed Consent Statement

Not applicable.

Data Availability Statement

The data presented in this study are available on request from the corresponding author due to data protection.

Acknowledgments

The authors would like to thank Ziteng Wang for his helpful suggestions in the revision processes.

Conflicts of Interest

The authors declare no conflict of interest.

References

  1. Wang, Z.; Neitzel, R.L.; Zheng, W.; Wang, D.; Xue, X.; Jiang, G. Road safety situation of electric bike riders: A cross-sectional study in courier and take-out food delivery population. Traffic Inj. Prev. 2021, 22, 564–569. [Google Scholar] [CrossRef] [PubMed]
  2. Jeong, H.Y.; Song, B.D.; Lee, S. The Flying Warehouse Delivery System: A Quantitative Approach for the Optimal Operation Policy of Airborne Fulfillment Center. IEEE Trans. Intell. Transp. Syst. 2020, 22, 1–10. [Google Scholar] [CrossRef]
  3. Jiao, T.; Li, X.; Meng, L. Effect of geographical distribution of online customer on operational decisions for take-out service retailers—Empirical analysis based on order data from Ele.me. China Soft Sci. 2020, 351, 122–133. [Google Scholar]
  4. Luo, J.; Tang, J.; Yu, Q.; Wu, Z. The division of O2O takeaway business zone and discovery of customer demand distribution law. Chin. J. Manag. Sci. 2023, 31, 58–68. [Google Scholar]
  5. Firdausiyah, N.; Taniguchi, E.; Qureshi, A.G. Modeling city logistics using adaptive dynamic programming based multi-agent simulation. Transp. Res. Part E Logist. Transp. Rev. 2019, 125, 74–96. [Google Scholar] [CrossRef]
  6. Ortiz-Astorquiza, C.; Cordeau, J.F.; Frejinger, E. The locomotive assignment problem with distributed power at the Canadian national railway company. Transp. Sci. 2021, 55, 510–531. [Google Scholar] [CrossRef]
  7. Jiang, C.; Xu, J.; Li, S.; Zhang, X.; Wu, Y. The Order Allocation Problem and the Algorithm of Network Freight Platform under the Constraint of Carbon Tax Policy. Int. J. Environ. Res. Public Health 2022, 19, 10993. [Google Scholar] [CrossRef] [PubMed]
  8. Azad, T.; Rahman, H.F.; Chakrabortty, R.K.; Ryan, M.J. Optimization of integrated production scheduling and vehicle routing problem with batch delivery to multiple customers in supply chain. Memetic Comp. 2022, 14, 355–376. [Google Scholar] [CrossRef]
  9. Taillard, E.D. A linearithmic heuristic for the travelling salesman problem. Eur. J. Oper. Res. 2022, 297, 442–450. [Google Scholar] [CrossRef]
  10. Yu, B.; Shan, W.; Sheu, J.-B.; Diabat, A. Branch-and-price for a combined order selection and distribution problem in online community group-buying of perishable products. Transp. Res. Part B Methodol. 2022, 158, 341–373. [Google Scholar] [CrossRef]
  11. Battaglia, G.; Musolino, G.; Vitetta, A. Freight Demand Distribution in a Suburban Area: Calibration of an Acquisition Model with Floating Car Data. J. Adv. Transp. 2022, 2022, 1535090. [Google Scholar] [CrossRef]
  12. Abdollahi, M.; Yang, X.; Nasri, M.I.; Fairbank, M. Demand management in time-slotted last-mile delivery via dynamic routing with forecast orders. Eur. J. Oper. Res. 2023, 309, 704–718. [Google Scholar] [CrossRef]
  13. Zhen, L.; Wu, J.; Laporte, G.; Tan, Z. Heterogeneous instant delivery orders scheduling and routing problem. Comput. Oper. Res. 2023, 157, 0305–0548. [Google Scholar] [CrossRef]
  14. Diabat, A.; Bianchessi, N.; Archetti, C. On the zero-inventory-ordering policy in the inventory routing problem. Eur. J. Oper. Res. 2024, 312, 1024–1038. [Google Scholar] [CrossRef]
  15. Derigs, U.; Döhmer, T. Indirect search for the vehicle routing problem with pickup and delivery and time windows. OR Spectr. 2008, 30, 149–165. [Google Scholar] [CrossRef]
  16. Psarafis, H. A dynamic programming solution to the single vehicle many-to-many immediate request dial-a-ride problem. Transp. Sci. 1980, 14, 130–154. [Google Scholar] [CrossRef]
  17. Dumas, Y.; Desrosiers, J.; Soumis, F. The pickup and delivery problem with time windows. Eur. J. Oper. Res. 1991, 54, 7–22. [Google Scholar] [CrossRef]
  18. Bent, R.; Van Hentenryck, P. A two-stage hybrid algorithm for pickup and delivery vehicle routing problems with time windows. Comput. Oper. Res. 2006, 33, 875–893. [Google Scholar] [CrossRef]
  19. Wassan, N.A.; Wassan, A.H.; Nagy, G. A reactive tabu search algorithm for the vehicle routing problem with simultaneous pickups and deliveries. J. Comb. Optim. 2008, 15, 368–386. [Google Scholar] [CrossRef]
  20. Gmira, M.; Gendreau, M.; Lodi, A.; Potvin, J.Y. Managing in real-time a vehicle routing plan with time-dependent travel times on a road network. Transp. Res. Part C Emerg. Technol. 2021, 132, 103379. [Google Scholar] [CrossRef]
  21. Bi, H.; Lu, F.; Duan, S.; Huang, M.; Zhu, J.; Liu, M. Two-Level Principal-Agent Model for Schedule Risk Control of IT Outsourcing Project Based on Genetic Algorithm. Eng. Appl. Artif. Intell. 2020, 91, 1–28. [Google Scholar] [CrossRef]
  22. Goodarzi, A.H.; Tavakkoli-Moghaddam, R.; Amini, A. A new bi-objective vehicle routing-scheduling problem with cross-docking: Mathematical model and algorithms. Comput. Ind. Eng. 2020, 149, 1–18. [Google Scholar] [CrossRef]
  23. Wang, C.; Zhao, F.; Mu, D.; Sutherland, J.W. A parallel simulated annealing method for the vehicle routing problem with simultaneous pickup-delivery and time windows. Comput. Ind. Eng 2015, 83, 111–122. [Google Scholar] [CrossRef]
  24. Vincent, F.Y.; Jewpanya, P.; Redi, A.P.; Tsao, Y.C. Adaptive neighborhood simulated annealing for the heterogeneous fleet vehicle routing problem with multiple cross-docks. Comput. Oper. Res. 2021, 129, 1–19. [Google Scholar]
  25. Gajpal, Y.; Abad, P. An ant colony system (ACS) for vehicle routing problem with simultaneous delivery and pickup. Comput. Oper. Res. 2009, 36, 3215–3223. [Google Scholar] [CrossRef]
  26. Bülent, Ç. A new saving-based ant algorithm for the Vehicle Routing Problem with Simultaneous Pickup and Delivery. Expert Syst. Appl. 2010, 37, 6809–6817. [Google Scholar]
  27. Wu, H.; Gao, Y. An Ant Colony Optimization Based on Local Search for the Vehicle Routing Problem with Simultaneous Pickup-delivery and Time Window. Appl. Soft Comput. 2023, 139, 110203. [Google Scholar] [CrossRef]
  28. Wen, H.; Wang, S.X.; Lu, F.Q.; Feng, M.; Wang, L.Z.; Xiong, J.K.; Si, M.C. Colony search optimization algorithm using global optimization. J. Supercomput. 2022, 78, 6567–6611. [Google Scholar] [CrossRef]
  29. Yan, T.; Lu, F.; Wang, S.; Wang, L.; Bi, H. A hybrid metaheuristic algorithm for the multi-objective location-routing problem in the early post-disaster stage. J. Ind. Manag. Optim. 2022, 19, 1547–5816. [Google Scholar] [CrossRef]
  30. Lu, F.; Chen, W.; Feng, W.; Bi, H. 4PL routing problem using hybrid beetle swarm optimization. Soft Comput. 2023, 27, 17011–17024. [Google Scholar] [CrossRef]
  31. Lu, F.; Feng, W.; Gao, M.; Bi, H.; Wang, S. The Fourth-Party Logistics Routing Problem Using Ant Colony System-Improved Grey Wolf Optimization. J. Adv. Transp. 2020, 2020, 8831746. [Google Scholar] [CrossRef]
  32. Zhou, H.; Qin, H.; Zhang, Z.; Li, J. Two-echelon vehicle routing problem with time windows and simultaneous pickup and delivery. Soft Comput. 2022, 26, 3345–3360. [Google Scholar] [CrossRef]
  33. Song, W.; Yuan, S.; Yang, Y.; He, C. A Study of Community Group Purchasing Vehicle Routing Problems Considering Service Time Windows. Sustainability 2022, 14, 6968. [Google Scholar] [CrossRef]
  34. Schyns, M. An ant colony system for responsive dynamic vehicle routing. Eur. J. Oper. Res. 2015, 245, 704–718. [Google Scholar] [CrossRef]
  35. Sun, B.; Yang, Y.; Shi, J.; Zheng, L. Dynamic Pick-Up and Delivery Optimization With Multiple Dynamic Events in Real-World Environment. IEEE Access 2019, 7, 146209–146220. [Google Scholar] [CrossRef]
  36. Cui, S.; Sun, Q.; Zhang, Q. A Time-Dependent Vehicle Routing Problem for Instant Delivery Based on Memetic Algorithm. Comput. Intell. Neurosci. 2022, 2022, 5099008. [Google Scholar] [CrossRef] [PubMed]
  37. Bi, H.; Zhu, X.; Lu, F.; Huang, M. The Meal Delivery Routing Problem in E-commerce Platforms under the Shared Logistics Mode. J. Theor. Appl. Electron. Commer. Res. 2023, 18, 1799–1819. [Google Scholar] [CrossRef]
  38. Tang, C.; Liu, C.; Li, C. Research on delivery problem based on two-stage multi-objective optimization for takeout riders. J. Ind. Manag. Optim. 2023, 19, 7881–7919. [Google Scholar] [CrossRef]
  39. Kuo, R.J.; Wibowo, B.S.; Zulvia, F.E. Application of a fuzzy ant colony system to solve the dynamic vehicle routing problem with uncertain service time. Appl. Math. Model. 2016, 40, 9990–10001. [Google Scholar] [CrossRef]
  40. Liu, Y. An optimization-driven dynamic vehicle routing algorithm for on-demand meal delivery using drones. Comput. Oper. Res. 2019, 111, 0305–0548. [Google Scholar] [CrossRef]
  41. Ulmer, M.W.; Thomas, B.W.; Campbell, A.M.; Woyak, N. The Restaurant Meal Delivery Problem: Dynamic Pickup and Delivery with Deadlines and Random Ready Times. Transp. Sci. 2020, 55, 75–100. [Google Scholar] [CrossRef]
  42. Fan, H.; Xan, F.; Wang, H. Takeout distribution routes optimization considering order clustering under dynamic demand. J. Syst. Simul. 2023, 35, 396–407. [Google Scholar]
  43. Zhao, Q.; Lu, F.; Wang, L.; Wang, T. Research on drones and rider joint take-out delivery routing problem. Comput. Eng. Appl. 2022, 58, 269–278. [Google Scholar]
  44. Li, J.; Yang, S.; Pan, W.; Xu, Z.; Wei, B. Meal delivery routing optimization with order allocation strategy based on transfer stations for instant logistics services. IET Intell. Transp. Syst. 2022, 16, 1108–1126. [Google Scholar] [CrossRef]
  45. Dorling, K.; Heinrichs, J.; Messier, G.G.; Magierowski, S. Vehicle Routing Problems for Drone Delivery. IEEE Trans. Syst. Man Cybern. Syst. 2017, 47, 70–85. [Google Scholar] [CrossRef]
  46. Cheng, C.; Adulyasak, Y.; Rousseau, L.M. Drone routing with energy function: Formulation and exact algorithm. Transp. Res. Part B Methodol. 2020, 139, 364–387. [Google Scholar] [CrossRef]
  47. Song, B.D.; Park, K.; Kim, J. Persistent UAV delivery logistics: MILP formulation and efficient heuristic. Comput. Ind. Eng. 2018, 120, 418–428. [Google Scholar] [CrossRef]
  48. Wang, D.; Hu, P.; Du, J.; Zhou, P.; Deng, T.; Hu, M. Routing and scheduling for hybrid truck-drone collaborative parcel delivery with independent and truck-carried drones. IEEE Internet Things J. 2019, 6, 10483–10495. [Google Scholar] [CrossRef]
  49. Felix, T.; Udo, B. A branch-and-cut algorithm for the vehicle routing problem with drones. Transp. Res. Part B Methodol. 2021, 144, 174–203. [Google Scholar]
  50. Kuo, R.J.; Lu, S.H.; Lai, P.Y.; Mara, S.T.W. Vehicle routing problem with drones considering time windows. Expert Syst. Appl. 2022, 191, 1–18. [Google Scholar] [CrossRef]
  51. Salama, M.R.; Srinivas, S. Collaborative truck multi-drone routing and scheduling problem: Package delivery with flexible launch and recovery sites. Transp. Res. Part E 2022, 164, 1–21. [Google Scholar] [CrossRef]
  52. Mulumba, T.; Diabat, A. Optimization of the drone-assisted pickup and delivery problem. Transp. Res. Part E Logist. Transp. Rev. 2024, 181, 1366–5545. [Google Scholar] [CrossRef]
  53. Feng, W.; Lu, F.; Wang, S.; Bi, H.; Wang, L. Research on Unmanned aerial vehicles delivery route planning considering charging facilities. Control. Eng. 2022, 31, 1–10. [Google Scholar]
  54. Frey, B.J.; Dueck, D. Clustering by passing messages between data points. Science 2007, 315, 972–976. [Google Scholar] [CrossRef]
  55. Lu, F.; Yan, T.; Bi, H.; Feng, M.; Wang, S.; Huang, M. A bilevel whale optimization algorithm for risk management scheduling of information technology projects considering outsourcing. Knowl. Based Syst. 2022, 235, 1–15. [Google Scholar] [CrossRef]
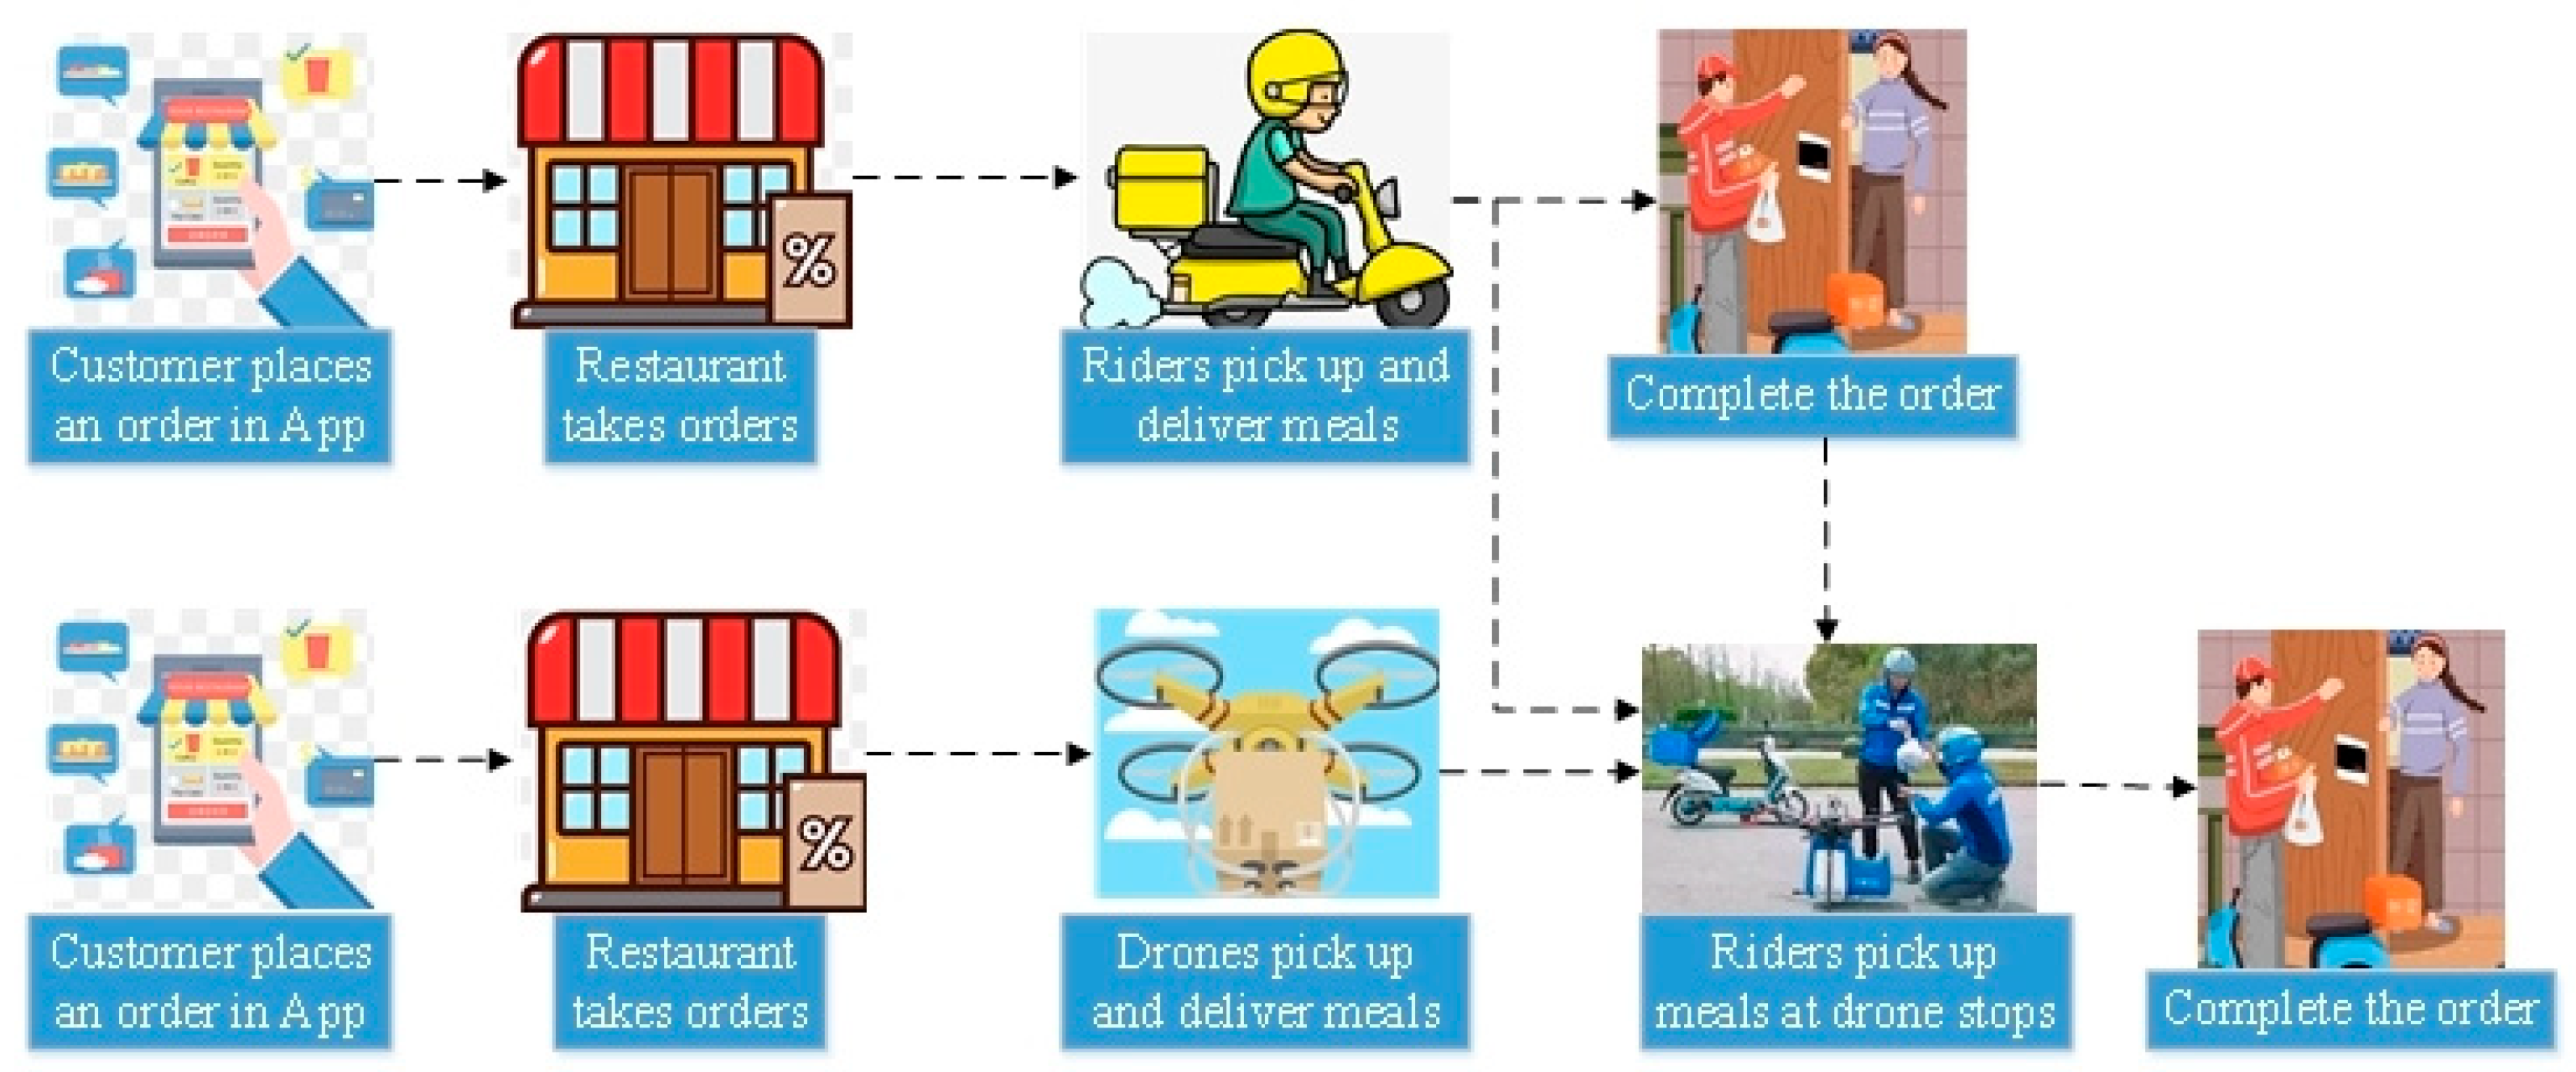
Figure 1. Drone–rider joint delivery mode.
Jtaer 19 00041 g001
Figure 2. Traditional rider delivery mode and drone–rider joint delivery mode.
Jtaer 19 00041 g002
Figure 3. Customer satisfaction function.
Jtaer 19 00041 g003
Figure 4. Improved tabu search algorithm flowchart.
Jtaer 19 00041 g004
Figure 5. 2-opt operators.
Jtaer 19 00041 g005
Figure 6. Insert operators.
Jtaer 19 00041 g006
Figure 7. Reverse operators.
Jtaer 19 00041 g007
Figure 8. Two-stage heuristic algorithm flowchart.
Jtaer 19 00041 g008
Figure 9. Required delivery order locations in both modes: (a) rider delivery mode and (b) drone–rider joint delivery mode.
Jtaer 19 00041 g009
Figure 10. Results of order distribution under traditional rider delivery mode and joint drone–rider delivery mode.
Jtaer 19 00041 g010
Figure 11. Traditional rider delivery route diagram.
Jtaer 19 00041 g011
Figure 12. Drone–rider joint delivery route diagram.
Jtaer 19 00041 g012
Figure 13. Comparison of running time of different algorithms under different instances (left) and comparison of customer satisfaction of different algorithms under different instances (right).
Jtaer 19 00041 g013
Figure 14. Comparison of fitness of different algorithms under three different instances.
Jtaer 19 00041 g014aJtaer 19 00041 g014b
Figure 15. Comparison of standard deviations of different algorithms under three different instances.
Jtaer 19 00041 g015
Table 1. Summary of literature.
AuthorTopicAlgorithmNature of the StudyResults
[5]order distributionMAS-ADP based RLsimulationreducing environmental emissions
[7]order distribution0-1 integer programming
algorithm
case studyreduce carbon emissions
[10]order distributionbranch-and-price algorithmreal datareduce product losses revenue increased
[8]order distribution genetic algorithmbenchmark reduce the overall cost of tardiness and batch distribution
[12]order distributiondynamic pricing fixed routing forecast approachcase studyreduce delivery cost
[14]order distributionbranch-and-cut algorithms benchmark IRP instancesreduce the total cost of the distribution plan
[19,20,32]PDVRPTWtabu searchcase study benchmarkreduce travel time
[21,22]PDVRPTW
takeout delivery
genetic algorithmcase studyreduce total operational cost
[23,24]PDVRPTWsimulated annealingbenchmark casereduce total delivery cost
[25,26,27,33,34]PDVRPTW
takeout delivery
ant colony algorithmVRP benchmark casereduce total distance
improve responsiveness
[35]dynamics takeout deliveryTS, ALNS
dynamic insertion method
real datareduce delivery cost
[35,38,43,44]takeout deliverylarge-scale neighborhood search algorithm
and genetic algorithm
case studyreduce delivery cost
reduce working hours and
delivery distance
[39]dynamics takeout deliveryfuzzy ant colony
system
benchmark caseincrease number of customer service and reduce average customer waiting time
[41]dynamics takeout deliveryanticipatory customer assignment policyreal datareduce delivery of tardiness
[42]dynamics takeout deliveryvariable neighborhood search algorithmcase studyreduce delivery time and average travel distance
[48]drone deliveryhybrid truck–drone delivery
algorithm
case studyreduce delivery cost
[49]drone deliverybranch cutting algorithmcase studyreduce delivery cost and timeout penalty
[50,51]drone deliveryhybrid simulated annealing, variable neighborhood searchcase studyreduce delivery completion time
[52]drone deliveryClarke–Wright savings heuristiccase studyreduce operational costs
This paperorder distribution takeout delivery
drone delivery
two-stage heuristic algorithmbenchmark casereduce delivery cost and improve customer satisfaction
Table 2. Model notation definition.
NotationNotation DefinitionNotationNotation Definition
ISet of customers I = {1, 2…n}vpRider speed
JSet of merchants J = Jk + Ja = {n + 1, n + 2… 2n}, Jk rider is in charge, Ja drone is in charge [ETi, LTi] Customer i time window restrictions: ETi, expected arrival time; LTi, latest acceptable arrival time
OSet of drone take-off points O = {1,2…o}vuDrone speed
KSet of riders K = {1,2…k}cp1Rider fixed costs
ASet of drones A = {1, 2…a}cu1Drone fixed costs
VSet of rider service points V = IJkcp2Rider unit ride cost
GSet of drone stops G = {1, 2…g}, GIcu2Drone unit travel cost
dijThe distance from node i to node jWumaxMaximum cargo capacity of the drone
d i j a Distance from node i to node j for drone aWkmaxMaximum cargo capacity of electric vehicles
tikTime the rider arrives at node itiaTime taken by the drone to arrive at node i
qkiTakeout weight for order i accepted by rider kqaiTakeout weight for order i accepted by drone a
tfMerchant meal preparation timetsCustomer service time
tikmRider K walks through m nodes to reach the time of customer point irijIf customer node i needs merchant node j’s meal, rij = 1; otherwise, rij = 0
xkijDecision variable: if rider k goes from node i to node j, xkij = 1; otherwise, xkij = 0.xaijDecision variable: if the drone a goes from node i to node j, xaij = 1; otherwise, xaij = 0.
Table 3. Drone energy consumption model notation definition.
ParameterParameter DescriptionParameterParameter Description
Qamaxmaximum power of dronembdrone battery weight
μbattery safety factor ϑ v ratio of drone rise and drag
mtdrone unladen weightηenergy transfer efficiency
celectricity costs
Table 4. Simulation experimental parameters.
Parameter DescriptionParameterValueParameter DescriptionParameterValue
Rider speedvp25 km/hDrone speedvu57.6 km/h
Rider fixed costscp150 RMBDrone fixed costscu110 RMB
Rider unit ride costcp20.2 RMB/kmDrone unit travel costcu20.3 RMB/km
Maximum cargo capacity of electric vehiclesWkmax50 kgMaximum cargo capacity of droneWumax5 kg
Merchant meal preparation timetf5 minDrone unladen weight and battery weightmt + mb10.1 kg
Customer service timets3 minElectricity costsc0.66 RMB/kW
Battery safety factorμ1.25Energy transfer efficiencyη0.66
Ratio of drone rise and drag ϑ v 3.5Acceleration due to gravityg9.8 kg/N
Penalty cost 1ω10.5Penalty cost 2ω21
Table 5. Coordinates of the take-off point of the drone.
NumberXY
126001000
211003300
338004000
Table 6. Orders information for instance R1(50).
Distribution CenterNumberMerchant CoordinatesCustomer CoordinatesETLTWeight
11(2710, 908)(2975, 400)19 29 1.2
2(2614, 1012)(3375, 750)21 31 0.7
3(2545, 1023)(3150, 525)20 30 0.6
16(2572, 977)(2375, 1300)13 23 1.1
17(2614, 1012)(3075, 2775)40 50 0.7
218(1198, 3398)(450, 4900)40 50 1.2
19(1148, 3249)(150, 4500)36 46 0.6
20(1191, 3197)(450, 2850)21 31 1.3
34(1196, 3337)(2575, 1950)40 50 1.1
35(1048, 3299)(2600, 2150)40 50 1.4
336(3874, 3945)(3075, 3675)21 31 0.9
37(3928, 3944)(3525, 3525)16 26 0.7
38(3840, 3912)(3750, 3625)13 23 0.8
49(3874, 3945)(2975, 3150)29 39 1.4
50(3840, 3912)(4875, 4125)27 37 0.9
Table 7. Experimental results of instance R1(50).
R1(50)Traditional Rider DeliveryDrone–Rider Joint Delivery
Meal delivery costs663.3786644.4304
Penalty costs5.68160
Overall customer satisfaction98.0074%100.0000%
Number of riders1312
Table 8. Delivery routes in both models.
NumberRider DeliveryDrone–Rider Joint DeliveryNumberRider DeliveryDrone–Rider Joint Delivery
11-3-21-3-2835-3423-(44)-31-45
211-5-9-4-17-1511-5-9-4923-29-33-3250-(10)-7-6-8
36-7-10-812-13-14-(27)-26-301048-37-36-38-4948-38-37
416-12-13-1416-(34)-35-39-401139-4047-46-42-43-41
531-22-19-1821-22-19-181245-4436-(49)-15-17
624-21-20-25-2824-20-25-281343-46-42-50-47-41
726-27-3032-29-33
Table 9. Comparison of simulation experiment results under different instances.
Order VolumeR1(50)R2(75)R3(100)R4(125)R5(150)
Traditional
rider delivery
meal delivery costs663.3786869.65761230.38011401.79711529.8870
penalty costs5.68169.447315.837832.586160.1637
overall customer satisfaction98.0074%98.2671%97.4499%95.7050%92.6097%
number of riders1317242729
Drone–rider joint deliverymeal delivery costs644.4304758.0905973.6091151.99471266.9962
penalty costs06.66957.846820.347626.0462
overall customer satisfaction100.0000%98.9841%98.8018%97.5074%97.1342%
number of riders1212131823
Table 10. Damping factor λ.
Damping Factor λRider DeliveryDrone–Rider Joint Delivery
Meal Delivery CostsOverall Customer SatisfactionNumber of RidersMeal Delivery CostsOverall Customer SatisfactionNumber of Riders
0.1——————
0.21158.194999.9994%23646.957699.9930%12
0.3663.378698.0074%13644.4304100.0000%12
0.4709.136199.8250%14644.4304100.0000%12
0.5709.136199.8250%14644.604799.9994%12
0.6663.378698.0074%13644.604799.9994%12
0.7663.378698.0074%13644.604799.9994%12
0.8663.378698.0074%13644.604799.9994%12
0.9663.378698.0074%13644.604799.9994%12
Table 11. Comparison of algorithm experimental results.
CaseAlgorithmOptimal ValueWorst
Value
Average ValueStandard DeviationTime/sAverage Customer Satisfaction
R1
50
ITS644.43 644.44 644.43 0.0014 0.1618 100.000%
TS644.43 644.50 644.45 0.0281 0.1410 100.000%
VNS644.43 644.59 644.50 0.0408 0.2234 100.000%
WOA644.43 644.61 644.48 0.0401 1.7562 100.000%
GA644.43 644.50 644.45 0.0257 1.7563 100.000%
PSO644.43 651.38 645.41 1.4804 3.6469 99.806%
R3
100
ITS973.61 973.92 973.63 0.0603 0.4176 98.802%
TS973.61 974.81 973.71 0.2610 0.3791 98.739%
VNS973.69 975.99 975.22 0.5385 0.5207 98.647%
WOA973.63 979.84 975.81 1.6217 2.5825 98.504%
GA973.80 979.19 975.28 1.2092 3.0271 98.592%
PSO982.93 1010.65 996.87 7.5983 6.4289 96.352%
R5
150
ITS1267.00 1270.14 1268.59 0.4864 0.5997 97.049%
TS1267.57 1275.25 1270.60 2.4134 0.5422 96.889%
VNS1270.26 1285.90 1279.90 3.5920 0.8537 95.763%
WOA1274.47 1295.97 1284.31 5.0797 3.5512 95.562%
GA1273.71 1293.69 1284.39 4.2174 3.9468 95.612%
PSO1318.06 1375.57 1349.24 13.7427 9.0076 91.816%
Disclaimer/Publisher’s Note: The statements, opinions and data contained in all publications are solely those of the individual author(s) and contributor(s) and not of MDPI and/or the editor(s). MDPI and/or the editor(s) disclaim responsibility for any injury to people or property resulting from any ideas, methods, instructions or products referred to in the content.