


Abstract
Augmented reality (AR) can reduce the experiential distance between online product information and physical consumption, but interface attributes may influence purchase decisions through different psychological mechanisms. This study examines whether interactivity, vividness, and ease of use differentially shape perceived product value and attitude toward AR and whether these states transmit feature-specific effects to purchase intention in high-involvement furniture e-commerce. Drawing on the Stimulus–Organism–Response framework, survey data from 330 Vietnamese consumers with prior AR furniture-shopping experience were analyzed using partial least squares structural equation modeling. Interactivity and ease of use increased perceived product value but did not significantly improve attitude toward AR. Vividness affected both pathways and was the strongest antecedent of attitude toward AR. Perceived product value and attitude toward AR both increased purchase intention, with attitude showing the stronger association. Specific indirect effects showed that all three AR attributes operated through perceived product value, whereas only vividness produced a significant indirect effect through attitude. The study advances immersive-commerce research by disaggregating AR interface attributes while separating product-oriented cognitive appraisal from technology-oriented attitudinal evaluation, showing that vividness activates both pathways whereas usability and control operate mainly through product-value appraisal.
1. Introduction
Augmented reality (AR) is increasingly used in electronic commerce to reduce the experiential distance between digital product information and physical consumption. Instead of viewing a product only through photographs or video, shoppers can place a virtual representation in their own environment, change its orientation or attributes, and inspect how it fits a real setting [1,2]. This capability is especially relevant to immersive commerce, where digital interfaces are expected to support not merely information search but situated, interactive product evaluation. A recent meta-analysis confirms that AR and virtual reality generally improve retail outcomes while also showing substantial variation across technological features, psychological mechanisms, and contexts [3].
The commercial relevance of this shift is global rather than niche. One industry estimate valued the worldwide AR-in-retail market at USD 7.8 billion in 2024 and projects rapid expansion through 2033 [4]. Although such market forecasts should be interpreted as industry estimates rather than population statistics, they indicate that retailers are committing substantial resources to AR-enabled product visualization. Recent empirical studies likewise compare AR with conventional web shopping and show that AR attributes can alter user experience, engagement, and purchase-related responses across product and country contexts [5,6,7,8,9,10].
Furniture is a theoretically revealing category for studying these mechanisms. Furniture purchases commonly involve relatively high financial and functional commitment and depend on dimensions that are difficult to judge on a conventional screen, including spatial fit, color compatibility, scale, aesthetic coherence, and anticipated use. AR can reduce some of these uncertainties by embedding a virtual object in the consumer’s own space [11,12]. At the same time, furniture retains important tactile attributes, such as texture, softness, sturdiness, finish, and material quality, that visual augmentation cannot fully reproduce. The category therefore creates a useful tension between what an immersive interface can make cognitively easier to evaluate and what still requires physical verification.
Existing AR retail research has established links with engagement, product evaluation, technology attitudes, flow, immersion, perceived value, and purchase-related outcomes [5,6,7,8,9,10,12,13,14,15,16,17,18,19]. However, three limitations remain. First, many studies treat AR as a broad technological condition or emphasize a bundled experience, even though recent evidence shows that interactivity, vividness, usability, system quality, and reality congruence can exert different effects on cognitive and affective outcomes [5,6,7,8,9,10,20,21,22]. Interactivity gives users control; vividness provides perceptual richness and realism; ease of use reduces effort. Treating these attributes as psychologically equivalent can therefore conceal the specific design mechanisms responsible for behavioral responses.
Second, the internal-response component of AR models is often represented by a single mediator or by several constructs whose psychological roles are not explicitly differentiated. This study separates perceived product value from attitude toward AR. Perceived product value refers to a consumer’s appraisal of the benefits and utility associated with the product relative to relevant sacrifices, whereas attitude toward AR refers to the consumer’s overall favorable or unfavorable evaluation of AR as a shopping technology. The two evaluations are related but not interchangeable. A feature can make a product easier to judge without making the technology itself more appealing; conversely, a vivid and enjoyable interface can improve technology attitudes beyond its contribution to instrumental product evaluation.
Third, the literature still needs stronger evidence about how these distinctions operate for high-involvement products in emerging digital markets. The Vietnamese setting offers a relevant empirical context because smartphone-based commerce is widespread while consumer experience with immersive retail applications remains uneven. The purpose is not to claim that a non-probability sample represents Vietnamese consumers as a whole. Rather, the setting provides a useful test among consumers who have actually used AR for furniture or interior shopping, thereby reducing the risk of asking inexperienced respondents to evaluate an unfamiliar technology.
Accordingly, the study pursues two explicit objectives. The first is to estimate the distinct effects of interactivity, vividness, and ease of use on two theoretically different organism states: perceived product value and attitude toward AR. The second is to test whether each interface attribute reaches purchase intention through a cognitive product-appraisal pathway, an attitudinal technology-evaluation pathway, or both. These objectives lead to the research question: do different AR interface attributes activate distinct cognitive and attitudinal pathways to purchase intention in high-involvement furniture e-commerce? The conceptual model uses the Stimulus–Organism–Response (S-O-R) framework as its organizing logic. Interactivity, vividness, and ease of use are modeled as interface-related stimuli; perceived product value and attitude toward AR represent distinct organism states; and purchase intention is the behavioral response. The Technology Acceptance Model (TAM) is used selectively to support the role of ease of use rather than as a competing overarching framework.
The contribution of the study is not the proposition that AR can influence shopping outcomes; that relationship is increasingly well documented. Instead, the contribution lies in identifying feature–mechanism asymmetry within a high-involvement, spatially dependent product category. First, the study moves from the question of whether AR is effective to the more diagnostic question of which AR attributes matter and through what mechanisms. Second, it refines the organism component of S-O-R by separating cognitive product appraisal from attitudinal technology evaluation. Third, it tests these two pathways simultaneously and shows that they are empirically non-equivalent: interactivity and ease of use primarily strengthen product-value appraisal, whereas vividness activates both product-value and technology-attitude pathways. This feature-by-mechanism explanation is more precise than treating AR quality as a single undifferentiated construct and provides a direct bridge from theory to interface design.
2. Theoretical Background and Hypothesis Development
2.1. AR-Enabled Immersive Commerce and High-Involvement Product Evaluation
AR combines digitally generated objects with the user’s physical surroundings and permits interaction with those objects in real time [1,2]. In online retail, this creates a form of situated product presentation in which information is embedded in the environment where the product may eventually be used. Prior research shows that AR can enhance spatial presence, decision comfort, product understanding, and online service experience by providing simulated physical control and environmental embedding [11,23]. These advantages are particularly relevant when product suitability depends on contextual visualization rather than on isolated product attributes.
High-involvement furniture shopping makes this situated function especially salient. Consumers need to infer whether a product fits a room, complements existing objects, and meets expectations regarding scale and appearance. Interactivity can support active inspection; vividness can improve realism and perceptual diagnosticity; ease of use can lower the effort required to obtain these benefits. Recent furniture-specific evidence likewise links AR interactivity, effort expectancy, and multidimensional customer experience to purchase intention [24]. Yet each attribute represents a different design problem. Treating them as a single AR-quality score would blur the distinction between control, perceptual richness, and usability.
2.2. Stimulus–Organism–Response as the Organizing Framework
The S-O-R framework proposes that environmental stimuli influence behavioral responses by first changing internal psychological states [25]. In digital commerce, interface cues can therefore be conceptualized as stimuli that alter consumers’ cognitive and evaluative reactions before affecting behavioral intention. The framework is particularly suitable for AR because AR changes the environment in which product information is perceived and manipulated rather than simply adding another textual information source.
This study distinguishes two organism states. Perceived product value is treated as a cognitive appraisal because it captures the consumer’s judgment of what the product offers relative to relevant sacrifices [26]. Attitude toward AR is an attitudinal evaluation of the technology as a shopping tool. This distinction also aligns with recent mobile-AR evidence showing that cognitive and attitudinal responses can follow different antecedent patterns [18]. The model therefore does not use ‘customer engagement’ as an umbrella construct for these variables; they are theoretically separate mediating mechanisms.
TAM provides a complementary rationale for ease of use. TAM argues that a technology requiring less effort is more likely to be evaluated favorably and accepted [27]. In the present model, however, ease of use is considered one AR interface attribute among several, and the central theoretical claim concerns whether it affects product-value appraisal and technology attitude in the same way as interactivity and vividness.
2.3. Interactivity
Interactivity refers to the extent to which consumers can actively manipulate the AR presentation and obtain responsive feedback. In furniture applications, this may include rotating, repositioning, resizing, or changing visual attributes of a virtual item. Such control allows users to inspect alternatives and test product–context combinations rather than passively receiving information. Prior AR studies associate interactivity with stronger engagement, perceived usefulness, flow, and product-related value [11,12,13].
The product-value mechanism follows from decision diagnosticity. When consumers can manipulate a virtual furniture item, they can obtain information that is directly relevant to spatial fit and aesthetic compatibility. This should improve the perceived usefulness of the product offering and reduce evaluation uncertainty. Interactivity may also improve attitudes toward the technology because responsive control can make the shopping process feel empowering and engaging. Nevertheless, this attitudinal effect is theoretically distinct from the product-evaluation benefit.
Empirical evidence supports this distinction but also shows that interactivity does not produce uniform outcomes. Yim et al. link interactivity to immersion, usefulness, and enjoyment in AR commerce [11], while Arghashi and Yuksel associate interactive AR with flow, inspiration, and perceived usefulness [13]. Comparative IKEA research shows that interactive control can improve cognitive and behavioral responses, including product liking and purchase confidence [5,17]. More recent studies find that interactivity contributes to telepresence, engagement, user experience, utilitarian or hedonic value, and purchase intention [6,7,8,20,21]. At the same time, Dogra et al. report a non-significant interactivity-to-attitude relationship in an AR e-commerce setting [28]. This mixed evidence is important: interactivity may reliably improve what consumers can do with product information without necessarily making the technology itself more favorably evaluated. The present model therefore tests its product-value and AR-attitude effects separately.
H1.
Interactivity positively affects perceived product value.
H2.
Interactivity positively affects attitude toward AR.
2.4. Vividness
Vividness is the perceptual richness, clarity, and realism with which the AR environment represents product information. In immersive retail, vivid presentations provide multiple visual cues and can make a virtual object appear more congruent with the physical setting. Research has linked vividness with presence, enjoyment, product attitude, and willingness to buy [11,14,29]. Recent evidence also indicates that reality congruence and high-quality AR presentation can improve purchase confidence and app-related evaluations [18].
For furniture, vividness should strengthen perceived product value because realistic visualization improves the consumer’s ability to inspect shape, color, proportions, and contextual compatibility. It should also affect attitude toward AR because sensory richness is part of the experience of the technology itself. A realistic AR representation can make the interface feel more impressive, credible, and enjoyable. Compared with interactivity and ease of use, vividness therefore has a stronger theoretical basis for activating both the cognitive and attitudinal pathways.
The empirical literature assigns a particularly broad role to vividness. Early AR research linked vivid presentation to immersion, usefulness, enjoyment, and purchase-related evaluations [11,29]. Subsequent studies show that vividness can enhance flow and immersive experience [14], user experience and purchase intention [5], media usefulness and enjoyment [6], engagement and satisfaction [7], and utilitarian and hedonic value [8]. Recent evidence further indicates that vividness is especially influential for affective responses and may be more consequential for first-time than habitual AR users [9], while e-commerce research continues to identify vividness as a salient antecedent of consumer perceptions and attitudes [10]. Because furniture evaluation depends heavily on visual realism, scale, and environmental congruence, these findings support testing vividness against both organism states rather than assigning it only to an experiential pathway.
H3.
Vividness positively affects perceived product value.
H4.
Vividness positively affects attitude toward AR.
2.5. Ease of Use
Ease of use is the degree to which interacting with the AR application is perceived as requiring little effort [27]. AR interfaces can impose cognitive and operational costs if object placement is unstable, controls are difficult to understand, or the user must repeatedly adjust the device. A usable interface reduces these frictions and allows consumers to concentrate on the product rather than on learning the technology [12].
Lower interaction effort should strengthen perceived product value because consumers can extract relevant information more efficiently. Ease of use may also support a more favorable attitude toward AR by reducing frustration and perceived complexity. However, unlike vividness, usability is primarily an enabling condition: once a minimum usability threshold is met, additional ease may add less to the experiential appeal of the technology.
Evidence on ease of use is more context-dependent. TAM positions perceived ease as a core antecedent of technology evaluation [27], and AR shopping studies have associated usability with adoption, perceived value, engagement, and favorable technology attitudes [30,31,32,33]. Recent research in online shopping likewise shows that ease of use can contribute to perceived value and adoption intentions [30], while telepresence-based work finds significant paths from ease of use to both attitude and intention [33]. In a Vietnamese online-shopping context, perceived ease of use also significantly predicts attitude toward AR [34]. Yet experienced users may respond differently because basic usability can become an expected condition rather than a source of positive affect. This possibility motivates separate tests of the product-value and attitude pathways instead of assuming that ease of use must affect both equally.
H5.
Ease of use positively affects perceived product value.
H6.
Ease of use positively affects attitude toward AR.
2.6. Perceived Product Value, Attitude Toward AR, and Purchase Intention
Perceived product value captures an overall assessment of product benefits relative to sacrifices [26]. In AR shopping, this assessment can improve when consumers are able to inspect a product in context, compare alternatives, and reduce uncertainty about suitability [19,29]. Empirical studies consistently link AR-enabled value creation to behavioral outcomes. Value-based adoption research finds that perceived value is a central mechanism connecting AR benefits and sacrifices to online purchase intention [31], while recent work shows that AR app performance and task-technology fit increase perceived product value [22]. Perceived value also contributes to psychological ownership in AR shopping [35], and experimental evidence indicates that AR presentation can raise perceived product value and purchase intention relative to static images [19]. Across broader immersive-retail research, cognitive utility, decision comfort, and value-related evaluations repeatedly predict purchase or use intentions [8,17,36,37]. These findings support a positive product-value-to-purchase-intention relationship.
Attitude toward AR captures the consumer’s overall favorable or unfavorable evaluation of AR as a shopping tool. Favorable technology attitudes can increase willingness to rely on AR-delivered information and translate an immersive encounter into behavioral intention. Prior research links AR attitudes with continued use and purchase-related intentions [12,18,31,32]. More recent studies show that perceived ease, usefulness, enjoyment, and value shape attitudes that subsequently predict intention [10,30,33,34]. Evidence from presence-based AR research also confirms that immersive evaluations and technology-related responses can meaningfully influence purchase intention [36,37]. Accordingly, attitude toward AR is treated as a distinct proximal predictor of purchase intention rather than as a synonym for perceived product value.
H7.
Perceived product value positively affects purchase intention.
H8.
Attitude toward AR positively affects purchase intention.
2.7. Feature-Specific Indirect Pathways
The S-O-R structure implies that interface stimuli affect behavioral responses through internal evaluations. This mediation logic is well established in AR commerce. Cognitive mechanisms such as usefulness, informativeness, processing fluency, decision comfort, perceived value, and engagement have been shown to transmit effects from AR characteristics to purchase-related outcomes [6,13,17,22,23,31]. Recent e-commerce studies also report mediated relationships from AR attributes through usefulness, enjoyment, satisfaction, or value to behavioral intention [10,30,33,38]. The present study tests this logic at the level of individual AR attributes rather than aggregating the three stimuli. If interactivity, vividness, and ease of use improve perceived product value, and perceived product value predicts purchase intention, each attribute should exhibit a positive specific indirect effect through the cognitive appraisal pathway.
A parallel set of indirect effects is expected through attitude toward AR. Prior work shows that AR-generated affective responses, attitudes, and experiential evaluations can mediate the relationship between technological cues and purchase or reuse intentions [9,16,18,32,33,36]. However, the three attributes need not be equally strong. Vividness directly changes realism and sensory richness, whereas interactivity and ease of use may function more instrumentally. The model therefore tests the three attitude-mediated effects separately instead of assuming a common omnibus mediation process.
H9a.
Interactivity has a positive indirect effect on purchase intention through perceived product value.
H9b.
Vividness has a positive indirect effect on purchase intention through perceived product value.
H9c.
Ease of use has a positive indirect effect on purchase intention through perceived product value.
H10a.
Interactivity has a positive indirect effect on purchase intention through attitude toward AR.
H10b.
Vividness has a positive indirect effect on purchase intention through attitude toward AR.
H10c.
Ease of use has a positive indirect effect on purchase intention through attitude toward AR.
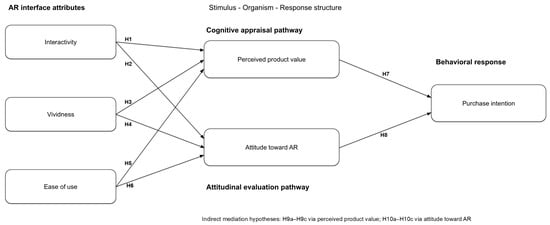
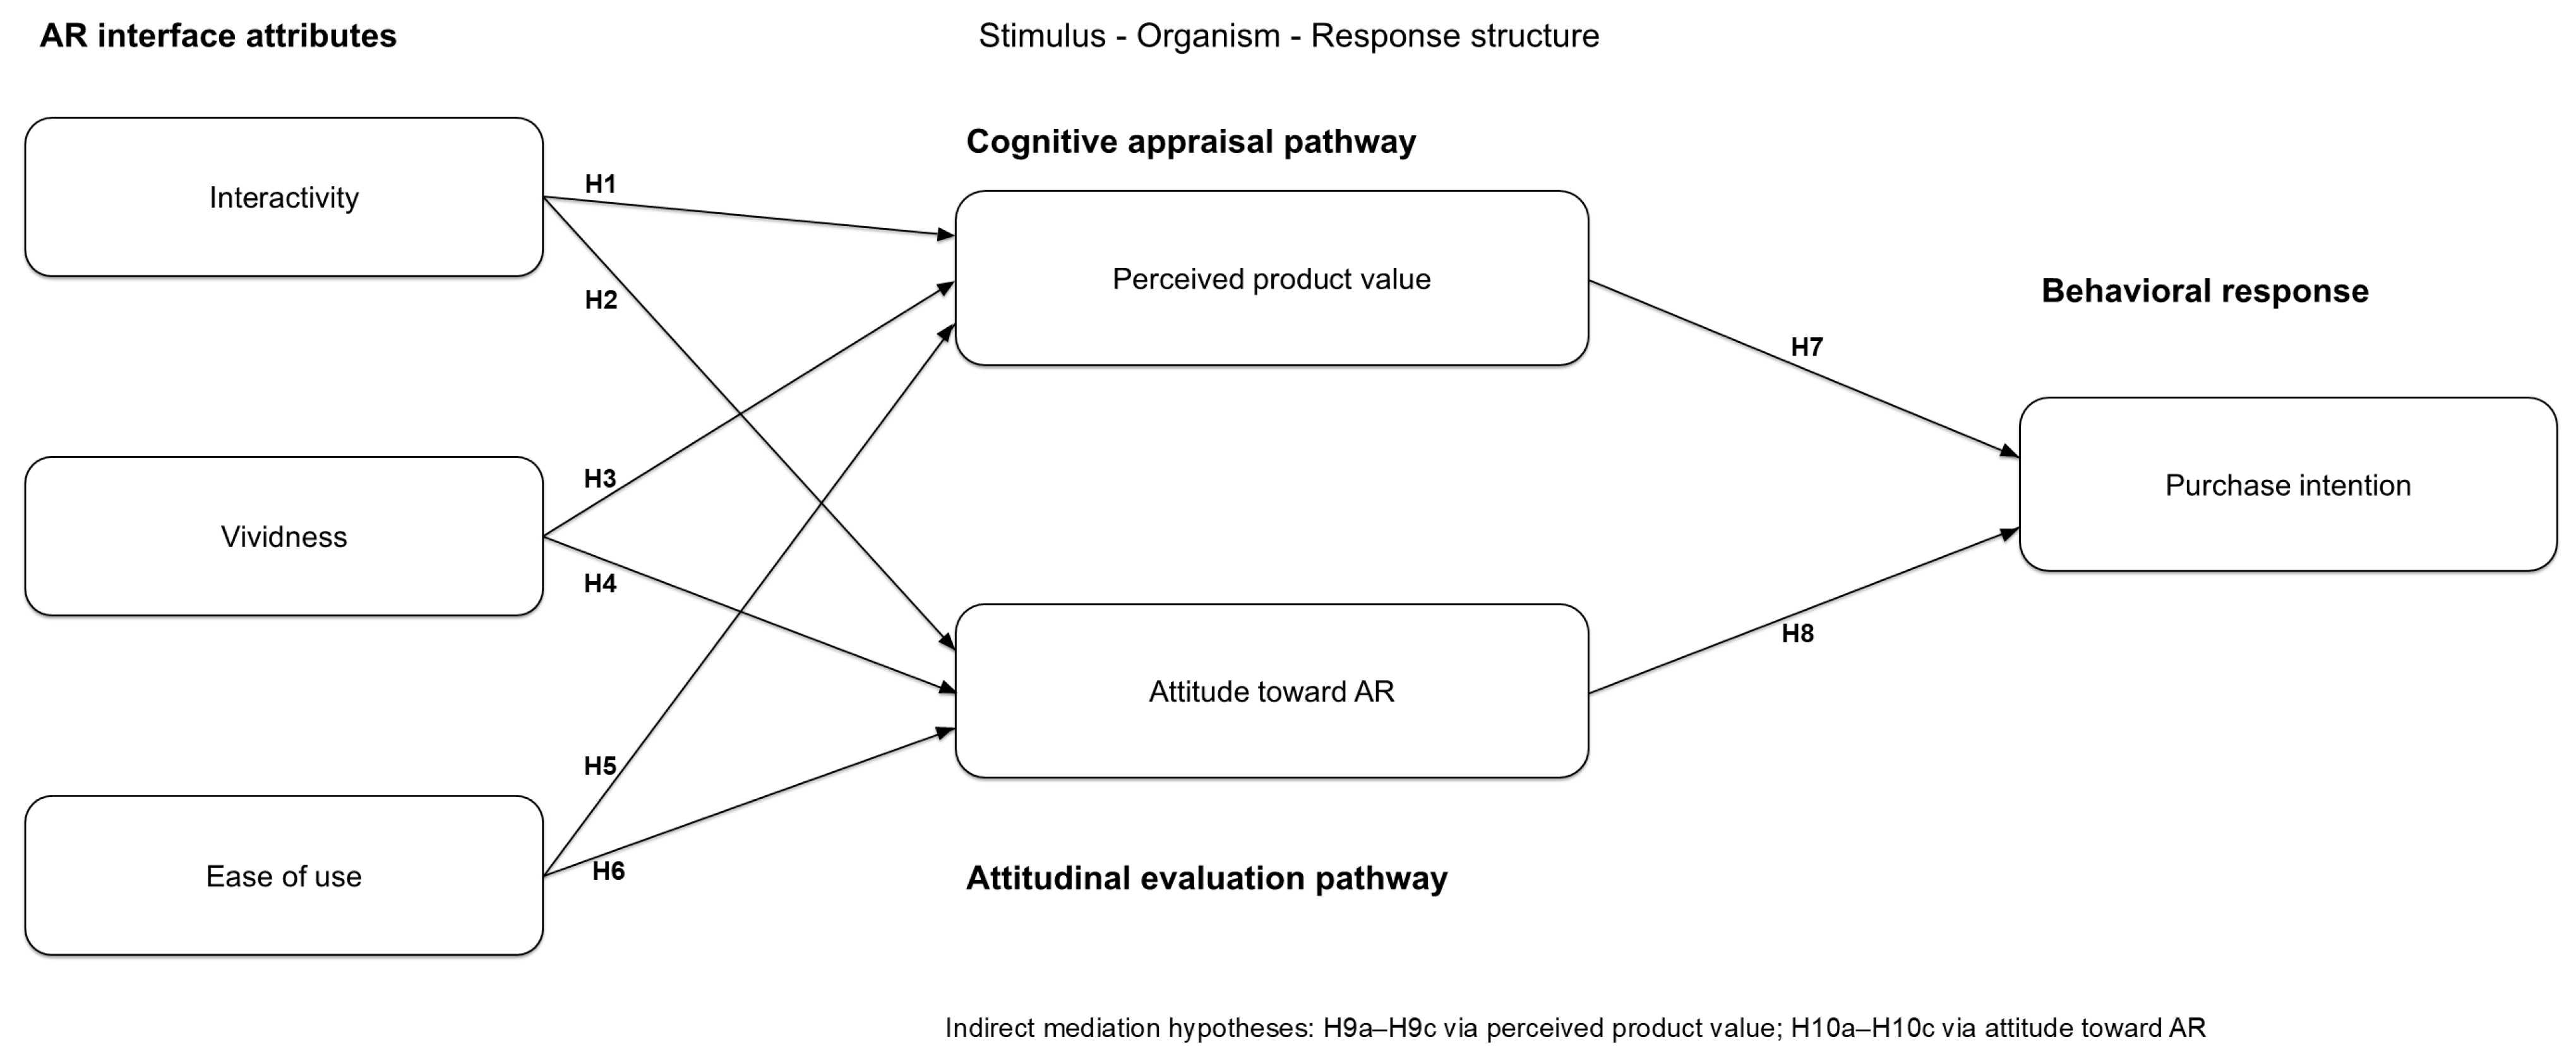
The proposed relationships and hypothesis mapping are summarized in Figure 1.
Figure 1.
Research framework.
3. Materials and Methods
3.1. Research Design and Empirical Context
The study used a cross-sectional survey design to test the proposed model among consumers with prior experience using AR for furniture or interior shopping in Vietnam. Restricting participation to experienced users was important because the constructs require respondents to evaluate concrete interface characteristics rather than hypothetical descriptions of AR. The research focused on the shopping experience rather than on a specific retailer or AR platform so that the model captured perceptions across different furniture-shopping interfaces.
The survey was complemented by five post-analysis expert interviews with furniture sales practitioners and interior designers to contextualize the quantitative results. The interviews were not treated as a separate qualitative study and were not used to claim triangulated causal evidence. Their purpose was to assess whether the statistical pattern was consistent with practical constraints in furniture selling and design presentation.
3.2. Sampling and Data Collection
Criterion-based purposive sampling was used because eligibility required prior AR experience in the relevant shopping context. Recruitment relied primarily on commercial consumer panels operated by Cimigo and Decision Lab and was supplemented by targeted Facebook and TikTok advertisements. This approach improved access to respondents who could evaluate concrete AR interface attributes rather than hypothetical technology descriptions. The trade-off is weaker statistical generalizability than under probability sampling; accordingly, the results are interpreted as relationships within an experience-defined sample rather than as nationally representative estimates. Eligible respondents had to be at least 18 years old, reside in Vietnam, and report actual use of an AR application for furniture or interior shopping.
Data were collected between January and March 2026 in Hanoi, Ho Chi Minh City, Da Nang, and Hai Phong. The geographic spread was intended to capture consumers from four major urban markets while keeping the data-collection period relatively compact. The questionnaire required approximately 10–15 min to complete. Respondents received a MoMo e-voucher worth VND 20,000 as modest compensation for their time.
A total of 381 responses were collected. During data-quality screening, 51 responses were excluded because of incomplete answers, straight-lining response patterns, implausibly short completion times, or failure of simple attention-check items. The final analytical sample therefore comprised 330 usable responses (86.6% of the initial responses). Sample adequacy was evaluated against PLS-SEM requirements rather than the imprecise “10-times rule”. For the most complex endogenous equation in the model (three predictors), a conventional power benchmark of alpha = 0.05, power = 0.80, and a medium effect size (f2 = 0.15) implies a minimum sample of approximately 77 observations; the sample therefore provides a substantial margin for structural estimation [39,40].
3.3. Instrument Development and Measures
The questionnaire was developed from established measures in AR, technology-acceptance, and consumer-value research. Before the main survey, five experts—two academics and three practitioners with expertise in AR technology, marketing, and furniture retailing—reviewed the instrument for construct coverage, wording clarity, cultural appropriateness, redundancy, and logical flow. Their feedback led to minor wording and ordering adjustments. Expert review was used to strengthen content validity and contextual relevance, consistent with recommended scale-development practice [41].
All constructs were modeled reflectively and measured on five-point Likert scales ranging from 1 (strongly disagree) to 5 (strongly agree). Interactivity was measured with four items, vividness with four items, ease of use with five items, perceived product value with five items, attitude toward AR with three items, and purchase intention with three items. The construct definitions follow the established conceptualizations used in AR retail and technology research [11,12,26,27,29].
3.4. Data Analysis
Partial least squares structural equation modeling (PLS-SEM) was conducted in SmartPLS 4. The analysis followed the conventional two-stage sequence: first, the reflective measurement models were assessed for indicator reliability, internal consistency, convergent validity, and discriminant validity; second, the structural model was examined through collinearity diagnostics, path coefficients, explained variance, effect sizes, predictive relevance, and specific indirect effects [39,42]. Statistical inference relied on nonparametric bootstrapping with 5000 resamples. Stone–Geisser’s Q2 was calculated using blindfolding with an omission distance of 7; the same dataset and model specification were retained throughout.
For reflective measurement, outer loadings of approximately 0.70 or higher were considered satisfactory. Internal consistency was evaluated using Cronbach’s alpha, rho_A, and composite reliability (rho_C), with values above 0.70 indicating acceptable reliability [43]. Convergent validity was assessed through average variance extracted (AVE), using 0.50 as the minimum criterion. Discriminant validity was evaluated using both the Fornell–Larcker criterion [44] and the heterotrait-monotrait ratio (HTMT), which is more sensitive to discriminant-validity problems in variance-based SEM [45]. Structural-model collinearity was assessed through variance inflation factors (VIFs); R2 values summarized explanatory power; and f2 values assessed each predictor’s contribution to an endogenous construct. Blindfolding Q2 values above zero were interpreted as evidence of predictive relevance. Because Q2 is an in-sample predictive-relevance measure, it was not interpreted as evidence of out-of-sample predictive accuracy [46]. Specific indirect effects were used to evaluate H9a–H10c.
4. Results
4.1. Sample Profile
The sample was relatively young. Respondents aged 18–25 accounted for 55.46%, those aged 26–35 for 35.45%, and those aged 36–45 for 9.09%. Women represented 59.70% of the sample and men 40.30%. No gender quota was imposed; therefore, the female majority is a characteristic of the realized non-probability sample rather than a population estimate. Differential response propensities across the commercial-panel and social-media recruitment channels may have contributed to this composition, but channel-specific response rates were not retained and this explanation cannot be tested directly. The demographic profile should therefore be used to describe the sample, not to infer that women or younger consumers are intrinsically more responsive to furniture AR. Table 1 summarizes the demographic profile of the final sample.
Table 1.
Sample characteristics (N = 330).
4.2. Measurement Model
All indicator loadings exceeded 0.75 and were statistically significant, supporting indicator reliability. Cronbach’s alpha ranged from 0.783 to 0.879, rho_A from 0.804 to 0.891, and composite reliability from 0.874 to 0.917. AVE values ranged from 0.635 to 0.778, exceeding the 0.50 criterion. Indicator loadings are reported in Table 2; Cronbach’s alpha is presented in part (a) of Table 3, while part (b) of Table 3 reports the full reliability and convergent-validity statistics. The results support satisfactory internal consistency and convergent validity.
Table 2.
Reflective indicator loadings.
Table 3.
(a) Cronbach’s alpha by construct. (b) Construct reliability and convergent validity.
Part (a) of Table 4 reports the Fornell–Larcker assessment, in which each construct’s square root of AVE exceeded its correlations with the other constructs. Part (b) of Table 4 provides the more stringent HTMT assessment. Most HTMT ratios were below 0.90; however, the interactivity-vividness ratio was 0.950, indicating substantial empirical overlap. A 5000-resample percentile bootstrap yielded a 95% confidence interval of 0.902–0.991 for this critical pair; because the interval did not include 1.00, the HTMT inference test still supported empirical distinctness [45]. Under the stricter 0.85 heuristic, the ATTI-PI pair and several pairs involving vividness also exceeded the threshold. Discriminant validity is therefore supported overall, but the interactivity–vividness distinction should be interpreted cautiously.
Table 4.
(a) Fornell–Larcker criterion. (b) Heterotrait-monotrait ratio (HTMT).
4.3. Structural Model and Direct Effects
All predictor VIFs were below 3.2, indicating no problematic structural collinearity under conventional thresholds. The model explained 62.3% of the variance in perceived product value (adjusted R2 = 0.620), 55.7% of the variance in attitude toward AR (adjusted R2 = 0.553), and 57.9% of the variance in purchase intention (adjusted R2 = 0.577). Direct effects are reported in part (a) of Table 5, while part (b) of Table 5 reports f2 effect sizes. Blindfolding produced Q2 values of 0.423 for attitude toward AR, 0.389 for perceived product value, and 0.396 for purchase intention (part (c) of Table 5). All three values were above zero, supporting predictive relevance for the endogenous constructs.
Table 5.
(a) Structural-model results for direct effects. (b). Effect sizes (f2) for structural paths. (c) Blindfolding predictive relevance (Q2).
Part (b) of Table 5 shows that vividness had a medium effect on attitude toward AR (f2 = 0.265), while attitude toward AR had a medium-to-large effect on purchase intention (f2 = 0.340). The remaining significant structural paths had small effects (f2 = 0.087–0.106). The non-significant paths from ease of use and interactivity to attitude toward AR had negligible effect sizes (f2 = 0.005 and 0.011, respectively).
The direct effects differed across the three AR attributes. Interactivity had a significant positive effect on perceived product value (beta = 0.350, p < 0.001) but its effect on attitude toward AR was not significant at the 5% level (beta = 0.124, p = 0.089). Thus, H1 was supported and H2 was not supported. Interactivity appears to operate primarily as an instrumental product-evaluation mechanism in this sample.
Vividness significantly predicted both perceived product value (beta = 0.321, p < 0.001) and attitude toward AR (beta = 0.608, p < 0.001), supporting H3 and H4. The coefficient for vividness to attitude was the largest antecedent effect in the model, consistent with the proposition that visual realism influences both what consumers infer about the product and how they evaluate the AR experience.
Ease of use positively affected perceived product value (beta = 0.229, p < 0.001), supporting H5, but had no significant effect on attitude toward AR (beta = 0.058, p = 0.283), so H6 was not supported. This finding is consistent with a threshold interpretation of usability: a usable interface can facilitate product evaluation without necessarily making the technology more attractive in its own right.
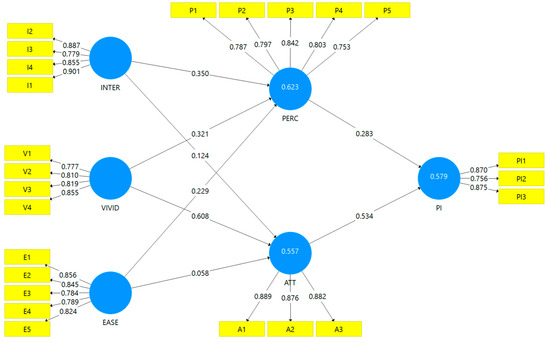
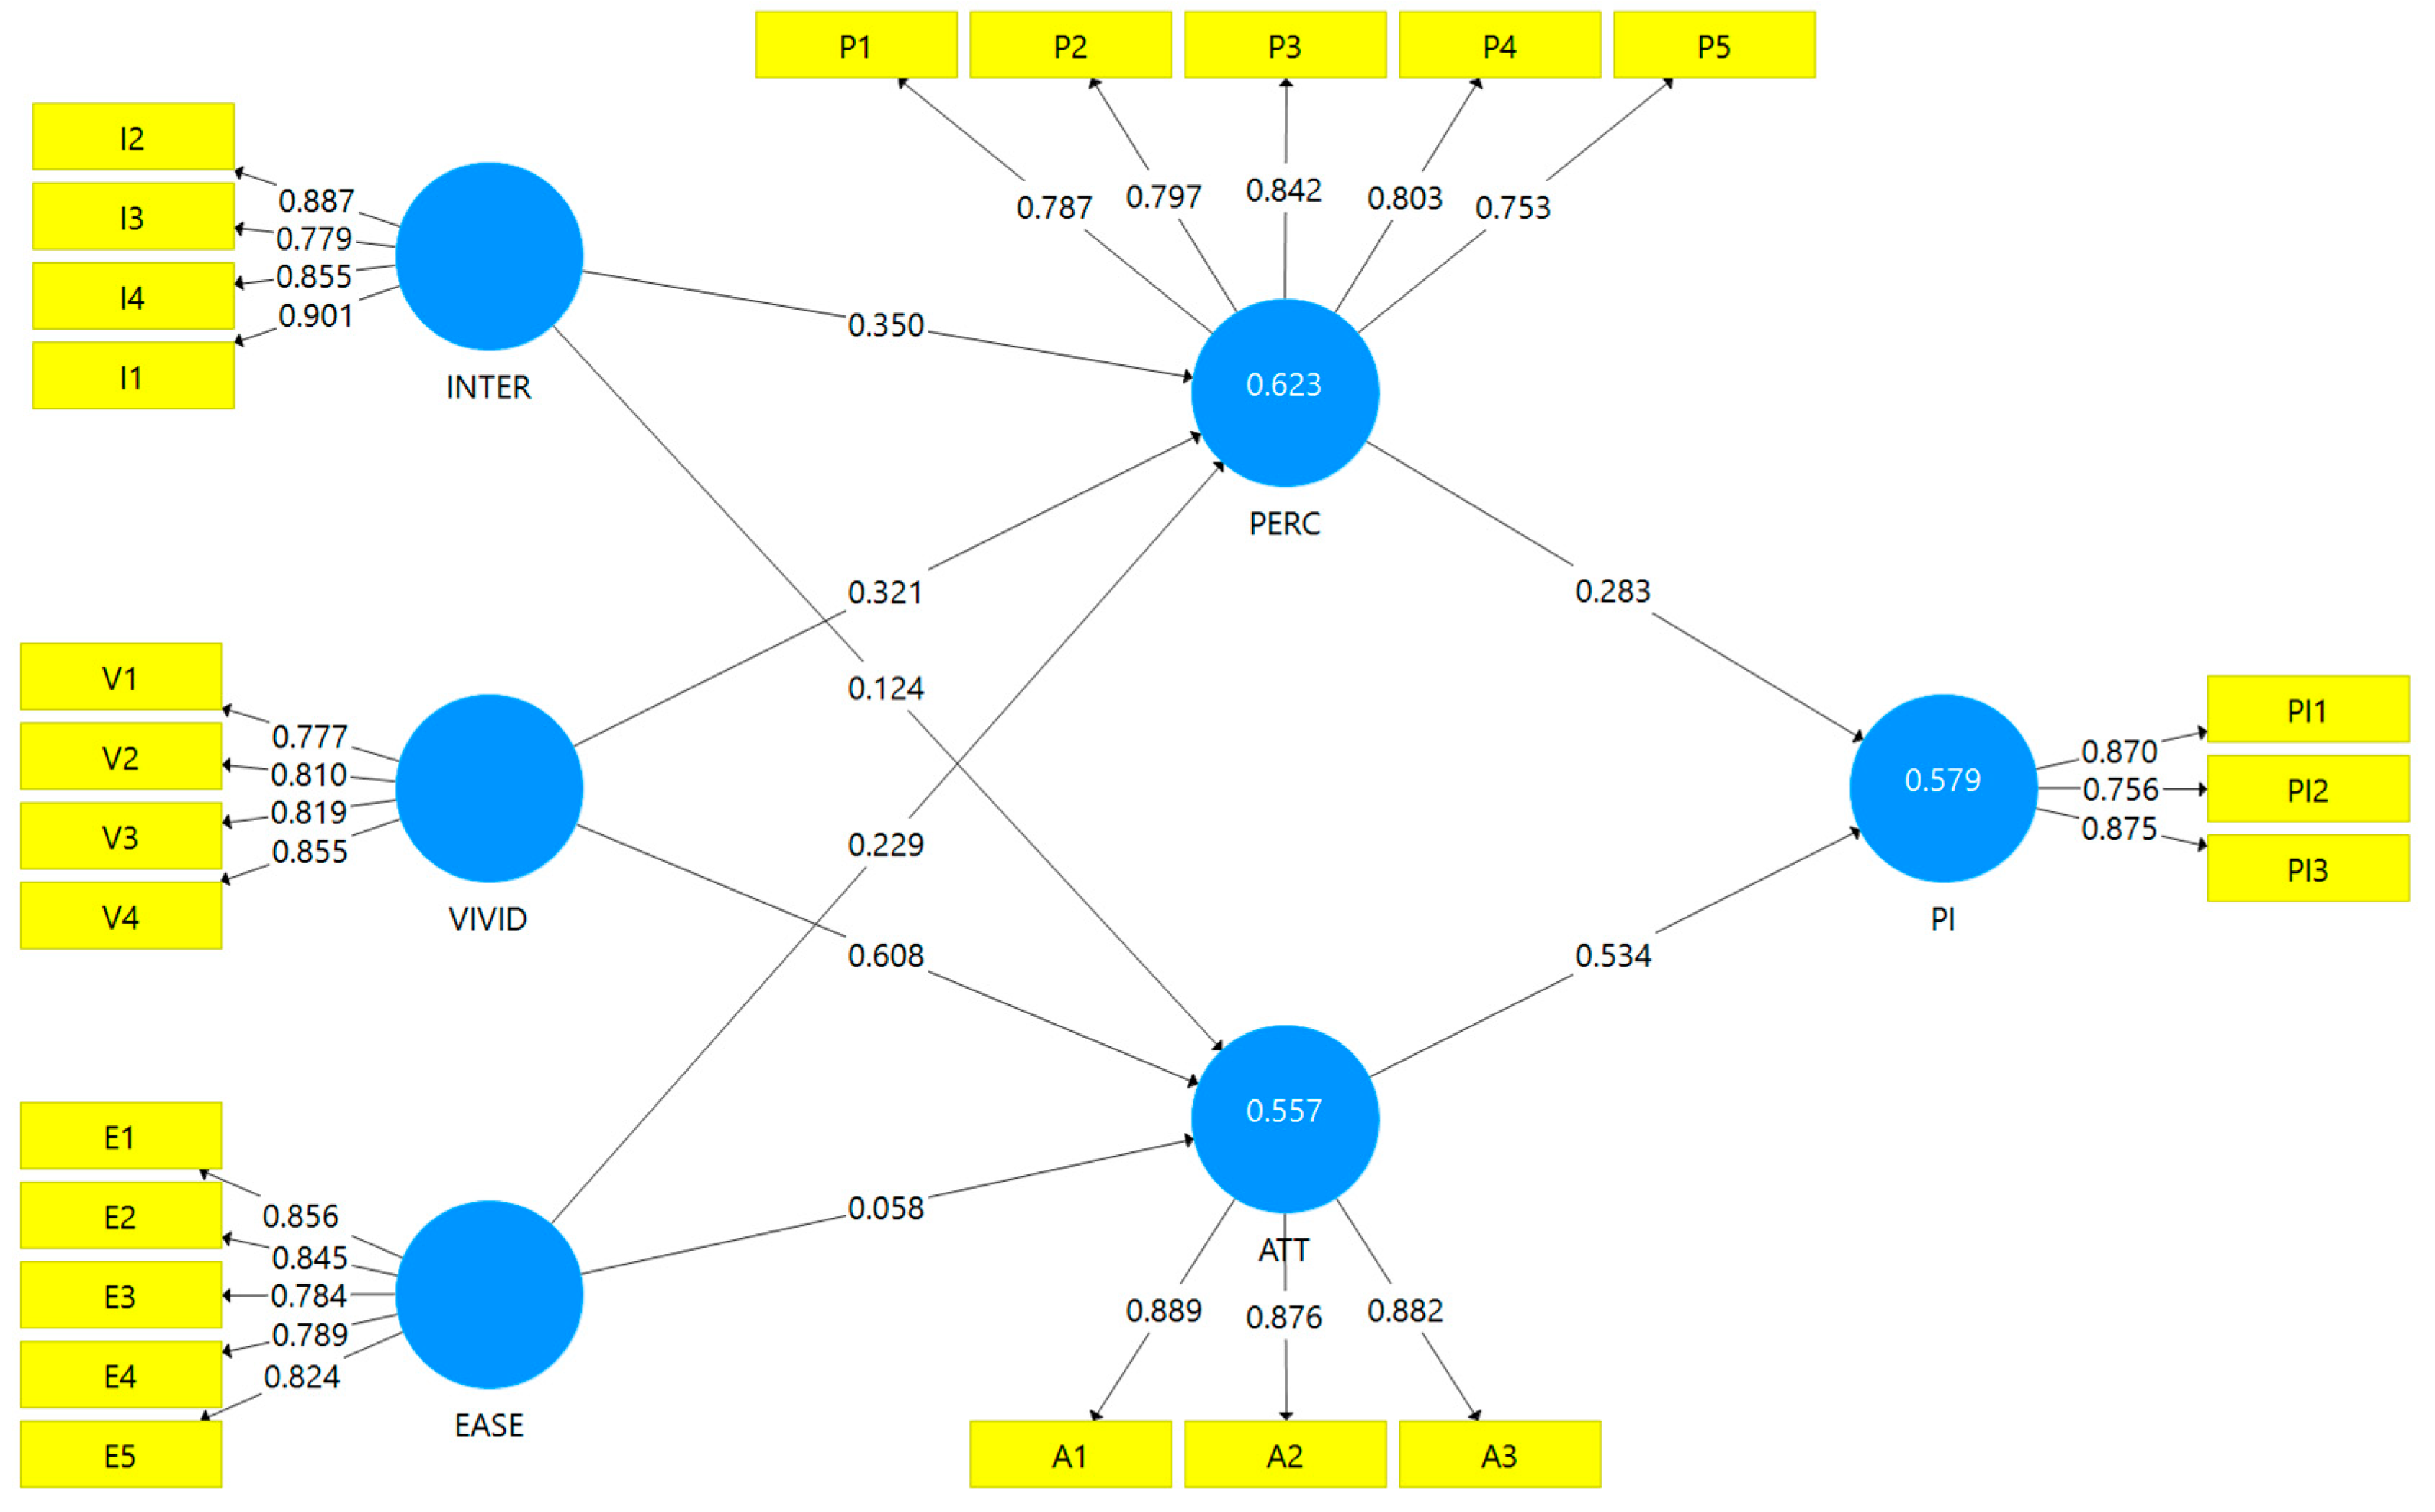
Both organism states were significant predictors of purchase intention. Perceived product value positively affected purchase intention (beta = 0.283, p < 0.001), supporting H7. Attitude toward AR had a stronger positive association (beta = 0.534, p < 0.001), supporting H8. Figure 2 summarizes the estimated PLS-SEM model, combining standardized outer loadings with structural path coefficients and R2 values.
Figure 2.
PLS-SEM measurement and structural model results. Note: Values adjacent to indicators are standardized outer loadings; values on structural paths are standardized path coefficients; values inside constructs are R2 values.
4.4. Specific Indirect Effects
Table 6 reports the specific indirect effects used to evaluate H9a–H10c. Accordingly, all three AR attributes had significant specific indirect effects on purchase intention through perceived product value: interactivity (beta = 0.099, p < 0.001), vividness (beta = 0.091, p = 0.002), and ease of use (beta = 0.065, p < 0.001). H9a–H9c were therefore supported. This consistency reinforces the role of the cognitive appraisal pathway as a common mechanism through which AR design characteristics can influence purchase intention.
Table 6.
Specific indirect effects.
All three AR attributes had significant specific indirect effects on purchase intention through perceived product value: interactivity (beta = 0.099, p < 0.001), vividness (beta = 0.091, p = 0.002), and ease of use (beta = 0.065, p < 0.001). H9a–H9c were therefore supported. This consistency reinforces the role of the cognitive appraisal pathway as a common mechanism through which AR design characteristics can influence purchase intention.
The attitudinal pathway was selective. Vividness had a large and significant indirect effect through attitude toward AR (beta = 0.325, p < 0.001), supporting H10b. The corresponding indirect effects for interactivity (beta = 0.066, p = 0.095) and ease of use (beta = 0.031, p = 0.281) were not significant, so H10a and H10c were not supported. The corresponding total indirect effects were 0.165 for interactivity, 0.416 for vividness, and 0.096 for ease of use, with vividness showing the largest overall indirect association with purchase intention.
4.5. Contextual Expert Insights
The five industry interviews were consistent with the statistical emphasis on vividness and product evaluation. The furniture sales practitioners emphasized that AR helps customers judge dimensions, colors, and design compatibility in their own space and can reduce dependence on large physical showrooms. The interior designers similarly stressed that the credibility of AR depends on how closely the visualization resembles the eventual product and room outcome.
All experts also identified a boundary of visual immersion: AR cannot fully reproduce tactile properties such as fabric feel, softness, solidity, surface finish, or material quality. For high-value furniture, these attributes can remain decisive. The interviews therefore suggest that AR is best understood as a powerful visualization and evaluation layer within an omnichannel journey rather than as a complete substitute for physical product experience.
5. Discussion
5.1. Interpreting the Feature-Specific Pattern
The results show that the three AR attributes operate through different psychological routes. Interactivity, vividness, and ease of use all strengthen perceived product value, yet only vividness significantly improves attitude toward AR. This asymmetry supports a feature-specific interpretation of immersive commerce and challenges models that treat AR quality or AR experience as a homogeneous stimulus.
Interactivity has the strongest coefficient among the three predictors of perceived product value (beta = 0.350), which is consistent with research linking simulated physical control and interactive manipulation to usefulness, decision comfort, engagement, and value creation [6,8,13,17,23]. The result also aligns with recent furniture and retail evidence showing that interactivity can improve utilitarian or task-relevant evaluations [5,21,22]. However, interactivity does not significantly improve attitude toward AR in the present model. This divergence is noteworthy because several studies report positive experiential or attitudinal effects of interactivity [7,11,20], whereas Dogra et al. similarly find no significant interactivity effect on attitude in an AR e-commerce model [28]. The present evidence therefore supports a context-dependent interpretation rather than a universal interactivity-to-attitude relationship.
Ease of use shows a similar but weaker pattern. Its significant association with perceived product value indicates that usability supports efficient product evaluation, consistent with value-based AR adoption studies [30,31]. Yet ease of use does not significantly predict attitude toward AR, which contrasts with studies in other online-shopping contexts where ease of use contributes to attitude or intention [33,34]. A plausible boundary condition is prior experience: because all respondents had already used AR for furniture/interior shopping, basic usability may have functioned as a hygiene factor rather than a source of attitudinal enthusiasm. This explanation remains provisional because experience intensity was not modeled directly.
Vividness is different. It significantly predicts both perceived product value and attitude toward AR and produces by far the largest specific indirect effect through attitude. This pattern is consistent with recent studies in which vividness improves telepresence, enjoyment, engagement, satisfaction, value perceptions, or behavioral intention [6,7,8,9,10]. It is also compatible with evidence that vividness can exert especially strong affective effects among less-habituated users [9]. For furniture, the result is theoretically coherent because realism directly addresses visual uncertainty about scale, spatial fit, color, and aesthetic compatibility while simultaneously shaping the perceived quality of the AR encounter itself. Thus, vividness operates as both an informational cue and an experiential cue, whereas interactivity and usability are more predominantly instrumental in this sample.
5.2. Theoretical Contributions
First, the study contributes to AR and immersive-commerce research by disaggregating interface attributes. Meta-analytic evidence indicates that AR outcomes vary across contexts and mechanisms [3], but managerial discussion often still collapses AR into a single technology treatment. The present findings show why that can be misleading. Interactivity, vividness, and ease of use are not interchangeable inputs: they differ both in coefficient magnitude and in the psychological pathway they activate.
Second, the study refines the S-O-R organism component by separating product-oriented cognitive appraisal from technology-oriented attitudinal evaluation. Prior AR research frequently includes several internal states, but the theoretical distinction between evaluating the product and evaluating the interface is not always explicit. Here, perceived product value and attitude toward AR play different roles. The cognitive pathway is broad: all three attributes influence purchase intention through perceived product value. The attitudinal pathway is narrow: only vividness produces a significant feature-to-attitude-to-purchase indirect effect. This separation provides a more precise explanation of how environmental stimuli are translated into behavioral intention.
Third, the study qualifies technology-acceptance logic in a high-involvement shopping context. Ease of use is important, but its role is primarily instrumental rather than attitudinal in the present data. This suggests that the psychological meaning of ease of use depends on what the consumer is trying to accomplish. When the task is to assess whether a relatively expensive, spatially consequential product fits a real environment, usability may matter because it facilitates product judgment; vividness may matter more for the overall evaluation of the immersive technology.
Fourth, the furniture context clarifies a boundary condition of immersive commerce. AR can improve visual and spatial evaluation but cannot fully digitize tactile evidence. The expert insights are consistent with this limitation and help explain why vividness is influential without implying that realism eliminates all uncertainty. Theoretical models of immersive commerce should therefore distinguish between attributes that AR can simulate effectively and sensory attributes that continue to require physical verification.
5.3. Managerial Implications
For furniture retailers, the results imply that AR investment should be prioritized by psychological objective rather than by feature count. If the objective is to improve product evaluation, retailers should ensure that users can manipulate products easily and meaningfully: rotating items, changing variants, testing placement, and adjusting size should be stable and intuitive. Interactivity and ease of use create value when they reduce evaluation effort and uncertainty, not when they merely add interface complexity.
If the objective is to build a more favorable AR experience and increase purchase intention through attitude, vividness deserves priority. High-resolution 3D models, realistic textures, accurate scale, lighting consistency, and credible occlusion can make the virtual product feel more congruent with the consumer’s environment. Because vividness had the strongest association with attitude toward AR, investment in visual realism may generate greater behavioral leverage than adding additional control features once core usability is adequate.
Retailers should also connect AR to physical verification. The expert interviews suggest that material samples, showroom appointments, home consultations, or easy transitions from AR configuration to in-store inspection can address the tactile gap. An effective strategy is therefore not ‘AR instead of the store’ but AR as a decision-support layer that makes the later physical interaction more targeted. This is especially important for high-ticket products where consumers remain sensitive to material quality and perceived purchase risk.
Finally, managers should avoid using the demographic composition of this sample as a population targeting rule. Younger and female respondents were more prevalent in the realized sample, but the non-probability design does not establish that these groups are intrinsically more responsive to furniture AR. Retail segmentation decisions should rely on firm-level behavioral data or representative market research rather than on the descriptive distribution reported here.
5.4. Social and Sustainability Implications
The implications extend beyond furniture retailers. AR interface designers and e-commerce managers can use the feature-specific results to allocate design effort; consumer researchers can use the cognitive-versus-attitudinal distinction to refine immersive-commerce models; and SMEs or digital-transformation support agencies can use the findings to understand which capabilities are most relevant when introducing AR-enabled selling. At the consumer level, accurate spatial visualization may reduce information asymmetry for shoppers who cannot conveniently visit a showroom, although this benefit depends on device access, digital literacy, and the fidelity of product models.
The findings also relate to the United Nations 2030 Agenda [47]. AR-enabled retail is directly relevant to SDG 9 insofar as it reflects digital innovation and the upgrading of business capabilities. It may also be indirectly relevant to SDG 12 if better pre-purchase visualization helps consumers avoid mismatched purchases, unnecessary showroom travel, or avoidable returns. However, these environmental outcomes were not measured in the present study; the results should therefore not be interpreted as evidence that AR is inherently sustainable. Future work should test actual return rates, logistics impacts, device-energy use, and rebound effects before making stronger sustainability claims.
5.5. Alternative Explanations and Boundary Conditions
Two alternative interpretations deserve attention. First, the non-significant paths from interactivity and ease of use to attitude may reflect restricted variance among experienced AR users. Because eligibility required prior use, respondents may already have crossed a minimum acceptance threshold. In a sample of first-time users, usability could play a stronger attitudinal role. Second, the high correlation between interactivity and vividness suggests that consumers may partially experience these attributes as a bundled quality signal even though their structural effects differ. Future studies should test this distinction with experimental manipulations and stronger discriminant-validity diagnostics.
The cross-sectional design also means that the structural coefficients should be interpreted as theory-consistent associations rather than definitive causal effects. Although the S-O-R ordering provides a clear process logic, longitudinal or experimental research is needed to establish temporal precedence and rule out reciprocal evaluation.
6. Conclusions
This study addressed two objectives: identifying whether interactivity, vividness, and ease of use exert distinct effects on product-value and AR-attitude evaluations and determining whether those internal states transmit feature-specific effects to purchase intention. The results reveal a clear difference between the two pathways. All three attributes contribute to purchase intention through perceived product value, indicating a broad cognitive product-evaluation route. In contrast, the attitudinal route is selective: vividness has a strong positive effect on attitude and a correspondingly large indirect association with purchase intention, whereas interactivity and ease of use do not significantly improve attitude toward AR.
The findings strengthen immersive-commerce theory by moving beyond a technology-level question toward a feature–mechanism explanation. They also provide a practical design hierarchy: usability and interactive control are essential for extracting product information, while realism and perceptual richness are especially important for creating a favorable technology attitude. For furniture retail, the value of AR is therefore greatest when it combines functional product evaluation with convincing visualization and when the digital experience is linked to opportunities for tactile verification.
7. Limitations
The study has several limitations. First, the cross-sectional survey cannot establish causal effects or temporal precedence. Second, criterion-based non-probability recruitment was appropriate for locating AR-experienced respondents but limits statistical generalizability and remains vulnerable to self-selection and panel-composition effects. Third, the realized sample is concentrated among consumers aged 18–35 and contains no participants above 45, so the findings should not be generalized to older consumers. Fourth, the study relies on self-reported perceptions and purchase intention rather than observed transactions. Fifth, the model focuses on three interface attributes and does not include other potentially relevant mechanisms such as spatial presence, personalization, privacy concern, perceived risk, haptic simulation, or AI-assisted recommendation. Finally, the HTMT ratio between interactivity and vividness was high, indicating that their empirical distinctiveness is weaker than suggested by the Fornell–Larcker criterion and should be tested further in independent samples.
8. Future Research
Future research should use experimental designs that manipulate vividness, interactivity, and ease of use independently and record actual choice, conversion, returns, or configuration behavior. Longitudinal designs could assess whether the relative importance of vividness and usability changes as consumers become habituated to AR. Replication with probability-based panels, retailer customer databases, older consumers, and cross-cultural samples would strengthen external validity. Research should also test hybrid customer journeys in which AR precedes or follows physical inspection and should examine whether effects vary with material type, price, customization intensity, technology readiness, and need for touch. Methodologically, future studies should confirm the distinction between perceived product value and attitude toward AR using HTMT and measurement-invariance tests and should complement explanatory PLS-SEM metrics with out-of-sample prediction procedures such as PLSpredict [45,46]. Finally, the sustainability implications proposed in Section 5.4 require direct operationalization using return rates, transport activity, resource use, and life-cycle impacts rather than purchase intention alone.
Author Contributions
Conceptualization, V.-T.T. and M.-T.P.; Methodology, M.-T.P.; Formal analysis, V.-T.T. and M.-T.P.; Investigation, V.-T.T.; Data curation, V.-T.T. and M.-T.P.; Writing—original draft, V.-T.T.; Writing—review and editing, M.-T.P.; Visualization, V.-T.T. and M.-T.P. All authors have read and agreed to the published version of the manuscript.
Funding
This research received no external funding.
Institutional Review Board Statement
Formal ethical review was not applicable because this study involved an anonymous, voluntary, non-interventional consumer survey outside the scope of biomedical research under Vietnam’s Circular No. 43/2024/TT-BYT. No directly identifiable or sensitive personal data were collected, and data processing complied with Decree No. 13/2023/ND-CP on Personal Data Protection.
Informed Consent Statement
Informed consent was obtained from all subjects involved in the study.
Data Availability Statement
The data presented in this study are available on reasonable request from the corresponding author due to privacy and ethical restrictions associated with participant-level survey data.
Acknowledgments
This research is supported by Vietnam Maritime University.
Conflicts of Interest
The authors declare no conflicts of interest.
Abbreviations
The following abbreviations are used in this manuscript:
| AR | Augmented reality |
| AVE | Average variance extracted |
| PLS-SEM | Partial least squares structural equation modeling |
| S-O-R | Stimulus–Organism–Response |
| TAM | Technology Acceptance Model |
| VIF | Variance inflation factor |
| HTMT | Heterotrait-monotrait ratio |
| Q2 | Stone–Geisser predictive relevance |
| f2 | Effect size |
References
- Javornik, A. Augmented reality: Research agenda for studying the impact of its media characteristics on consumer behaviour. J. Retail. Consum. Serv. 2016, 30, 252–261. [Google Scholar] [CrossRef] [Scilit]
- Flavián, C.; Ibáñez-Sánchez, S.; Orús, C. The impact of virtual, augmented and mixed reality technologies on the customer experience. J. Bus. Res. 2019, 100, 547–560. [Google Scholar] [CrossRef] [Scilit]
- Fan, X.; Xun, J.; Dolega, L.; Xiong, L. The Role of Augmented and Virtual Reality in Shaping Retail Marketing: A Meta-Analysis. Sustainability 2025, 17, 728. [Google Scholar] [CrossRef] [Scilit]
- Grand View Research. Augmented Reality in Retail Market Size, Share & Trends Analysis Report, 2025–2033. Available online: https://www.grandviewresearch.com/industry-analysis/augmented-reality-retail-market-report (accessed on 5 October 2026).
- Zare Ebrahimabad, F.; Yazdani, H.; Hakim, A.; Asarian, M. Augmented Reality Versus Web-Based Shopping: How Does AR Improve User Experience and Online Purchase Intention. Telemat. Inform. Rep. 2024, 15, 100152. [Google Scholar] [CrossRef] [Scilit]
- Yang, J.; Lin, Z. From screen to reality: How AR drives consumer engagement and purchase intention. J. Digit. Econ. 2024, 3, 37–46. [Google Scholar] [CrossRef] [Scilit]
- Lin, K.-Y.; Huang, T.K. Shopping in the digital world: How augmented reality mobile applications trigger customer engagement. Technol. Soc. 2024, 77, 102540. [Google Scholar] [CrossRef] [Scilit]
- Attri, R.; Roy, S.; Choudhary, S. In-store augmented reality experiences and its effect on consumer perceptions and behaviour. J. Serv. Mark. 2024, 38, 892–910. [Google Scholar] [CrossRef] [Scilit]
- Söderström, C.; Mikalef, P.; Landmark, A.D.; Gupta, S. Augmented reality (AR) marketing and consumer responses: A study of cue-utilization and habituation. J. Bus. Res. 2024, 182, 114813. [Google Scholar] [CrossRef] [Scilit]
- Ngo, T.T.A.; Tran, T.T.; An, G.K.; Nguyen, P.T. Investigating the influence of augmented reality marketing application on consumer purchase intentions: A study in the E-commerce sector. Comput. Hum. Behav. Rep. 2025, 18, 100648. [Google Scholar] [CrossRef] [Scilit]
- Yim, M.Y.C.; Chu, S.C.; Sauer, P.L. Is Augmented Reality Technology an Effective Tool for E-commerce? An Interactivity and Vividness Perspective. J. Interact. Mark. 2017, 39, 89–103. [Google Scholar] [CrossRef] [Scilit]
- McLean, G.; Wilson, A. Shopping in the digital world: Examining customer engagement through augmented reality mobile applications. Comput. Hum. Behav. 2019, 101, 210–224. [Google Scholar] [CrossRef] [Scilit]
- Arghashi, V.; Yuksel, C.A. Interactivity, Inspiration, and Perceived Usefulness! How retailers’ AR-apps improve consumer engagement through flow. J. Retail. Consum. Serv. 2022, 64, 102756. [Google Scholar] [CrossRef] [Scilit]
- Pathak, K.; Prakash, G. Exploring the role of augmented reality in purchase intention: Through flow and immersive experience. Technol. Forecast. Soc. Change 2023, 196, 122833. [Google Scholar] [CrossRef] [Scilit]
- Fan, X.; Chai, Z.; Deng, N.; Dong, X. Adoption of augmented reality in online retailing and consumers’ product attitude: A cognitive perspective. J. Retail. Consum. Serv. 2020, 53, 101986. [Google Scholar] [CrossRef] [Scilit]
- Rauschnabel, P.A.; Felix, R.; Hinsch, C. Augmented reality marketing: How mobile AR-apps can improve brands through inspiration. J. Retail. Consum. Serv. 2019, 49, 43–53. [Google Scholar] [CrossRef] [Scilit]
- Kowalczuk, P.; Siepmann, C.; Adler, J. Cognitive, affective, and behavioral consumer responses to augmented reality in e-commerce: A comparative study. J. Bus. Res. 2021, 124, 357–373. [Google Scholar] [CrossRef] [Scilit]
- Naveen, L.; Khan, M.I.; Saleh, M.A.; Subudhi, R.N. The influence of mobile augmented reality on consumer behavior: Insights into affective, cognitive, and behavioral responses. Comput. Hum. Behav. 2025, 165, 108558. [Google Scholar] [CrossRef] [Scilit]
- Taub, G.; Elmalech, A.; Aharony, N. Augmented Impressions: The role of augmented reality in shaping perceived product value and enhancing purchase intention. Comput. Hum. Behav. Rep. 2025, 19, 100726. [Google Scholar] [CrossRef] [Scilit]
- Konstantoulaki, K.; Rizomyliotis, I.; Ang, E.; Nguyen, T.Q. Augmented reality characteristics as drivers of consumers’ purchase intention. EuroMed J. Bus. 2025, 20, 818–833. [Google Scholar] [CrossRef] [Scilit]
- Negm, E. The impact of augmented reality on consumer behavior: A focus on value development, leading to brand engagement and purchase intention. Manag. Sustain. Arab Rev. 2025, 4, 320–341. [Google Scholar] [CrossRef] [Scilit]
- Rumokoy, F.S.; Frank, B. Retail value creation through augmented reality: The role of task-technology fit, consumer knowledge, and personality. J. Retail. Consum. Serv. 2025, 84, 104173. [Google Scholar] [CrossRef] [Scilit]
- Hilken, T.; de Ruyter, K.; Chylinski, M.; Mahr, D.; Keeling, D.I. Augmenting the eye of the beholder: Exploring the strategic potential of augmented reality to enhance online service experiences. J. Acad. Mark. Sci. 2017, 45, 884–905. [Google Scholar] [CrossRef] [Scilit]
- Sahli, A.; Lichy, J. The role of augmented reality in the customer shopping experience. Int. J. Organ. Anal. 2026, 34, 1348–1363. [Google Scholar] [CrossRef] [Scilit]
- Mehrabian, A.; Russell, J.A. An Approach to Environmental Psychology; MIT Press: Cambridge, MA, USA, 1974. [Google Scholar]
- Zeithaml, V.A. Consumer perceptions of price, quality, and value: A means-end model and synthesis of evidence. J. Mark. 1988, 52, 2–22. [Google Scholar] [CrossRef] [Scilit] [PubMed]
- Davis, F.D. Perceived usefulness, perceived ease of use, and user acceptance of information technology. MIS Q. 1989, 13, 319–340. [Google Scholar] [CrossRef] [Scilit] [PubMed]
- Dogra, P.; Kaushik, A.K.; Kalia, P.; Kaushal, A. Influence of augmented reality on shopping behavior. Manag. Decis. 2023, 61, 2073–2098. [Google Scholar] [CrossRef] [Scilit]
- Poushneh, A.; Vasquez-Parraga, A.Z. Discernible impact of augmented reality on retail customer’s experience, satisfaction and willingness to buy. J. Retail. Consum. Serv. 2017, 34, 229–234. [Google Scholar] [CrossRef] [Scilit]
- Lai, Z.J.; Leong, M.K.; Khoo, K.L.; Sidhu, S.K. Integrating technology acceptance model and value-based adoption model to determine consumers’ perception of value and intention to adopt AR in online shopping. Asia Pac. J. Mark. Logist. 2025, 37, 1–19. [Google Scholar] [CrossRef] [Scilit]
- Erdmann, A.; Mas, J.M.; Arilla, R. Value-based adoption of augmented reality: A study on the influence on online purchase intention in retail. J. Consum. Behav. 2023, 22, 912–932. [Google Scholar] [CrossRef] [Scilit]
- Romano, B.; Sands, S.; Pallant, J. Virtual shopping: Segmenting consumer attitudes towards augmented reality as a shopping tool. Int. J. Retail Distrib. Manag. 2022, 50, 1221–1237. [Google Scholar] [CrossRef] [Scilit]
- Kumari, S.; Rathee, V. Influencing Customers’ Buying Behaviour in E-tail Through Telepresence Evoked by Augmented Reality: The Mediating Role of Usefulness, Ease of Use and Enjoyment. Paradigm 2024, 28, 204–222. [Google Scholar] [CrossRef] [Scilit]
- Le, H.T.; Ngo, G.T.H.; Vu, C.M.; Pham, D.P.; Pham, T.T.T.; Dinh, A.T.V.; Nham, T.P. Research on the impact of augmented reality technology on consumers’ online shopping intention in Hanoi city of Vietnam. Strateg. Bus. Res. 2025, 1, 100004. [Google Scholar] [CrossRef] [Scilit]
- Wang, K.-Y.; Ashraf, A.R.; Thongpapanl, N.; Iqbal, I. How perceived value of augmented reality shopping drives psychological ownership. Internet Res. 2025, 35, 1213–1251. [Google Scholar] [CrossRef] [Scilit]
- Ambika, A.; Jain, V.; Belk, R.; Kasilingam, D.; Krishna, R. The Role of Augmented Reality Experiences in Consumers’ Purchase Intention Toward New Products. J. Consum. Behav. 2025, 24, 799–819. [Google Scholar] [CrossRef] [Scilit]
- Lavoye, V.; Tarkiainen, A.; Sipilä, J.; Mero, J. More than skin-deep: The influence of presence dimensions on purchase intentions in augmented reality shopping. J. Bus. Res. 2023, 169, 114247. [Google Scholar] [CrossRef] [Scilit]
- Zhang, X.; Yang, P.; Guo, C.; He, P. Research on the influencing factors and mechanism of AR e-commerce consumers’ purchase intention. PLoS ONE 2026, 21, e0351158. [Google Scholar] [CrossRef] [Scilit] [PubMed]
- Hair, J.F.; Hult, G.T.M.; Ringle, C.M.; Sarstedt, M. A Primer on Partial Least Squares Structural Equation Modeling (PLS-SEM), 3rd ed.; Sage: Thousand Oaks, CA, USA, 2022. [Google Scholar]
- Kock, N.; Hadaya, P. Minimum sample size estimation in PLS-SEM: The inverse square root and gamma-exponential methods. Inf. Syst. J. 2018, 28, 227–261. [Google Scholar] [CrossRef] [Scilit]
- Boateng, G.O.; Neilands, T.B.; Frongillo, E.A.; Melgar-Quiñonez, H.R.; Young, S.L. Best practices for developing and validating scales for health, social, and behavioral research: A primer. Front. Public Health 2018, 6, 149. [Google Scholar] [CrossRef] [Scilit] [PubMed]
- Hair, J.F.; Black, W.C.; Babin, B.J.; Anderson, R.E. Multivariate Data Analysis, 8th ed.; Cengage: Andover, UK, 2019. [Google Scholar]
- Nunnally, J.C. Psychometric Theory, 2nd ed.; McGraw-Hill: New York, NY, USA, 1978. [Google Scholar]
- Fornell, C.; Larcker, D.F. Evaluating structural equation models with unobservable variables and measurement error. J. Mark. Res. 1981, 18, 39–50. [Google Scholar] [CrossRef] [Scilit]
- Henseler, J.; Ringle, C.M.; Sarstedt, M. A new criterion for assessing discriminant validity in variance-based structural equation modeling. J. Acad. Mark. Sci. 2015, 43, 115–135. [Google Scholar] [CrossRef] [Scilit]
- Shmueli, G.; Sarstedt, M.; Hair, J.F.; Cheah, J.-H.; Ting, H.; Vaithilingam, S.; Ringle, C.M. Predictive model assessment in PLS-SEM: Guidelines for using PLSpredict. Eur. J. Mark. 2019, 53, 2322–2347. [Google Scholar] [CrossRef] [Scilit]
- United Nations. Transforming Our World: The 2030 Agenda for Sustainable Development; United Nations: New York, NY, USA, 2015. [Google Scholar]

Disclaimer/Publisher’s Note: The statements, opinions and data contained in all publications are solely those of the individual author(s) and contributor(s) and not of MDPI and/or the editor(s). MDPI and/or the editor(s) disclaim responsibility for any injury to people or property resulting from any ideas, methods, instructions or products referred to in the content. |
© 2026 by the authors. Licensee MDPI, Basel, Switzerland. This article is an open access article distributed under the terms and conditions of the Creative Commons Attribution (CC BY) license.