
Sediment and Cavitation Erosion in Francis Turbines—Review of Latest Experimental and Numerical Techniques


Abstract
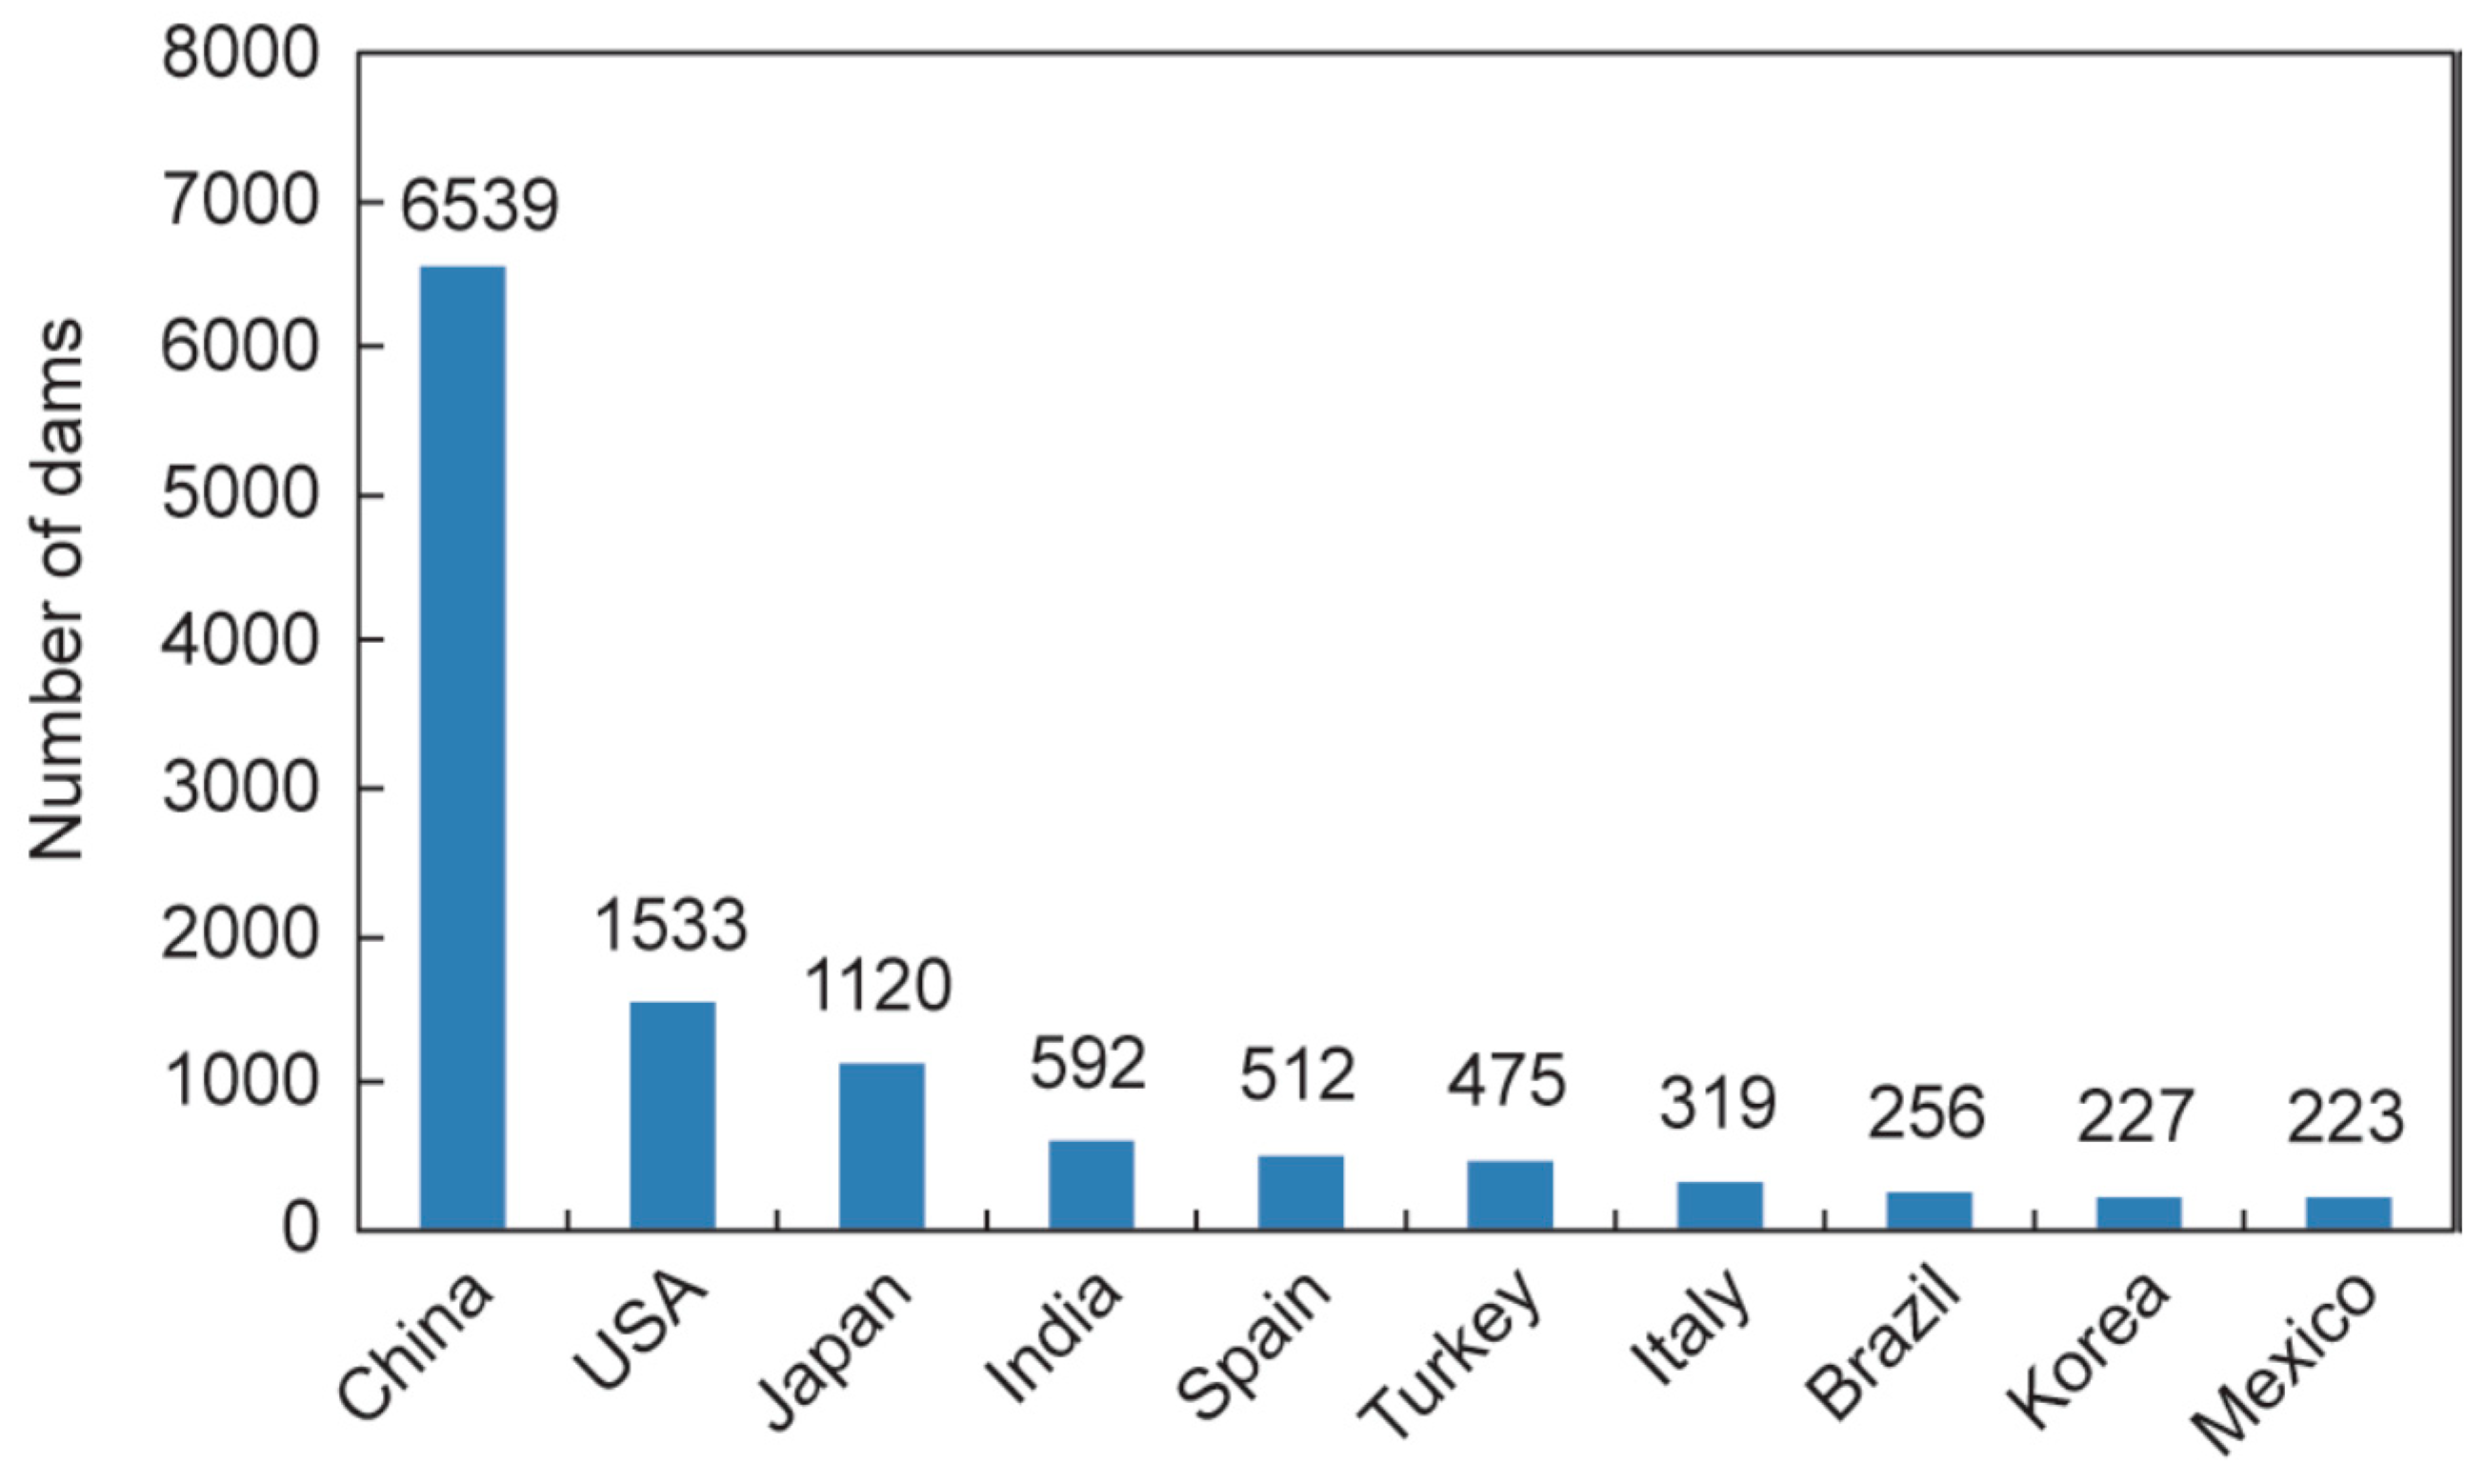
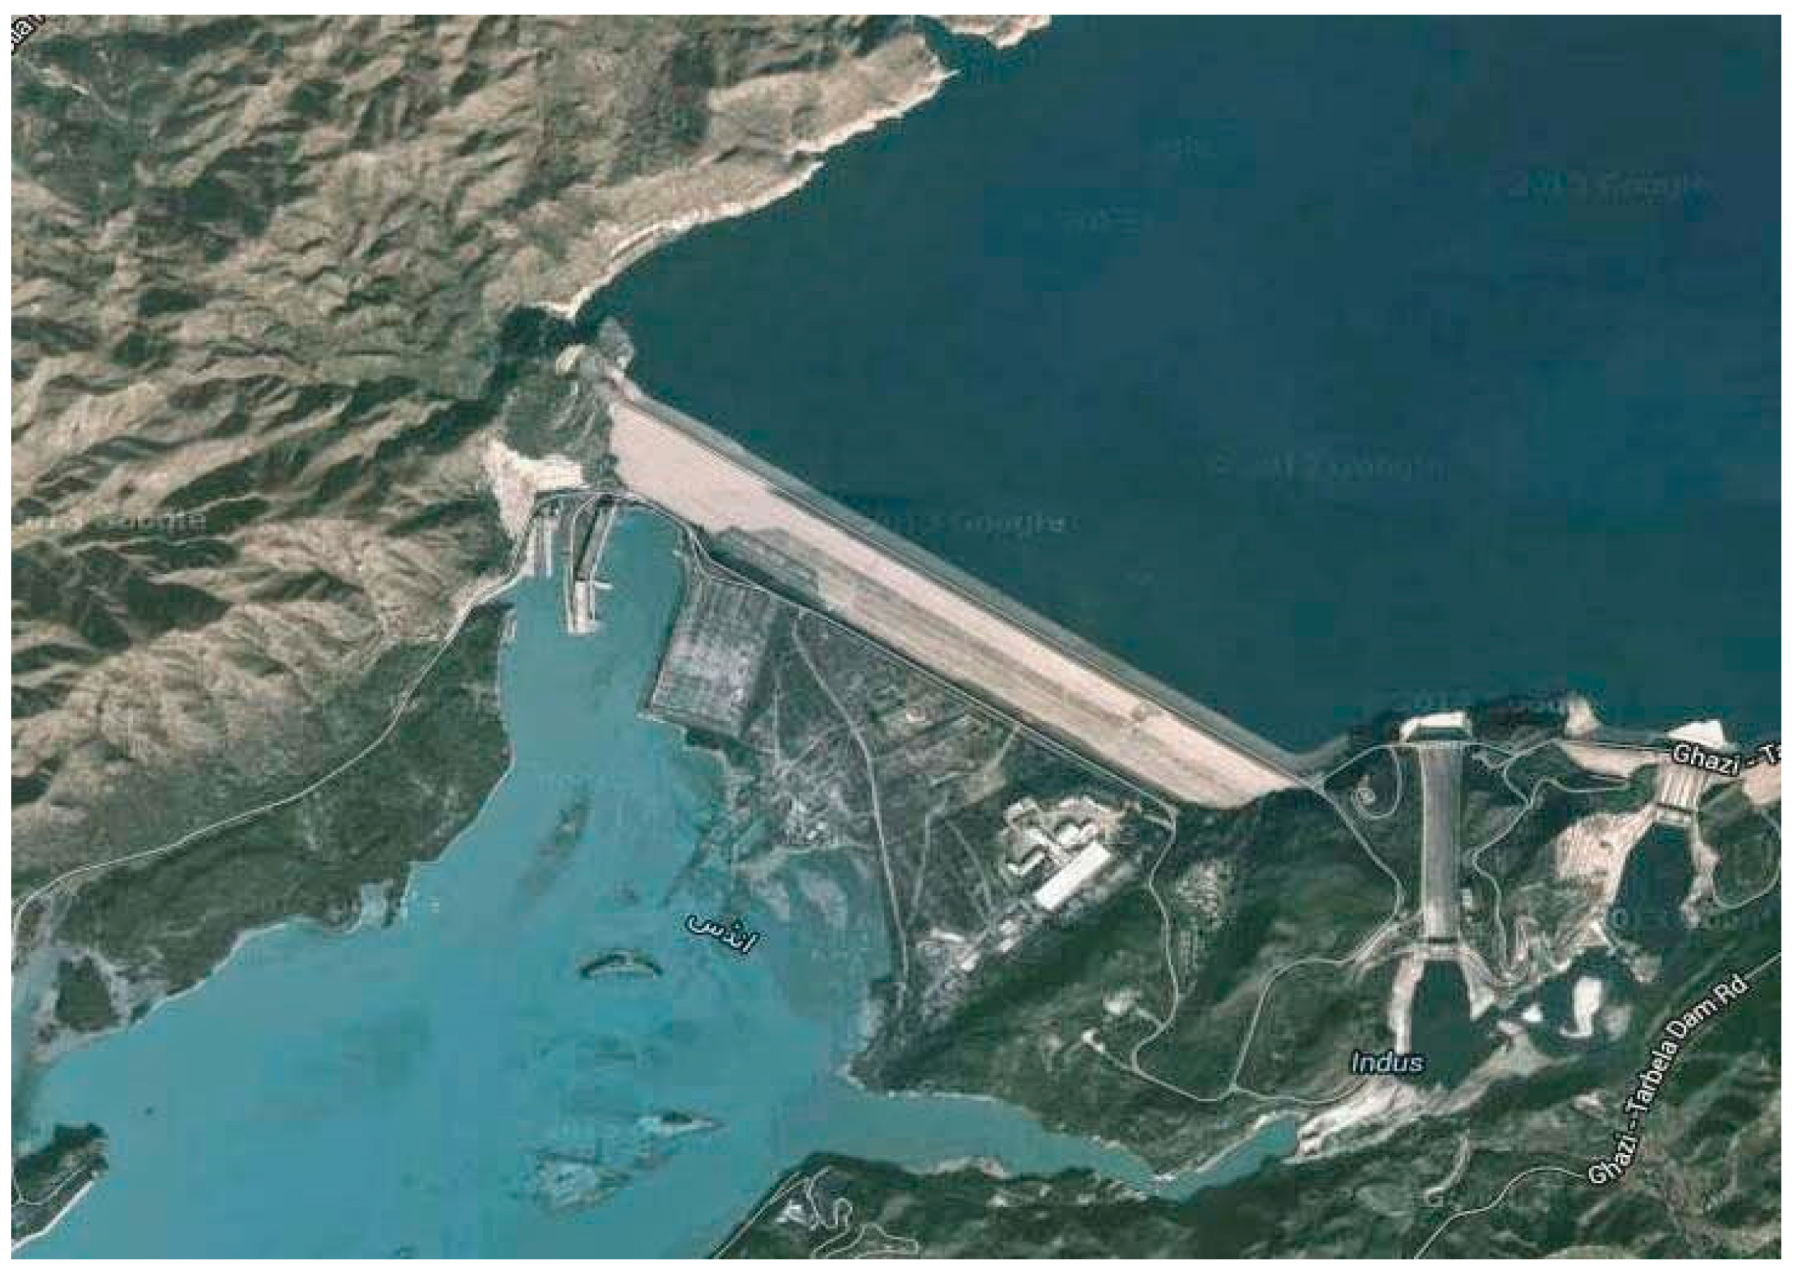
:1. Introduction
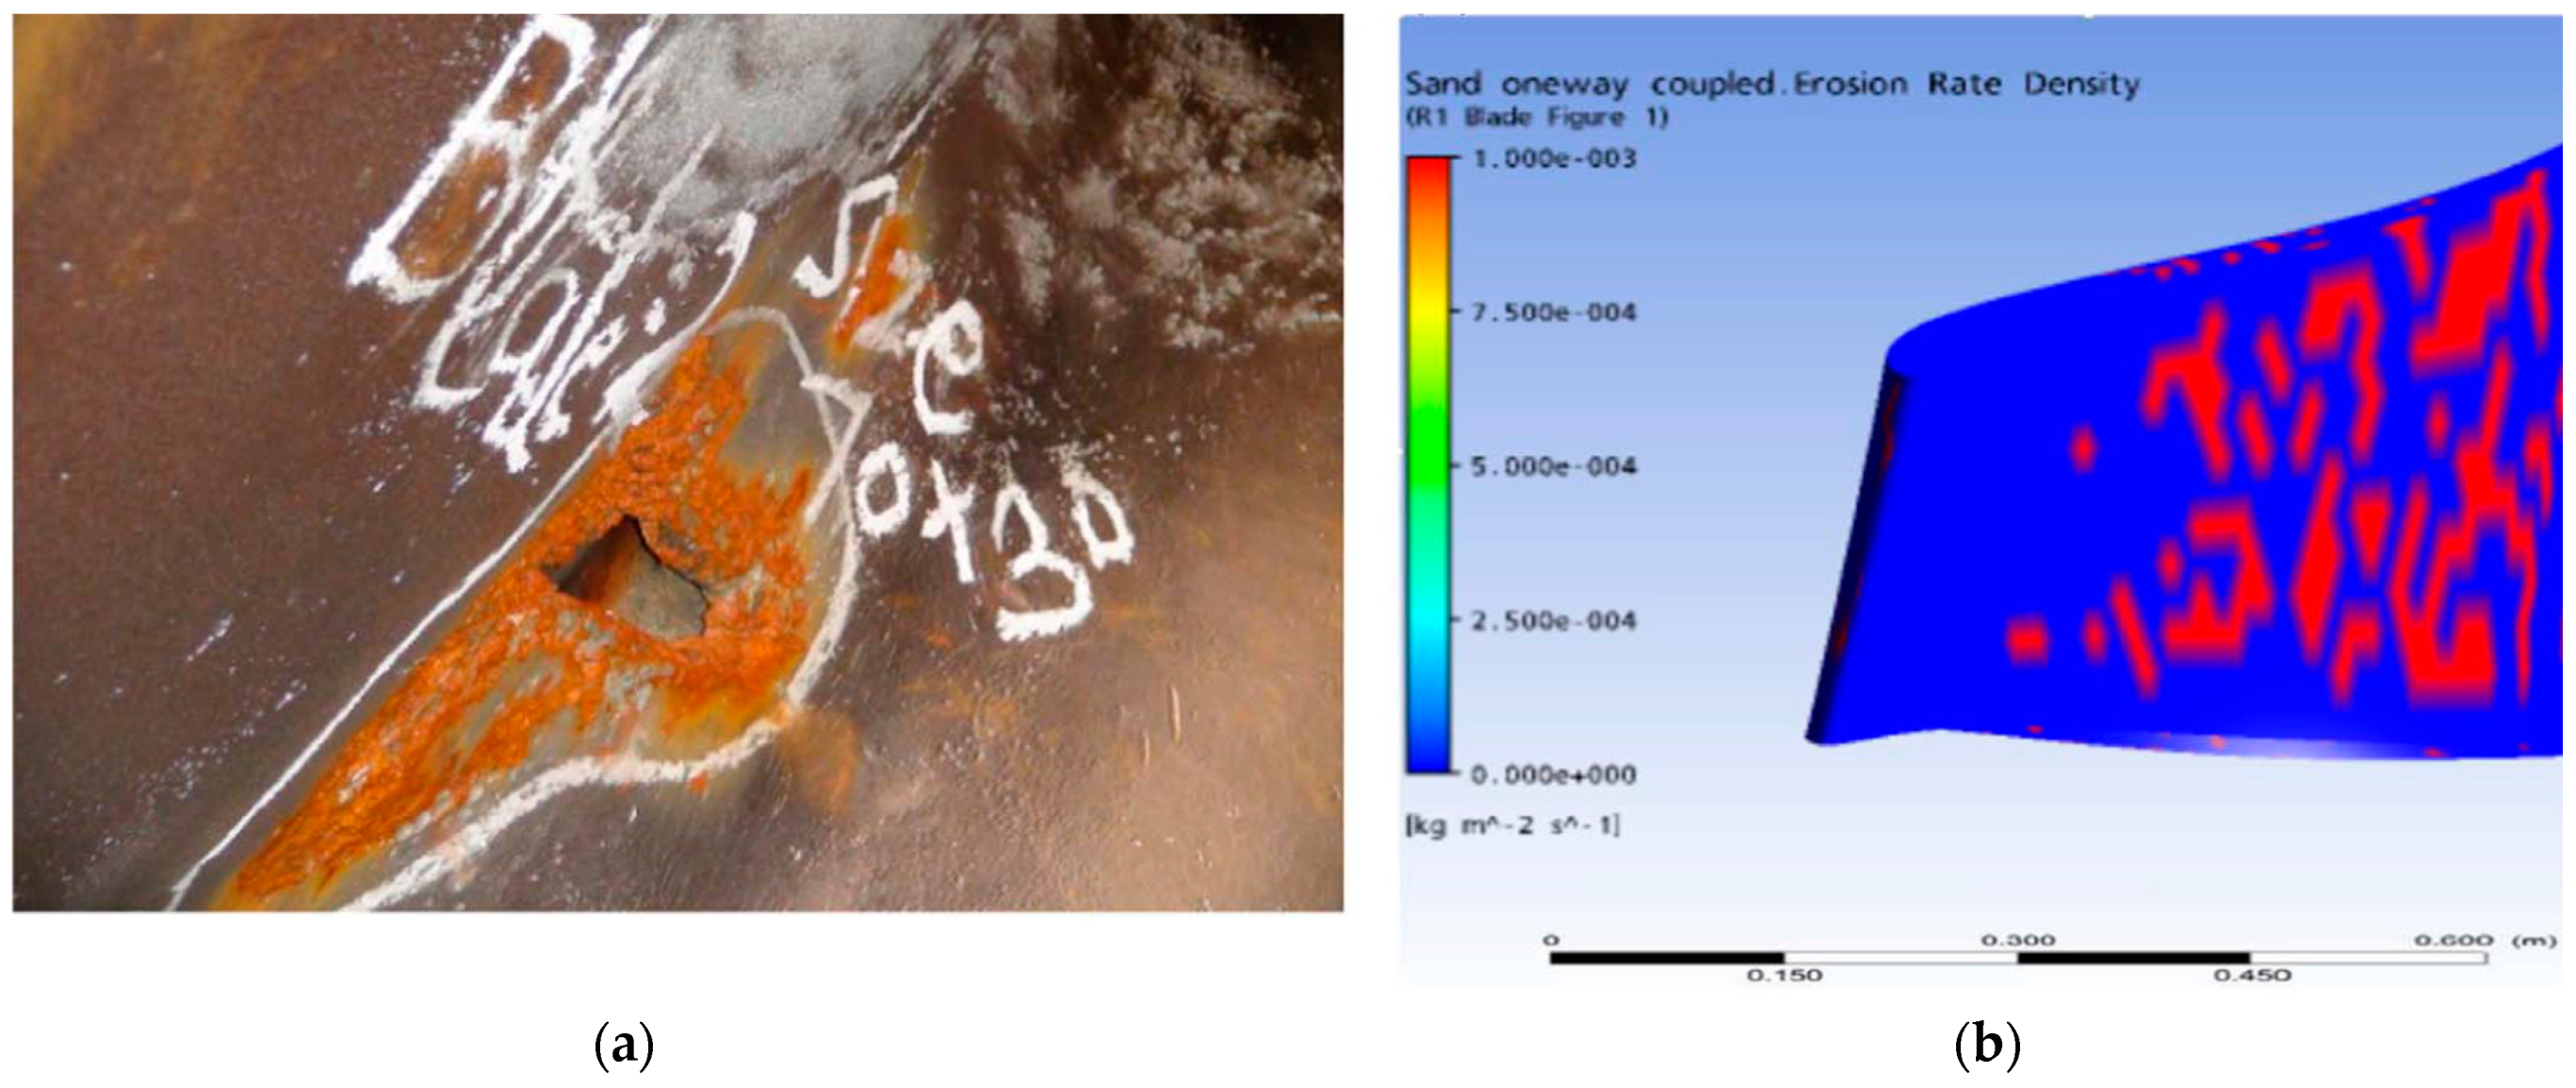
2. Experimental and Numerical Investigation for Sediment Erosion
2.1. Introduction
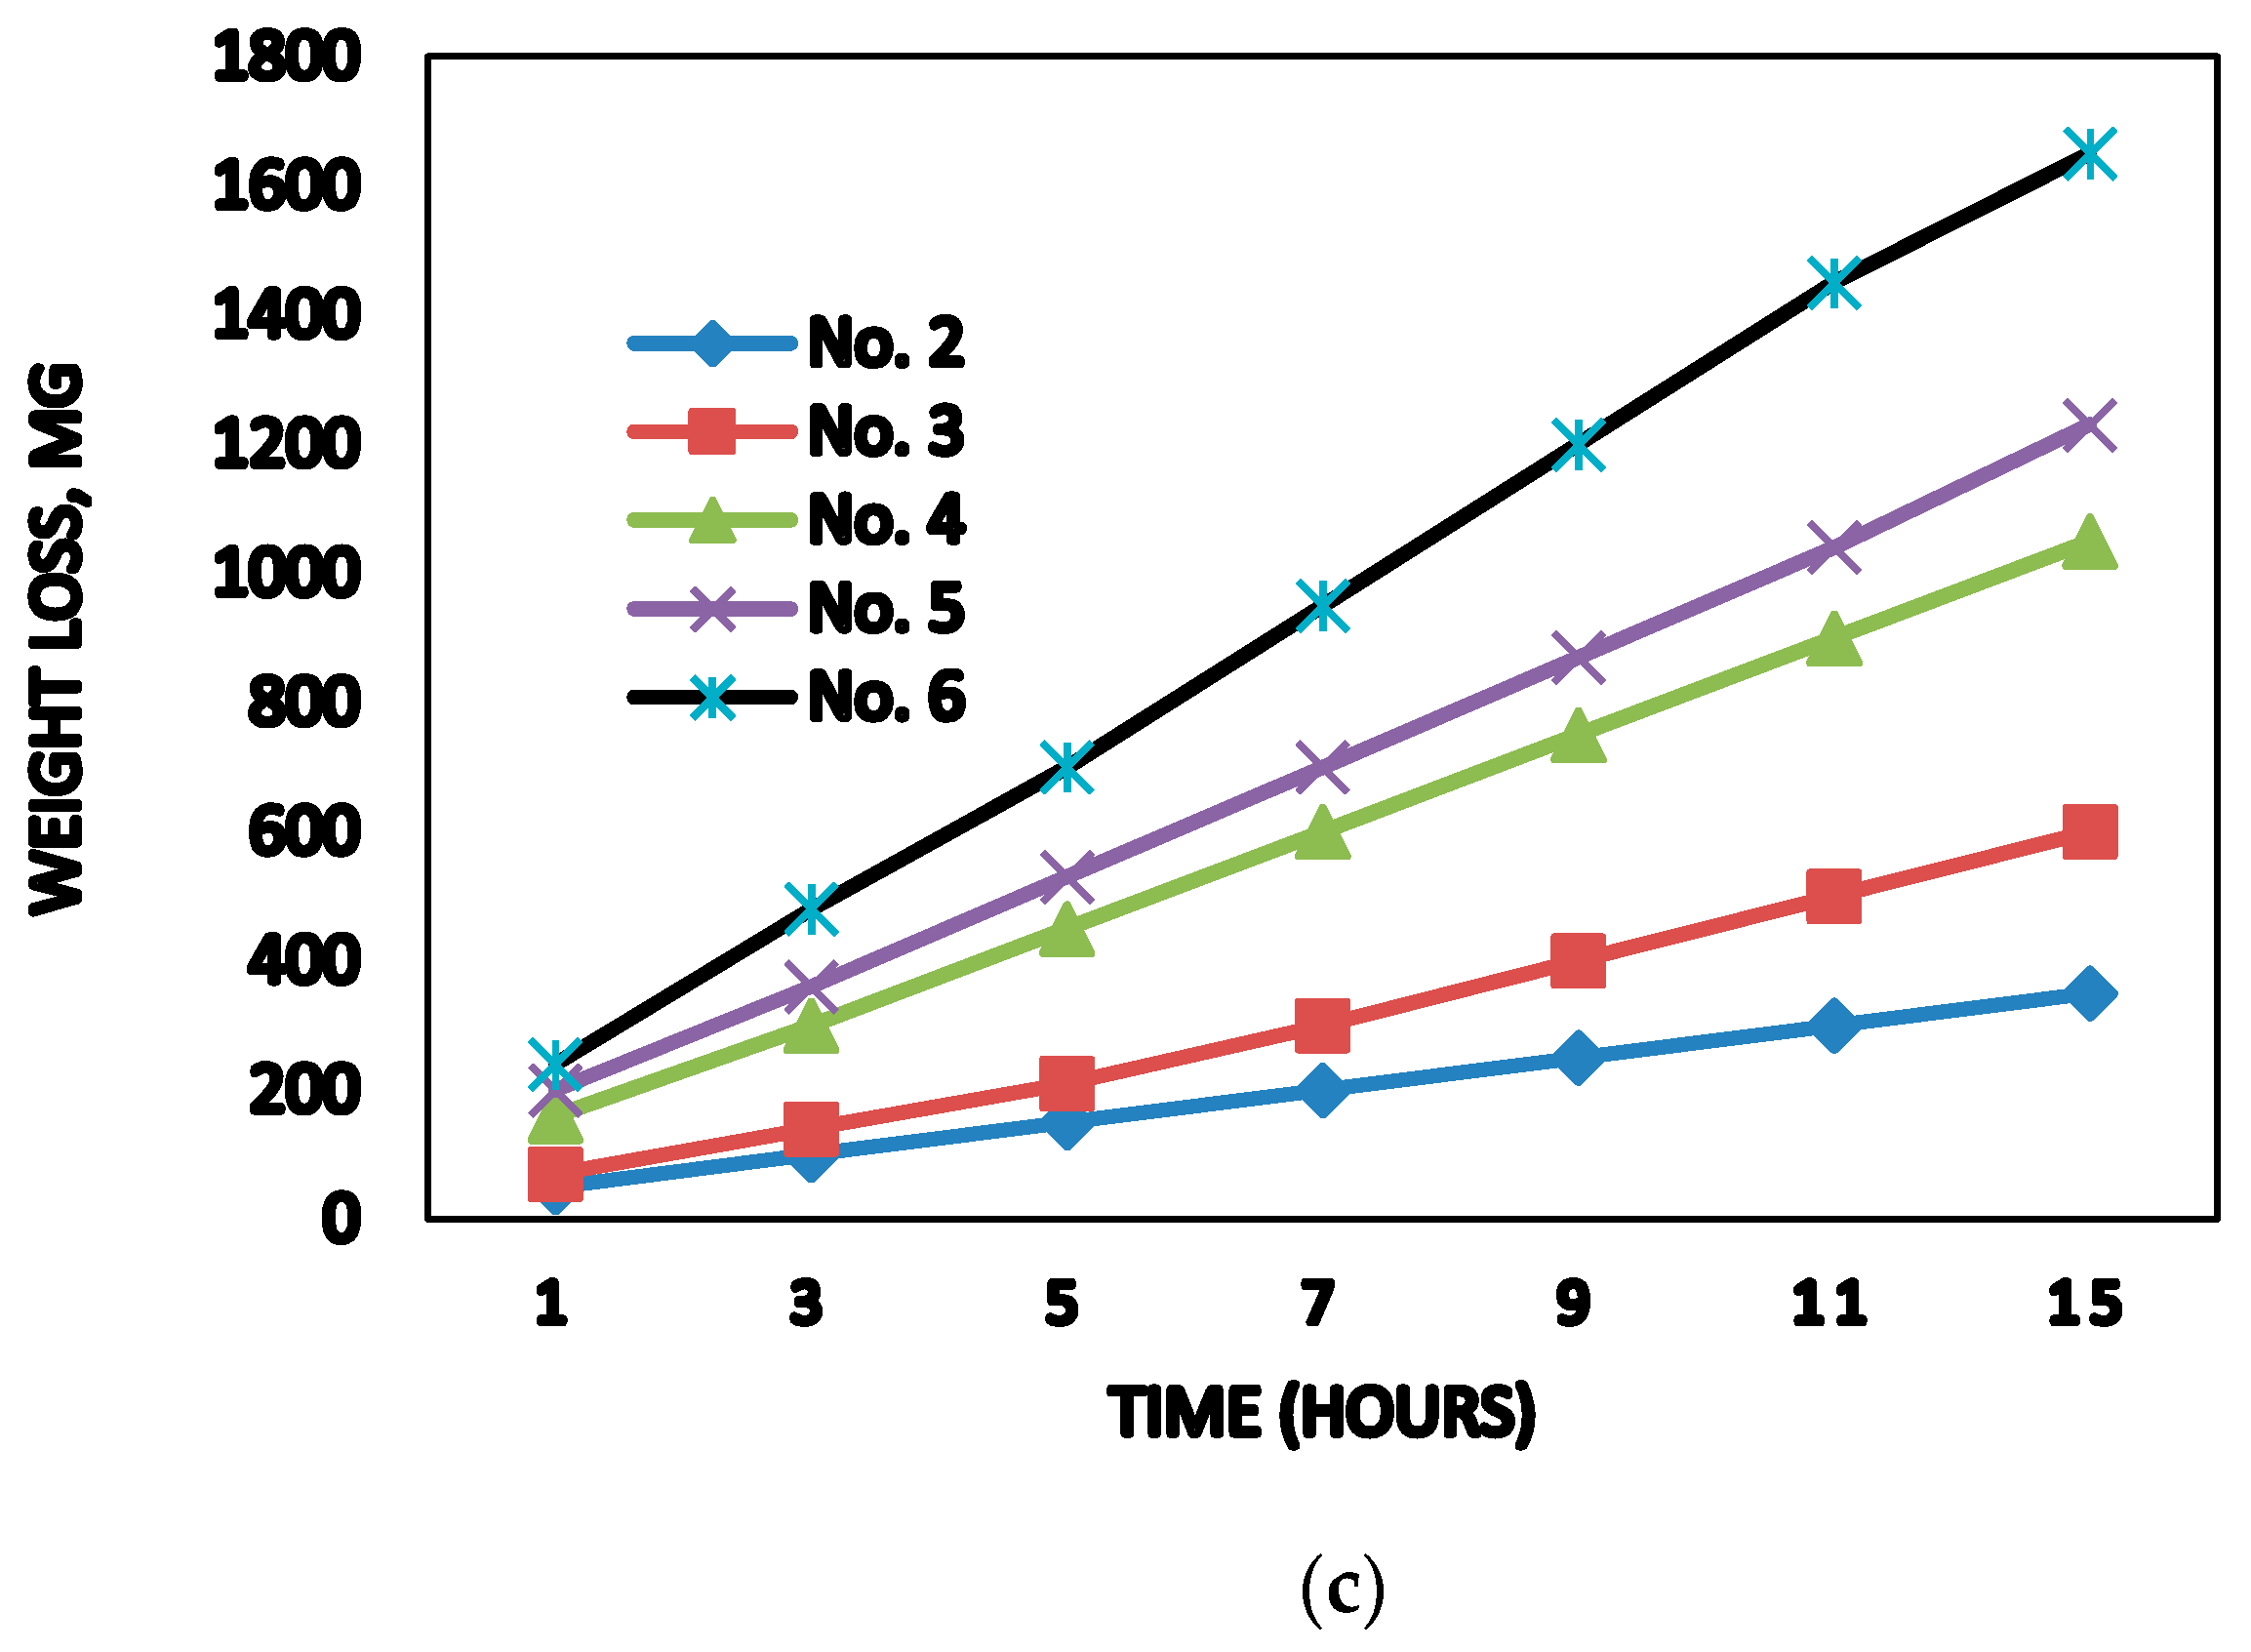
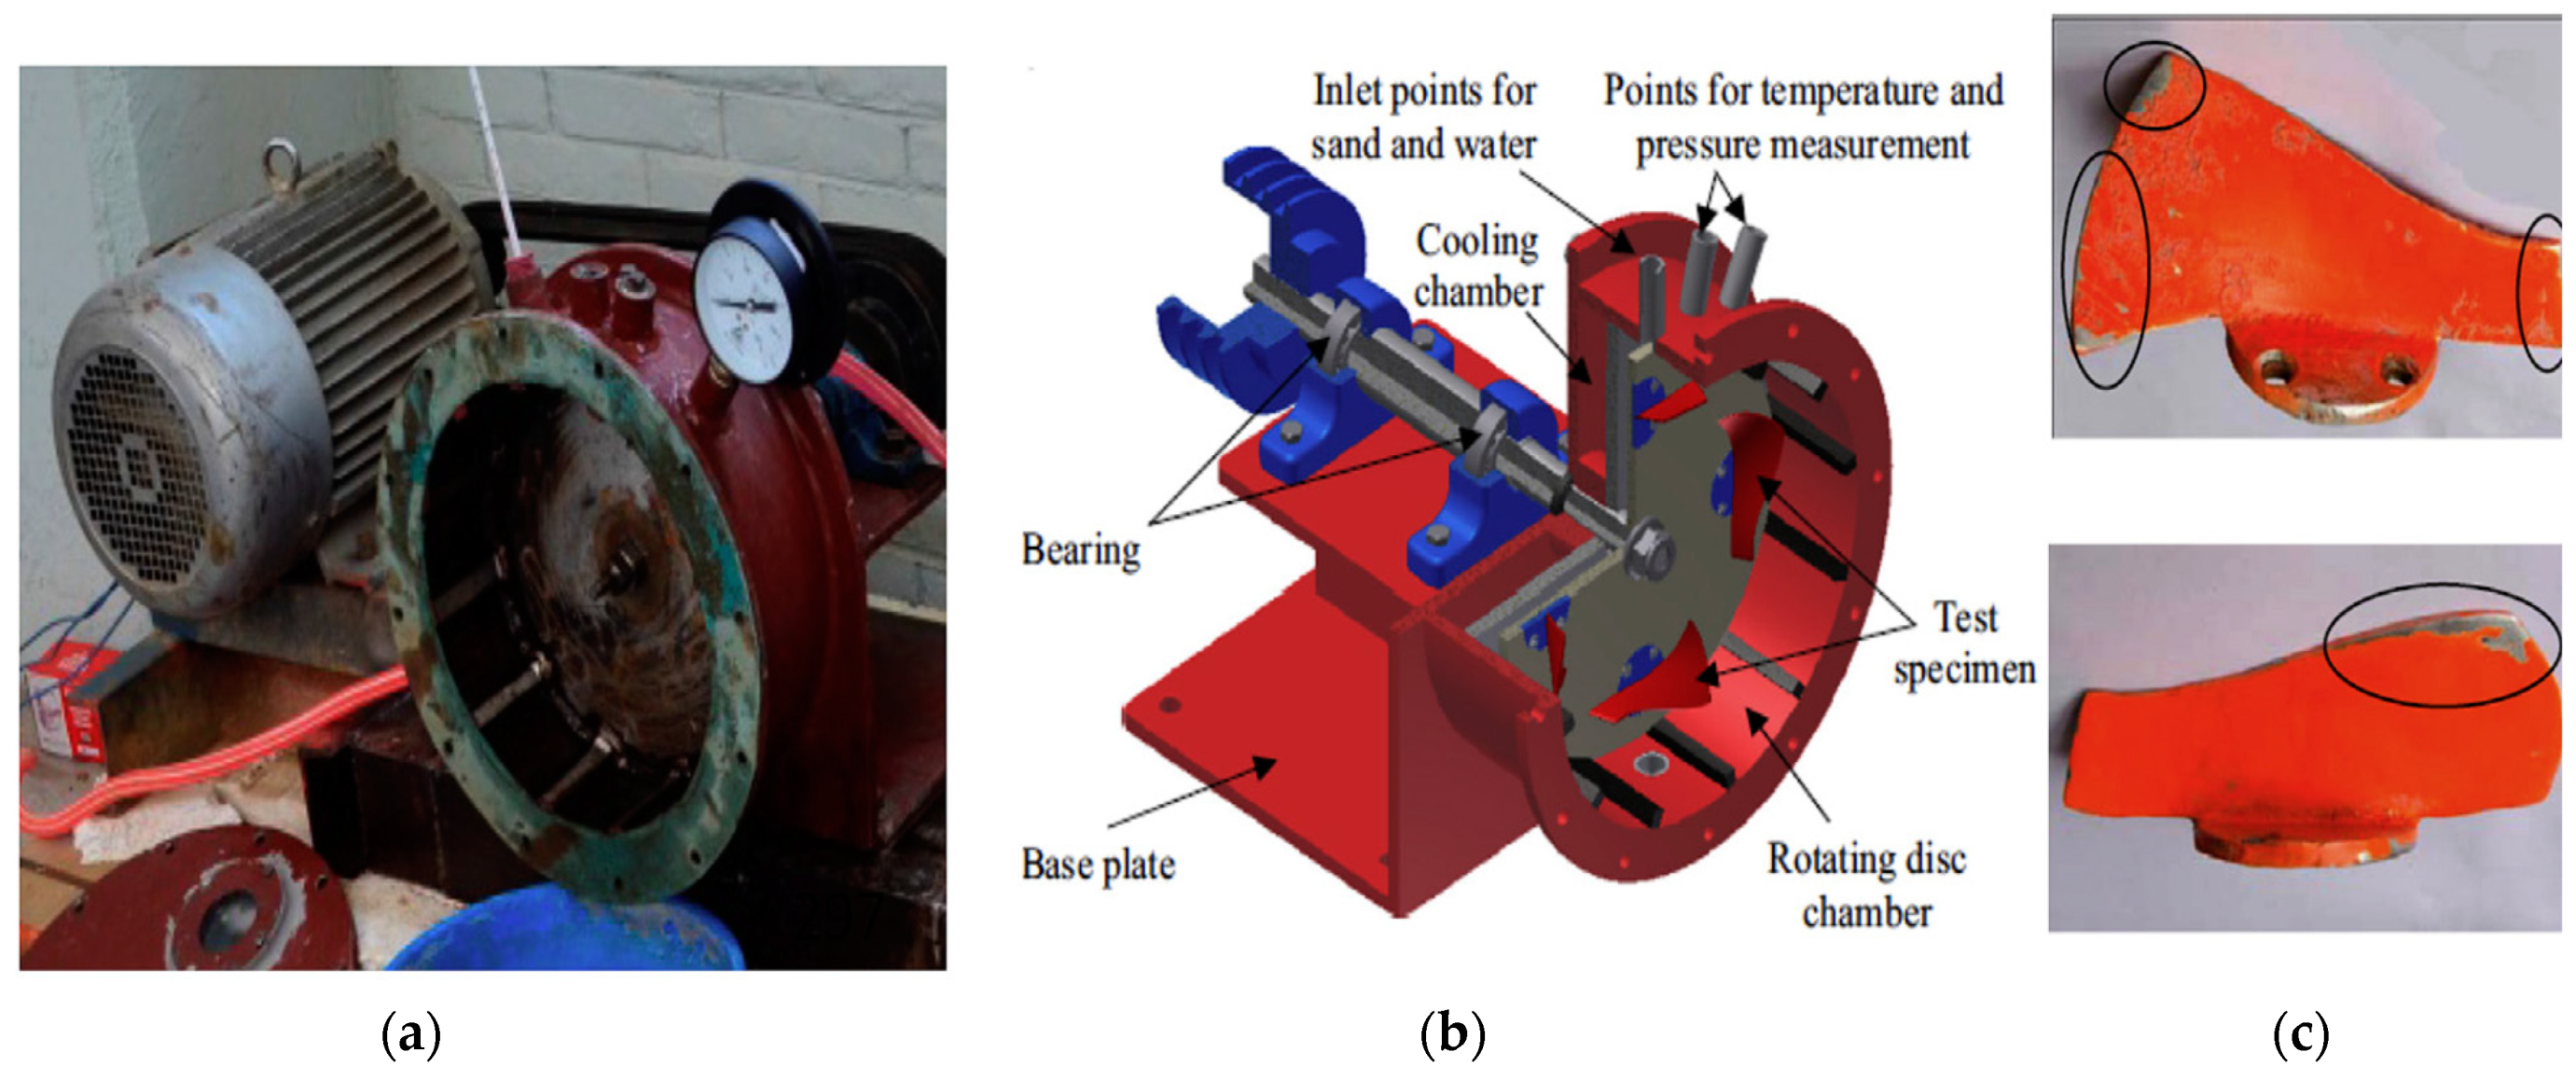
2.2. Experimental Approaches
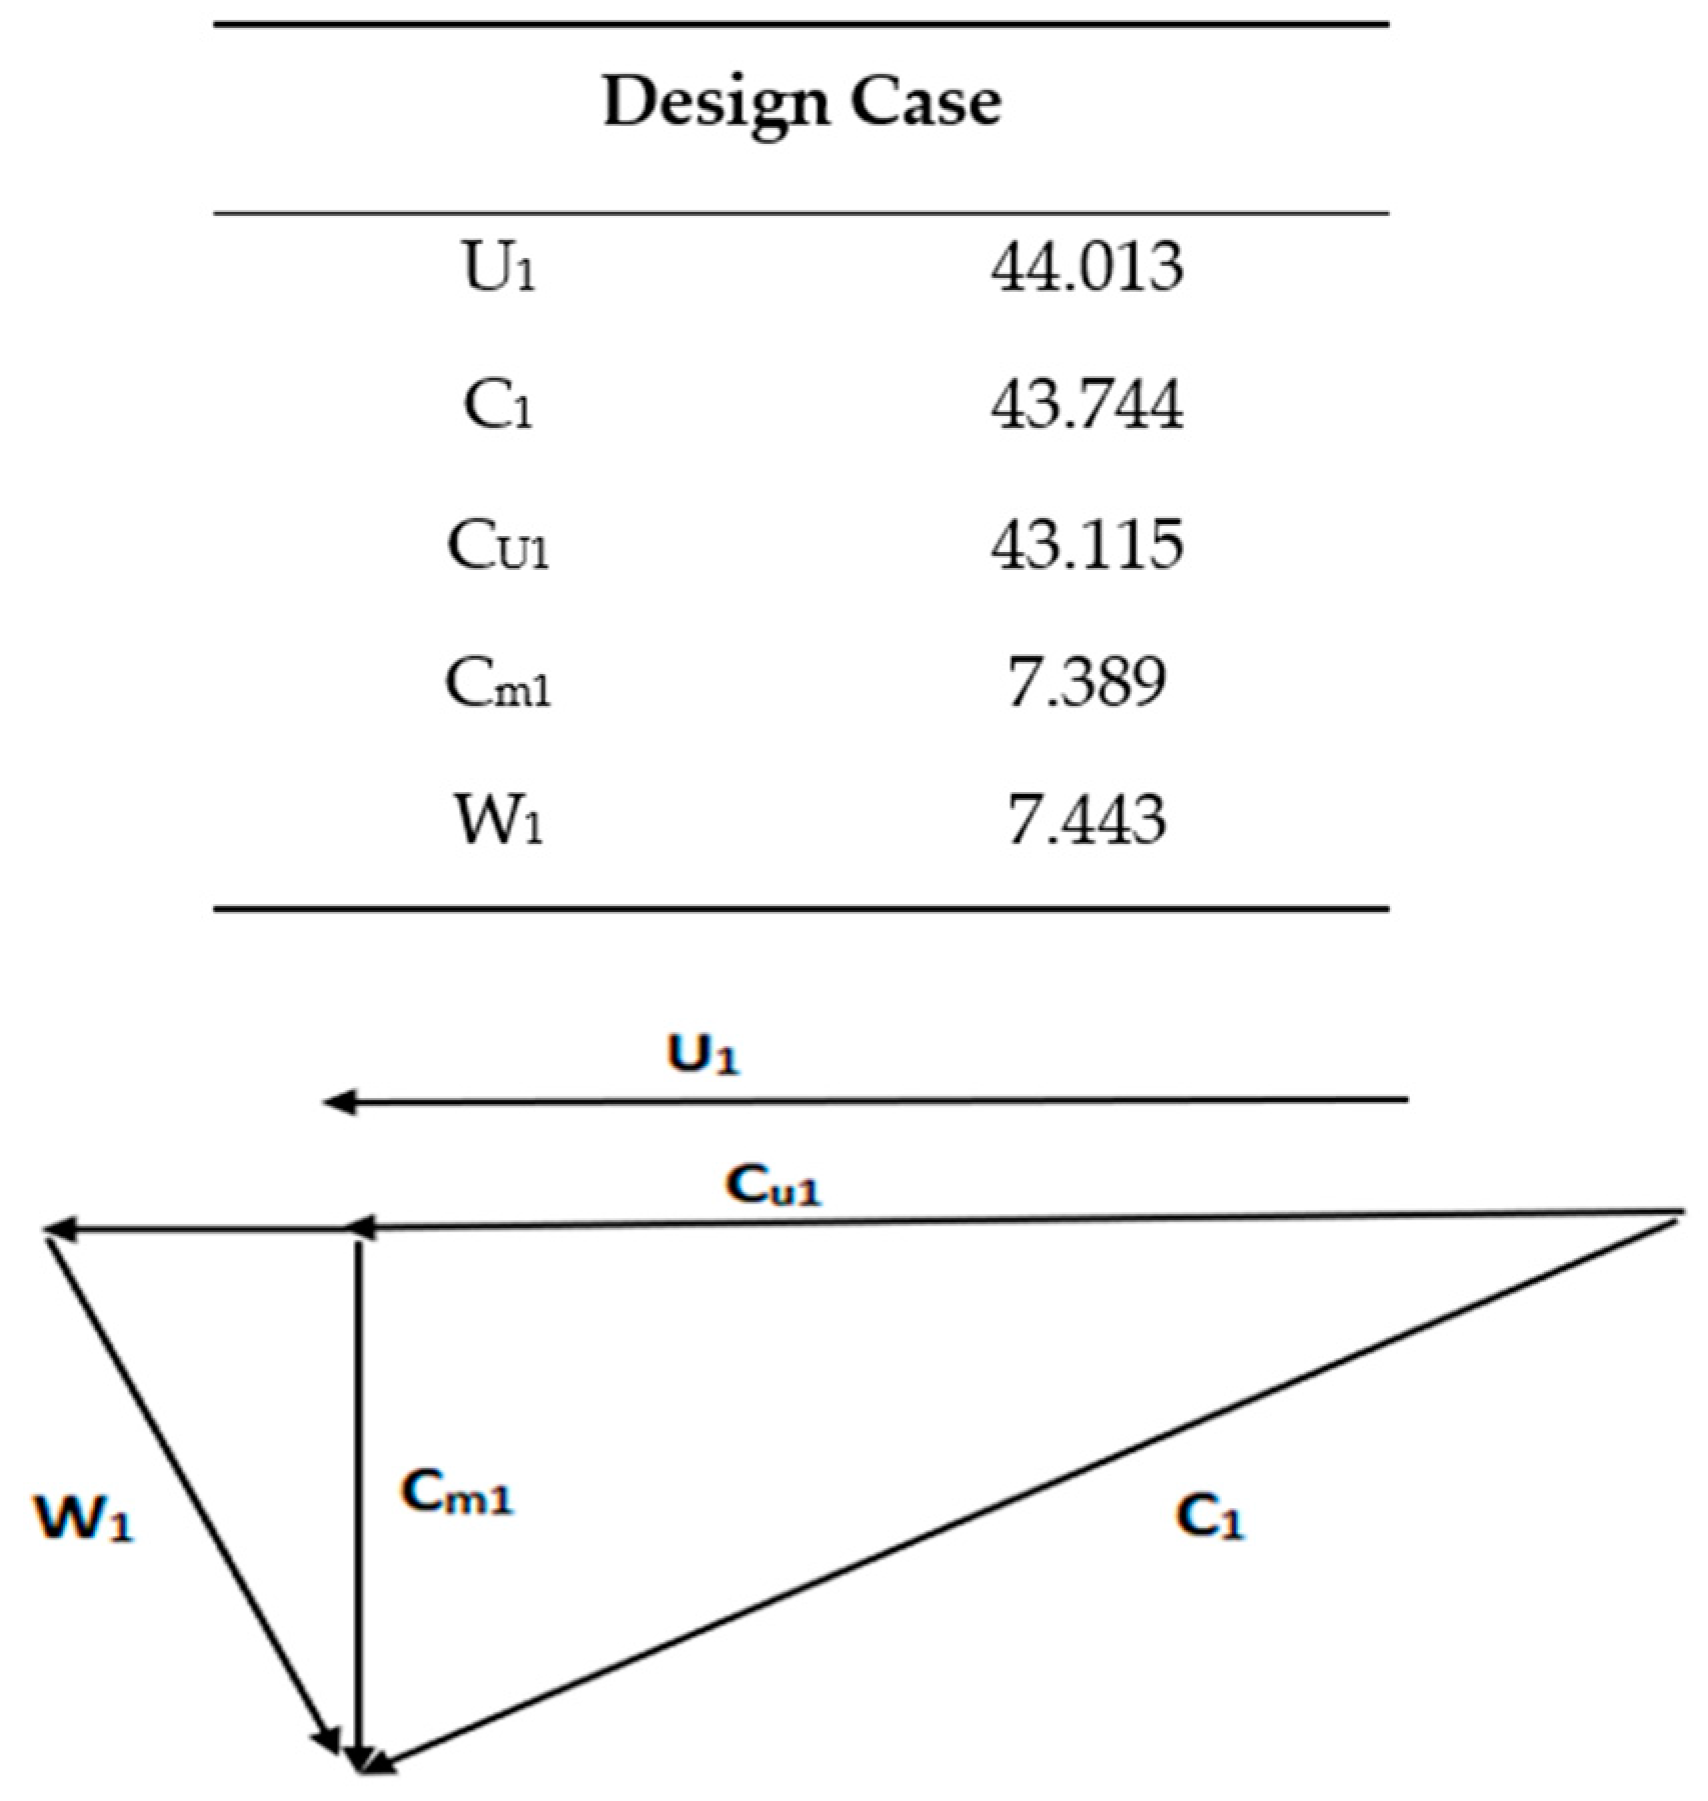
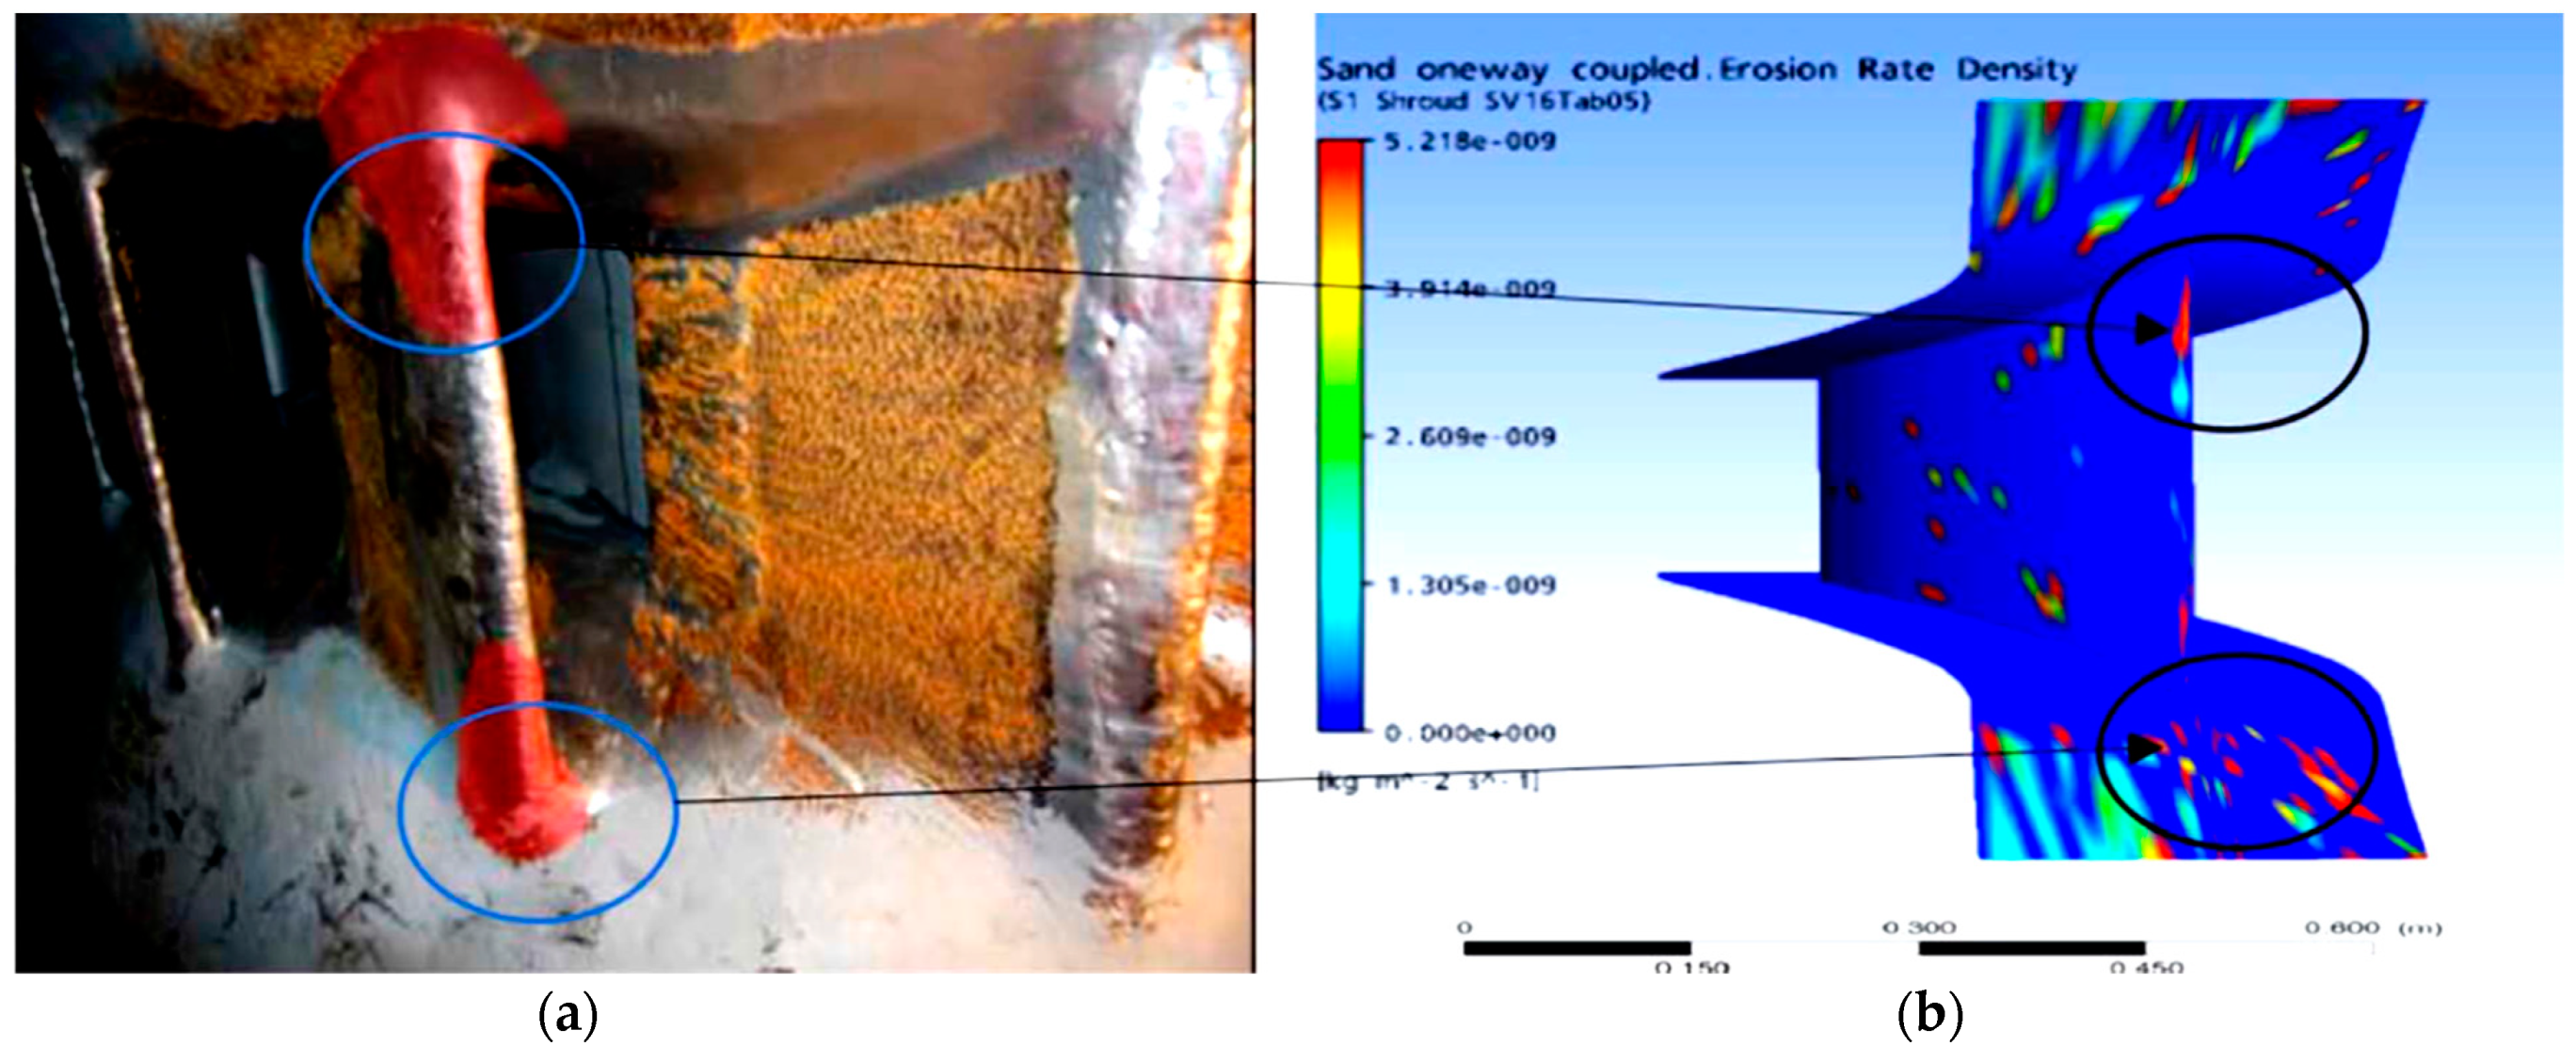
2.3. CFD Work
2.4. Effect of Surface Roughness
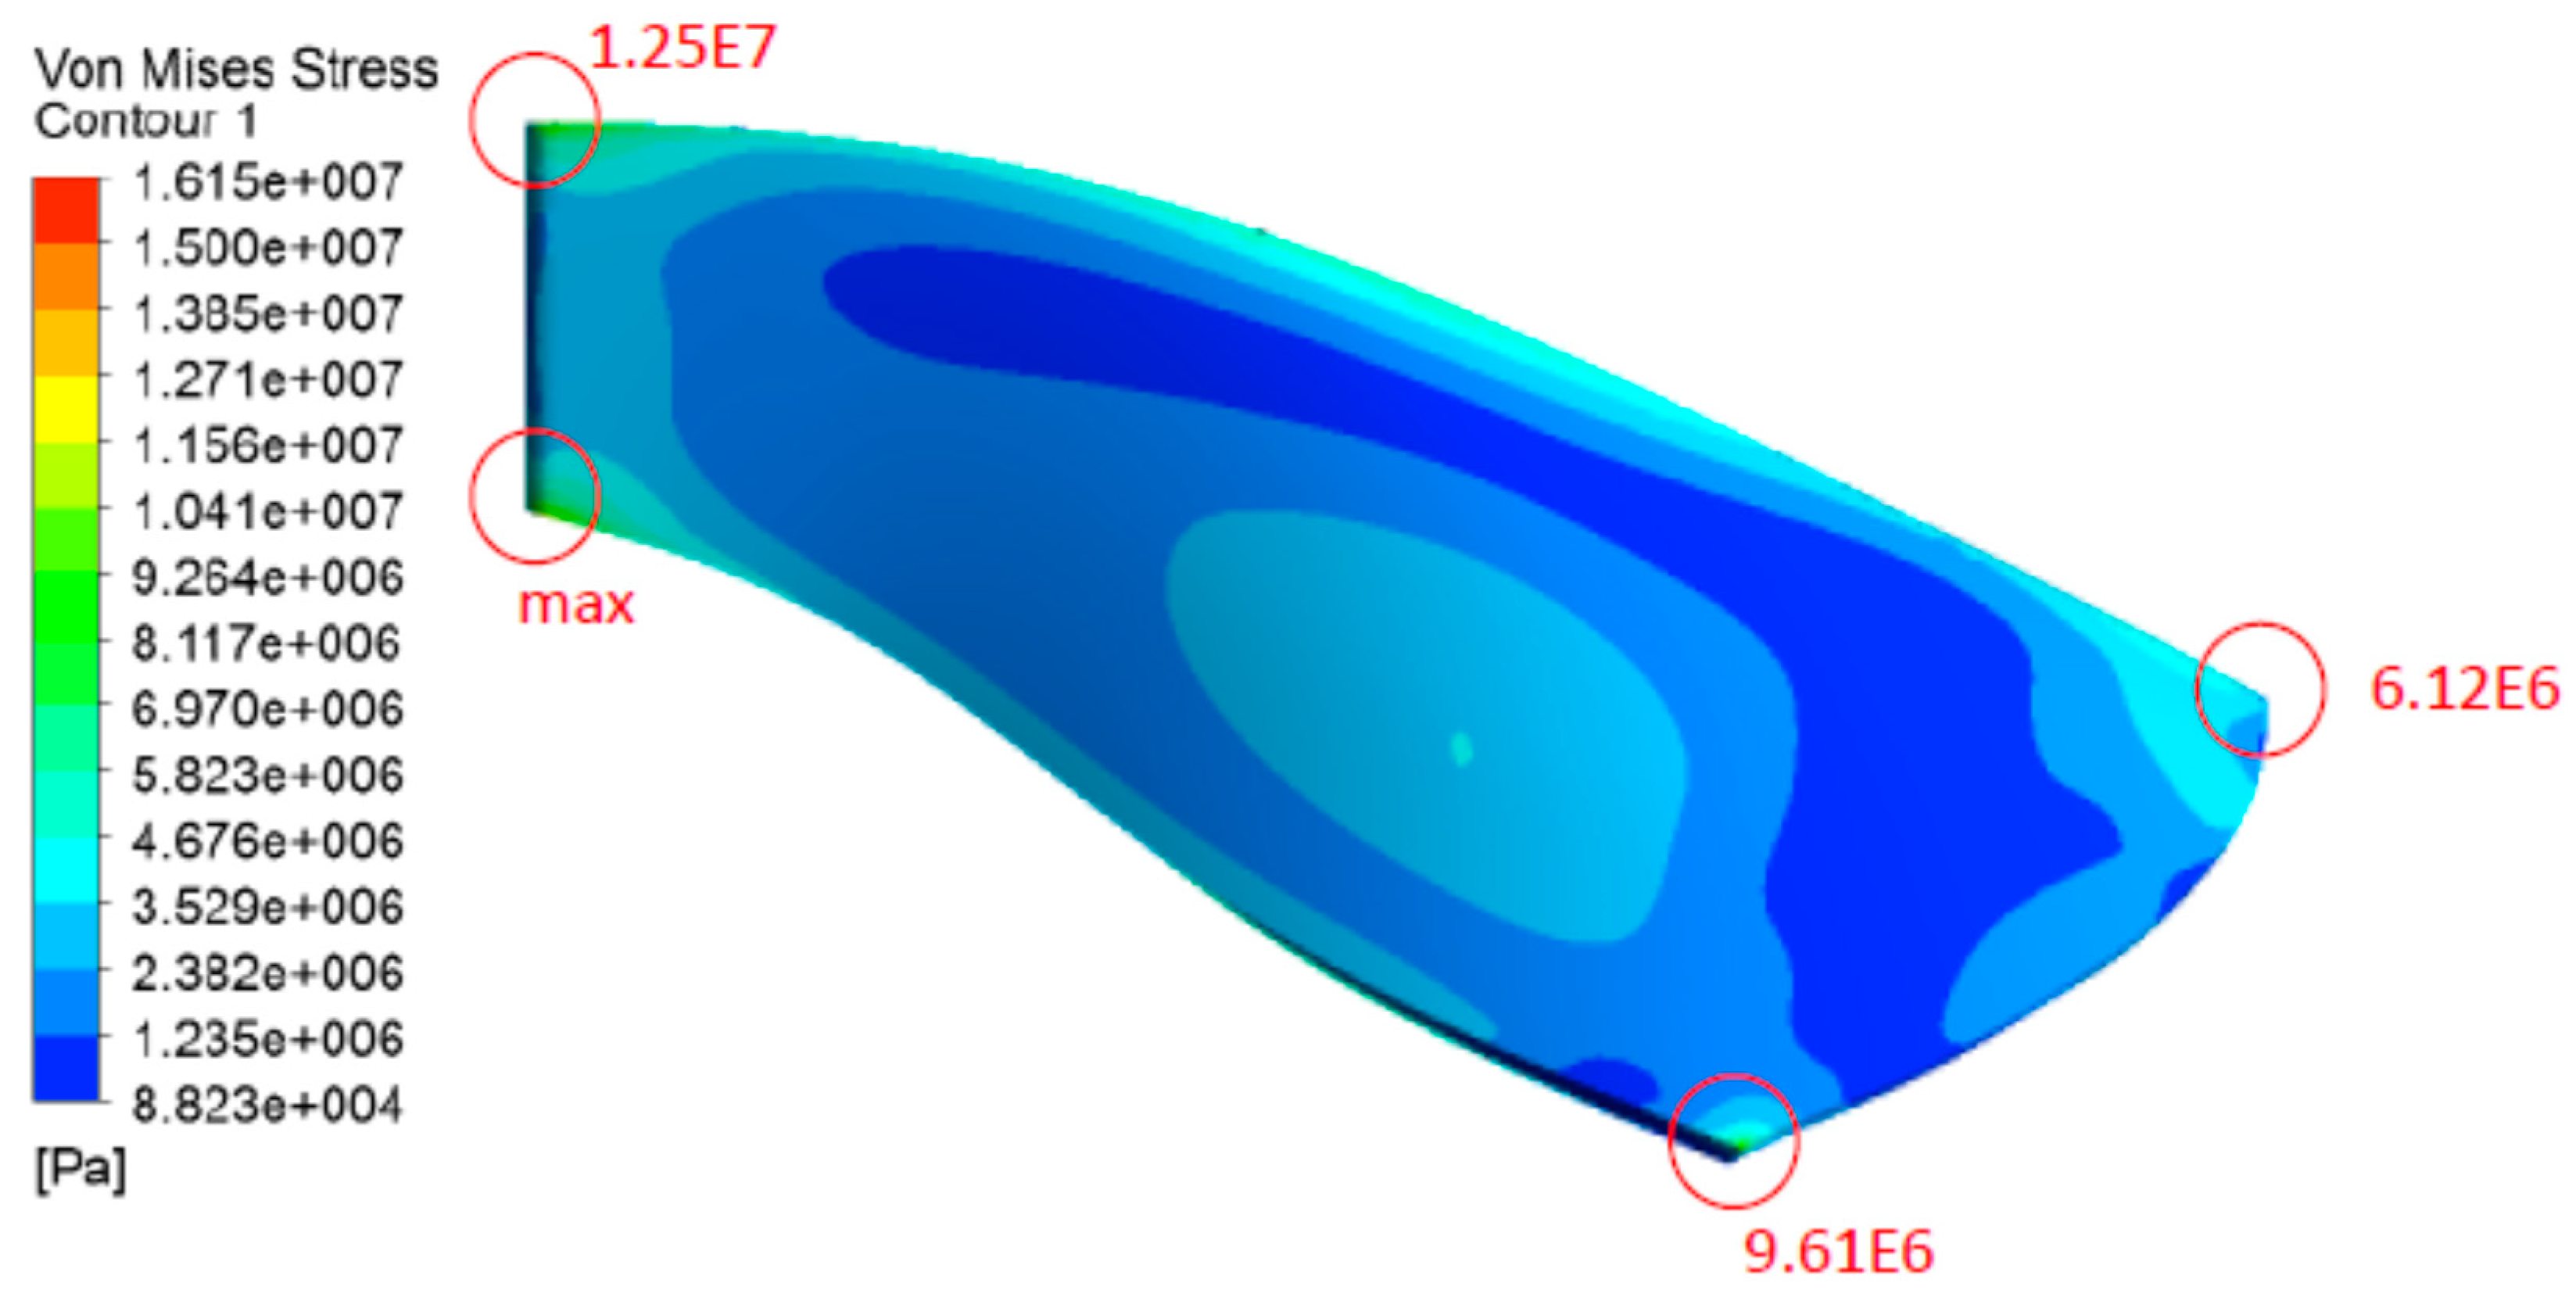
2.5. FSI as a Multiphysics Approach
3. Experimental and Numerical Investigation for Cavitation Erosion
3.1. Introduction
3.2. Experimental Techniques
3.3. Cavitation Research by CFD
3.4. Vortex Rope Formation
4. Experimental and Numerical Investigation for Coalesced Effect of Sediment and Cavitation Erosion
4.1. Introduction
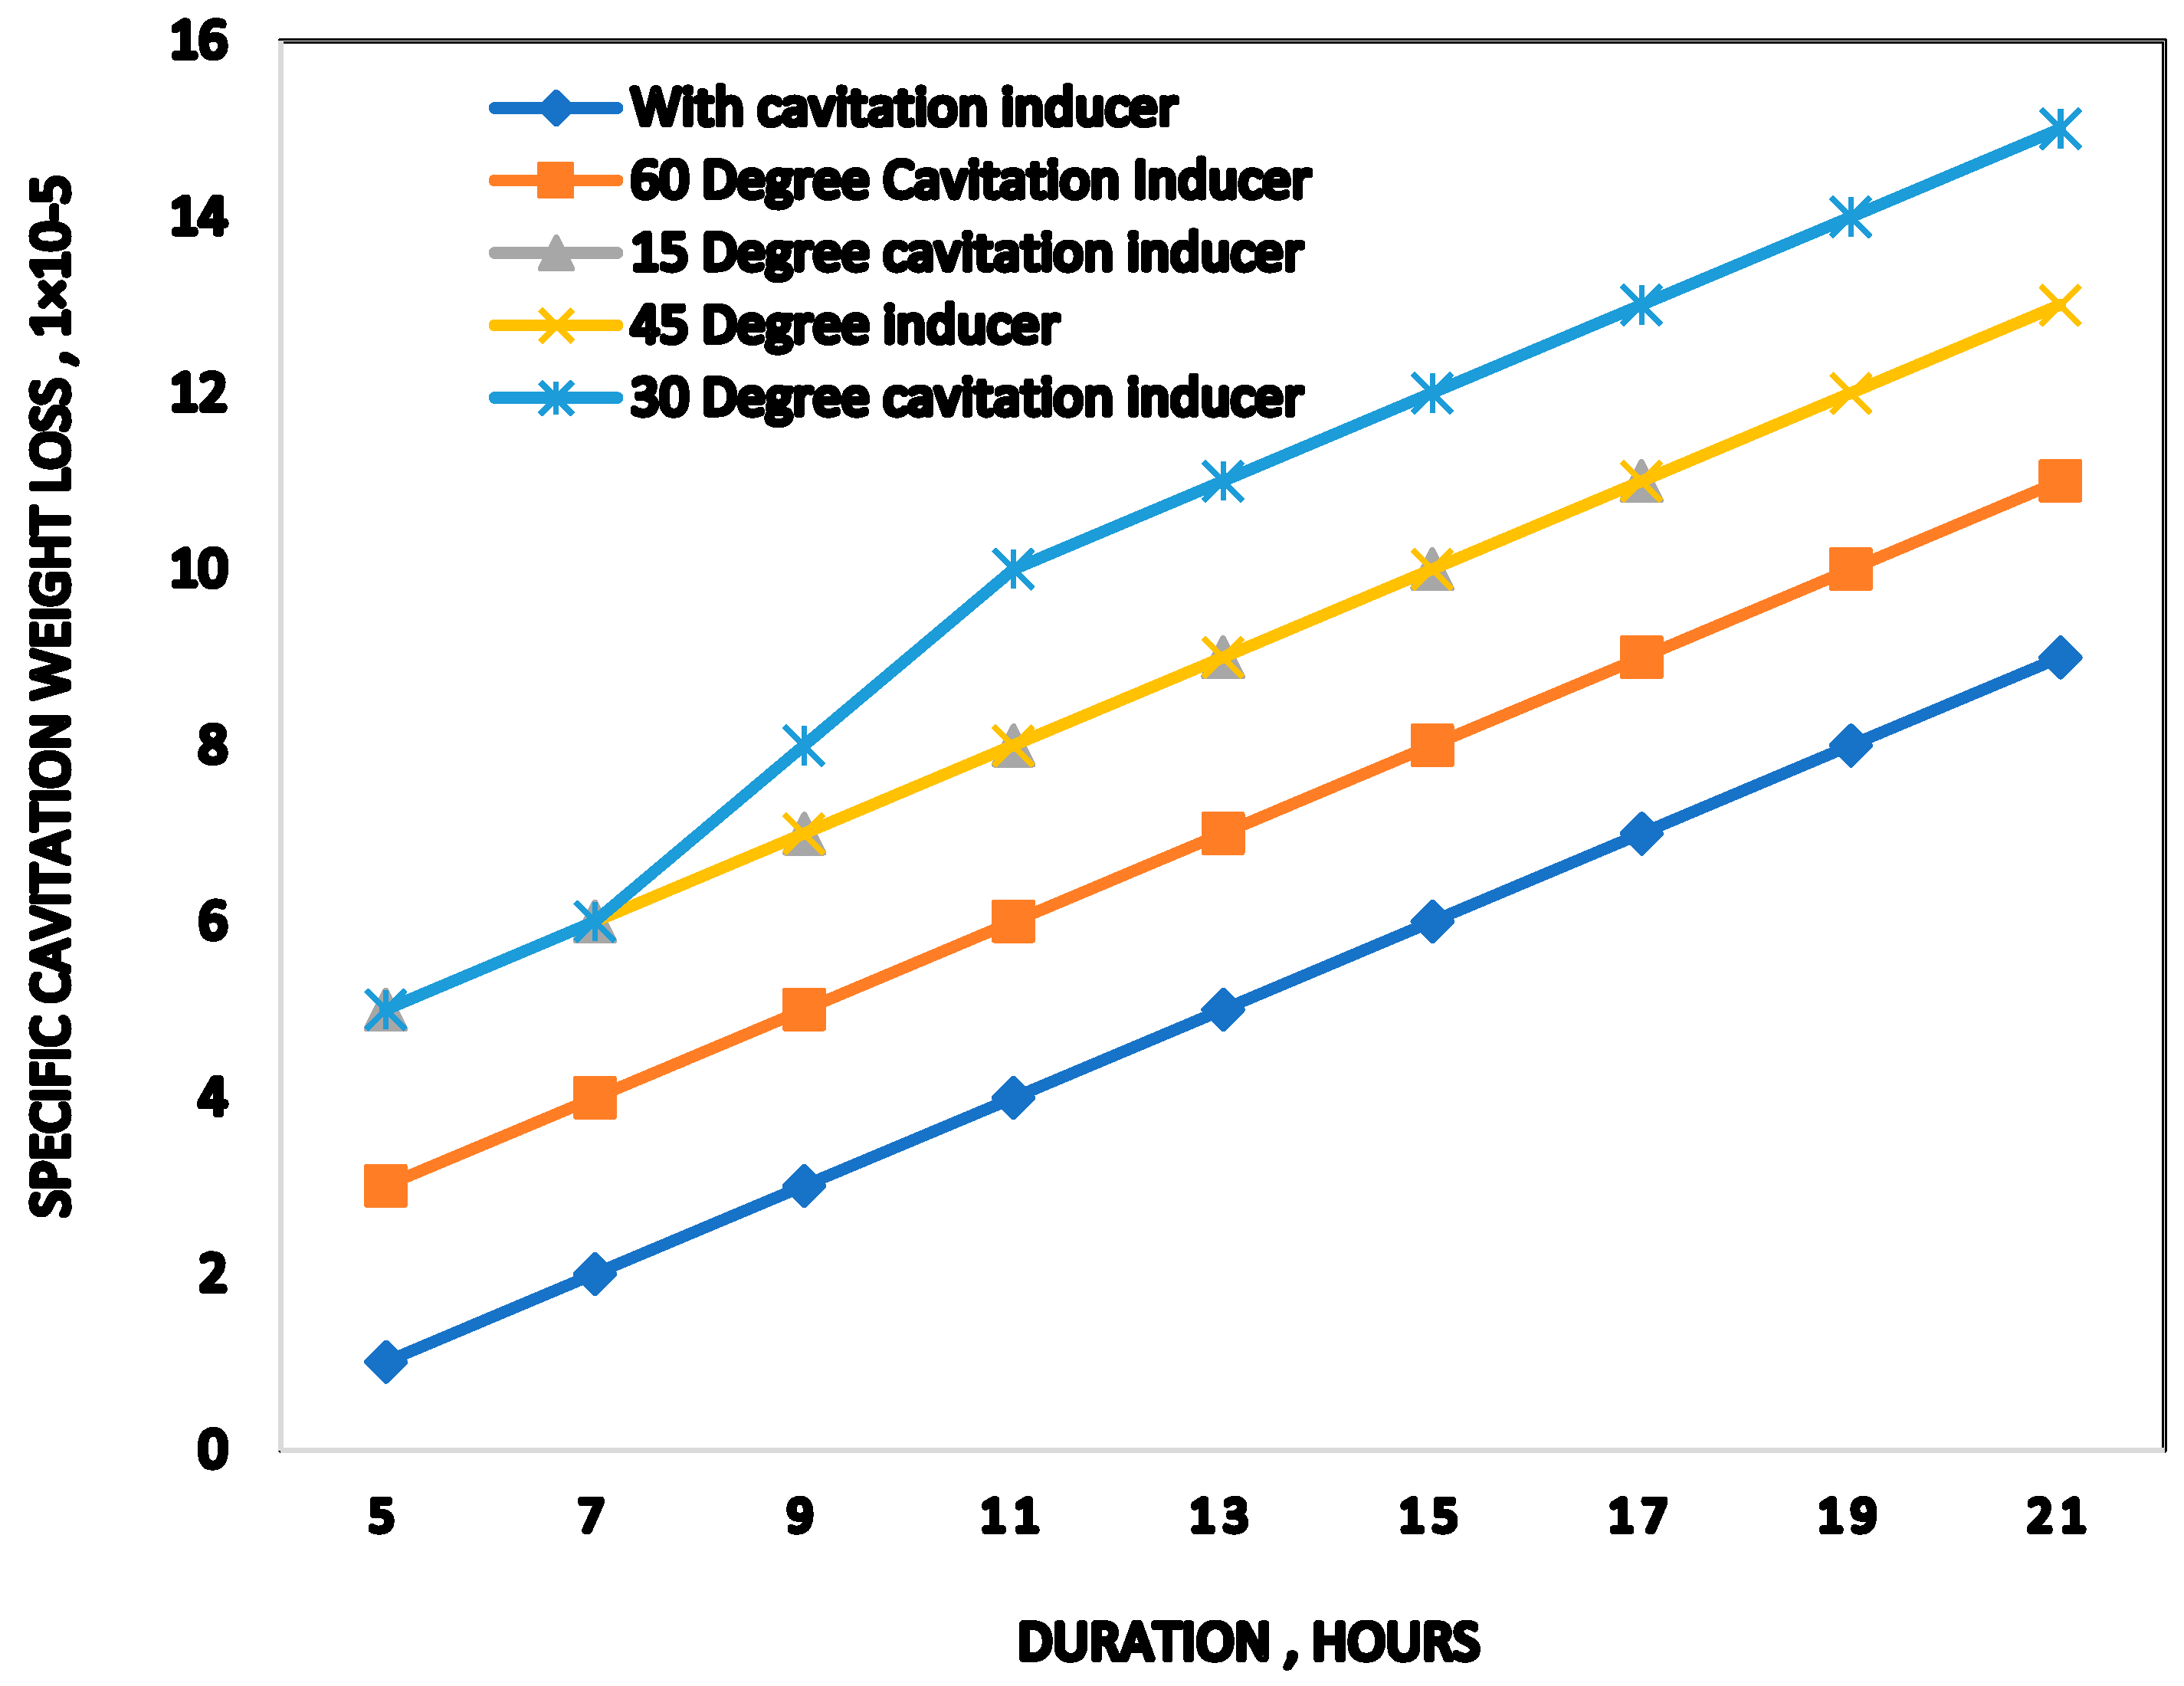
4.2. Use of Cavitation Inducers
5. Current Status and Future Prospects
- Appropriate testing time should be utilized in which the true behavior of erosion can be obtained during the experiments. It is possible to “speed up” the events in the model which may occur over a relatively long time in the prototype by utilizing the time scales appropriately.
- Selection of suitable similarity formulae and conditions, such as dynamic, kinematic, and geometric similarity requirements should all be satisfied.
- Avoid using distorted models, and if they are utilized, interpretation of the results should be done carefully.
6. Conclusions
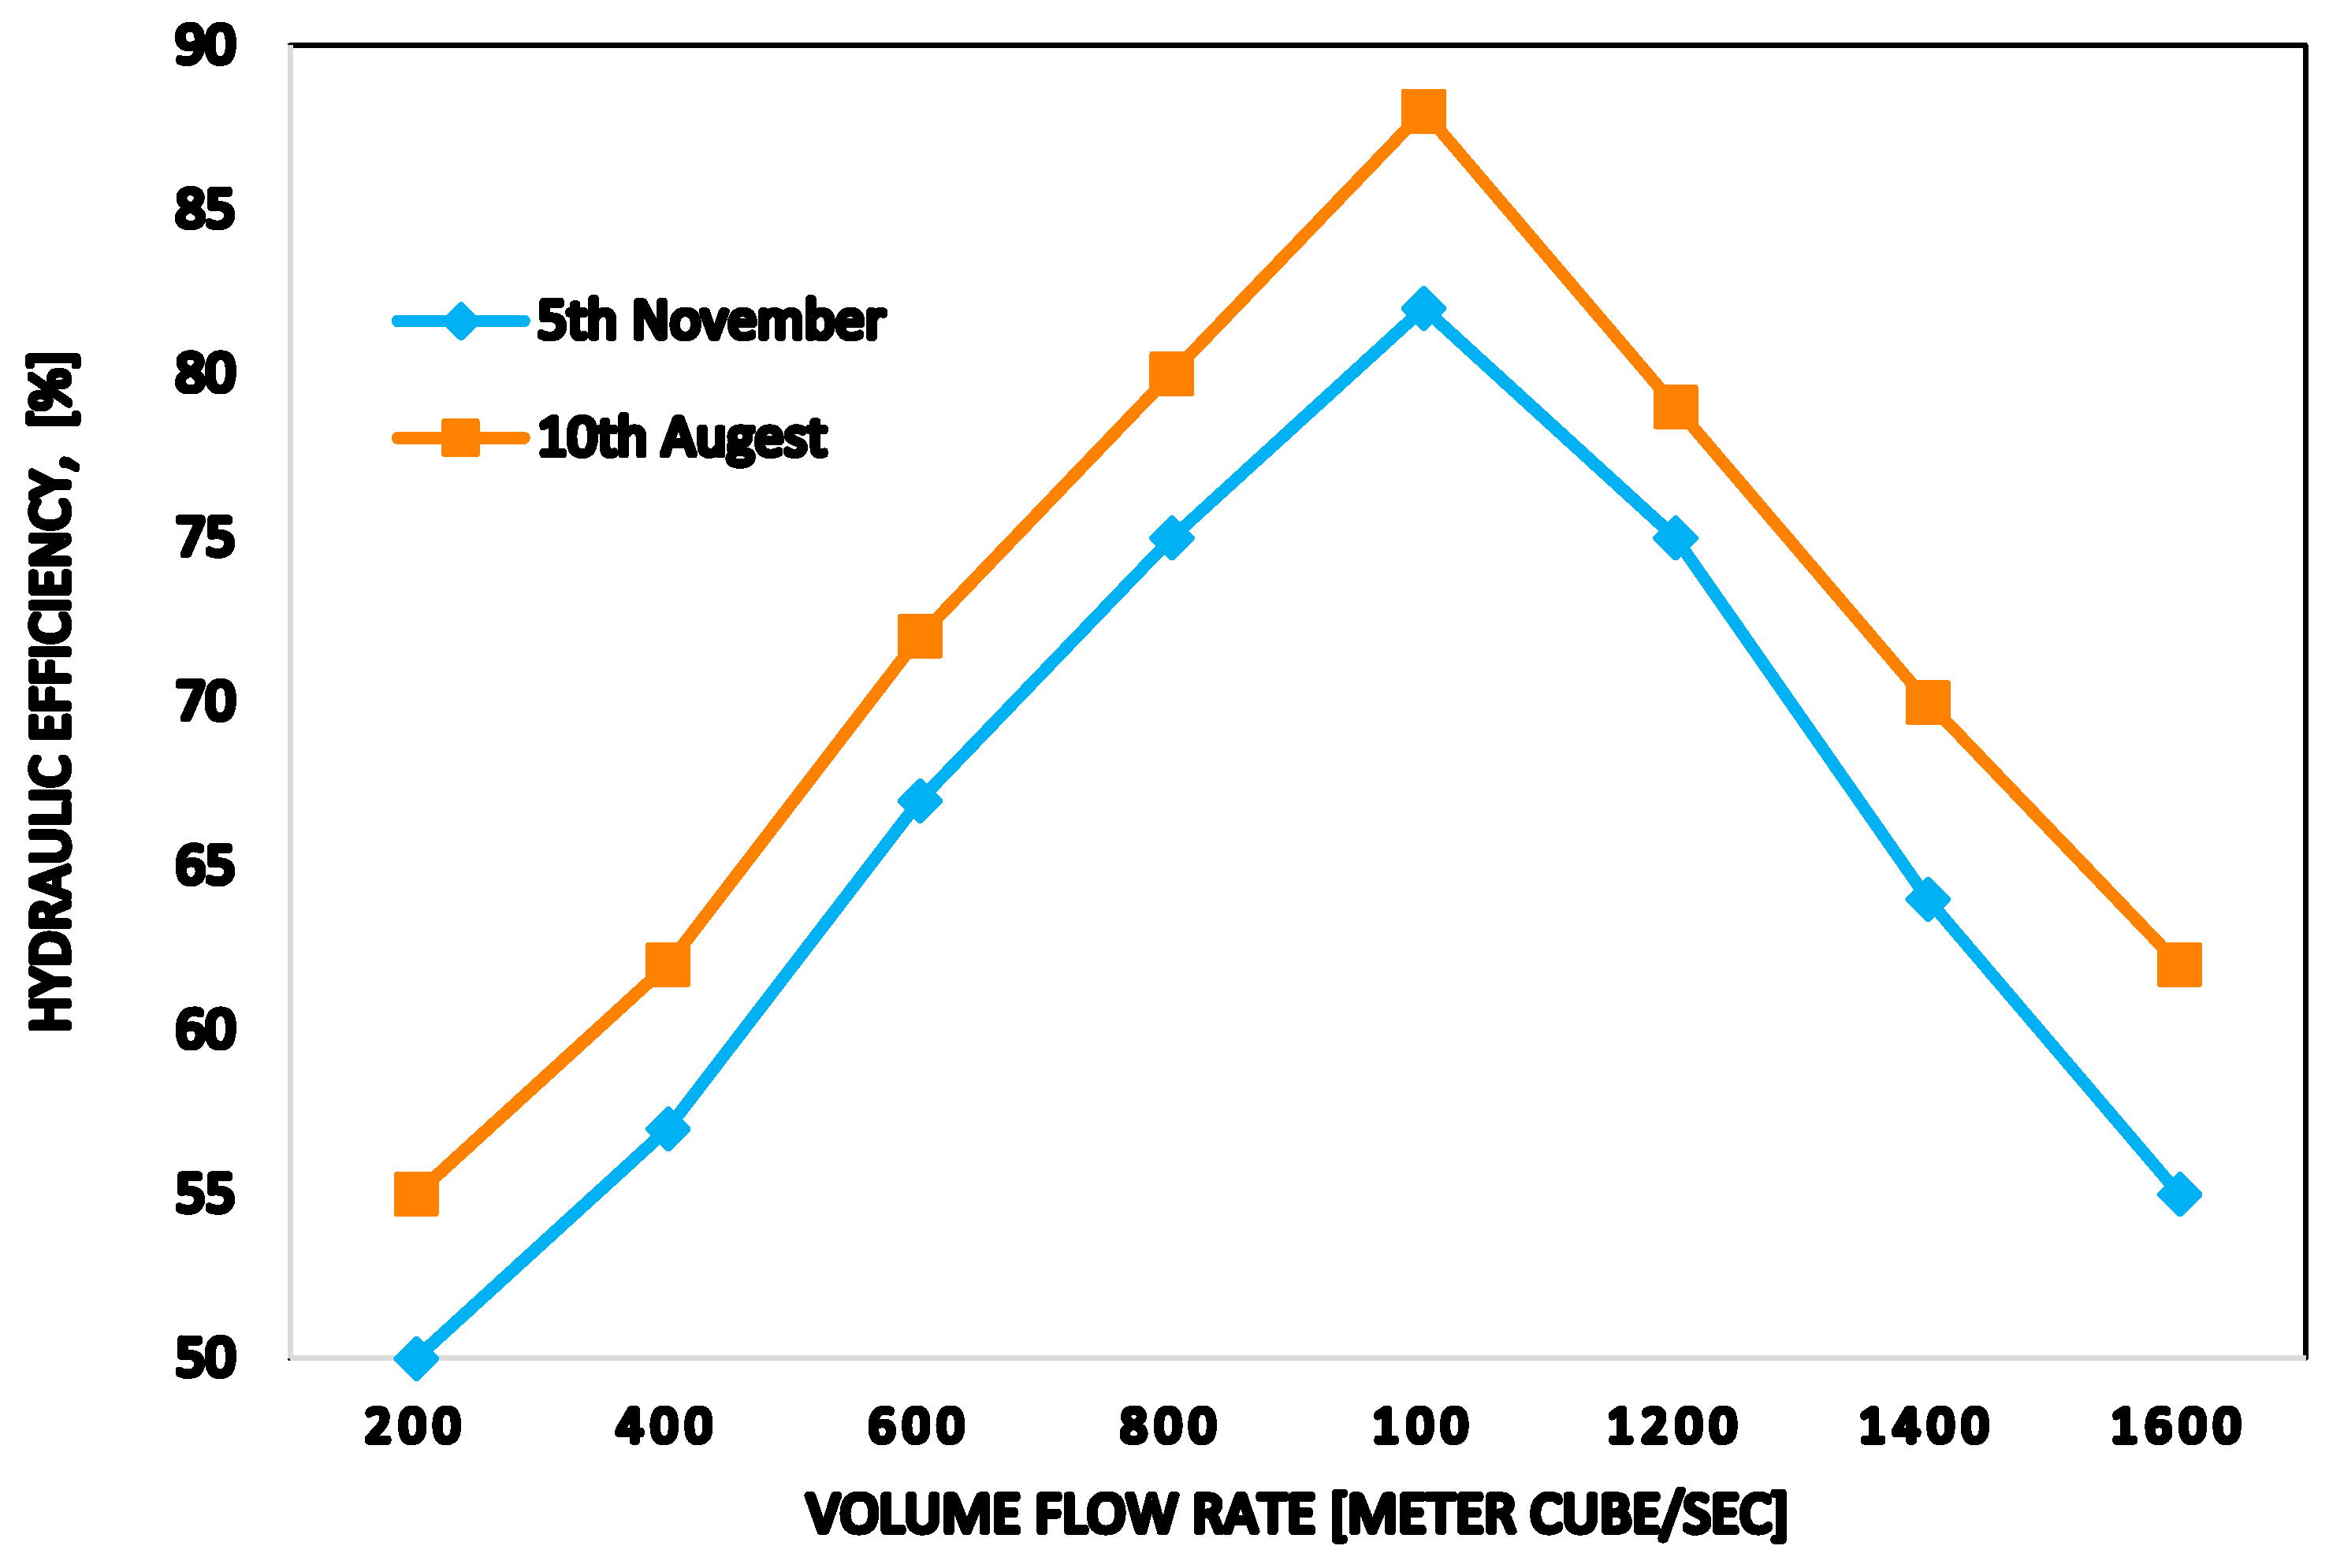
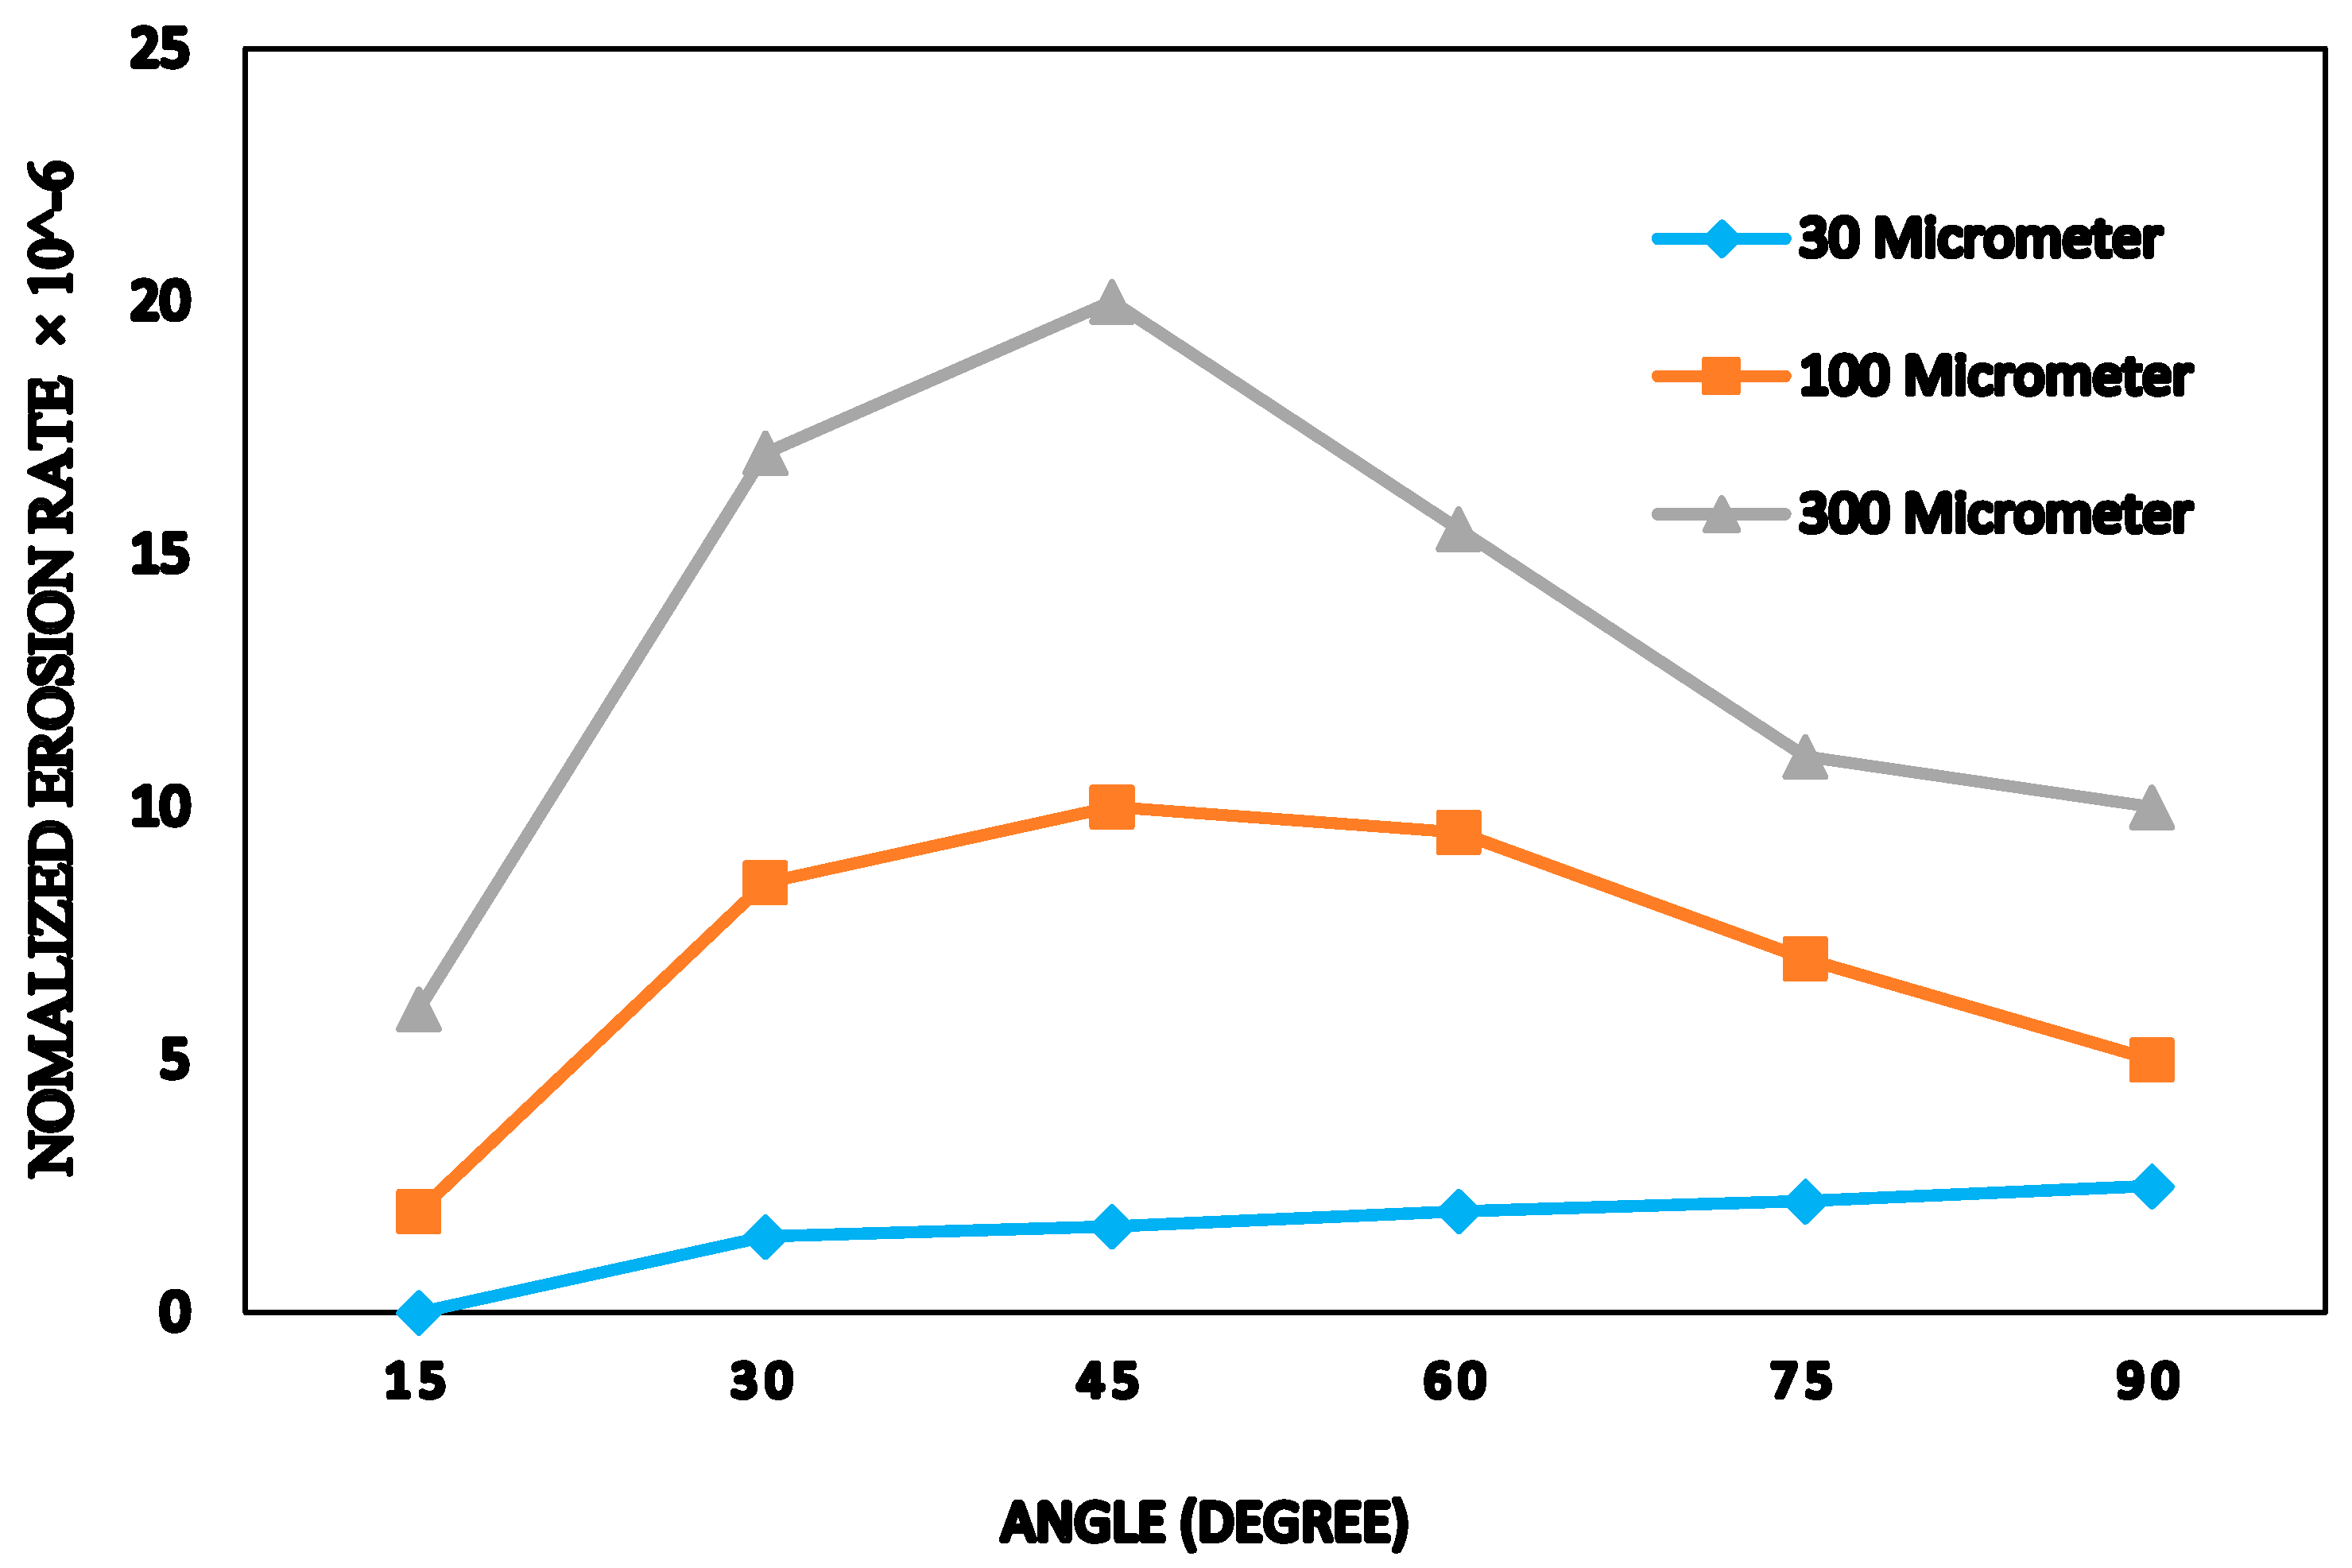
- Sediment erosion severely damages turbine parts in hydroelectric power plants. It is observed that the size, shape, and concentration of sediment particles are important erosion parameters. Water flowrate and head are significant flow properties. Surface of the erodent is yet another important parameter. Sediment erosion not only deteriorates the surface of the turbine components, but it also causes efficiency loss and high maintenance cost is required periodically. The technology advancements have led to extensive use of computational tools for solving sediment erosion problems.
- Cavitation inducers and some latest visualization techniques like PIV, LDV etc. are used by several researchers as experimental means to study the cavitation phenomena. In the last decade, numerical methodology has been used extensively and tangible results have been achieved.
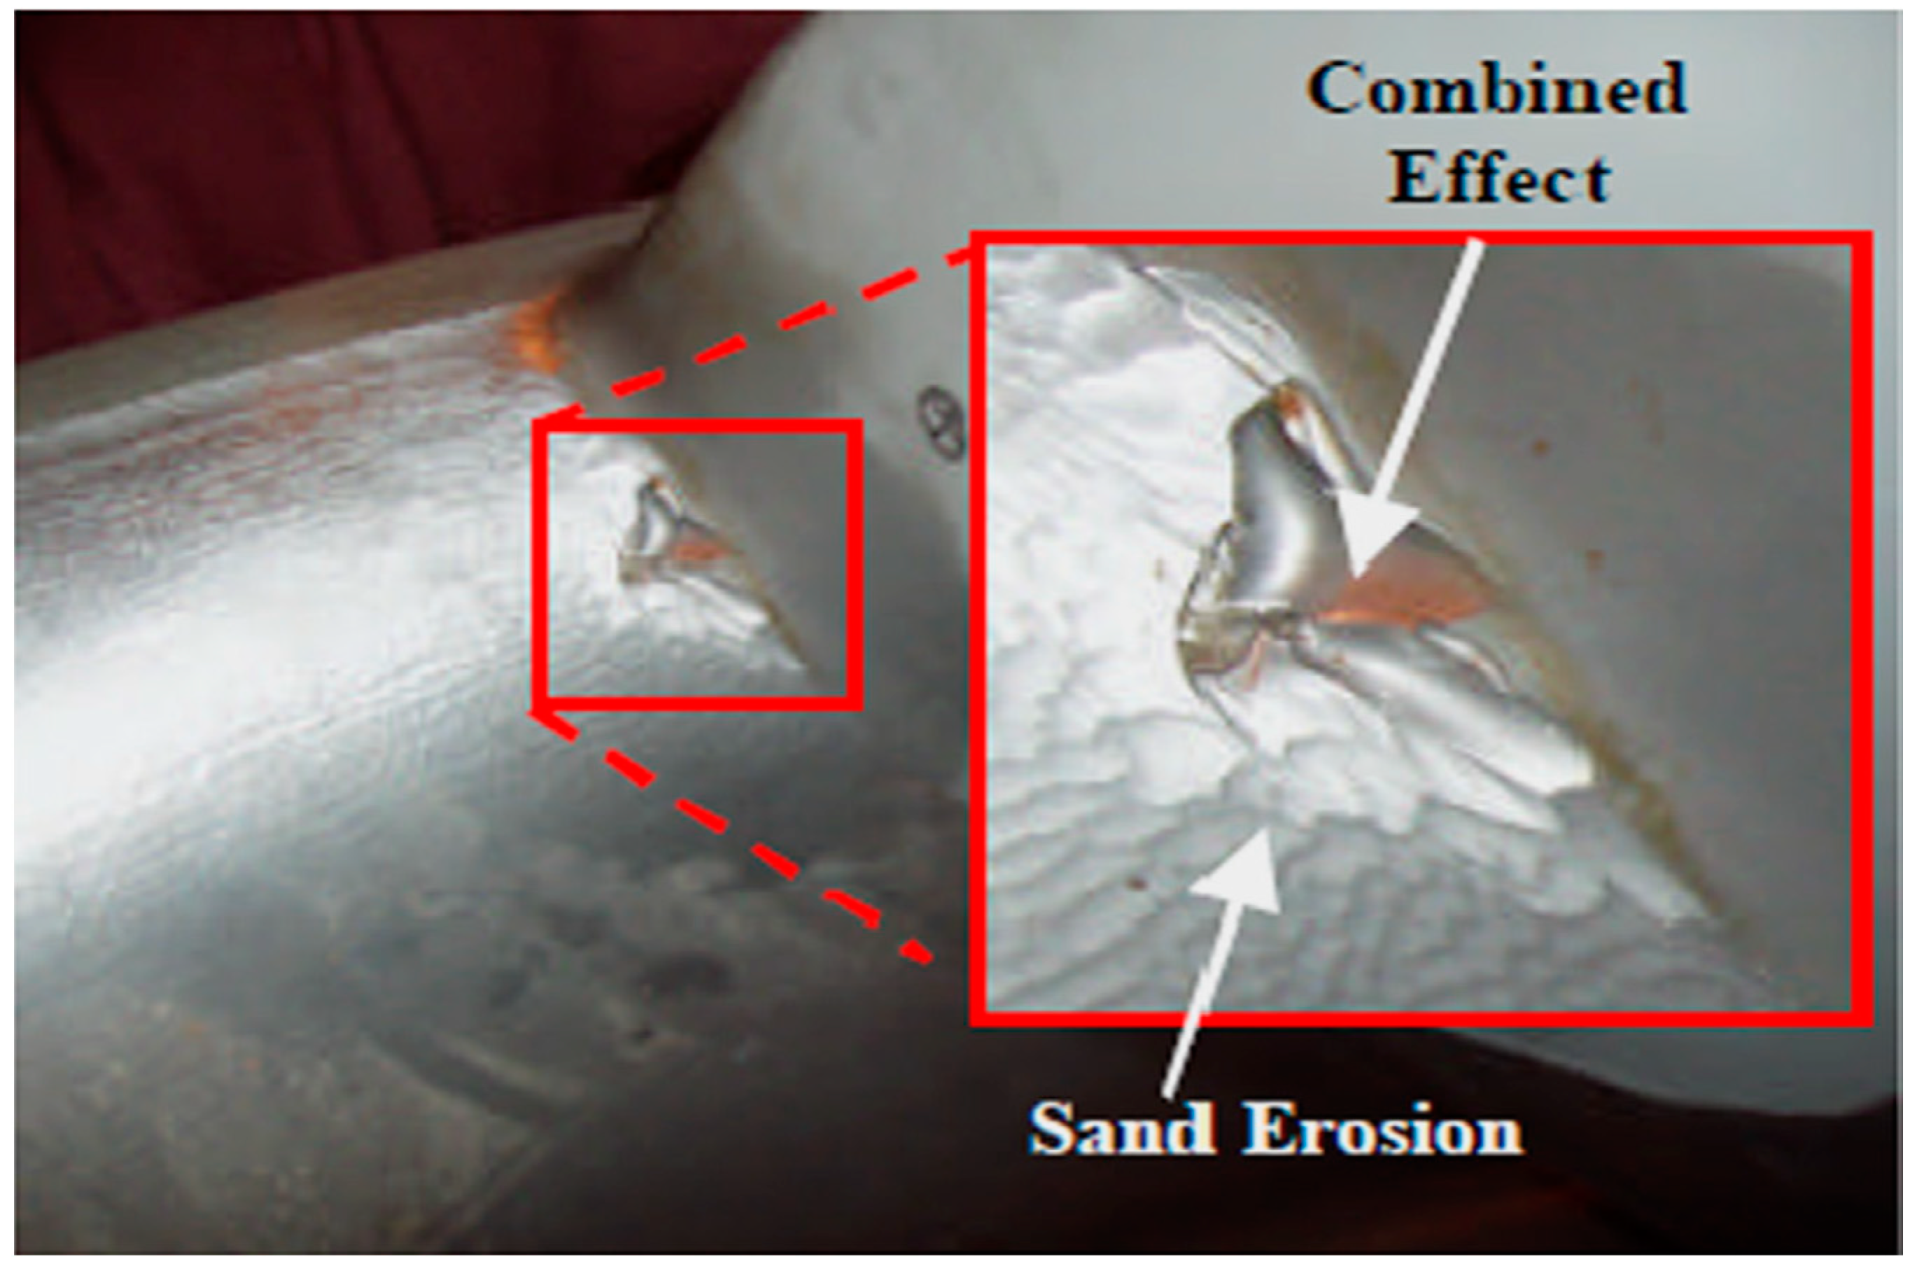
- Study of the coalesced effect of sediment and cavitation erosion in hydroelectric power turbines is a challenging issue for future research. Therefore, it is recommended to develop an appropriate CFD methodology validated through experimental techniques for the quantification of combined effect.
Author Contributions
Funding
Institutional Review Board Statement
Informed Consent Statement
Data Availability Statement
Conflicts of Interest
References
- Khan, N.M.; Hameed, A.; Qazi, A.U.; Sharif, M.B.; Tingsanchali, T. Significance and sustainability of freshwater reservoirs: Case study of Tarbela dam. Pak. J. Sci. 2011, 63, 213–218. [Google Scholar]
- Petkovsek, G.; Roca, M. Impact of reservoir operation on sediment deposition. Proc. ICE Water Manag. 2014, 167, 577–584. [Google Scholar] [CrossRef] [Green Version]
- Jia, J. A Technical Review of Hydro-Project Development in China. Engineering 2016, 2, 302–312. [Google Scholar] [CrossRef] [Green Version]
- Abid, M.; Siddiqui, M. Multiphase Flow Simulations through Tarbela Dam Spillways and Tunnels. J. Water Resour. Prot. 2010, 2, 532–539. [Google Scholar] [CrossRef] [Green Version]
- Abid, M.; Noon, A.A. Turbulent Flow Simulations through Tarbela Dam Tunnel-2. J. Eng. 2010, 2, 507–515. [Google Scholar] [CrossRef]
- Thapa, B.S.; Thapa, B.; Dahlhaug, O.G. Empirical modelling of sediment erosion in Francis turbines. Energy 2012, 41, 386–391. [Google Scholar] [CrossRef]
- Koirala, R.; Thapa, B.; Neopane, H.P.; Zhu, B.; Chhetry, B. Sediment erosion in guide vanes of Francis turbine: A case study of Kaligandaki Hydropower Plant, Nepal. Wear 2016, 362–363, 53–60. [Google Scholar] [CrossRef]
- Goyal, R.; Gandhi, B.K. Review of hydrodynamics instabilities in Francis turbine during off-design and transient operations. Renew. Energy 2018, 116, 697–709. [Google Scholar] [CrossRef]
- Tomaz, R. An Investigation of the Relationship between Acoustic Emission, Vibration, Noise and Cavitation Structures on a Kaplan Turbine. J. Fluids Eng. 2007, 129, 1112–1122. [Google Scholar]
- Chitrakar, S.; Singh, B.; Gunnar, O.; Prasad, H. Numerical and experimental study of the leakage flow in guide vanes with different hydrofoils. J. Comput. Des. Eng. 2017, 4, 218–230. [Google Scholar] [CrossRef]
- Rao, P.; Buckley, D.H. Predictive capability of long-term cavitation and liquid impingement erosion models. Wear 1984, 94, 259–274. [Google Scholar] [CrossRef]
- Rajkarnikar, B.; Neopane, H.P.; Thapa, B.S. Development of rotating disc apparatus for test of sediment-induced erosion in francis runner blades. Wear 2013, 306, 119–125. [Google Scholar] [CrossRef]
- Chitrakar, S.; Neopane, H.P.; Dahlhaug, O.G. Study of the simultaneous effects of secondary flow and sediment erosion in Francis turbines. Renew. Energy 2016, 97, 881–891. [Google Scholar] [CrossRef]
- Ghenaiet, A. Prediction of Erosion Induced By Solid Particles in a Water Turbine. In Proceedings of the 11th European Conference Turbomachinery Fluids Daynamics and Thermodynamics, Madrid, Spain, 23–27 March 2015; pp. 1–13. [Google Scholar]
- Koirala, R.; Prasad, H.; Shrestha, O.; Zhu, B.; Thapa, B. Selection of guide vane pro file for erosion handling in Francis turbines. Renew. Energy 2017, 112, 328–336. [Google Scholar] [CrossRef]
- Javaheri, V.; Portera, D.; Kuokkalab, V.-T. Slurry erosion of steel—Review of tests, mechanisms and materials. Wear 2018, 408–409, 248–273. [Google Scholar] [CrossRef]
- Noon, A.A.; Kim, M.-H. Erosion wear on Francis turbine components due to sediment flow. Wear 2017, 378–379, 126–135. [Google Scholar] [CrossRef]
- Eltvik, M. Sediment Erosion in Francis Turbines. Ph.D. Thesis, NTNU, Trondheim, Norway, 2013. [Google Scholar]
- Alveyro, L.; Jose, F.; Aida, S. Performance improvement of a 500-kW Francis turbine based on CFD. Renew. Energy 2016, 96, 977–992. [Google Scholar]
- Aponte, R.; Teran, L.; Ladino, J.; Larrahondo, F.; Coronado, J.; Rodríguez, S. Computational study of the particle size effect on a jet erosion wear device. Wear 2017, 374–375, 97–103. [Google Scholar] [CrossRef]
- Kocak, E.; Karaaslan, S.; Yucel, N.; Arundas, F. A Numerical Case Study: Bovet Approach to Design a Francis Turbine Runner. Energy Procedia 2017, 111, 885–894. [Google Scholar] [CrossRef]
- Liu, X.; Luo, Y.; Karney, B.W.; Wang, W. A selected literature review of efficiency improvements in hydraulic turbines. Renew. Sustain. Energy Rev. 2015, 51, 18–28. [Google Scholar] [CrossRef]
- Maruzewski, P.; Hasmatuchi, V.; Mombelli, H.-P.; Burggraeve, D.; Iosfin, J.; Finnegan, P.; Avellan, F. Surface Roughness Impact on Francis Turbine Performances and Prediction of Efficiency Step Up. Int. J. Fluid Mach. Syst. 2009, 2, 353–362. [Google Scholar] [CrossRef]
- Khanal, K.; Neopane, H.P.; Rai, S.; Thapa, M.; Bhatt, S.; Shrestha, R. A methodology for designing Francis runner blade to find minimum sediment erosion using CFD. Renew. Energy 2016, 87, 307–316. [Google Scholar] [CrossRef]
- Chitrakar, S. FSI Analysis of Francis Turbines Exposed to Sediment Erosion FSI Analysis of Francis Turbines Exposed to Sediment Erosion. Master’s Thesis, KTH, Stockholm, Sweden, July 2013. [Google Scholar]
- Müller, A.; Favrel, A.; Landry, C.; Avellan, F. Fluid–structure interaction mechanisms leading to dangerous power swings in Francis turbines at full load. J. Fluids Struct. 2017, 69, 56–71. [Google Scholar] [CrossRef]
- Jain, S.V.; Patel, R.N. Investigations on pump running in turbine mode: A review of the state-of-the-art. Renew. Sustain. Energy Rev. 2014, 30, 841–868. [Google Scholar] [CrossRef]
- Ghiban, B.; Safta, C.-A.; Ion, M.; Crângașu, C.E.; Grecu, M.-C. Structural Aspects of Silt Erosion Resistant Materials Used in Hydraulic Machines Manufacturing. Energy Procedia 2017, 112, 75–82. [Google Scholar] [CrossRef]
- Amarendra, H.J.; Chaudhari, G.P.; Nath, S.K. Synergy of cavitation and slurry erosion in the slurry pot tester. Wear 2012, 290–291, 25–31. [Google Scholar] [CrossRef]
- Haosheng, C.; Jiadao, W.; Darong, C. Cavitation damages on solid surfaces in suspensions containing spherical and irregular microparticles. Wear 2008, 126, 1–4. [Google Scholar] [CrossRef]
- Franc, J.-P.; Riondet, M.; Karimi, A.; Chahine, G.L. Material and velocity effects on cavitation erosion pitting. Wear 2012, 274-275, 248–259. [Google Scholar] [CrossRef]
- Pereira, J.G.; Andolfatto, L.; Avellan, F. Monitoring a Francis turbine operating conditions. Flow Meas. Instrum. 2018, 63, 37–46. [Google Scholar] [CrossRef]
- Thapa, B.S.; Dahlhaug, O.G.; Thapa, B. Flow measurements around guide vanes of Francis turbine: A PIV approach. Renew. Energy 2018, 126, 177–188. [Google Scholar] [CrossRef]
- Venturini, M.; Manservigi, L.; Alvisi, S.; Simani, S. Development of a physics-based model to predict the performance of pumps as turbines. Appl. Energy 2018, 231, 343–354. [Google Scholar] [CrossRef]
- Gohil, P.; Saini, R. Indian Institute of Technology Roorkee Numerical Study of Cavitation in Francis Turbine of a Small Hydro Power Plant. J. Appl. Fluid Mech. 2016, 9, 357–365. [Google Scholar]
- Sreedhar, B.; Albert, S.; Pandit, A. Cavitation damage: Theory and measurements—A review. Wear 2017, 372–373, 177–196. [Google Scholar] [CrossRef]
- Iliescu, M.S.; Ciocan, G.D.; Avellan, F. Analysis of the Cavitating Draft Tube Vortex in a Francis Turbine Using Particle Image Velocimetry Measurements in Two-Phase Flow. J. Fluids Eng. 2008, 130, 1–10. [Google Scholar] [CrossRef]
- Arispe, T.M.; Oliveira, W.; Ramirez, R.G. Francis turbine draft tube parameterization and analysis of performance characteristics using CFD techniques. Renew. Energy 2018, 127, 114–124. [Google Scholar] [CrossRef]
- Mohanta, R.K.; Chelliah, T.R.; Allamsetty, S.; Akula, A.; Ghosh, R. Sources of vibration and their treatment in hydro power stations—A Review. Eng. Sci. Technol. Int. J. 2017, 20, 637–648. [Google Scholar] [CrossRef] [Green Version]
- Kang, Z.; Feng, C.; Liu, Z.; Cang, Y.; Gao, S. Analysis of the incipient cavitation noise signal characteristics of hydroturbine. Appl. Acoust. 2017, 127, 118–125. [Google Scholar] [CrossRef]
- Zhang, Y.; Liu, K.; Xian, H.; Du, X. A review of methods for vortex identification in hydroturbines. Renew. Sustain. Energy Rev. 2018, 81, 1269–1285. [Google Scholar] [CrossRef]
- Kc, A.; Thapa, B.; Lee, Y. Transient numerical analysis of rotor e stator interaction in a Francis turbine. Renew. Energy 2014, 65, 227–235. [Google Scholar] [CrossRef]
- Celebioglu, K.; Altintas, B.; Aradag, S.; Tascioglu, Y. Numerical research of cavitation on Francis turbine runners. Int. J. Hydrogen Energy 2017, 43, 1–11. [Google Scholar] [CrossRef]
- Zhang, Y.; Qian, Z.; Ji, B.; Wu, Y. A review of microscopic interactions between cavitation bubbles and particles in silt-laden flow. Renew. Sustain. Energy Rev. 2016, 56, 303–318. [Google Scholar] [CrossRef]
- Hu, H.X.; Zheng, Y.G. The effect of sand particle concentrations on the vibratory cavitation erosion. Wear 2017, 384–385, 95–105. [Google Scholar] [CrossRef]
- Roa, C.; Munoz, J.; Teran, L.; Valdes, J.; Rodriguez, S.; Coronado, J.; Ladino, A. Effect of tribometer configuration on the analysis of hydromachinery wear failure. Wear 2015, 332–333, 1164–1175. [Google Scholar] [CrossRef]
- Gohil, P.P.; Saini, R. Coalesced effect of cavitation and silt erosion in hydro turbines—A review. Renew. Sustain. Energy Rev. 2014, 33, 280–289. [Google Scholar] [CrossRef]
- Trivedi, C.; Dahlhaug, O. A Comprehensive Review of Verification and Validation Techniques Applied to Hydraulic Turbines. Int. J. Fluid Mach. Syst. 2019, 12, 345–367. [Google Scholar] [CrossRef]


| Model | Equation | Parameters |
|---|---|---|
| Thapa et al. [6] | Km = the material factor and Kf = the flow factor C = silt concentration kg/m3 Kshape and Khardness = shape and hardness factors respectively. | |
| Rajkarnikar et al. [12] | ei = cumulative erosion after test i in mg/gm, W0 is weight of test specimen at the beginning of the experiment in gm, Wi is weight of test specimen after test i in gm. | |
| Teran et al. [16] | E = Dimensionless mass loss, N is the rate of number of particles, mp is average particle mass. | |
| Aponte et al. [20] | NE is the dimensionless normalized erosion, Er is the erosion rate in kg/s, Vj is the average velocity of jet in m/s, A0 is the jet outlet cross-sectional area, C is concentration of sand, and ρH2O is density of water in kg/m3. |
| Investigators | Details of Tests/Models | Major Conclusions |
|---|---|---|
| Franc et al. [31] | Cavitation rate depends on: pitting rate, coverage rate, and depth of deformation rate | |
| Gohil et al. [35] | Correlations developed for cavitation rate and normalized efficiency loss, useful for the plant operators. To predict the degradation rate of performance. | |
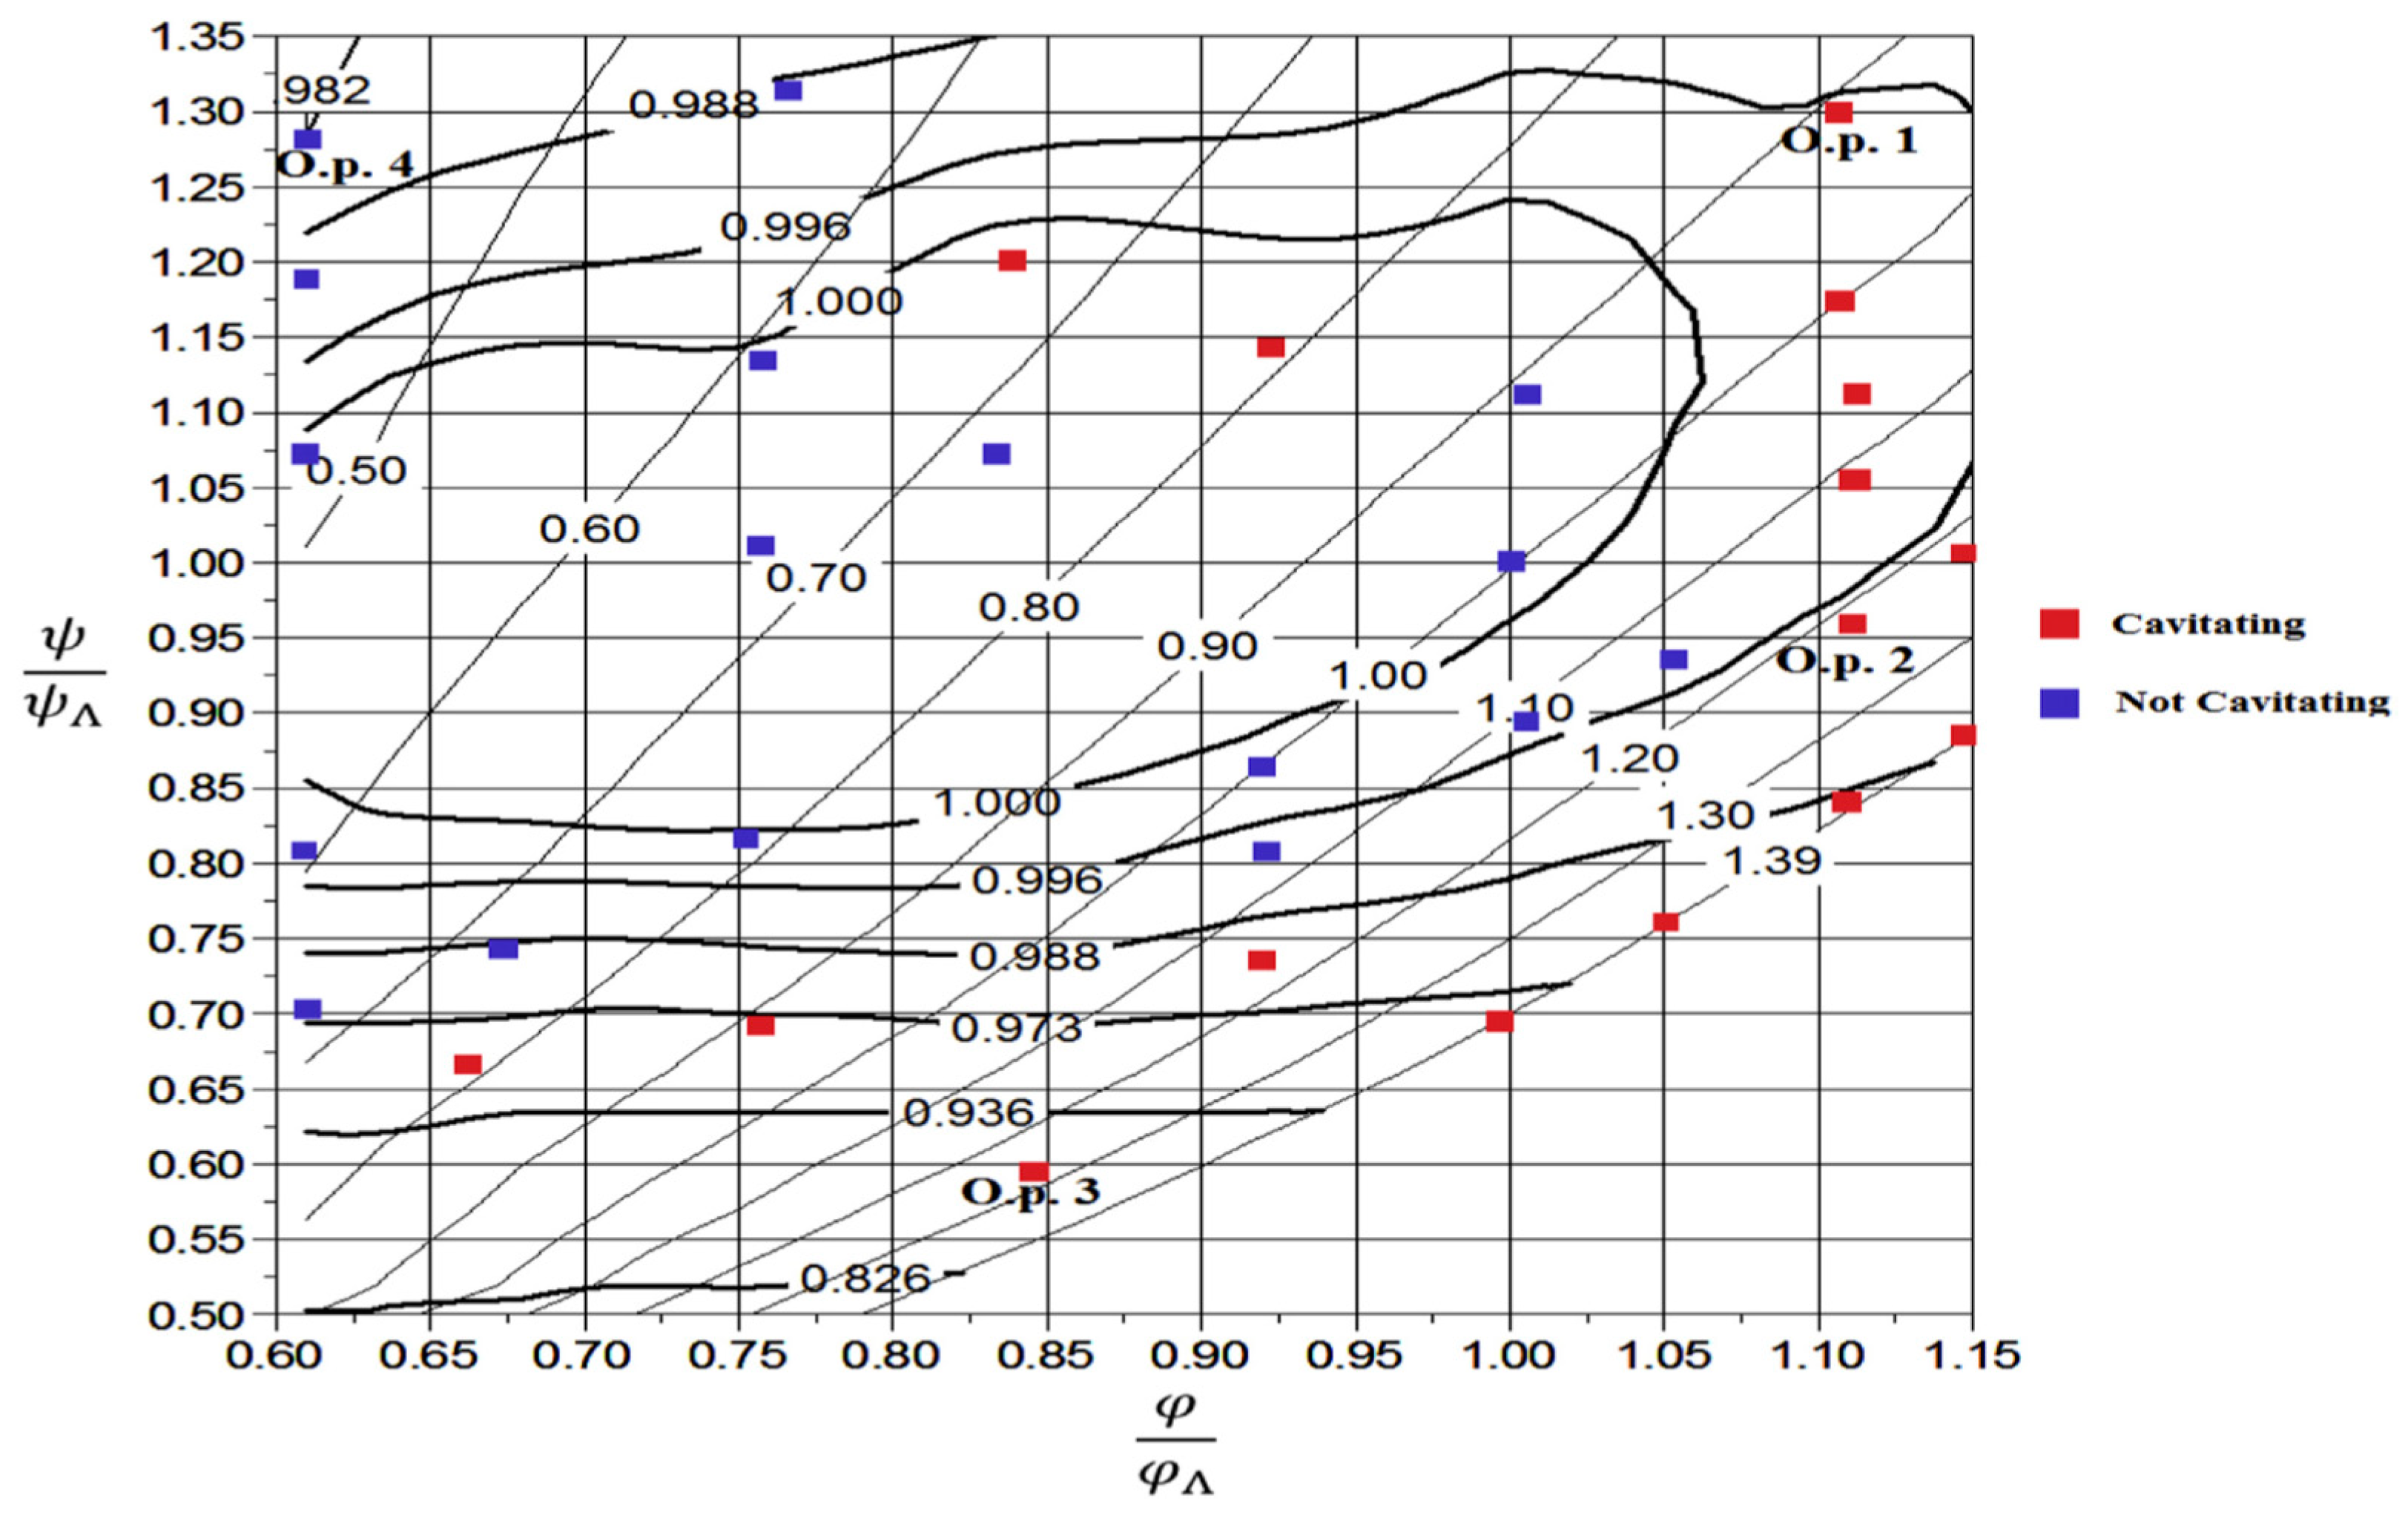
| Celebioglu et al. [43] | Head coefficient and discharge coefficients are used to plot a numerical hill chart. The methodology developed for the minimization of cavitation at off-design. The cavitation limit is determined by using the cavitating and non-cavitating operating points. |
Publisher’s Note: MDPI stays neutral with regard to jurisdictional claims in published maps and institutional affiliations. |
© 2021 by the authors. Licensee MDPI, Basel, Switzerland. This article is an open access article distributed under the terms and conditions of the Creative Commons Attribution (CC BY) license (http://creativecommons.org/licenses/by/4.0/).
Share and Cite
Noon, A.A.; Kim, M.-H. Sediment and Cavitation Erosion in Francis Turbines—Review of Latest Experimental and Numerical Techniques. Energies 2021, 14, 1516. https://doi.org/10.3390/en14061516
Noon AA, Kim M-H. Sediment and Cavitation Erosion in Francis Turbines—Review of Latest Experimental and Numerical Techniques. Energies. 2021; 14(6):1516. https://doi.org/10.3390/en14061516
Chicago/Turabian StyleNoon, Adnan Aslam, and Man-Hoe Kim. 2021. "Sediment and Cavitation Erosion in Francis Turbines—Review of Latest Experimental and Numerical Techniques" Energies 14, no. 6: 1516. https://doi.org/10.3390/en14061516