Relaxation to Fixed Points in the Logistic and Cubic Maps: Analytical and Numerical Investigation

Abstract
:1. Introduction
2. The Mappings and Relaxation to the Fixed Points Investigation

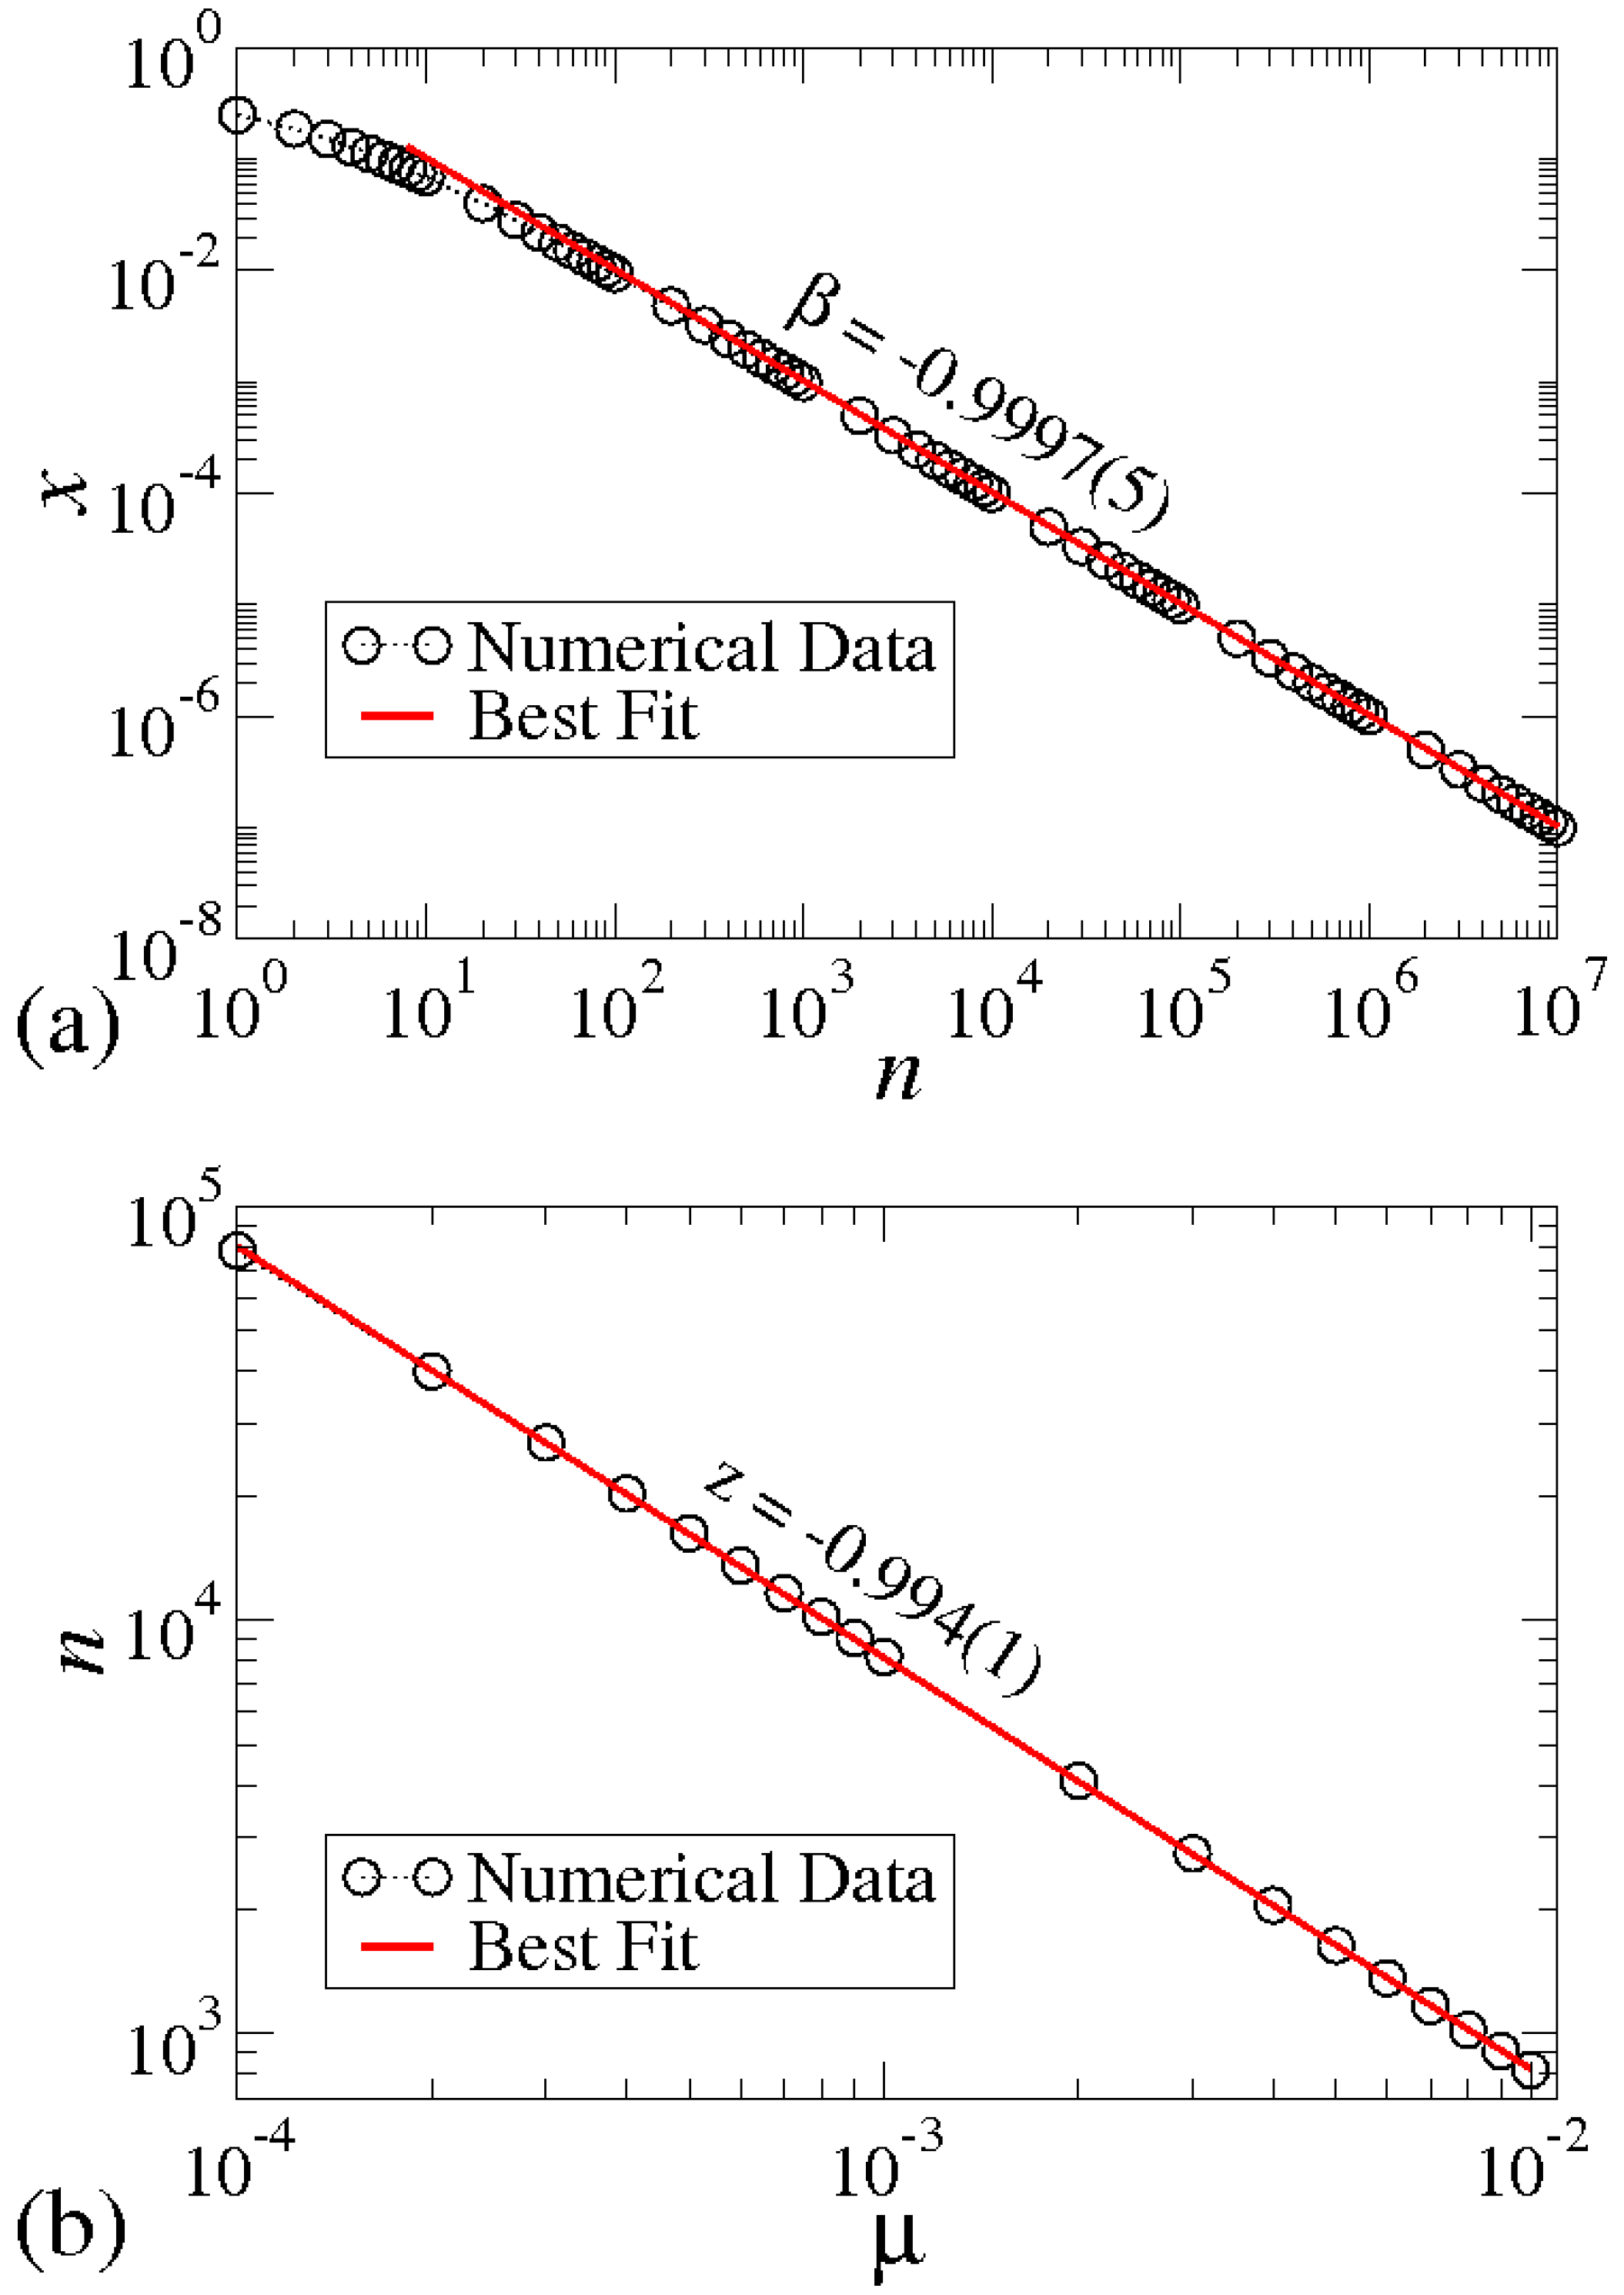
- For it implies there is an algebraic decay in x so thatwhere β is a critical exponent and depends on the type of bifurcation.
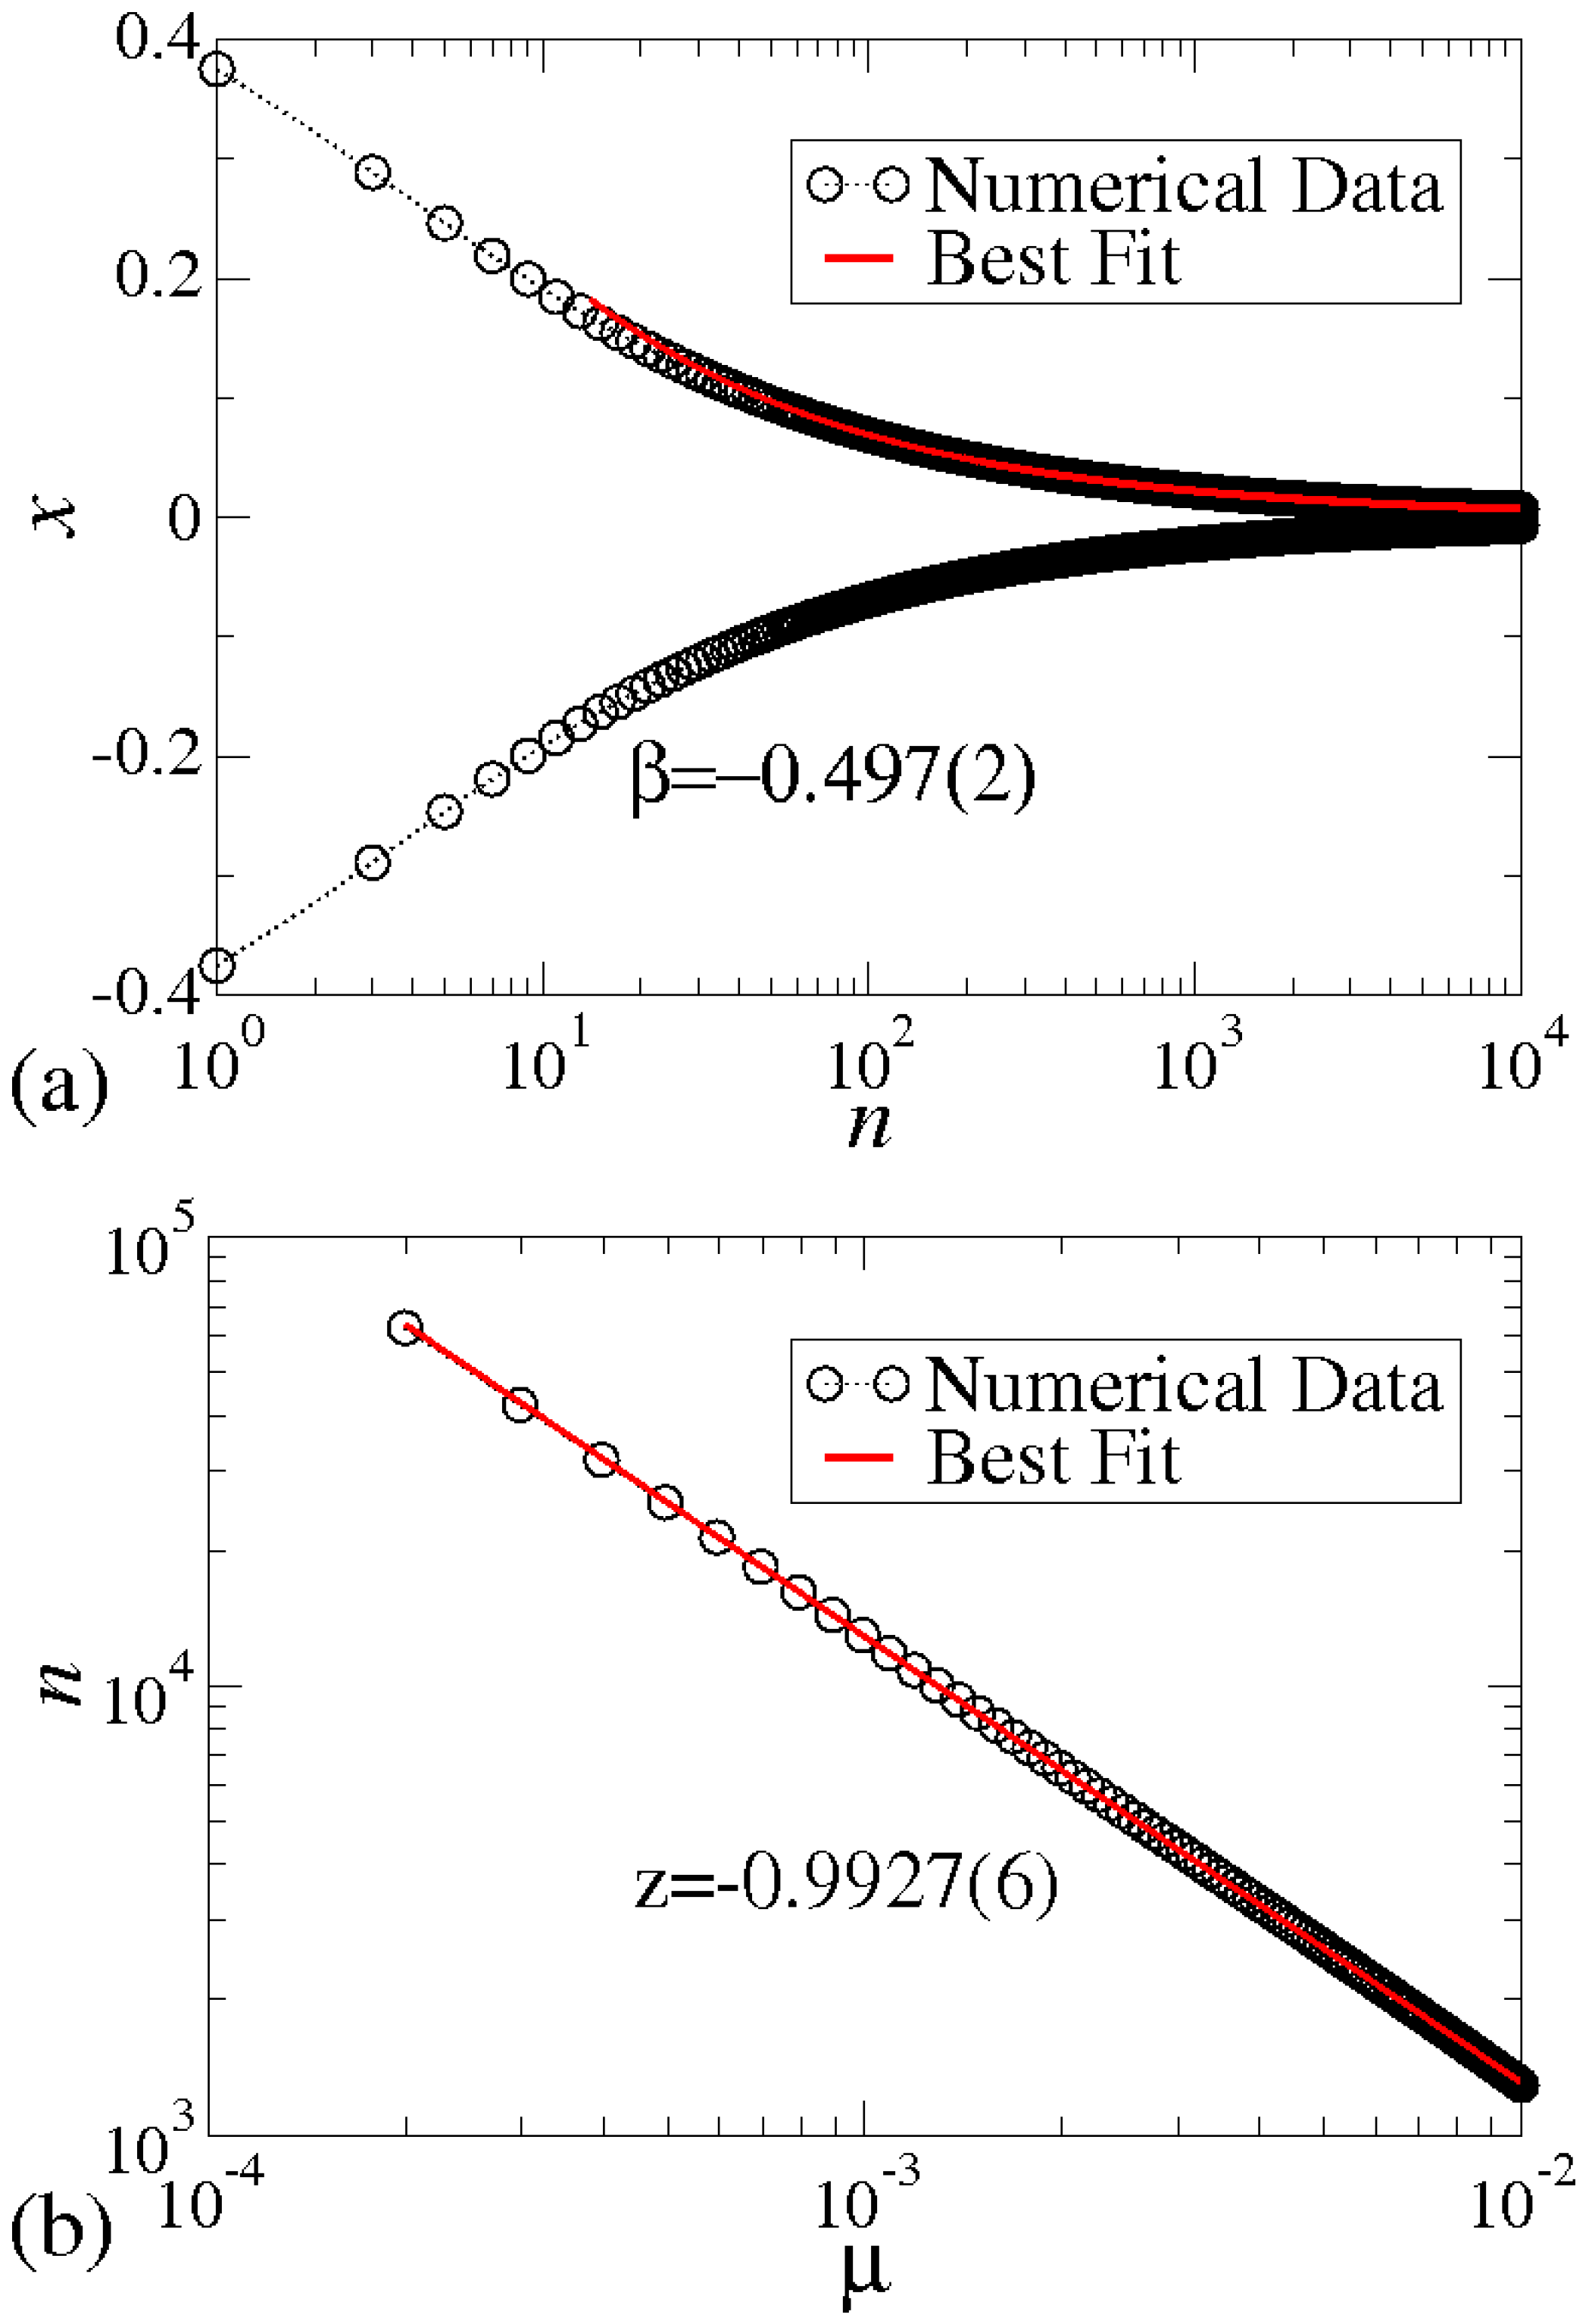
- For the parameter , we assume the orbit relaxes to the equilibrium exponentially according towhere the relaxation time τ has the following formwhere z is also a critical exponent.


3. Conclusions
Acknowledgments
Conflicts of Interest
References
- May, R.M. Biological populations with non overlapping generations: Stable points, a stable cycles and chaos. Science 1974, 86, 645–647. [Google Scholar] [CrossRef]
- Hamacher, K. Dynamical regimes due to technological change in a microeconomical model of production. Chaos 2012, 22, 033149. [Google Scholar] [CrossRef] [PubMed]
- McCartney, M. Lyapunov exponents for multi-parameter tent and logistic maps. Chaos 2012, 21, 043104. [Google Scholar] [CrossRef] [PubMed]
- Philominathan, P.; Santhiah, M.; Mohamed, I.R.; Murali, K.; Rajasekar, S. Chaotic dynamics of a simple parametrically driven dissipative circuit. Int. J. Bifurc. Chaos 2011, 21, 1927–1933. [Google Scholar] [CrossRef]
- Santhiah, M.; Philominathan, P. Statistical dynamics of parametrically perturbed sine-square map. Pramana J. Phys. 2010, 75, 403–414. [Google Scholar] [CrossRef]
- Zhang, Y.-G.; Zhang, J.-F.; Ma, Q.; Ma, J.; Wang, Z.-P. Statistical description and forecasting analysis of life system. Int. J. Nonlinear Sci. Numer. Simul. 2010, 11, 157–164. [Google Scholar] [CrossRef]
- Hu, W.; Zhao, G.-H.; Zhang, G.; Zhang, J.-Q.; Liu, X.-L. Stabilities and bifurcations of sine dynamic equations on time scale. Acta Phys. Sin. 2012, 17, 170505. [Google Scholar]
- Urquizu, M.; Correig, A.M. Fast relaxation transients in a kicked damped oscillator. Chaos, Solitons Fractals 2007, 33, 1292–1306. [Google Scholar] [CrossRef]
- Livadiotis, G. Numerical approximation of the percentage of order for one-dimensional maps. Adv. Complex Syst. 2005, 8, 15–32. [Google Scholar] [CrossRef]
- Ilhem, D.; Amel, K. One-dimensional and two-dimensional dynamics of cubic maps. Discret. Dyn. Nat. Soc. 2006, 2006, 15840. [Google Scholar] [CrossRef]
- Li, T.Y.; Yorke, J.A. Period three implies chaos. Am. Math. Mon. 1975, 82, 985–992. [Google Scholar] [CrossRef]
- May, R.M.; Oster, G.A. Bifurcation and dynamical systems in simple ecological models. Am. Nat. 1976, 110, 573–599. [Google Scholar] [CrossRef]
- Grebogi, C.; Ott, E.; Yorke, J.A. Chaotic attractors in crisis. Phys. Rev. Lett. 1982, 48, 1507–1510. [Google Scholar] [CrossRef]
- Grebogi, C.; Ott, E.; Yorke, J.A. Crises, sudden changes in chaotic attractors, and transient chaos. Physica D 1983, 7, 181–200. [Google Scholar] [CrossRef]
- Gallas, J.A.C. Structure of the parameter space of the Hénon map. Phys. Rev. Lett. 1983, 70, 2714–2717. [Google Scholar] [CrossRef] [PubMed]
- Collet, P.; Eckmann, J.-P. Iterated Maps on the Interval as Dynamical Systems; Birkhauser: Boston, MA, UA, 1980. [Google Scholar]
- Feigenbaum, M.J. Universal metric properties of non-linear transformations. J. of Stat. Phys. 1979, 21, 669–706. [Google Scholar] [CrossRef]
- Feigenbaum, M.J. Quantitative universality for a class of non-linear transformations. J. Stat. Phys. 1978, 19, 25–52. [Google Scholar] [CrossRef]
- Leonel, E.D.; da Silva, J.K.L.; Kamphorst, S.O. Relaxation and transients in a time-dependent logistic map. Int. J. Bifurc. Chaos 2002, 12, 1667–1674. [Google Scholar] [CrossRef]
- Hohenberg, P.C.; Halperin, B.I. Theory of dynamic critical phenomena. Rev. Mod. Phys. 1977, 49, 435–479. [Google Scholar] [CrossRef]
- Hilborn, R.C. Chaos and Nonlinear Dynamics: An Introduction for Scientists and Engineers; Oxford University Press: New York, NY, USA, 1994. [Google Scholar]
© 2013 by the authors; licensee MDPI, Basel, Switzerland. This article is an open access article distributed under the terms and conditions of the Creative Commons Attribution license (http://creativecommons.org/licenses/by/3.0/).
Share and Cite
De Oliveira, J.A.; Papesso, E.R.; Leonel, E.D. Relaxation to Fixed Points in the Logistic and Cubic Maps: Analytical and Numerical Investigation. Entropy 2013, 15, 4310-4318. https://doi.org/10.3390/e15104310
De Oliveira JA, Papesso ER, Leonel ED. Relaxation to Fixed Points in the Logistic and Cubic Maps: Analytical and Numerical Investigation. Entropy. 2013; 15(10):4310-4318. https://doi.org/10.3390/e15104310
Chicago/Turabian StyleDe Oliveira, Juliano A., Edson R. Papesso, and Edson D. Leonel. 2013. "Relaxation to Fixed Points in the Logistic and Cubic Maps: Analytical and Numerical Investigation" Entropy 15, no. 10: 4310-4318. https://doi.org/10.3390/e15104310
APA StyleDe Oliveira, J. A., Papesso, E. R., & Leonel, E. D. (2013). Relaxation to Fixed Points in the Logistic and Cubic Maps: Analytical and Numerical Investigation. Entropy, 15(10), 4310-4318. https://doi.org/10.3390/e15104310