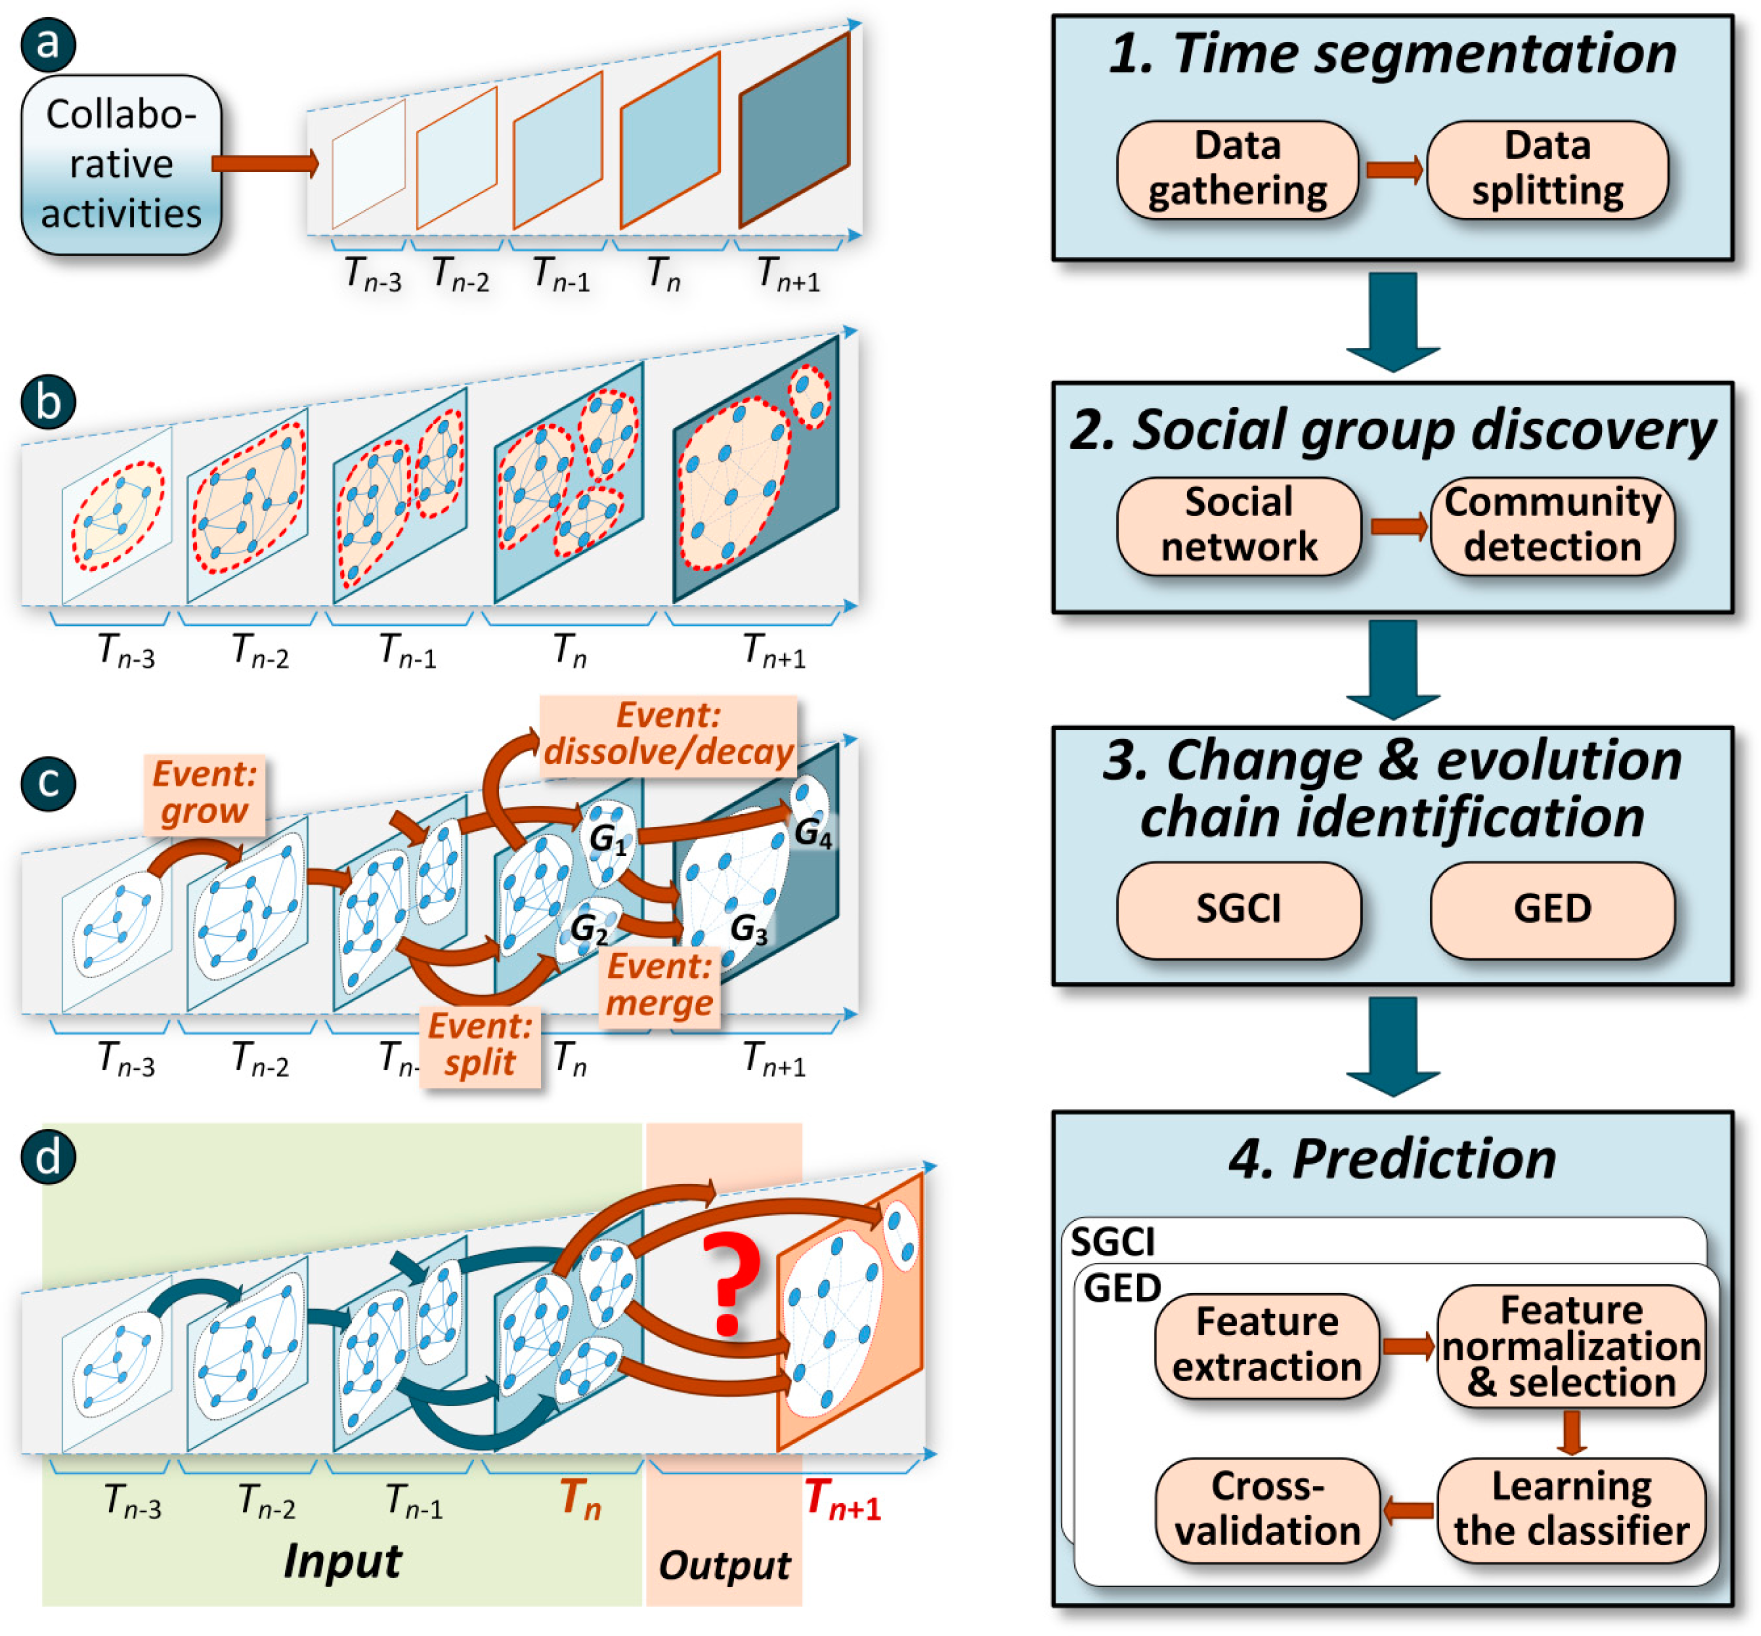
Figure 1.
The four main phases in prediction of social community evolution.
Figure 1.
The four main phases in prediction of social community evolution.
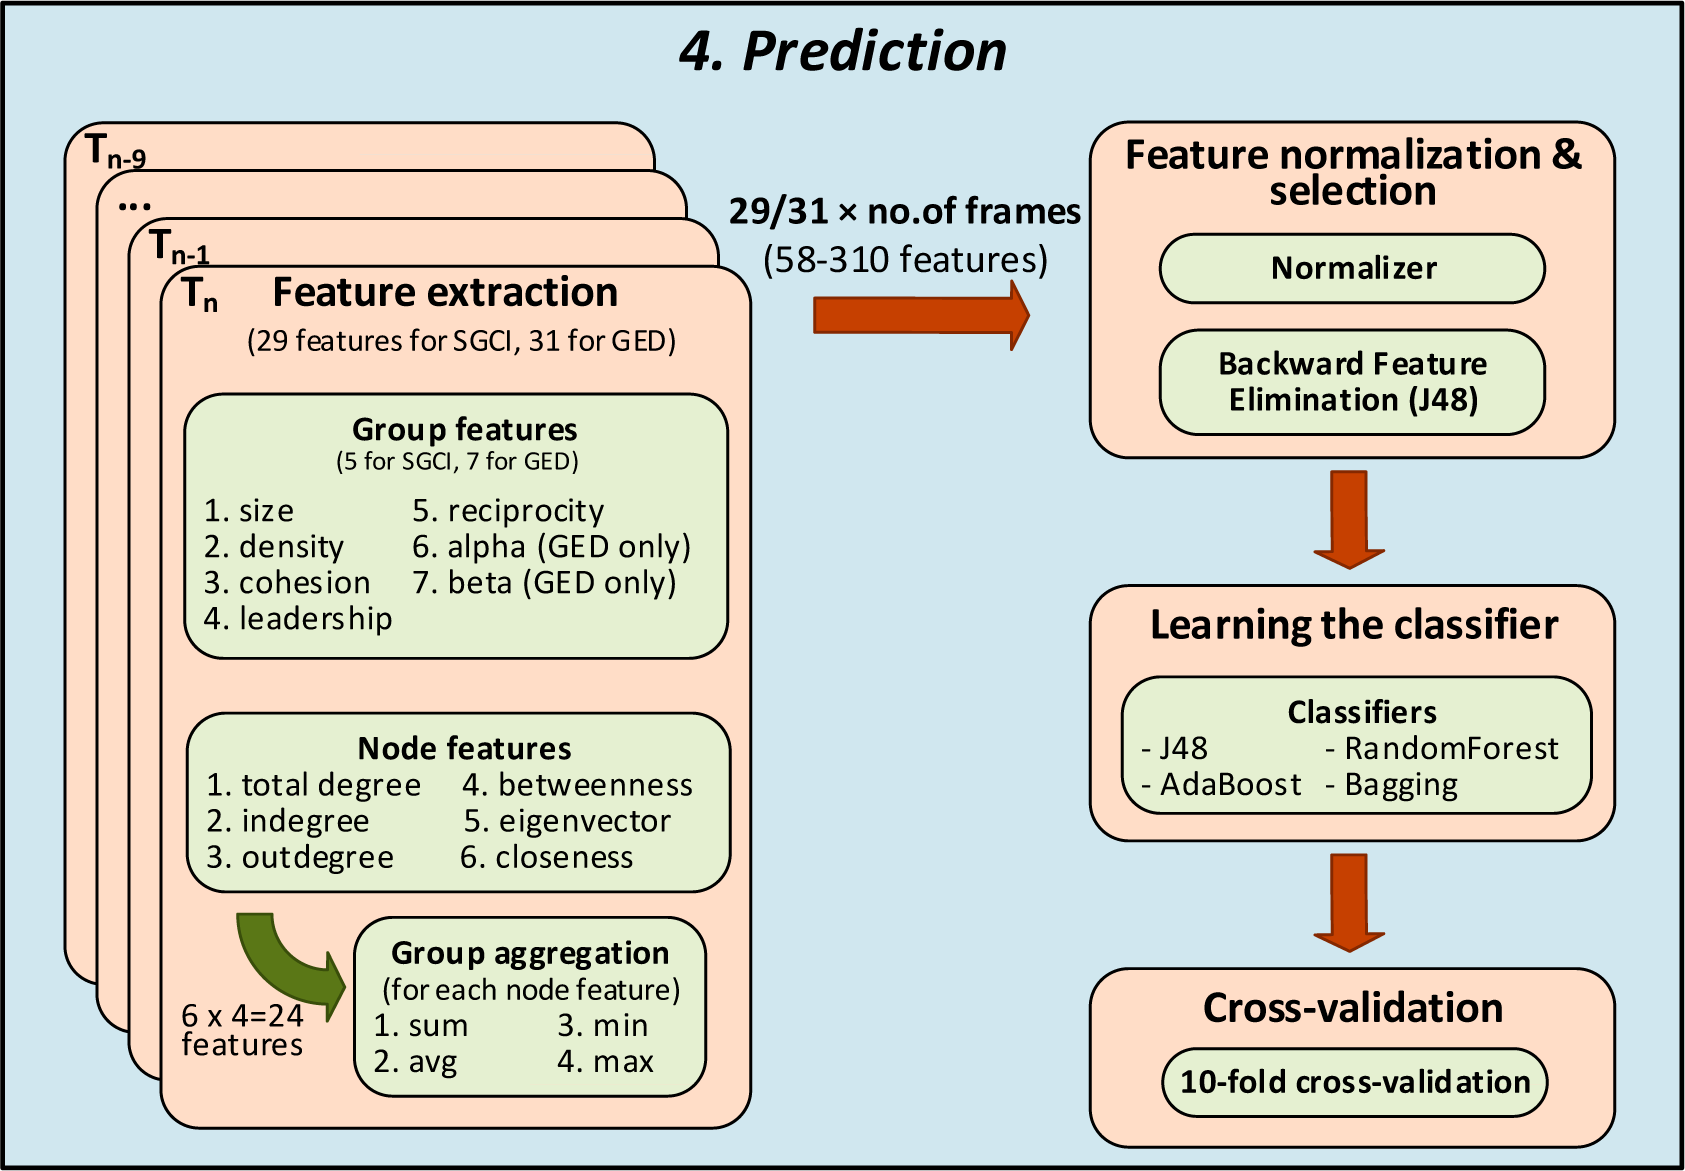
Figure 2.
The last phase in prediction of social community evolution.
Figure 2.
The last phase in prediction of social community evolution.
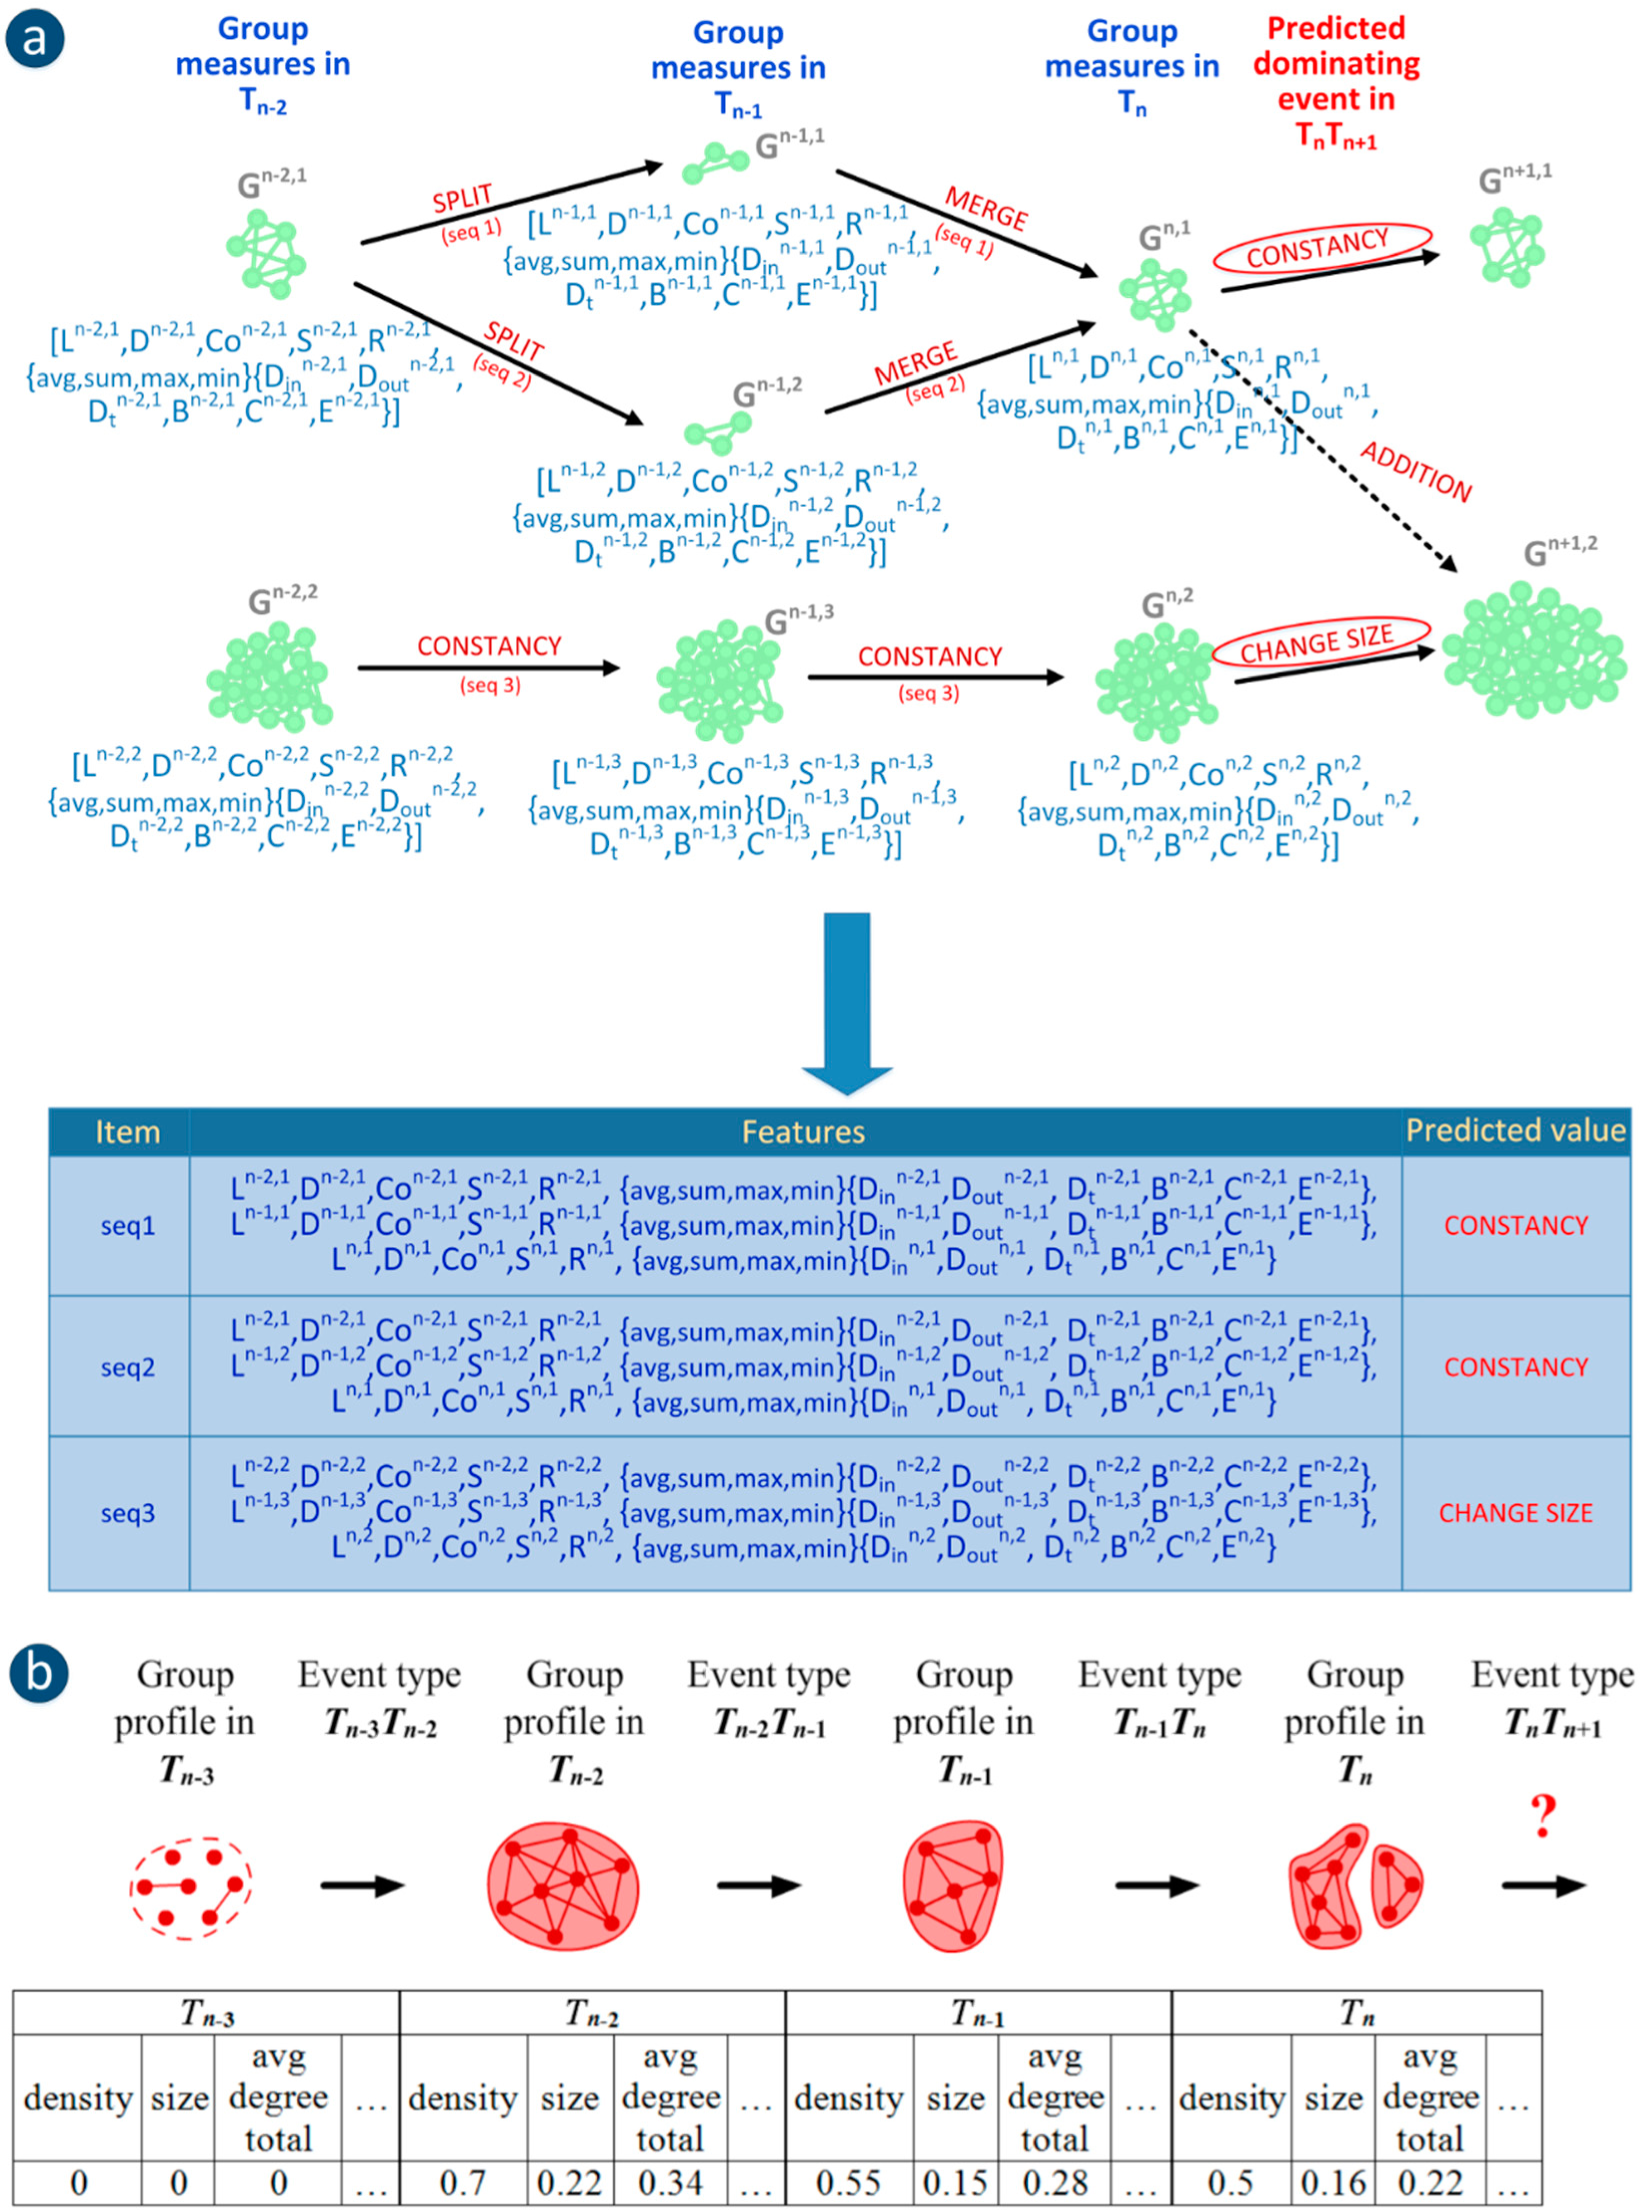
Figure 3.
Two approaches to group evolution prediction: (a) using the SGCI method—example with sequences of group measures from 3 time frames (1 present group state and 2 earlier group states) and predicted dominating event; (b) using the GED method—the sequence of events for a single group together with its profiles as well as its target class-event type in TnTn+1 (the chain corresponds to one case in classification).
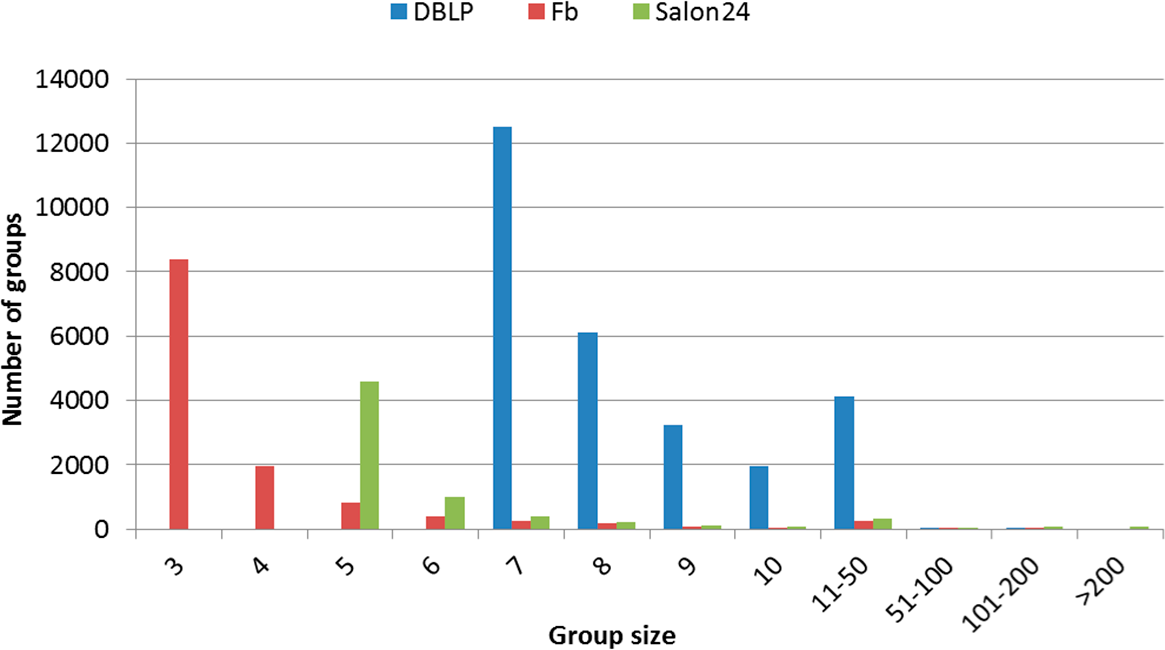
Figure 4.
The number of groups with a given size.
Figure 4.
The number of groups with a given size.
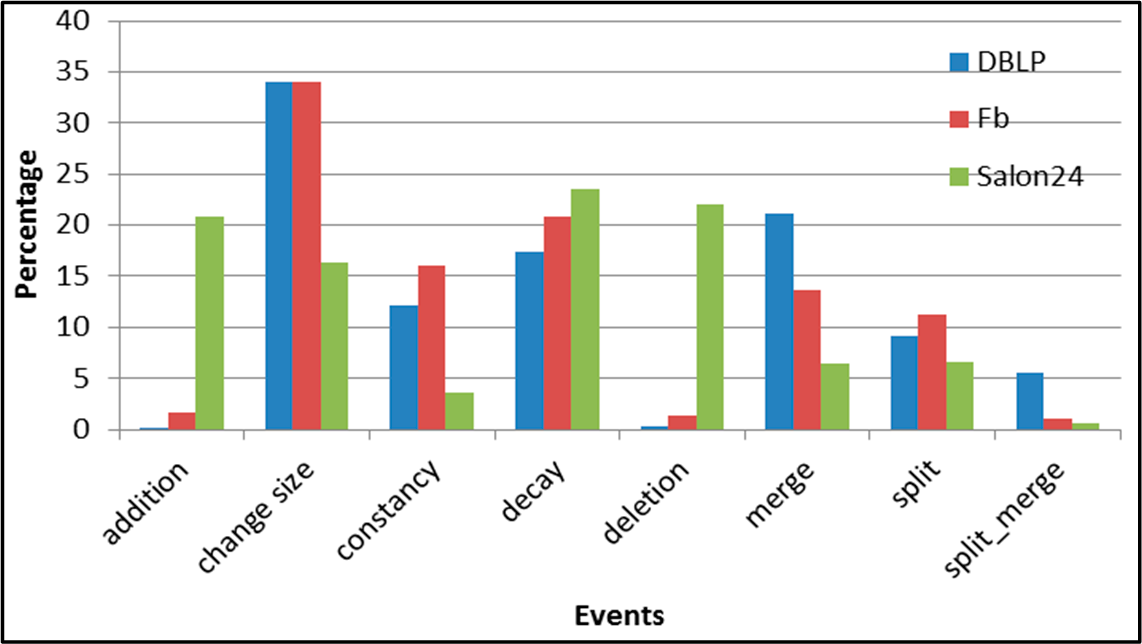
Figure 5.
SGCI: distribution of the event types in all datasets.
Figure 5.
SGCI: distribution of the event types in all datasets.
Figure 6.
SGCI: distribution of the event types for events being predicted in the DBLP dataset.
Figure 6.
SGCI: distribution of the event types for events being predicted in the DBLP dataset.
Figure 7.
SGCI: results of event classification for change size event in the DBLP dataset.
Figure 7.
SGCI: results of event classification for change size event in the DBLP dataset.
Figure 8.
SGCI: results of event classification for constancy event in the DBLP dataset.
Figure 8.
SGCI: results of event classification for constancy event in the DBLP dataset.
Figure 9.
SGCI: results of event classification for decay event in the DBLP dataset.
Figure 9.
SGCI: results of event classification for decay event in the DBLP dataset.
Figure 10.
SGCI: results of event classification for merge event in the DBLP dataset.
Figure 10.
SGCI: results of event classification for merge event in the DBLP dataset.
Figure 11.
SGCI: results of event classification for split event in the DBLP dataset.
Figure 11.
SGCI: results of event classification for split event in the DBLP dataset.
Figure 12.
SGCI: distribution of the event types for events being predicted in the Facebook dataset.
Figure 12.
SGCI: distribution of the event types for events being predicted in the Facebook dataset.
Figure 13.
SGCI: results of event classification for addition event in the Facebook dataset.
Figure 13.
SGCI: results of event classification for addition event in the Facebook dataset.
Figure 14.
SGCI: results of event classification for change size event in the Facebook dataset.
Figure 14.
SGCI: results of event classification for change size event in the Facebook dataset.
Figure 15.
SGCI: results of event classification for constancy event in the Facebook dataset.
Figure 15.
SGCI: results of event classification for constancy event in the Facebook dataset.
Figure 16.
SGCI: results of event classification for decay event in the Facebook dataset.
Figure 16.
SGCI: results of event classification for decay event in the Facebook dataset.
Figure 17.
SGCI: results of event classification for deletion event in the Facebook dataset.
Figure 17.
SGCI: results of event classification for deletion event in the Facebook dataset.
Figure 18.
SGCI: results of event classification for merge event in the Facebook dataset.
Figure 18.
SGCI: results of event classification for merge event in the Facebook dataset.
Figure 19.
SGCI: results of event classification for split event in the Facebook dataset.
Figure 19.
SGCI: results of event classification for split event in the Facebook dataset.
Figure 20.
SGCI: distribution of the event types for events being predicted in the Salon24 dataset.
Figure 20.
SGCI: distribution of the event types for events being predicted in the Salon24 dataset.
Figure 21.
SGCI: results of event classification for addition event in the Salon24 dataset.
Figure 21.
SGCI: results of event classification for addition event in the Salon24 dataset.
Figure 22.
SGCI: results of event classification for change size event in the Salon24 dataset.
Figure 22.
SGCI: results of event classification for change size event in the Salon24 dataset.
Figure 23.
SGCI: results of event classification for constancy event in the Salon24 dataset.
Figure 23.
SGCI: results of event classification for constancy event in the Salon24 dataset.
Figure 24.
SGCI: results of event classification for decay event in the Salon24 dataset.
Figure 24.
SGCI: results of event classification for decay event in the Salon24 dataset.
Figure 25.
SGCI: results of event classification for deletion event in the Salon24 dataset.
Figure 25.
SGCI: results of event classification for deletion event in the Salon24 dataset.
Figure 26.
SGCI: results of event classification for merge event in the Salon24 dataset.
Figure 26.
SGCI: results of event classification for merge event in the Salon24 dataset.
Figure 27.
SGCI: results of event classification for split event in the Salon24 dataset.
Figure 27.
SGCI: results of event classification for split event in the Salon24 dataset.
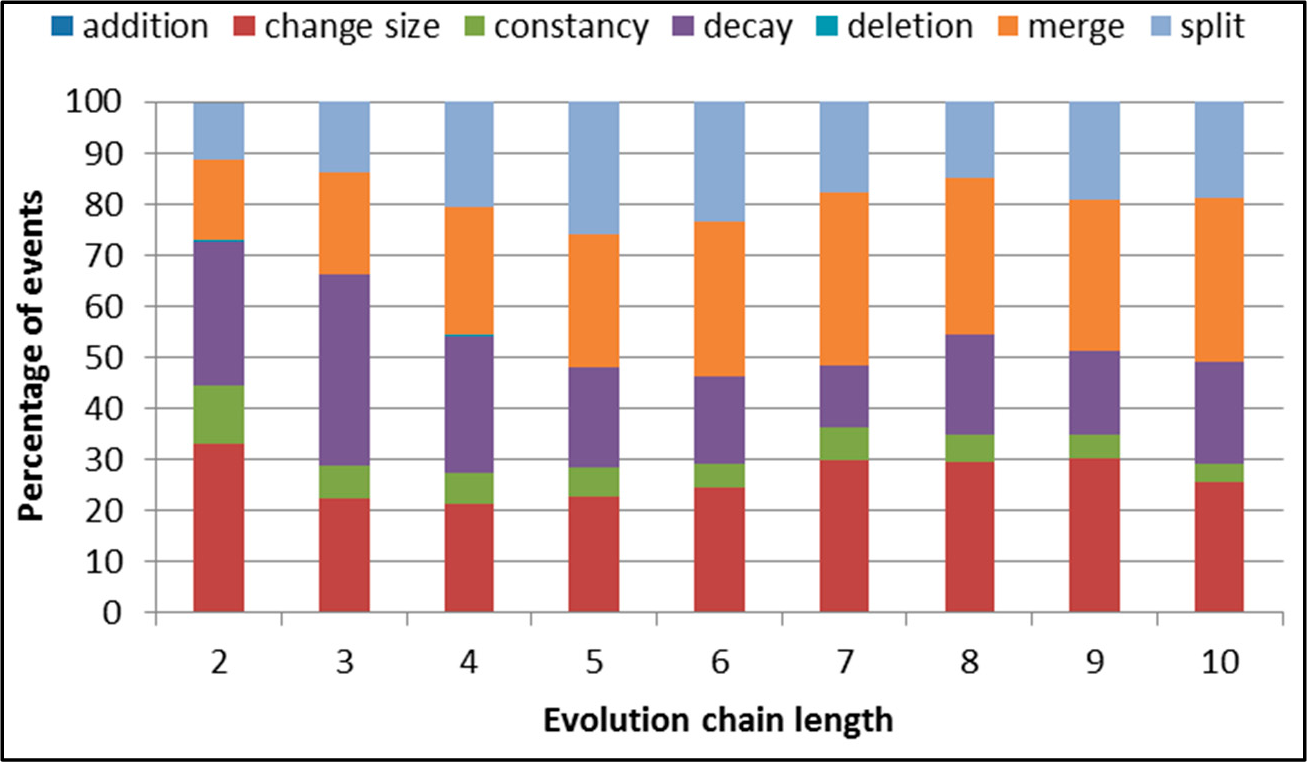
Figure 28.
GED: distribution of the event types in all datasets.
Figure 28.
GED: distribution of the event types in all datasets.
Figure 29.
GED: distribution of the event types for events being predicted in the DBLP dataset.
Figure 29.
GED: distribution of the event types for events being predicted in the DBLP dataset.
Figure 30.
GED: results of event prediction for continuing event in the DBLP dataset.
Figure 30.
GED: results of event prediction for continuing event in the DBLP dataset.
Figure 31.
GED: results of event classification for dissolving event in the DBLP dataset.
Figure 31.
GED: results of event classification for dissolving event in the DBLP dataset.
Figure 32.
GED: results of event classification for growing event in the DBLP dataset.
Figure 32.
GED: results of event classification for growing event in the DBLP dataset.
Figure 33.
GED: results of event classification for merging event in the DBLP dataset.
Figure 33.
GED: results of event classification for merging event in the DBLP dataset.
Figure 34.
GED: results of event classification for shrinking event in the DBLP dataset.
Figure 34.
GED: results of event classification for shrinking event in the DBLP dataset.
Figure 35.
GED: results of event classification for splitting event in the DBLP dataset.
Figure 35.
GED: results of event classification for splitting event in the DBLP dataset.
Figure 36.
GED: distribution of the event types for events being predicted in the Facebook dataset.
Figure 36.
GED: distribution of the event types for events being predicted in the Facebook dataset.
Figure 37.
GED: results of event classification for continuing event in the Facebook dataset.
Figure 37.
GED: results of event classification for continuing event in the Facebook dataset.
Figure 38.
GED: results of event classification for dissolving event in the Facebook dataset.
Figure 38.
GED: results of event classification for dissolving event in the Facebook dataset.
Figure 39.
GED: results of event classification for growing event in the Facebook dataset.
Figure 39.
GED: results of event classification for growing event in the Facebook dataset.
Figure 40.
GED: results of event classification for merging event in the Facebook dataset.
Figure 40.
GED: results of event classification for merging event in the Facebook dataset.
Figure 41.
GED: results of event classification for shrinking event in the Facebook dataset.
Figure 41.
GED: results of event classification for shrinking event in the Facebook dataset.
Figure 42.
GED: results of event classification for splitting event in the Facebook dataset.
Figure 42.
GED: results of event classification for splitting event in the Facebook dataset.
Figure 43.
GED: distribution of the event types for events being predicted in the Salon24 dataset.
Figure 43.
GED: distribution of the event types for events being predicted in the Salon24 dataset.
Figure 44.
GED: results of event classification for continuing event in the Salon24 dataset.
Figure 44.
GED: results of event classification for continuing event in the Salon24 dataset.
Figure 45.
GED: results of event classification for dissolving event in the Salon24 dataset.
Figure 45.
GED: results of event classification for dissolving event in the Salon24 dataset.
Figure 46.
GED: results of event classification for growing event in the Salon24 dataset.
Figure 46.
GED: results of event classification for growing event in the Salon24 dataset.
Figure 47.
GED: results of event classification for merging event in the Salon24 dataset.
Figure 47.
GED: results of event classification for merging event in the Salon24 dataset.
Figure 48.
GED: results of event classification for shrinking event in the Salon24 dataset.
Figure 48.
GED: results of event classification for shrinking event in the Salon24 dataset.
Figure 49.
GED: results of event classification for splitting event in the Salon24 dataset.
Figure 49.
GED: results of event classification for splitting event in the Salon24 dataset.
Figure 50.
The number of features selected from all features for the particular chain length for the Facebook dataset.
Figure 50.
The number of features selected from all features for the particular chain length for the Facebook dataset.
Figure 51.
The percentage of features selected from all features available for the particular chain length for the Facebook dataset.
Figure 51.
The percentage of features selected from all features available for the particular chain length for the Facebook dataset.
Figure 52.
The percentage of features selected from the last 3 time frames for the particular chain length for the Facebook dataset.
Figure 52.
The percentage of features selected from the last 3 time frames for the particular chain length for the Facebook dataset.
Figure 53.
The comparison of features usage in GED and SGCI after feature selection for the Facebook dataset.
Figure 53.
The comparison of features usage in GED and SGCI after feature selection for the Facebook dataset.
Figure 54.
Error in prediction of GED and SGCI events after feature selection for the Facebook dataset.
Figure 54.
Error in prediction of GED and SGCI events after feature selection for the Facebook dataset.
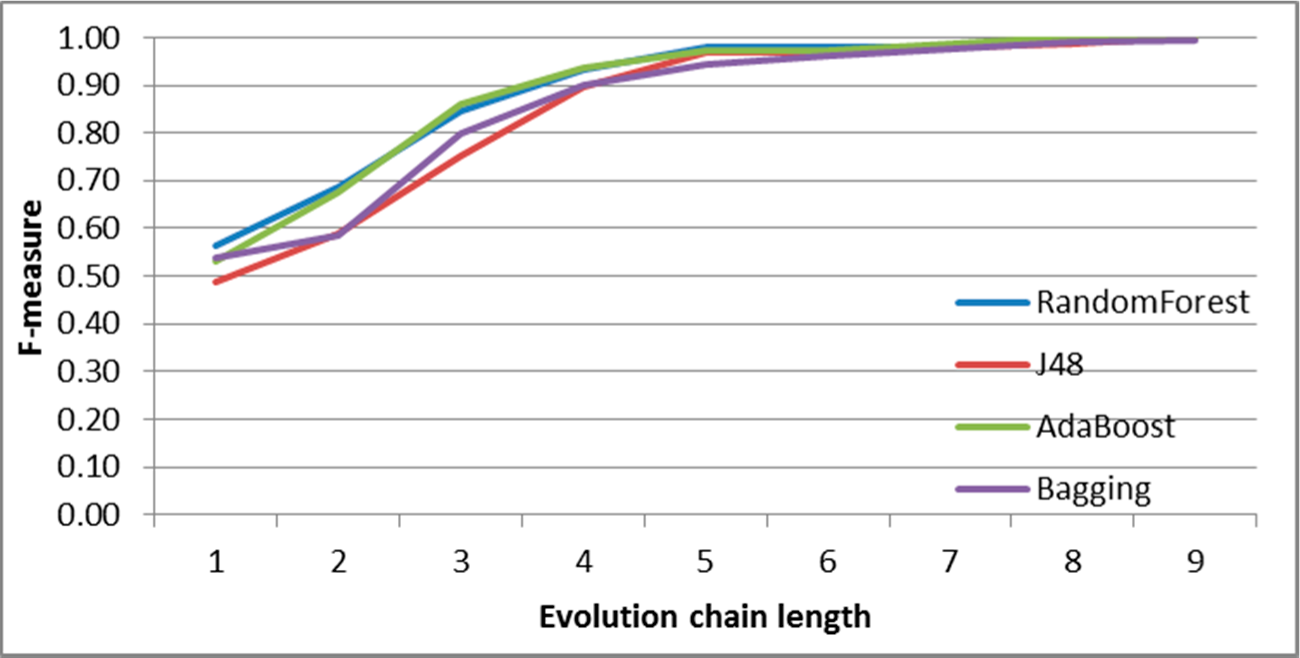
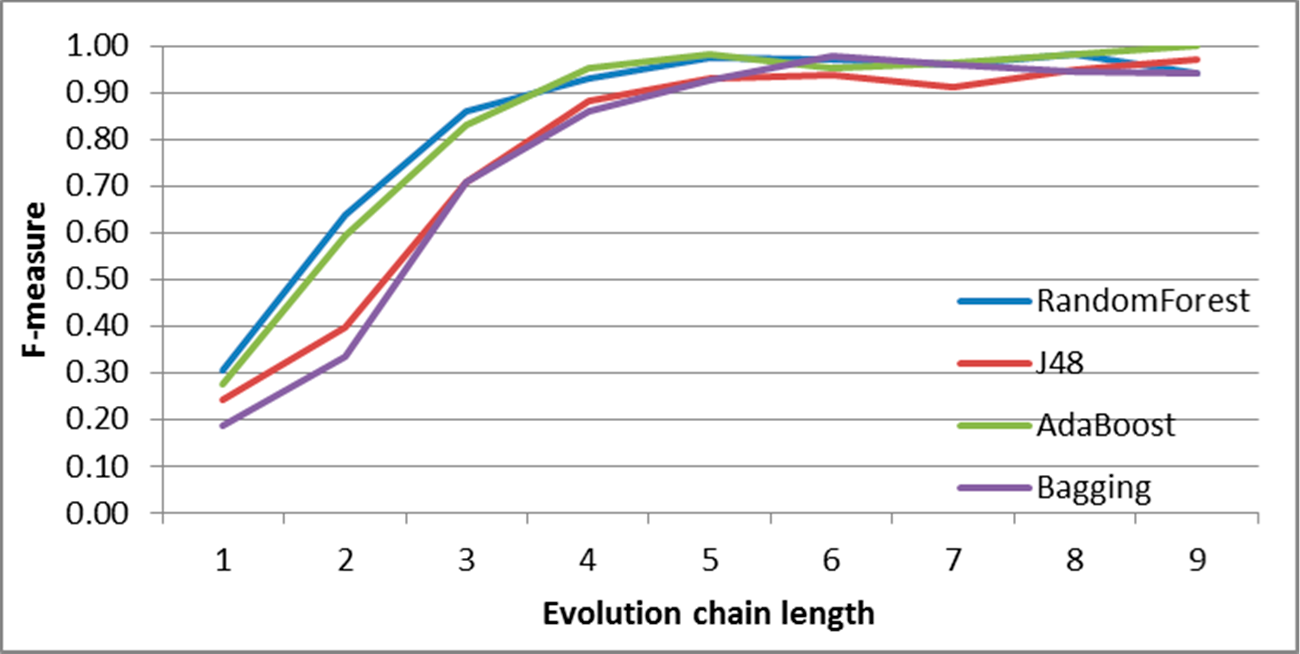
Table 1.
Classifiers used.
Table 1.
Classifiers used.
| Short Name | Name |
|---|
| J48-C4.5 decision tree | C4.5 decision tree [34] |
| RandomForest | Random forest [35] |
| AdaBoost(J48) | Adaptive Boosting [36] |
| Bagging(REPTree) | Bootstrap aggregating [37] |
Table 2.
SGCI: the number of evolution chains for particular chain length.
Table 2.
SGCI: the number of evolution chains for particular chain length.
| Chain Length | DBLP | Facebook | Salon24 |
|---|
| 2 | 2,980 | 3,027 | 2,119 |
| 3 | 2,581 | 2,759 | 5,999 |
| 4 | 2,051 | 2,094 | 5,005 |
| 5 | 1,919 | 1,831 | 10,712 |
| 6 | 1,754 | 1,575 | 9,895 |
| 7 | 1,120 | 1,401 | 15,076 |
| 8 | 744 | 1,314 | 18,735 |
| 9 | 603 | 1,280 | 29,690 |
| 10 | 417 | 1,141 | – |
Table 3.
SGCI: the number of evolution chains for particular event type and particular chain length in the DBLP dataset.
Table 3.
SGCI: the number of evolution chains for particular event type and particular chain length in the DBLP dataset.
| Chain Length | Addition | Change Size | Constancy | Decay | Deletion | Merge | Split |
|---|
| 2 | 7 | 981 | 340 | 846 | 5 | 471 | 330 |
| 3 | 7 | 569 | 166 | 964 | 3 | 520 | 352 |
| 4 | 4 | 431 | 126 | 548 | 3 | 516 | 423 |
| 5 | 3 | 432 | 106 | 379 | 1 | 499 | 499 |
| 6 | 0 | 428 | 82 | 296 | 1 | 532 | 415 |
| 7 | 0 | 334 | 72 | 135 | 0 | 381 | 198 |
| 8 | 0 | 219 | 39 | 146 | 0 | 229 | 111 |
| 9 | 0 | 182 | 29 | 99 | 0 | 178 | 115 |
| 10 | 0 | 106 | 16 | 82 | 0 | 135 | 78 |
Table 4.
SGCI: the number of evolution chains for particular event type and particular chain length in the Facebook dataset.
Table 4.
SGCI: the number of evolution chains for particular event type and particular chain length in the Facebook dataset.
| Chain Length | Addition | Change Size | Constancy | Decay | Deletion | Merge | Split |
|---|
| 2 | 23 | 1137 | 416 | 840 | 32 | 298 | 281 |
| 3 | 17 | 854 | 286 | 1078 | 18 | 295 | 211 |
| 4 | 23 | 680 | 202 | 714 | 20 | 247 | 208 |
| 5 | 8 | 623 | 160 | 624 | 23 | 204 | 189 |
| 6 | 11 | 541 | 134 | 499 | 11 | 215 | 164 |
| 7 | 13 | 457 | 139 | 425 | 11 | 195 | 161 |
| 8 | 14 | 434 | 118 | 389 | 11 | 170 | 178 |
| 9 | 9 | 394 | 99 | 438 | 19 | 168 | 153 |
| 10 | 5 | 324 | 87 | 426 | 16 | 147 | 136 |
Table 5.
SGCI: the number of evolution chains for particular event type and particular chain length in the Salon24 dataset.
Table 5.
SGCI: the number of evolution chains for particular event type and particular chain length in the Salon24 dataset.
| Chain Length | Addition | Change Size | Constancy | Decay | Deletion | Merge | Split |
|---|
| 2 | 185 | 615 | 72 | 683 | 255 | 125 | 184 |
| 3 | 920 | 764 | 102 | 3,638 | 157 | 216 | 202 |
| 4 | 603 | 1,098 | 68 | 2,280 | 444 | 214 | 298 |
| 5 | 1,334 | 1,510 | 104 | 6,773 | 340 | 338 | 313 |
| 6 | 1,064 | 2,170 | 138 | 5,201 | 398 | 464 | 460 |
| 7 | 1,860 | 2,573 | 158 | 8,597 | 594 | 563 | 731 |
| 8 | 2,065 | 3,357 | 365 | 9,917 | 912 | 920 | 1,199 |
| 9 | 4,126 | 3,900 | 533 | 16,498 | 1,151 | 1,875 | 1,607 |
Table 6.
SGCI: the number of features selected for particular chain length for Facebook dataset.
Table 6.
SGCI: the number of features selected for particular chain length for Facebook dataset.
| State | Chain 2 | Chain 3 | Chain 4 | Chain 5 | Chain 6 | Chain 7 | Chain 8 | Chain 9 | Chain 10 |
|---|
| n-1 | 3 | 14 | 20 | 17 | 21 | 24 | 19 | 18 | 17 |
| n-2 | 1 | 7 | 22 | 9 | 9 | 15 | 12 | 7 | 5 |
| n-3 | | 2 | 24 | 9 | 7 | 13 | 8 | 4 | 7 |
| n-4 | | | 14 | 7 | 10 | 14 | 6 | 3 | 3 |
| n-5 | | | | 3 | 9 | 14 | 7 | 6 | 5 |
| n-6 | | | | | 2 | 6 | 5 | 3 | 2 |
| n-7 | | | | | | 6 | 6 | 6 | 1 |
| n-8 | | | | | | | 1 | 3 | 2 |
| n-9 | | | | | | | | 1 | 0 |
| n-10 | | | | | | | | | 3 |
Table 7.
GED: the number of evolution chains for particular chain length.
Table 7.
GED: the number of evolution chains for particular chain length.
| Chain Length | DBLP | Facebook | Salon24 |
|---|
| 2 | 20,324 | 8,655 | 26,619 |
| 3 | 2,480 | 3,618 | 25,136 |
| 4 | 729 | 2,401 | 160,059 |
| 5 | 281 | 1,838 | 163,723 |
| 6 | 135 | 1,434 | 107,554 * |
| 7 | 73 | 1,249 | 42,284 ** |
| 8 | 45 | 1,069 | – |
| 9 | 24 | 864 | – |
| 10 | 9 | 677 | – |
Table 8.
GED: the number of evolution chains for particular event type and particular chain length in the DBLP dataset.
Table 8.
GED: the number of evolution chains for particular event type and particular chain length in the DBLP dataset.
| Chain Length | Continuing | Dissolving | Growing | Merging | Shrinking | Splitting |
|---|
| 2 | 1,063 | 16,875 | 1,075 | 135 | 977 | 199 |
| 3 | 233 | 1,557 | 285 | 69 | 229 | 107 |
| 4 | 73 | 337 | 119 | 41 | 128 | 31 |
| 5 | 26 | 113 | 51 | 15 | 56 | 20 |
| 6 | 8 | 39 | 33 | 15 | 29 | 11 |
| 7 | 4 | 16 | 18 | 6 | 21 | 8 |
| 8 | 3 | 9 | 12 | 5 | 12 | 4 |
| 9 | 1 | 9 | 6 | 3 | 4 | 1 |
| 10 | 1 | 2 | 0 | 1 | 4 | 1 |
Table 9.
GED: the number of evolution chains for particular event type and particular chain length in the Facebook dataset.
Table 9.
GED: the number of evolution chains for particular event type and particular chain length in the Facebook dataset.
| Chain Length | Continuing | Dissolving | Growing | Merging | Shrinking | Splitting |
|---|
| 2 | 915 | 4842 | 826 | 359 | 916 | 797 |
| 3 | 410 | 1193 | 512 | 257 | 642 | 604 |
| 4 | 263 | 587 | 379 | 209 | 483 | 480 |
| 5 | 191 | 388 | 300 | 160 | 399 | 400 |
| 6 | 153 | 272 | 262 | 160 | 322 | 265 |
| 7 | 129 | 205 | 218 | 124 | 259 | 314 |
| 8 | 124 | 177 | 190 | 109 | 250 | 219 |
| 9 | 89 | 176 | 149 | 121 | 166 | 163 |
| 10 | 69 | 121 | 116 | 97 | 135 | 139 |
Table 10.
GED: the number of evolution chains for particular event type and particular chain length in the Salon24 dataset.
Table 10.
GED: the number of evolution chains for particular event type and particular chain length in the Salon24 dataset.
| Chain Length | Continuing | Dissolving | Growing | Merging | Shrinking | Splitting |
|---|
| 2 | 115 | 341 | 114 | 957 | 142 | 24,950 |
| 3 | 214 | 1,179 | 230 | 10,517 | 249 | 12,747 |
| 4 | 112 | 727 | 123 | 5,632 | 183 | 153,282 |
| 5 | 1,090 | 8,724 | 1,019 | 66,511 | 1,542 | 84,837 |
| 6* | 60 | 593 | 62 | 3,808 | 111 | 102,920 |
| 7** | 591 | 878 | 573 | 17,958 | 317 | 21,967 |
Table 11.
GED: the number of features selected for particular chain length for the Facebook dataset.
Table 11.
GED: the number of features selected for particular chain length for the Facebook dataset.
| State | Chain 2 | Chain 3 | Chain 4 | Chain 5 | Chain 6 | Chain 7 | Chain 8 | Chain 9 | Chain 10 |
|---|
| n-1 | 12 | 21 | 23 | 10 | 16 | 26 | 12 | 14 | 14 |
| n-2 | 6 | 25 | 22 | 8 | 9 | 15 | 5 | 9 | 7 |
| n-3 | | 8 | 24 | 10 | 11 | 8 | 7 | 4 | 3 |
| n-4 | | | 5 | 5 | 3 | 7 | 6 | 5 | 2 |
| n-5 | | | | 0 | 7 | 7 | 6 | 1 | 0 |
| n-6 | | | | | 0 | 3 | 6 | 2 | 0 |
| n-7 | | | | | | 0 | 4 | 1 | 0 |
| n-8 | | | | | | | 1 | 1 | 1 |
| n-9 | | | | | | | | 0 | 0 |
| n-10 | | | | | | | | | 0 |


 ,
, 


