Abstract
A new concept named volatility monotonous persistence duration (VMPD) dynamics is introduced into the research of energy markets, in an attempt to describe nonlinear fluctuation behaviors from a new perspective. The VMPD sequence unites the maximum fluctuation difference and the continuous variation length, which is regarded as a novel indicator to evaluate risks and optimize portfolios. Further, two main aspects of statistical and nonlinear empirical research on the energy VMPD sequence are observed: probability distribution and autocorrelation behavior. Moreover, a new nonlinear method named the cross complexity-invariant distance (CID) FuzzyEn (CCF) which is composed of cross-fuzzy entropy and complexity-invariant distance is firstly proposed to study the complexity synchronization properties of returns and VMPD series for seven representative energy items. We also apply the ensemble empirical mode decomposition (EEMD) to resolve returns and VMPD sequence into the intrinsic mode functions, and the degree that they follow the synchronization features of the initial sequence is investigated.
1. Introduction
Financial markets have a large number of participants. With the continuous financial innovation, more and new financial instruments have made investors have more investment choices. However, financial markets can bring higher returns to investors, they also face corresponding risks [1]. Especially with the globalization of the economy, notional governments are opening up security markets, and financial markets of various countries began to interact and influence each other. In addition to the emergence of various new derivatives, more and more risks appeared in security markets. Therefore, the importance of studying the price fluctuation of security markets became more and more obvious and became one of the important issues in financial market researches. The Security market is often considered as a complex system exhibiting many nonlinear and complex characteristics [2,3]. As an important part of the security market, the relevant characteristics of energy market have recently attracted widespread attention. Oil has a major impact on economic and political developments, especially on international energy markets [4]. For the past few years, a lot of valuable researches have been conducted on oil prices, including relationship between oil prices and stock markets from different regions [5], multiscale entropy analysis of crude oil price dynamics [6], and forecasting of crude oil price with neural networks [7], etc. Among them, the exploration of return volatility dynamic is a significant subject for investors and decision makers, because it is a matter of great account in evaluating risks, modeling market dynamics and enabling portfolios to be optimized [8,9,10,11,12,13,14,15,16,17,18,19]. Specifically, investors in energy markets are always faced with the problem of choosing the optimal portfolios, while unpredictable volatility behaviors are often the main investment risks. Recently, various novel means for exploring the volatility behaviors have been developed from different perspectives [20,21,22,23,24,25,26,27,28]. For instance, realized volatility [20,21], an often-used measure with a simple definition but important, is the sample variance of high frequency historical return data in a fixed interval. Wang et al. [21] studied statistical properties of realized volatility of crude oil futures and Henry-Hub natural gas futures from the New York Mercantile Exchange (NYMEX) based on daily return data. Furthermore, the return interval is applied in the daily fluctuations of the price changes that are above a certain threshold. Xie et al. [23] applied the recurrence interval to daily return volatility of four energy futures and studied the scaling behaviors and memory effect behaviors. Moreover, Yang et al. [24] put forward another nonparametric volatility measure called return volatility duration, which is used to describe the minimum duration when the prospective volatility intensity is bigger or smaller than the current volatility intensity at each time. The idea of volatility duration of return series has been introduced into the complex analysis study of energy futures and spot data by Niu and Wang [25]. Inspired by the above measure approaches, in this paper, a new idea of volatility monotonous persistence duration (VMPD) time sequence is introduced into energy markets to describe the energy security volatility behaviors from a new perspective. Compared to the previous measure approaches, the VMPD on the one hand considers the continuous variation length (growth/descent), on the other hand takes into account the maximum fluctuation difference. Among them, the continuous variation length represents the duration of the monotonous uptrend or downward trend of return volatility. In financial markets, the monotonous upward trend (or monotonous upward trend) means rising (or decreasing) return volatility, which may influence investors’ investment risk. The maximum fluctuation difference is used to describe the change in the intensity of return volatility over the monotonous trend, which is also important for investors to make investment decisions. At the times of the same continuous variation length, the magnitudes of the maximum fluctuation difference may be different, which represents different investment risks. By combining the continuous variation length and the maximum fluctuation difference, the VMPD can reveal more information about price volatility, and be regarded as a novel indicator to reveal the risk status of financial markets. The larger the maximum fluctuation difference is and the larger the continuous variation length is, the larger the VMPD is. Investors can better judge risk levels, choose the appropriate portfolio and make decisions depending on the VMPD. Moreover, the VMPD provides financial researchers with a new perspective on energy market volatility behaviors, thus providing some recommendations for the establishment of national macroeconomic policies. This new proposed concept is brought in the research of seven kinds of energy data including futures and spots from different energy markets.
We investigate fluctuation properties and complexity synchronization of energy VMPD sequences. Recent empirical studies on security time series indicate that there exist some common statistical and nonlinear features in different security markets, for instance including excess kurtosis, fat tails, absence of autocorrelation, multifractal nature, complexity behaviors [23,29,30,31,32]. Firstly, we observe some important statistical characteristics for the energy VMPD sequences: probability distribution, power-law behaviors, and autocorrelation behavior. Further, we study the complexity synchronization of VMPD series for different energy items. Financial market is a complex dynamic system, and its fluctuations are often accompanied by nonlinear and dynamic characteristics, which cannot be reproduced well by many traditional measurement methods. Synchronization provides insight into the fundamentals of interaction mechanism between systems, and it is an important concept that is widely used in many fields. Recently, synchronization has been studied by various methods, such as projection synchronization [33] and generalized synchronization [34]. The price formation of economic market is the result of the complicated action of many factors, and entropy is an index of pattern diversity in time series. It is a worthy way to study the synchronization from the perspective of entropy. The concept of entropy has been widely used as a measurement of complexity [35,36,37,38,39,40,41,42,43,44,45]. Fuzzy entropy (FuzzyEn) [39,40] is a reflection of similarity of time series evolved from approximate entropy (ApEn) [38] and sample entropy (SampEn) [37]. Compared to ApEn and SampEn, FuzzyEn has many advantages. Furthermore, Chen et al. [43] extended FuzzyEn method to cross-fuzzy entropy in order to compare two different time series, and it is relatively consistent and less dependent on record length in measuring regularity and asynchrony of time series. The idea of using entropy concepts to analyze time series of financial and economical markets is widely accepted. Darbellay and Wuertz [44] analyzed several sets of financial time series and proved the validity of the entropy method. Risso [45] used entropy to quantify market efficiency of the stock markets. Another complexity analysis method is complexity-invariant distance (CID) [46,47], which has been applied in measuring comparability between two time sequences. On account of the above considerations, we put forward a new method called the cross CID FuzzyEn (CCF), which is composed of cross-fuzzy entropy and complexity-invariant distance to calculate the synchronization for two time series of the same length. Introducing the CCF analysis to seven representative energy items, the synchronization properties of returns and VMPD series are compared an analyzed. Then we apply the ensemble empirical mode decomposition (EEMD) [48,49,50] to resolve returns and VMPD series into the intrinsic mode functions, and the degree that they follow the synchronization features of initial sequence is investigated.
The main contributions of this paper include the following aspects. One is that a new idea of volatility monotonous persistence duration (VMPD) time sequence is put forward to investigate the energy market fluctuation behaviors from a new perspective. The other is that a new nonlinear estimate method – the cross CID FuzzyEn (CCF) composed of cross-fuzzy entropy and complexity-invariant distance is put forward, and the CCF analysis is applied for seven actual representative energy items to investigate the synchronization features of returns and VMPD series. Lastly, the EEMD algorithm is used to resolve the returns and VMPD sequence into the intrinsic mode functions to further investigate the corresponding synchronization behaviors. This present work can provide new insights into the price volatility dynamics.
The layout of this paper is detailed below. Section 2 shows the definition of the VMPD series. Section 3 illustrates the data sets that are adapted in this work. In Section 4, we observe the power-law distribution and the autocorrelation characteristics for the energy VMPD sequence. Section 5 investigates the complexity synchronization of VMPD series and intrinsic mode functions (decomposed by VMPD series) for different energy items. Finally, Section 6 gives the conclusions.
2. Mathematical Concept Description of VMPD Series
We here introduce a new kind of statistic called volatility monotonous persistence duration (VMPD) series for return series () into the energy markets to study the security fluctuation with a novel perspective, and the composition of the new sequence is shown below. Use to represent the daily price of an energy item for every business day t, and let represent the return of the prices which is calculated by , and be the corresponding absolute return. At each trading day t, we will consider the absolute return of the following day :
- (i)
- If , the volatility sequence is thought to be locally falling at day t. Then we define the length of continuous growth at day t, namely
- (ii)
- If , the volatility sequence is thought to be locally rising at day t. Then we have define the length of sustained descent at day t, namely
- (iii)
- Specifically, when , we assume that = 0.
- (iv)
- Let denote the maximum fluctuation difference, in other words, it is also the largest growth or decline during the continuous variation length . Schematic diagrams of and are shown in Figure 1.
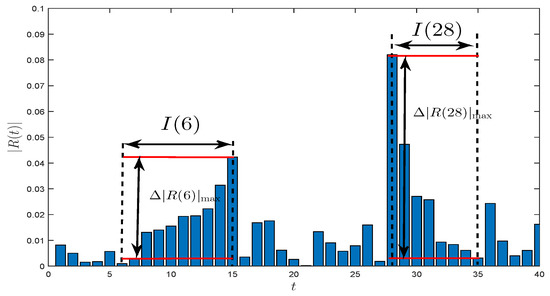 Figure 1. Illustrations of and for crude oil WTI futures.
 - (v)
- Then, the VMPD sequence is defined by:
It’s worth noting that when = 0 or , we define = 0. Thus, unites the maximum increase/decrease and the continuous growth/descent length , which describes the volatility monotonous persistence duration at each trading day t. The proposed idea provides a novel study approach and research perspective on fluctuation behaviors of energy markets. Figure 1 well illustrates the VMPD sequence of the crude oil WTI futures in 40 trading days.
3. Basic Statistical Description of Data Sets
In this paper, seven daily closing data of prices for energy items from three energy markets are considered: crude oil WTI futures, crude oil WTI spot, heating oil futures (they are from New York Mercantile Exchange); together with crude oil Brent futures, crude oil Brent spot, London gas oil futures (they are from Intercontinental Exchange); and Shanghai fuel oil futures (it is from Shanghai Futures Exchange). These abbreviations for energy data are listed in the previous section of the article. The unit of price for crude oil is barrel, the unit of price for fuel oil is gallon, and the unit of price for gasoline is metric ton. The lengths of the seven data sets are the same, from January 2010 to July 2018 with about 2001 data points respectively. This choice was made for the following reasons. Firstly, as an important part of the energy market, energy futures market has the advantages of low transaction cost and no restriction on short selling. It is often able to reflect the price information of the energy market in a timely and accurate manner. However, the high leverage of energy futures market makes the energy futures market face greater risks than the spot market. Therefore, the study of oil futures and spot price fluctuations is of great theoretical value and practical significance for preventing the risk of energy price fluctuations and promoting the stable development of the energy market. Secondly, the energy futures market is based on oil futures products, and oil futures has the functions of price discovery, hedging and risk avoidance. The Brent crude oil futures in the north sea and the west Texas light crude oil futures in the United States are the benchmark for international oil pricing, while the Shanghai fuel oil futures is currently an important product in China. Other energy products selected in this paper are also based on the consideration that they are important indicators of their respective energy markets. Figure 2 shows returns and VMPD series for these different energy data. For the crude oil WTI futures and the crude oil Brent futures, the shapes of and are exactly alike with the shapes of the series for their spots. The extreme values of VMPD sequence are concentrated in the interval .
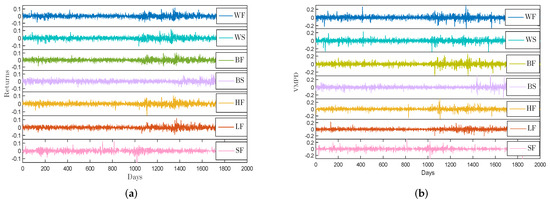
Figure 2.
(a) The return series of energy futures and spot data; (b) The VMPD series of energy futures and spot data.
From Table 1, it can be seen that the average value of each energy item is close to 0, the kurtosis coefficient is greater than 3, and the skewness coefficient is significantly not 0. This indicates that these different energy futures and spots are not subject to normal distribution, and have characteristics of excess kurtosis and fat tail [51]. The results of K-S statistics also prove this conclusion. In the K-S test of this paper, the significance level is 5%. In Table 1, we can see that the null hypothesis is rejected, because all the test logic values are returned and the value of JB statistics of each data group is higher than the critical value 5.96 under the significance level of 5%, indicating that the test data does not conform to the normal distribution. In addition, it can be seen from the standard deviation of these seven time sequence that the New York Mercantile Exchange has the strongest degree of fluctuation, while the Intercontinental Exchange is the weakest.

Table 1.
Descriptive statistics and K-S test for return and VMPD series of energy data.
4. Statistical and Nonlinear Behaviors of Return Series and VMPD Series
Recent empirical studies on security time series indicate that there exist some common features in different security markets [23,29], including excess kurtosis, fat tails [30], and absence of autocorrelation [32]. In this section, we use several statistical and nonlinear approaches to investigate if the proposed VMPD series of the energy data sets mentioned above have these properties.
4.1. Probability Density Distribution
In Section 3, we verified that the return series and the proposed VMPD series for the energy items have characteristics of excess kurtosis and fat tail by using some descriptive statistics and K-S test. In this part, we will further investigate the probability density distributions (PDF) for and with the help of intuitive graphs. Logarithmic plots of probability density distributions for these time series in comparison with the Gaussian distribution are presented in Figure 3. The patterns obtained by kernel density estimation reveal that and for the energy items deviate from the Gaussian and exhibit excess kurtosis and fat-tail distributions.
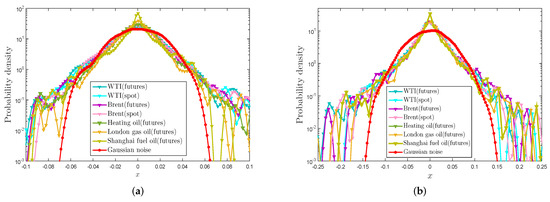
Figure 3.
(a) Logarithmic plots of probability density functions by kernel density estimation of return series ; (b) Logarithmic plots of probability density functions by kernel density estimation of VMPD series .
4.2. Power-law Behaviors
According to the above research, since the and sequences do not obey the normal distribution, while Gabaix et al. [52] show that the power-law distribution is used to describe distribution of tail data of real financial market volatility related time series, such as the volatility of stock price and volume, and the formula = can fit the tail distribution well, where represents the power-law exponent and is a constant [53]. We will test if tails of absolute return series and absolute VMPD series obey the power-law theory.
Figure 4a,b display the plots and log-log plots of cumulative distributions of absolute return series and absolute VMPD series . Figure 4 exhibits that and series for the energy data from diverse markets have parallel tracks of cumulative distributions. It is clear that for both and series of these analyzed energy data are all below the normal distribution, which illustrate that they have fat tails. Moreover, the tail of each curve is close to a straight line, which indicates that the tails of all data obey the power-law distribution. All time series are fitted with the last data, and Table 2 shows the estimation values of and . From Table 2, we can see that the values of exponent parameter are basically around −3, and the absolute value for series is bigger than that for series in general. It is noted that the R-square values are all over 0.95, which shows that the tails of energy and series can be fitted by the power-law formula.
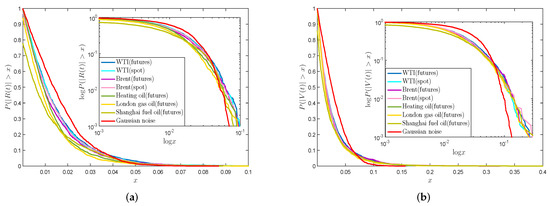
Figure 4.
(a) Plots and log-log plots of cumulative distributions of absolute return series ; (b) Plots and log-log plots of cumulative distributions of absolute VMPD series .
Table 2.
Estimation values of and of the last part of and series.
4.3. Autocorrelation Analysis
In this part, we adopt the autocorrelation approach [54] to explore the possible long-term correlation of return series and proposed VMPD series for the energy items. The autocorrelation function is defined as follows [55]
where is the returns or the VMPD series of energy items, is the mean of , N represents the length of and k is called the time lag.
Figure 5 displays the autocorrelation functions of and of energy data sets related to distinct time lags. The red dashed locates in each graph stand for the confidence interval. For and , the ACF values stay in the confidence interval as the time lag grows, that is, the autocorrelation of each time series gradually disappears with the increase of time lag, which indicates that future data is independent of historical data for and . The absence of autocorrelation for returns series at large time lag suggests that the weak-form Efficient Market Hypothesis (EMH) may support these energy markets in the long run, and investors may not be able to use the technical means to gain profit-making opportunities [56,57]. For and , the two inset graphs exhibit that the shapes of autocorrelation function are parallel. They firstly decay slowly, and then go up as the lag value increases. In the end, nearly all the ACF values are in the confidence interval. This is consistent with the empirical fact that security markets do not exhibit any significant autocorrelation.
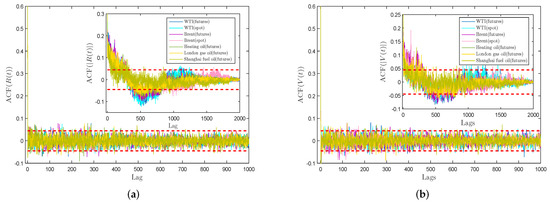
Figure 5.
(a) Autocorrelation functions of return series ; (b) Autocorrelation functions of VMPD series .
5. Complexity Synchronization of Return Series and VMPD Series
For purpose of measuring the synchrony of energy markets in a new way, a novel nonlinear method called the cross CID FuzzyEn (CCF) composed of cross-fuzzy entropy and complexity-invariant distance is firstly proposed in this paper. Implementing CCF analysis for seven representative energy items, synchronization properties of returns and VMPD series are compared and analyzed. Also, we introduce the ensemble empirical mode decomposition (EEMD) algorithm to resolve returns and VMPD series into the intrinsic mode functions, and the degree that they follow the properties of initial sequence is investigated.
5.1. Mathematical Description of CCF Analysis
Entropy has been widely applied as a measurement of complexity. Fuzzy entropy (FuzzyEn) [39,40] evolved from approximate entropy (ApEn) [38] and sample entropy (SampEn) [37]. It uses the exponential function and its shape to define the similarity of vectors by introducing the fuzzy set. A lot of work has shown that FuzzyEn is better than ApEn and SampEn on reflecting regularity and similarity of time sequence. Furthermore, Chen et al. [43] extended the FuzzyEn method to the cross-fuzzy entropy so as to compare two different time series and evaluate their pattern synchronization degree. The cross-fuzzy entropy is relatively consistent and less dependent on record length in measuring regularity and asynchrony of time series.
For two N-sample time series and , the cross-fuzzy entropy (C-FuzzyEn) is constructed as follows:
- (a)
- Given the embedding dimension m, we can define m-dimensional sequence vectors and as followswhere and denote the average of series segment, that is
- (b)
- represents the distance between vector and vector
- (c)
- The degree of synchrony can be defined by fuzzy function
- (d)
- For all , we work out the mean values of , given by
- (e)
- Finally, we can calculate the C-FuzzyEn of two time series and as
- (f)
- N is finite, then the C-FuzzyEn can be obtained asThe parameter m represents the embedding dimension, n is the gradient of boundary, and r is called as the width. In the following empirical analysis, m and n are set to be 2.
Complexity-invariant distance (CID) [46,47] has been widely applied in measuring complexity differences between two time sequences. The calculation steps are as follows: For two time series and with the same length of N, their complexity-invariant distance is given by
where is the Euclidean distance of X and Y, which is calculated by
and is a complexity correlation factor calculated by
CE and CE are the complexity estimates for and respectively, which are shown as follows
The cross CID FuzzyEn between and is defined by
The corresponding correlation coefficient between and is given as
It is worth noting that the CCF value measures the synchronism between two time series of the same length. To sum up, the lesser the CCF value is, or the bigger the CCF correlation coefficient is, the more synchronized the two time sequences are.
5.2. Mathematical Description of Ensemble Empirical Mode Decomposition
Empirical mode decomposition (EMD) [48], is a fully adaptive method so as to study nonlinear and non-stationary properties of time series. A signal is decomposed step by step into fluctuations or trends of different scales (frequency), and then produce a series of intrinsic mode functions (IMFs) and a residual sequence. The residual sequence is monotonic or average, which can represent the long-term trend or average state of the initial time sequence, and IMFs represent the distinct scales and produce adaptive data. An IMF sequence has two characteristics: (i) The difference between the extreme points of the time series and the zero crossings is less than or equal to 1; (ii) At every moment, the mean of the maximum envelope (upper envelope) and the minimum envelope (lower envelope) must be zero.
EMD decomposition is prone to modal aliasing. The ensemble empirical mode decomposition (EEMD) is a noise-assisted data analysis method proposed for the shortcomings of the EMD method. Wu and Huang [49] introduces white noise into the signal to be analyzed. The spectrum of white noise is uniformly distributed, so that the signal is automatically distributed to the appropriate reference scale, which complements some missing scales and has good performance in signal decomposition. The algorithm steps of EEMD are as follows:
- (a)
- Add a white noise sequence to the time series x in the m-th test
- (b)
- Use the same algorithm as traditional EMD [48] to resolve into IMFs and residue r
- (c)
- Repeat Procedure (a) and Procedure (b) for a pre-set value M of tests, and apply distinct white noise sequences which have the same amplitude every time.
- (d)
- Work out the mean value as the final IMFs, which is given by
In order to better illustrate the above algorithm, Figure 6 shows the flow chart of the EEMD method. Figure 7a,b show the decomposition results of and of WF by the EEMD algorithm. The plots show five IMFs (IMF1 to IMF5) and one residual. Figure 7c,d show the box plots of five IMFs to represent the basic statistical information, which clearly indicate that the fluctuation scale of IMF1 to IMF5 decreases successively.
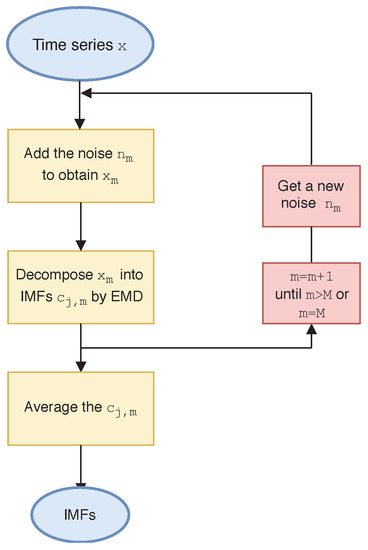
Figure 6.
Flow chart of ensemble empirical mode decomposition algorithm.
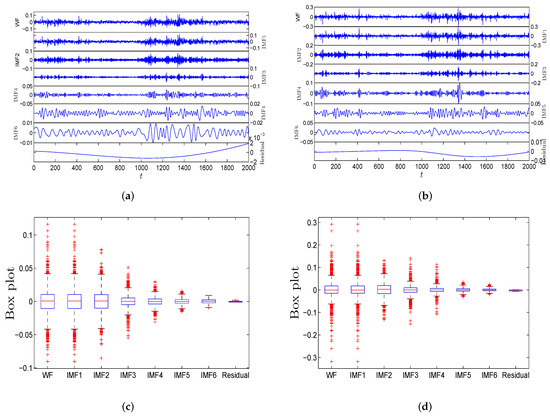
Figure 7.
(a) Decomposition results of for WF with five separate IMFs by EEMD; (b) Decomposition results of for WTI futures with five separate IMFs by EEMD; (c) Box plots of five separate IMFs of for WF; (d) Box plots of five separate IMFs of for WF.
5.3. Empirical Study for Complexity Synchronization
We apply the CCF approach to study the complexity synchronization feature of returns and the VMPD series for different energy items. WTI crude oil and Brent crude oil are chosen as references for comparison with other energy data. Figure 8a,c show the graphs of CCF values and correlation coefficient of returns and VMPD series for WF and WS with other energy items related to different values of r, where , and r is set from 0 to 0.5. From Figure 8a, we observe that the figure of WF returns with HF returns remains in the lowest part, while the curves for WF returns with futures of other exchanges stay in the higher part. This shows that the synchronization of WF returns with the futures return series of its own market is higher than that of WF returns with the futures return series of other market. It is worth noting that the CCF curve between WF and BF is located below that between WS and BS, which indicates that for the WTI crude oil and the Brent crude oil, the synchronization between futures returns is greater than that between spot returns. The results in Figure 8c are similar to those in Figure 8a. For all the VMPD series, we can see that CCF values reduce as the parameter r rises, and tend to be stable in the end, that are semblable to the results of return sequence. In Figure 8c, the curve of WF with HF for VMPD series also remains in the lowest part. We can also conclude from Figure 8c that for VMPD sequence, the WF is the most synchronized with the HF that belongs to the New York Mercantile Exchange, and the WF has the weakest synchronization with the LF that belongs to the Intercontinental Exchange.
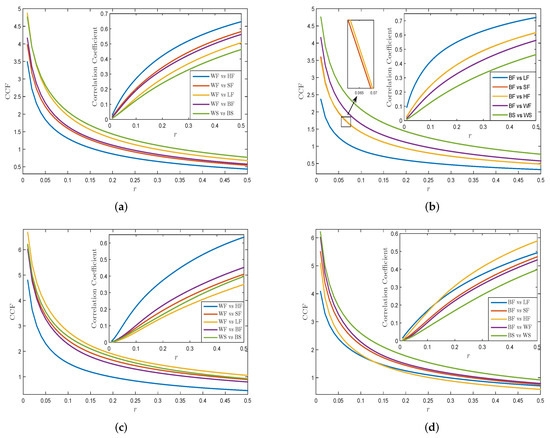
Figure 8.
(a) CCF values of WF returns and WS returns with other energy items; (b) CCF values of BF returns and BS returns with other energy items; (c) CCF values of WF and WS for VMPD series with other energy items; (d) CCF values WF and WS for VMPD series with other energy items.
Figure 8b,d demonstrate the plots of CCF values and correlation coefficients of returns and VMPD series for BF and BS with other energy items for different values of r. In Figure 8b, the curve of BF returns with LF returns remains in the lowest part, and the curve of BF returns with SF returns stays in the middle. And different energy return series appear obvious clustering behaviors in the CCF method graphs in terms of their markets. We may draw a conclusion that BF returns has the strongest synchronization with LF returns which belong to the same exchange as BF. The general trend and spatial distribution of each curve in Figure 8d is roughly the same as the curve in Figure 8b. As for the VMPD series of BF, the distance between each curve in Figure 8d is closer, and as the value of r increases, the gap between them decreases, and finally they are almost intertwined. Table 3 and Table 4 exhibit the CCF correlation coefficients of each returns and VMPD series pairs, respectively. It can be seen that nearly each correlation coefficient of VMPD sequences in Table 4 is smaller than those of returns in Table 3, which indicates a weaker correlation between the VMPD sequences.
Table 3.
CCF correlation coefficients of two return series for different values of r.
Table 4.
CCF correlation coefficients of two VMPD series for different values of r.
Next, we decompose returns and VMPD sequences of different energy data into corresponding IMFs by applying the EEMD algorithm to explore whether IMFs have analogical complexity synchronization behaviors as initial security time sequence. Figure 9a,b exhibit the CCF values of IMFs of WF returns and WS returns with other energy items. Figure 9c,d show the CCF values of IMFs of WF and WS for VMPD series with other energy items. IMFi () represents the ith IMF. In Figure 9, all the curves are smoother and have almost the same order as the curves in Figure 8a,c. This indicates that IMF1 and IMF2 retain most of statistical characteristics of the initial time sequence. In general, the IMFs obtained by the EEMD method partly have the complexity synchronization properties of the initial sequence, while the IMF1 and IMF2 sequences retain most information about the original sequence.
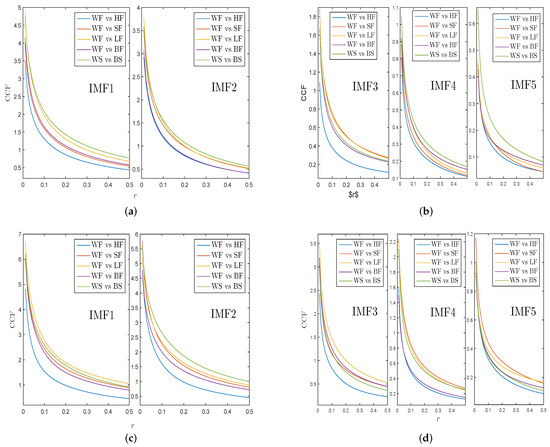
Figure 9.
(a) CCF values of IMF1-IMF2 for WF returns and WS returns with other energy items; (b) CCF values of IMF3-IMF5 for WF returns and WS returns with other energy items; (c) CCF values of IMF1-IMF2 of WF and WS for VMPD series with other energy items; (d) CCF values of IMF3-IMF5 of WF and WS for VMPD series with other energy items.
6. Conclusions
The study of return volatility for energy markets is extremely important in quantifying ventures and optimizing portfolios. The volatility monotonous persistence duration (VMPD) time sequence is firstly introduced into the research of energy markets to describe the security fluctuation behaviors from a new perspective. We adopt seven kinds of energy data including futures and spot from various markets, and the statistical properties and complex synchronization behaviors are studied. The price formation of economic market is the result of the complicated action of many factors, and entropy is an index of pattern diversity in time series. Based on fuzzy entropy and complex invariant distance, we construct a new method to measure complexity synchronization of VMPD series and return series for energy futures and spot. The main conclusions of this paper are as follows.
The VMPD sequence unites the maximum fluctuation difference and the continuous variation length, which is regarded as a novel indicator to evaluate investment risks. The range of changes in energy futures and spot prices may affect the investment attitudes of market participants, as drastic price changes may bring investment risks, thus making some market traders tend to adopt a more conservative attitude. Since VMPD quantifies the intensity of continuous volatility series, it can provide investors with short-term volatility trend, which is of great significance for investors to judge the risk level in the future.
Further, we observe two important statistic and nonlinear characteristics for the energy VMPD sequences: probability distribution and autocorrelation behavior. Empirical results show that return series and the VMPD series for the energy items exhibit excess kurtosis, fat-tail distributions, and absence of autocorrelation, specifically, the probability distribution is very well drawn by the power-law function.
Moreover, a new method called the cross CID FuzzyEn composed of cross-fuzzy entropy and complexity-invariant distance is firstly proposed in this paper. Implementing CCF analysis for seven representative energy items, the synchronization properties of returns and VMPD series are comparatively studied. It is shown that both return series and VMPD sequence gradually appear more synchronous with the width r increasing, and various energy return series present obvious clustering behavior in accordance with markets.The synchronization between futures series is greater than that between spot series, for WTI crude oil and Brent crude oil.
Then we apply the ensemble empirical mode decomposition (EEMD) to resolve returns and VMPD sequence into the intrinsic mode functions, and the degree that they follow the synchronization features of initial sequence is investigated. The empirical analysis reveals that the resolved data maintain some statistical and linear properties of initial energy time sequences.
All in all, based on the new volatility statistics and the proposed method of measuring complex synchronicity, we have done a large number of statistical and complex analyses of oil futures and spot data in several energy markets. As an emerging energy market, China energy futures market, just like mature energy futures markets in Europe and America, is a complex nonlinear system, and traditional theories and methods cannot effectively reflect the complex nonlinear dynamics characteristics. This paper provides a new perspective to describe volatility behaviors of energy markets, which is expected to be a new indicator to avoid risks. Compared with the return series, VMPD sequence has both commonness and difference, and it can describe the volatility behavior of energy futures and spot from a new angle, which is conducive to quantifying risks. For China, an important oil importer, it is necessary to establish a sound oil futures and spot market. This paper aims to provide a new reference for the managers and participants in the securities market. In terms of energy portfolio risks, in the short term, we should focus on the extent of continuous price rise (or fall) and continuous fluctuation duration in the energy futures and spot markets, so as to prevent and deal with the risk price fluctuation more effectively. Specifically, the significance lies in two aspects. Firstly, VMPD can reasonably describe the market fluctuations, guide investors to conduct optimal investment behavior, help investors avoid market risks, and obtain direct economic benefits. Secondly, it can provide a new perspective for financial researchers to explore energy market fluctuations, so as to provide some desirable guidance for the establishment of national macroeconomic policies. It can be seen that the research in this paper can not only bring practical economic significance and value, but also meet the development needs of social and economic construction.
In the process of measuring the reliability of the newly proposed statistics, we proposed a new method to measure the complexity synchronization. The new CCF method is valuable and can be applied to many aspects of fields, such as the comparison of different market products and the relationship of oil price and stock price. The new concept of VMPD series and the novel approach of measuring complexity synchronization can make the research on the fluctuation behaviors of energy markets be more abundant to a certain extent.
Author Contributions
L.J. collected the data, designed and performed the numerical analyses, wrote the main text, and generated the figures. L.J., J.K., and J.W. reviewed the economic background and put the work into context. J.K., and J.W. supervised the project. All authors reviewed the consistency of results and revised the manuscript.
Funding
The authors were supported by National Natural Science Foundation of China Grant No. 71271026.
Conflicts of Interest
The authors declare no conflict of interest.
Abbreviations
The following abbreviations are used in this manuscript:
| VMPD | Volatility monotonous persistence duration | WF | Crude oil WTI futures | |
| C-FuzzyEn | Cross-fuzzy entropy | WS | Crude oil WTI spot | |
| CID | Complexity invariant distance | HF | Heating oil futures | |
| CCF | Cross complexity invariant distance FuzzyEn | BF | Crude oil Brent futures | |
| IMF | Intrinsic mode function | BS | Crude oil Brent spot | |
| EMD | Eempirical mode decomposition | LF | London gas oil futures | |
| EEMD | Ensemble empirical mode decomposition | SF | Shanghai fuel oil futures |
References
- Veld, C.; Veld-Merkoulova, Y.V. The risk perceptions of individual investors. J. Econ. Psychol. 2008, 29, 226–252. [Google Scholar] [CrossRef]
- Mantegna, R.N.; Stanley, H.E. An Introduction to Econophysics: Correlations and Complexity in Finance; Cambridge University Press: Cambridge, UK, 1999. [Google Scholar]
- Lux, T.; Marchesi, M. Scaling and criticality in a stochastic multi-agent model of a financial market. Volatility clustering in financial markets: A microsimulation of interacting agents. Nature 2000, 397, 498–500. [Google Scholar] [CrossRef]
- Bouri, E.; Shahzad, S.J.H.; Raza, N.; Roubaud, D. Oil volatility and sovereign risk of BRICS. Energy Econ. 2018, 70, 258–269. [Google Scholar] [CrossRef]
- Cunado, J.; Gracia, F.P.D. Oil prices, economic activity and inflation: evidence for some Asian countries. Q. Rev. Econ. Financ. 2005, 45, 65–83. [Google Scholar] [CrossRef]
- Martina, E.; Rodriguez, E.; Escarela-Perez, R.; Alvarez-Ramirez, J. Multiscale entropy analysis of crude oil price dynamics. Energy Econ. 2011, 33, 936–947. [Google Scholar] [CrossRef]
- Huang, L.; Wang, J. Global crude oil price prediction and synchronization based accuracy evaluation using random wavelet neural network. Energy 2018, 151, 875–888. [Google Scholar] [CrossRef]
- Anagnoste, S.; Caraiani, P. The Impact of Financial and Macroeconomic Shocks on the Entropy of Financial Markets. Entropy 2019, 21, 316. [Google Scholar] [CrossRef]
- Caraiani, P. Modeling the Comovement of Entropy between Financial Markets. Entropy 2018, 20, 417. [Google Scholar] [CrossRef]
- Pascoal, P.; Monteiro, A.M. Market Efficiency, Roughness and Long Memory in PSI20 Index Returns: Wavelet and Entropy Analysis. Entropy 2014, 16, 2768–2788. [Google Scholar] [CrossRef]
- Niu, H.; Zhang, L. Nonlinear Multiscale Entropy and Recurrence Quantification Analysis of Foreign Exchange Markets Efficiency. Entropy 2017, 20, 17. [Google Scholar] [CrossRef]
- Trivellato, B. Deformed Exponentials and Applications to Finance. Entropy 2013, 15, 3471–3489. [Google Scholar] [CrossRef]
- Wang, Y.D.; Zheng, S.Z.; Zhang, W.; Wang, J. Complex and Entropy of Fluctuations of Agent-Based Interacting Financial Dynamics with Random Jump. Entropy 2017, 19, 512. [Google Scholar] [CrossRef]
- Zhang, W.; Wang, J. Nonlinear stochastic interacting dynamics and complexity of financial gasket fractal-like lattice percolation. Phys. Lett. A 2018, 18, 1218–1225. [Google Scholar] [CrossRef]
- Black, F.; Scholes, M. The pricing of options and corporate liabilities. J. Political Econ. 1973, 81, 637–654. [Google Scholar] [CrossRef]
- Lopes, A.M.; Machado, J.A.T. Analysis of temperature time-series: Embedding dynamics into the MDS method. Commun. Nonlinear Sci. Numer. Simulat. 2014, 19, 851–871. [Google Scholar] [CrossRef]
- Machado, J.A.T.; Duarte, F.B.; Duarte, G.M. Analysis of stock market indices through multidimensional scaling. Commun. Nonlinear Sci. Numer. Simulat. 2016, 16, 4610–4618. [Google Scholar] [CrossRef]
- Stanley, H.E.; Gabaix, X.; Gopikrishnan, P.; Plerou, V. Economic fluctuations and statistica lphysics: The puzzle of large fluctuations. Nonlinear Dyn. 2006, 44, 329340. [Google Scholar] [CrossRef]
- Elliott, R.J.; Siu, T.K.; Fung, E.S. Filtering a nonlinear stochastic volatility model. Nonlinear Dyn. 2012, 67, 1295–1313. [Google Scholar] [CrossRef]
- French, K.R.; Schwert, G.W.; Stambaugh, R.F. Expected Stock Returns and Volatility. J. Financ. Econ. 1987, 19, 3–29. [Google Scholar] [CrossRef]
- Wang, T.; Wu, J.T.; Yang, J. Realized volatility and correlation in energy futures markets. J. Futures Mark. 2008, 28, 993–1011. [Google Scholar] [CrossRef]
- Wang, F.; Yamasaki, K.; Havlin, S.; Stanley, H.E. Scaling and memory of intraday volatility return intervals in stock markets. Phys. Rev. E 2016, 73, 026117. [Google Scholar] [CrossRef] [PubMed]
- Xie, W.J.; Jiang, Z.Q.; Zhou, W.X. Extreme value statistics and recurrence intervals of NYMEX energy futures volatility. Econ. Model. 2014, 36, 8–17. [Google Scholar] [CrossRef]
- Yang, G.; Wang, J.; Deng, W. Nonlinear analysis of volatility duration financial series model by stochastic interacting dynamic system. Nonlinear Dyn. 2015, 80, 701–713. [Google Scholar] [CrossRef]
- Niu, H.; Wang, J. Return volatility duration analysis of NYMEX energy futures and spot. Energy 2017, 140, 837–849. [Google Scholar] [CrossRef]
- Wang, G.C.; Wang, J. New approach of financial volatility duration dynamics by stochastic finite-range interacting voter system. Chaos 2017, 27, 013117. [Google Scholar] [CrossRef]
- Jia, L.L.; Ke, J.C.; Wang, J. Volatility aggregation intensity energy futures series on stochastic finite-range exclusion dynamics. Phys. A 2019, 514, 370–383. [Google Scholar] [CrossRef]
- Niu, H.; Wang, W.Q.; Zhang, J.H. Recurrence duration statistics and time-dependent instrinsic correlation analysis of trading volumes: A study of Chinese stock indices. Phys. A 2019, 514, 828–854. [Google Scholar] [CrossRef]
- Cont, R. Empirical properties of asset returns: Stylized facts and statistical issues. Quant. Financ. 2001, 1, 223–236. [Google Scholar] [CrossRef]
- Lux, T.; Marchesi, M. Volatility clustering in financial markets: A microsimulation of interacting agents. Int. J. Theor. Appl. Financ. 2000, 3, 675–702. [Google Scholar] [CrossRef]
- Yu, Y.; Wang, J. Lattice-oriented percolation system applied to volatility behavior of stock market. J. Appl. Stat. 2012, 39, 785–797. [Google Scholar] [CrossRef]
- Alvarezramirez, J.; Alvarez, J.; Rodrguez, E. Asymmetric long-term autocorrelations in crude oil markets. Phys. A 2015, 424, 33–341. [Google Scholar]
- Wang, X.Y.; He, Y. Projective synchronization of fractional order chaotic system based on linear separation. Phys. Lett. A 2008, 372, 435–441. [Google Scholar] [CrossRef]
- Meng, J.; Wang, X.Y. Generalized synchronization via nonlinear control. Chaos 2018, 18, 023108. [Google Scholar]
- Wu, S.D.; Wu, C.W.; Lin, S.G.; Wang, C.C.; Lee, K.Y. Time series analysis using composite multiscale entropy. Entropy 2013, 15, 1069–1084. [Google Scholar] [CrossRef]
- Benettin, G.; Galgani, L.; Strelcyn, J.M. Kolmogorov entropy and numerical experiments. Phys. Rev. A 1976, 14, 2338–2345. [Google Scholar] [CrossRef]
- Richman, J.S.; Moorman, J.R. Physiological time-series analysis using approximate entropy and sample entropy. Am. J. Physiol. Heart Circ. 2000, 278, 2039–2049. [Google Scholar] [CrossRef]
- Pincus, S.M. Approximate entropy as a measure of system complexity. Proc. Natl. Acad. Sci. USA 1991, 88, 2297–2301. [Google Scholar] [CrossRef]
- Chen, W.T.; Wang, Z.Z.; Xie, H.; Yu, W. Characterization of surface EMG signal based on fuzzy entropy. IEEE Trans. Neural Syst. Rehabil. Eng. 2007, 15, 266–272. [Google Scholar] [CrossRef]
- Chen, W.T.; Zhuang, J.; Yu, W.X.; Wang, Z.Z. Measuring complexity using FuzzyEn, ApEn, and SampEn. Med. Eng. Phys. 2009, 31, 61–68. [Google Scholar] [CrossRef]
- Wu, S.D.; Wu, P.H.; Wu, C.W.; Ding, J.J.; Wang, C.C. Bearing fault diagnosis based on multiscale permutation entropy and support vector machine. Entropy 2012, 14, 1343–1356. [Google Scholar] [CrossRef]
- Graff, B.; Graff, G.; Kaczkowska, A. Entropy measures of heart rate variability for short ECG datasets inpatients with congestive heart failure. Acta Phys. Pol. B Proc. Suppl. 2012, 5, 153–158. [Google Scholar] [CrossRef]
- Xie, H.B.; Zheng, Y.P.; Guo, J.Y.; Chen, X. Cross-fuzzy entropy: A new method to test pattern synchrony of bivariate time series. Inf. Sci. 2010, 180, 1715–1724. [Google Scholar] [CrossRef]
- Darbellay, G.A.; Wuertz, D. The entropy as a tool for analysing statistical dependences in financial time series. Phys. A 2000, 287, 429–439. [Google Scholar] [CrossRef]
- Risso, W.A. The informational efficiency and the financial crashes. Res. Int. Bus. Financ. 2008, 22, 396–408. [Google Scholar] [CrossRef]
- Batista, G.E.; Keogh, E.J.; Tataw, O.M.; de Souza, V.M. CID: An efficient complexity-invariant distance for time series. Data Min. Knowl. Discov. 2014, 28, 634–669. [Google Scholar] [CrossRef]
- Baumert, M.; Czippelova, B.; Porta, A.; Javorka, M. Decoupling of QT interval variability from heart rate variability with ageing. Physiol. Meas. 2013, 34, 1435–1448. [Google Scholar] [CrossRef]
- Huang, N.E.; Shen, Z.; Long, S.R.; Wu, M.C.; Shih, H.H.; Zheng, Q.; Yen, N.C.; Tung, C.C.; Liu, H.H. The empirical mode decomposition and the Hilbert spectrum for nonlinear and non-stationary time series analysis. Proc. R. Soc. Lond. Ser. A 1998, 454, 903–995. [Google Scholar] [CrossRef]
- Wu, Z.H.; Huang, N.E. Ensemble empirical mode decomposition: a noise-assisted data analysis method. Adv. Adapt. Data Anal. 2009, 1, 1–41. [Google Scholar] [CrossRef]
- Sharma, G.K.; Kumar, A.; Jayakumar, T.; Rao, B.P.; Mariyappa, N. Ensemble empirical mode decomposition based methodology for ultrasonic testing of coarse grain austenitic stainless steels. Ultrasonics 2015, 57, 167–178. [Google Scholar] [CrossRef]
- Ilinski, K. Physics of Finance: Gauge Modelling in Non-Equilibrium Pricing; Wiley: New York, NJ, USA, 2001. [Google Scholar]
- Gabaix, X.; Gopikrishnan, P.; Plerou, V.; Stanley, H.E. A Theory of Power-Law Distributions in Financial Market Fluctuations. Nature 2003, 423, 267–270. [Google Scholar] [CrossRef]
- Lux, T. Financial Power Laws: Empirical Evidence, Models and Mechanisms; Cambridge University Press: Cambridge, UK, 2008. [Google Scholar]
- Tsay, R.S. Analysis of Financial Time Series; Wiley: New York, NJ, USA, 2005. [Google Scholar]
- Yang, G.; Wang, J. Complexity and multifractal of volatility duration for agent-based financial dynamics and real markets. Fractals 2016, 23, 1650052. [Google Scholar] [CrossRef]
- Kyriazis, N.A. A survey on efficiency and profitable trading opportunities in cryptocurrency markets. J. Risk Financ. Manag. 2019, 12, 67. [Google Scholar] [CrossRef]
- Malkiel, B.G. The efficient market hypothesis and its critics. J. Econ. Perspect. 2003, 17, 59–82. [Google Scholar] [CrossRef]


© 2019 by the authors. Licensee MDPI, Basel, Switzerland. This article is an open access article distributed under the terms and conditions of the Creative Commons Attribution (CC BY) license (http://creativecommons.org/licenses/by/4.0/).