Entropy-Based Method to Evaluate Contact-Pressure Distribution for Assembly-Accuracy Stability Prediction

Abstract
:1. Introduction
2. Methods
2.1. Contact Pressure
2.2. Contact Pressure Evaluation Method
2.3. Methodology
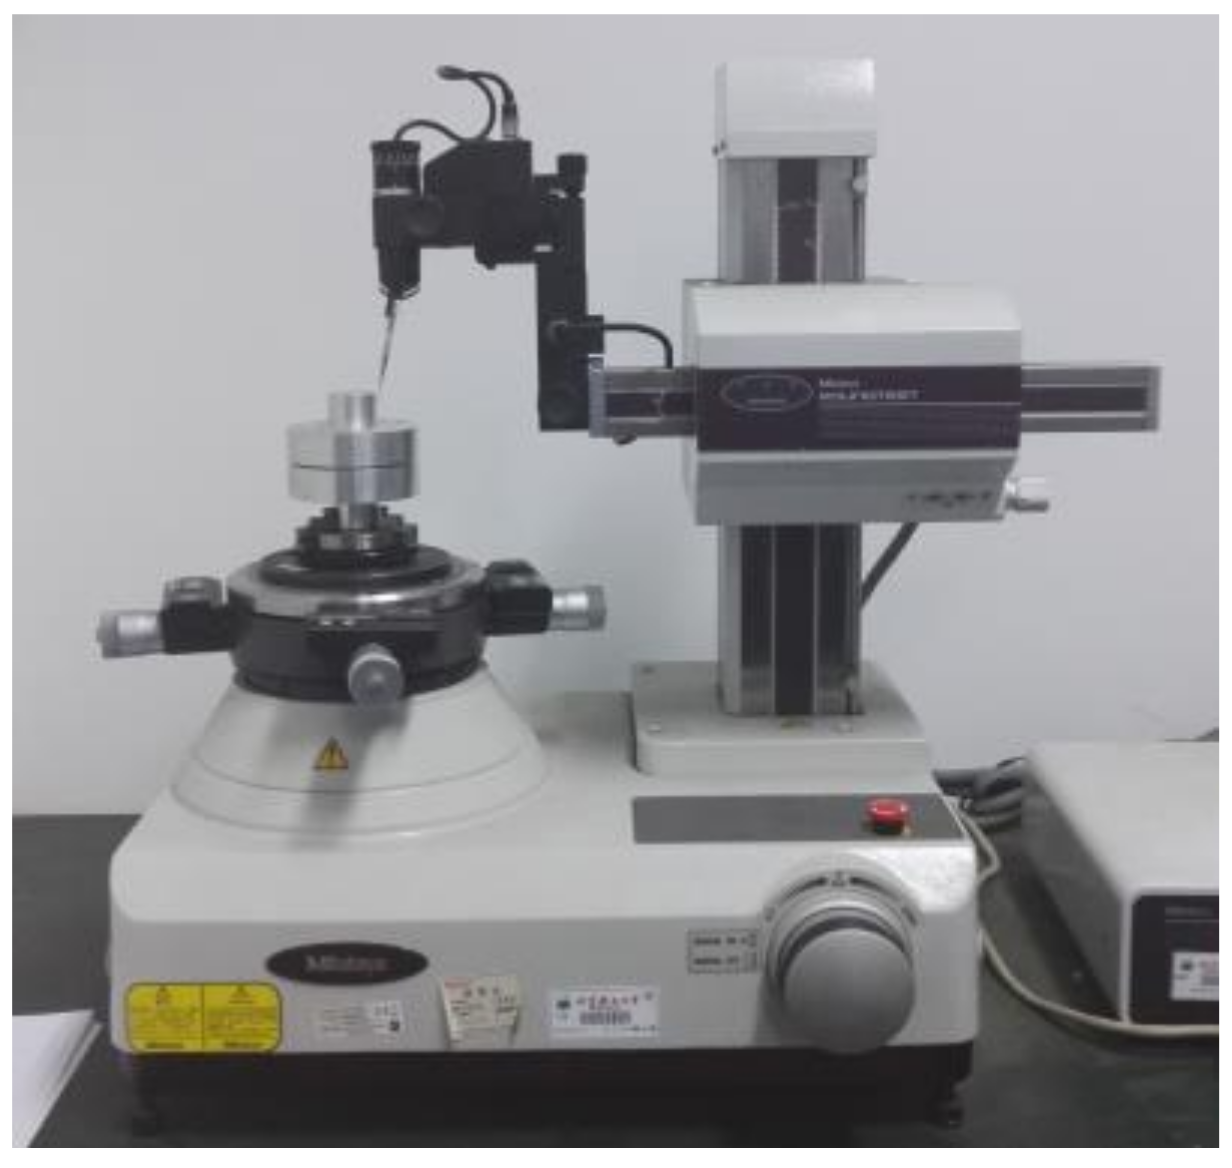
3. Case Study
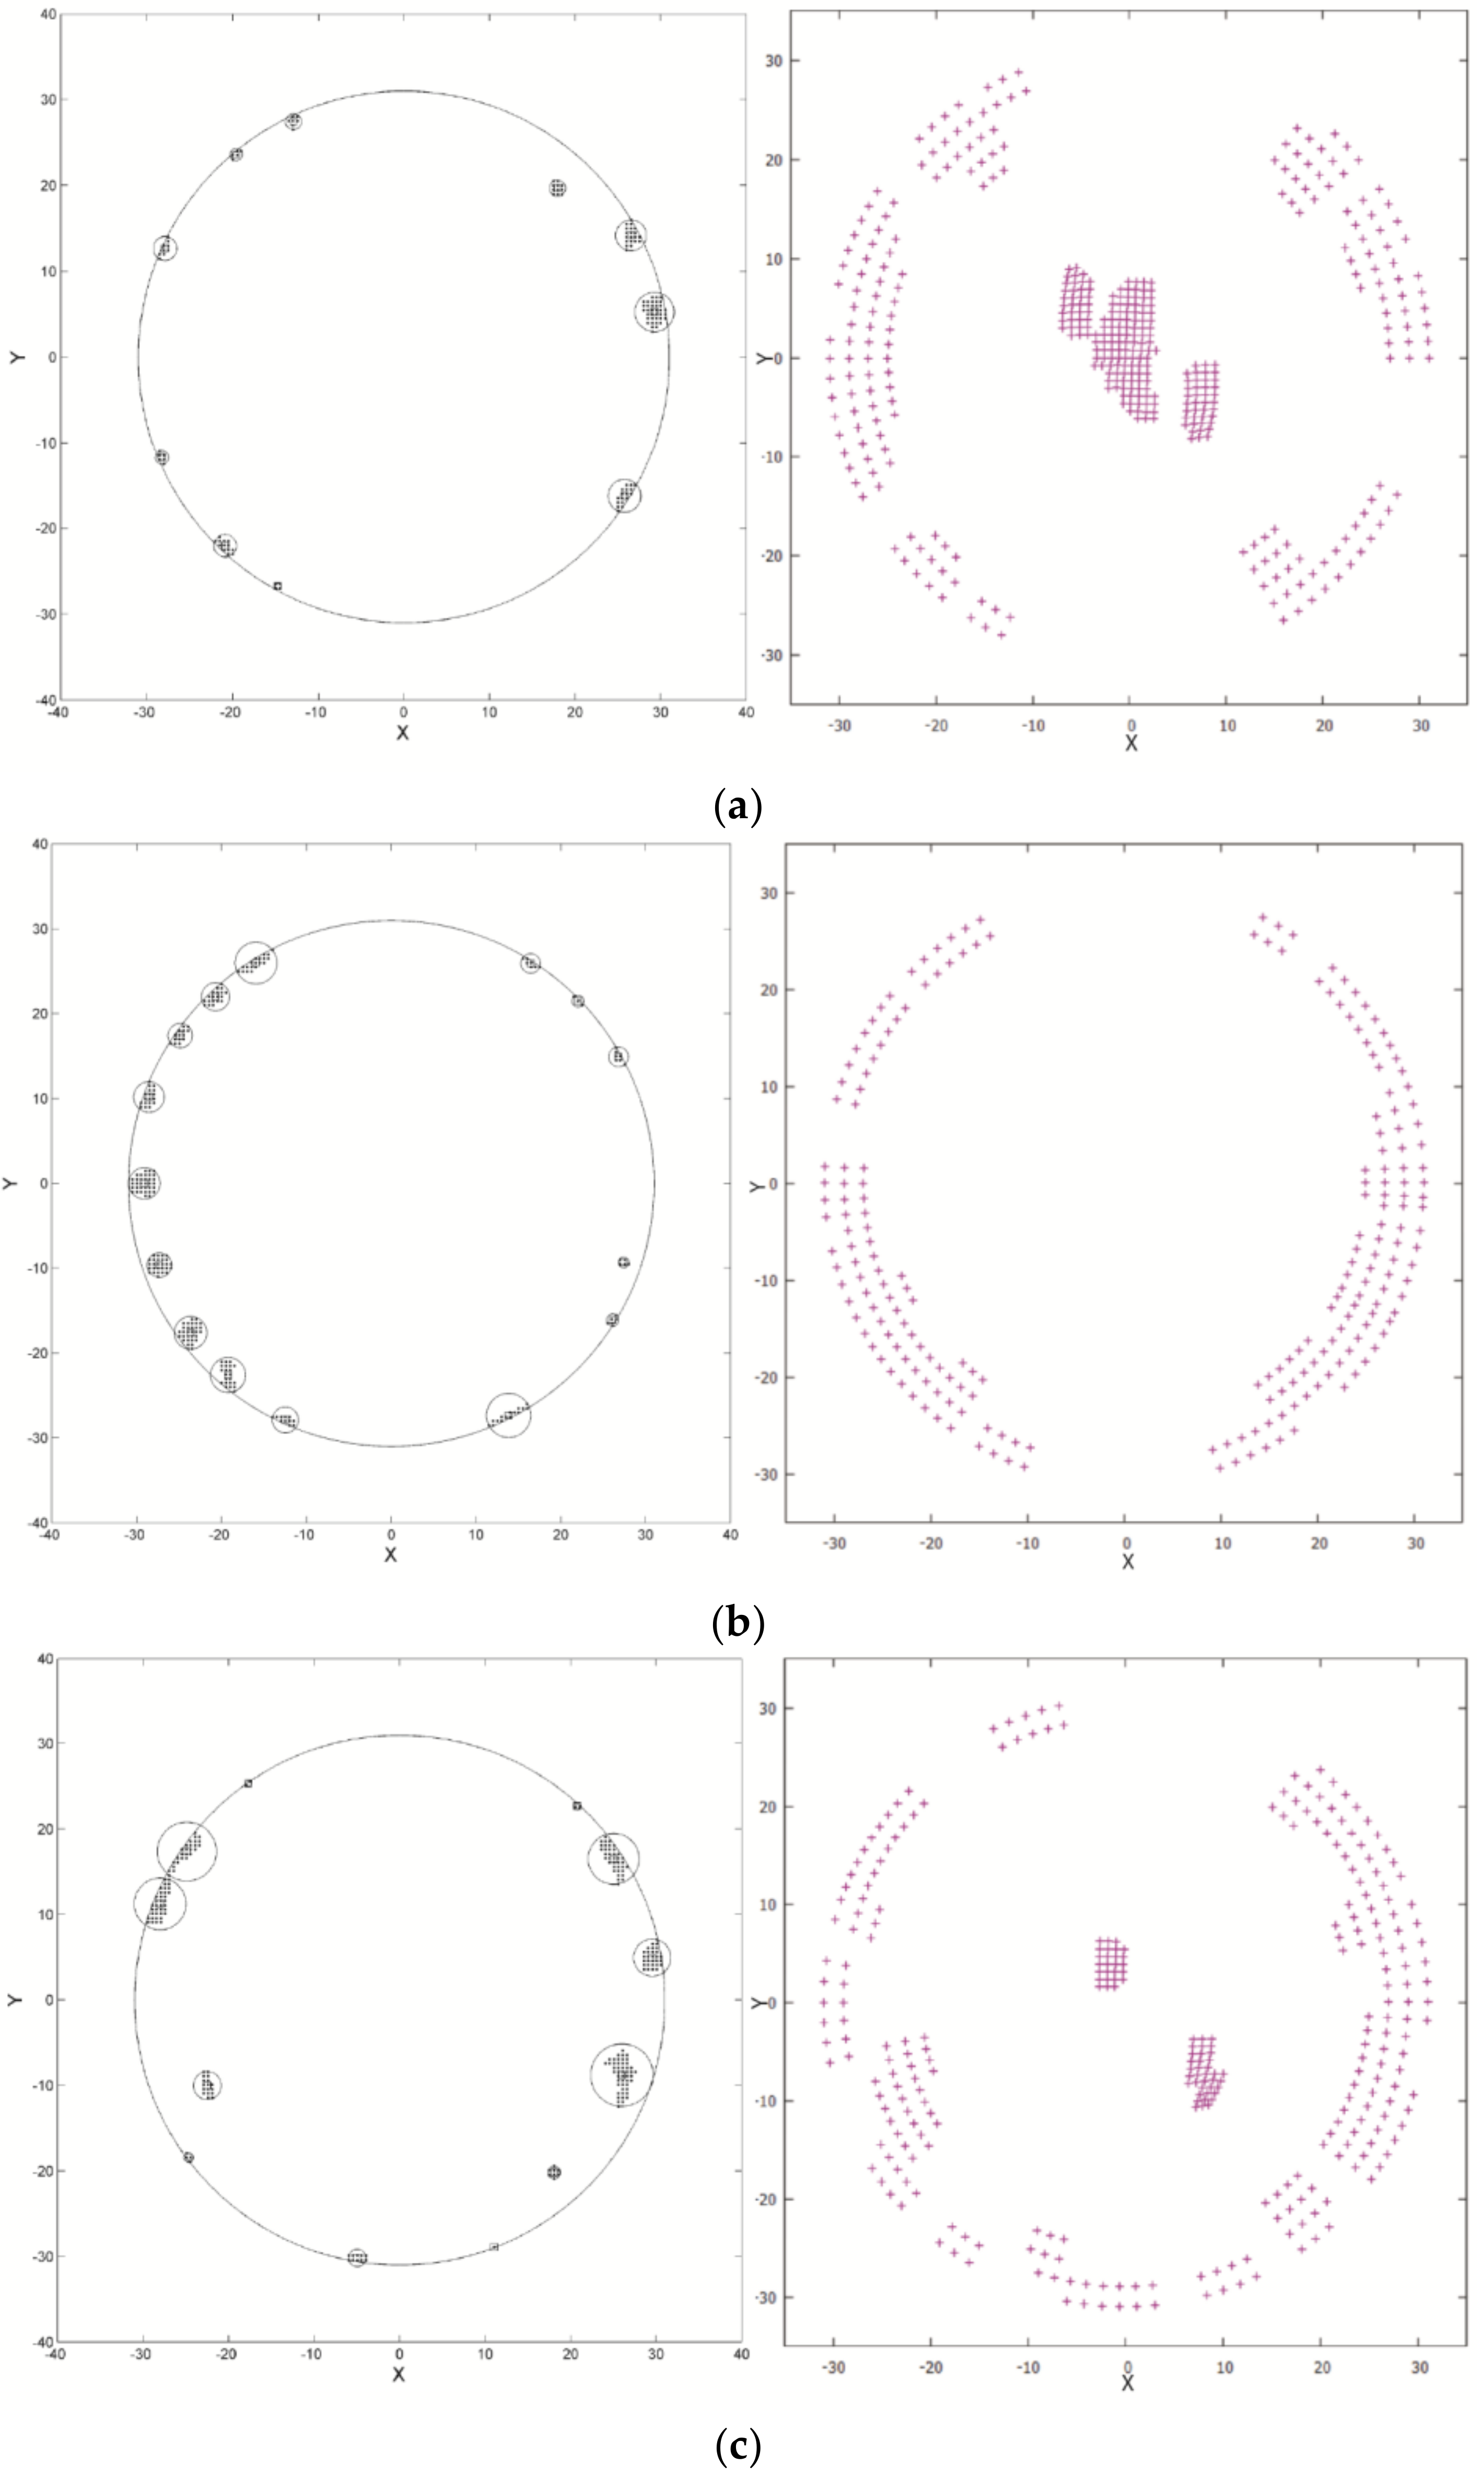
3.1. Case 1
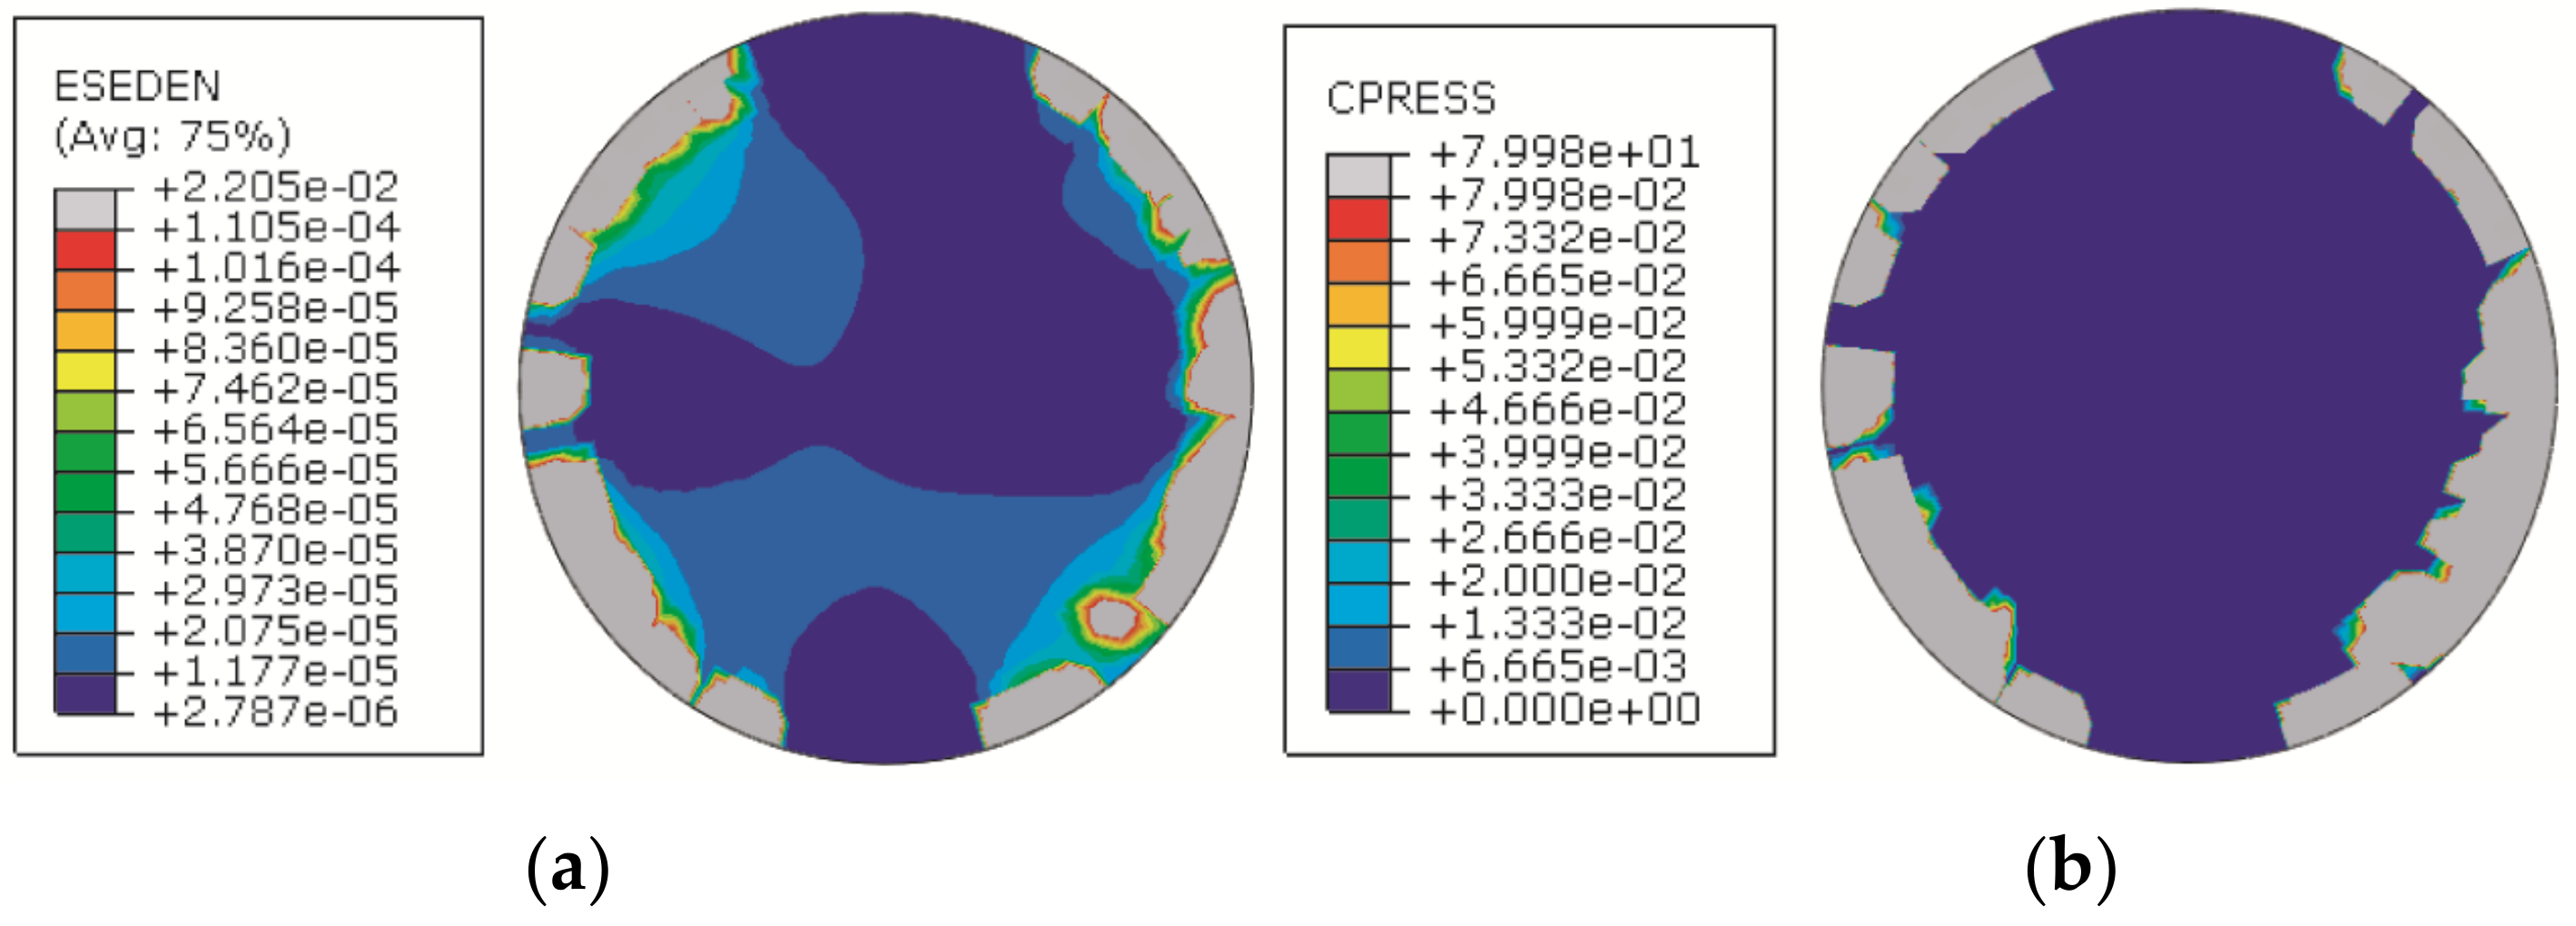
- Contact pressure distribution entropy (CPE).
- Contact strain energy distribution entropy (SEE).
3.2. Case 2
4. Discussion
5. Conclusion
- This study has presented an improved prediction method for assembly accuracy stability. By using the contact pressure as the evaluation parameter instead of the strain energy density, a simpler and more efficient prediction effect was obtained. The same simulation and experiment were performed as that in the original method, and the accuracy of the improved method was verified.
- The contact pressure has a clearer mechanical significance than the strain energy density in the assembly process, which can be used to distinguish the actual contact area from the contact surface. Hence, the contact pressure is more suitable as the evaluation parameter than the strain energy density.
- Through two case studies, the feasibility and effectiveness of the method were proved. Research on the impact of assembly force verification with time and application on other types of mating surfaces will be the future research direction of this method.
Author Contributions
Funding
Conflicts of Interest
References
- Liu, C.H. Tolerance Redistributing of the Reassembly Dimensional Chain on Measure of Uncertainty. Entropy 2016, 18, 348. [Google Scholar] [CrossRef]
- Davidson, J.K.; Mujezinovic, A.; Shah, J.J. A new mathematical model for geometric tolerances as applied to round faces. J Mech. Des 2002, 124, 609–622. [Google Scholar] [CrossRef]
- Anwer, N.; Schleich, B.; Mathieu, L.; Wartzack, S. From solid modelling to skin model shapes: Shifting paradigms in computer-aided tolerancing. CIRP Ann-Manuf. Technol. 2014, 63, 137–140. [Google Scholar] [CrossRef]
- Schleich, B.; Anwer, N.; Mathieu, L.; Wartzack, S. Skin model shapes: A new paradigm shift for geometric variations modelling in mechanical engineering. Comput. Aided Des. 2014, 50, 1–15. [Google Scholar] [CrossRef]
- Homri, L.; Goka, E.; Levasseur, G.; Dantan, J.Y. Tolerance analysis—Form defects modeling and simulation by modal decomposition and optimization. Comput. Aided Des. 2017, 91, 46–59. [Google Scholar] [CrossRef]
- Huang, W.; Ceglarek, D. Mode-based decomposition of part form error by discrete-cosine-transform with implementation to assembly and stamping system with compliant parts. CIRP Ann-Manuf. Technol. 2002, 51, 21–26. [Google Scholar] [CrossRef]
- Guo, J.; Li, B.; Liu, Z.; Hong, J.; Wu, X. Integration of geometric variation and part deformation into variation propagation of 3-D assemblies. Int. J. Prod. Res. 2016, 54, 5708–5721. [Google Scholar] [CrossRef]
- Zhang, T.Y.; Zhang, Z.Z.; Jin, X.; Ye, X.; Zhang, Z.Q. An innovative method of modeling plane geometric form errors for precision assembly. Proc. Inst. Mech. Eng. B J. Eng. Manuf. 2016, 230, 1087–1096. [Google Scholar] [CrossRef]
- Lee, N.K.; Yu, G.; Joneja, A.; Ceglarek, D. The modeling and analysis of a butting assembly in the presence of workpiece surface roughness and part dimensional error. Int. J. Adv. Manuf. Technol. 2006, 31, 528–538. [Google Scholar] [CrossRef]
- Harsha, S.P.; Kankar, P.K. Stability analysis of a rotor bearing system due to surface waviness and number of balls. Int. J. Mech. Sci. 2004, 46, 1057–1081. [Google Scholar] [CrossRef]
- Fang, Y.; Jin, X.; Huang, C.; Zhang, Z. Entropy-Based Method for Evaluating Contact Strain-Energy Distribution for Assembly Accuracy Prediction. Entropy 2017, 19, 49. [Google Scholar] [CrossRef]
- Babu, M.; Franciosa, P.; Ceglarek, D. Shape Error Modelling and Analysis by Conditional Simulations of Gaussian Random Fields for Compliant Non-Ideal Sheet Metal Parts. Procedia CIRP 2018, 75, 279–284. [Google Scholar] [CrossRef]
- Bolotov, M.; Grachev, I.; Kudashov, E. Investigation of Parts Assembly Error, Taking into Account the Deviation of the Shape of Their Surfaces. In Proceedings of the International Conference on Modern Trends in Manufacturing Technologies and Equipment (ICMTMTE 2018), Les Ulis, France, 30 October 2018. [Google Scholar]
- Zhang, Z.Q.; Zhang, Z.J.; Jin, X.; Zhang, Q.S. A novel modelling method of geometric errors for precision assembly. Int. J. Adv. Manuf. Technol. 2018, 94, 1139–1160. [Google Scholar] [CrossRef]
- Xiao, L.; Björklund, S.; Rosén, B.G. The influence of surface roughness and the contact pressure distribution on friction in rolling/sliding contacts. Tribol. Int. 2007, 40, 694–698. [Google Scholar] [CrossRef]
- Kim, S.M.; Lee, S.K. Prediction of thermo-elastic behavior in a spindle–bearing system considering bearing surroundings. Int. J. Mach. Tool. Manuf. 2001, 41, 809–831. [Google Scholar] [CrossRef]
- Germaneau, A.; Peyruseigt, F.; Mistou, S.; Doumalin, P.; Dupré, J.C. 3D mechanical analysis of aeronautical plain bearings: Validation of a finite element model from measurement of displacement fields by digital volume correlation and optical scanning tomography. Opt. Lasers Eng. 2010, 48, 676–683. [Google Scholar] [CrossRef] [Green Version]
- Zhang, Y.; McClain, B.; Fang, X.D. Design of interference fits via finite element method. Int. J. Mech. Sci. 2000, 42, 1835–1850. [Google Scholar] [CrossRef]
- Peng, L.; Lai, X. Effect of assembly error of bipolar plate on the contact pressure distribution and stress failure of membrane electrode assembly in proton exchange membrane fuel cell. J. Power Sources 2010, 195, 4213–4221. [Google Scholar]
- Deguchi, K.; Takeuchi, N.; Shimizu, A. Evaluation of pressure uniformity using a pressure-sensitive film and calculation of wafer distortions caused by mold press in imprint lithography. Jpn. J. Appl. Phys. 2002, 41, 4178. [Google Scholar] [CrossRef]
- Yang, G.; Hong, J.; Wang, N.; Zhu, L.; Ding, Y.; Yang, Z. Member stiffnesses and interface contact characteristics of bolted joints. In Proceedings of the 2011 IEEE International Symposium on Assembly and Manufacturing (ISAM), Tampere, Finland, 25–27 May 2011. [Google Scholar]
- Ito, Y.; Toyoda, J.; Nagata, S. Interface pressure distribution in a bolt-flange assembly. J. Mech. Des. 1979, 101, 330–337. [Google Scholar] [CrossRef]
- Nassar, S.A.; Barber, G.C.; Zuo, D. Bearing friction torque in bolted joints. Tribol. T. 2005, 48, 69–75. [Google Scholar] [CrossRef]
- Ramesh, R.; Mannan, M.A.; Poo, A.N. Error compensation in machine tools—A review: Part II: Thermal errors. Int. J. Mach. Tool. Manu. 2000, 40, 1257–1284. [Google Scholar] [CrossRef]
- Attia, M.H.; Kops, L. Importance of contact pressure distribution on heat transfer in structural joints of machine tools. J. Eng. Industry 1980, 102, 159–167. [Google Scholar] [CrossRef]
- Tyfour, W.R.; Beynon, J.H.; Kapoor, A. Deterioration of rolling contact fatigue life of pearlitic rail steel due to dry-wet rolling-sliding line contact. Wear 1996, 197, 255–265. [Google Scholar] [CrossRef]
- Johnson, K.L. Contact Mechanics; Cambridge University Press: New York, NY, USA; Volume 1, pp. 4–6.
- Laskowski, R.; Smyk, A.; Rusowicz, A.; Grzebielec, A. Determining the optimum inner diameter of condenser tubes based on thermodynamic objective functions and an economic analysis. Entropy 2016, 18, 444. [Google Scholar] [CrossRef]
- Mihelich, M.; Faranda, D.; Paillard, D.; Dubrulle, B. Is Turbulence a State of Maximum Energy Dissipation? Entropy 2017, 19, 154. [Google Scholar] [CrossRef]
- Muñoz-Cobo, J.L.; Mendizábal, R.; Miquel, A.; Berna, C.; Escrivá, A. Use of the Principles of Maximum Entropy and Maximum Relative Entropy for the Determination of Uncertain Parameter Distributions in Engineering Applications. Entropy 2017, 19, 486. [Google Scholar] [CrossRef]
- Baggenstoss, P. Beyond Moments: Extending the Maximum Entropy Principle to Feature Distribution Constraints. Entropy 2018, 20, 650. [Google Scholar] [CrossRef]
- Krantz, R.; Gemmetto, V.; Garlaschelli, D. Maximum-Entropy Tools for Economic Fitness and Complexity. Entropy 2018, 20, 743. [Google Scholar] [CrossRef]
- Shannon, C.E. A Mathematical Theory of Communication. Bell Syst. Tech. J. 1948, 27, 379–423. [Google Scholar] [CrossRef]
- Melia, U.; Claria, F.; Vallverdu, M.; Caminal, P. Measuring Instantaneous and Spectral Information Entropies by Shannon Entropy of Choi-Williams Distribution in the Context of Electroencephalography. Entropy 2014, 16, 2530–2548. [Google Scholar] [CrossRef] [Green Version]
- Xiao, J.; He, Z.Y. A Concept Lattice for Semantic Integration of Geo-Ontologies Based on Weight of Inclusion Degree Importance and Information Entropy. Entropy 2016, 18, 399. [Google Scholar] [CrossRef]


| Group of Sample | CPE | SEE | Coaxiality between surfA and surfB/μm |
|---|---|---|---|
| 1 | 0.84835 | 0.79544 | 102.39 |
| 2 | 0.84012 | 0.78976 | 141.663 |
| 3 | 0.82676 | 0.73198 | 233.853 |
| 4 | 0.80415 | 0.71552 | 240.258 |
| 5 | 0.77873 | 0.68071 | 402.248 |
| Group of Sample | CPE | Coaxiality Change/μm |
|---|---|---|
| 1 | 0.84835 | 7.86 |
| 2 | 0.84012 | 14.1 |
| 3 | 0.82676 | 21.67 |
| 4 | 0.80415 | 23.55 |
| 5 | 0.77873 | 53.26 |
| Terms | Parameters | Values |
|---|---|---|
| Software setting | Software | ABAQUS |
| Type of contact | Surface-to-surface | |
| Type of simulation | Explicit | |
| Elements | Type of element | C3D8I |
| Formulation of the element | Linear | |
| Material | Magnesium lithium alloy (lens barrels) | 40 GPa (Young’s modulus) |
| 0.33 (Poisson’s ratio) | ||
| 2.18 × 10⁻⁵/°C | ||
| Aluminum alloy (optical bench) | 70 GPa (Young’s modulus) | |
| 0.32 (Poisson’s ratio) | ||
| 2.38 × 10⁻⁵/°C | ||
| Carbon steel (bolt) | 210 GPa (Young’s modulus) | |
| 0.3 (Poisson’s ratio) | ||
| 1.1 × 10⁻⁵/°C | ||
| Boundary conditions | Preload of bolts | F1 = F2 … = F8 = 1000 N |
| Ideal Model | Error Model 1 | Error Model 2 | |
|---|---|---|---|
| Experiment result/μm | - | 18.2 | 14.8 |
| Simulation result/μm | 2.6 | 20.8 | 12.3 |
| CPE | 0.98876 | 0.92604 | 0.937794 |
© 2019 by the authors. Licensee MDPI, Basel, Switzerland. This article is an open access article distributed under the terms and conditions of the Creative Commons Attribution (CC BY) license (http://creativecommons.org/licenses/by/4.0/).
Share and Cite
Chen, X.; Jin, X.; Shang, K.; Zhang, Z. Entropy-Based Method to Evaluate Contact-Pressure Distribution for Assembly-Accuracy Stability Prediction. Entropy 2019, 21, 322. https://doi.org/10.3390/e21030322
Chen X, Jin X, Shang K, Zhang Z. Entropy-Based Method to Evaluate Contact-Pressure Distribution for Assembly-Accuracy Stability Prediction. Entropy. 2019; 21(3):322. https://doi.org/10.3390/e21030322
Chicago/Turabian StyleChen, Xiao, Xin Jin, Ke Shang, and Zhijing Zhang. 2019. "Entropy-Based Method to Evaluate Contact-Pressure Distribution for Assembly-Accuracy Stability Prediction" Entropy 21, no. 3: 322. https://doi.org/10.3390/e21030322
APA StyleChen, X., Jin, X., Shang, K., & Zhang, Z. (2019). Entropy-Based Method to Evaluate Contact-Pressure Distribution for Assembly-Accuracy Stability Prediction. Entropy, 21(3), 322. https://doi.org/10.3390/e21030322