
Connectivity Analysis for Multivariate Time Series: Correlation vs. Causality


Abstract
:1. Introduction
2. Non-Directional Connectivity Measures
3. Directional Connectivity Measures
4. Limitations and Pitfalls of Connectivity Measures
5. Correlation vs. Causality
- Partial linear Pearson correlation coefficient (PPCor) , where , stands for covariance, and and are the standard deviations of X and Y. Estimation of PPCor is performed based on “partialcorr” function from the Matlab Statistics Toolbox.
- Partial Spearman rank correlation coefficient (PSpCorr), defined similarly to PPCor but on the series of the ranks. Estimation of PSpCorr is performed based on “partialcorr” function from the Matlab Statistics Toolbox.
- Partial distance correlation (pdCor) is the extension of the distance correlation (dCor) in the multivariate case. The distance correlation of two random variables is obtained by dividing their distance covariance by the product of the distance standard deviations, i.e., . Partial distance correlation is defined based on a Hilbert space where the squared distance covariance is defined as an inner product [51]. Estimation of pdCor is performed based on R codes given in [209].
- Mutual information (MI) = can be expressed on entropy terms, where is the Shannon entropy of the variable X. The k-nearest neighbors (KNN) estimator has been utilized for the estimation of MI [210].
- Conditional Granger causality index (CGCI) is defined on the unrestricted and restricted vector autoregressive model (VAR) of order P, fitted to the time series of X: , where the unrestricted model includes past terms from variables, the restricted model omits the past terms of X variable and , are the residual variances of the corresponding VAR models. The Matlab code for the computation of CGCI can be found in https://github.com/dkugiu/Matlab/ (accessed on 23 October 2021).
- Restricted conditional Granger causality index (RCGCI) is defined similarly to CGCI, however a modified backward-in-time selection method is used and a subset of lagged terms enter the unrestricted VAR model. Matlab codes for the computation of RCGCI can be found in https://users.auth.gr/dkugiu/ (accessed on 23 October 2021).
- Partial transfer entropy on non-uniform embedding (PTENUE) measures the direct effect of Y on X in the presence of the “appropriate” past terms of all the variables : , where is the future value of X one step ahead. Matlab codes for the estimation of PTENUE can be found in http://www.lucafaes.net/its.html (accessed on 23 October 2021).
- Partial directed coherence (PDC) is based on VAR models as CGCI; however, it is defined in the frequency domain. For a frequency f, it is given as , where is the Fourier transform of the coefficients of the VAR model of order P and is the component at the position in the matrix. Matlab code can be provided upon request.
- Partial mutual information on mixed embedding (PMIME0) is an extension of the causality measure PMIME, that also contains zero lag terms. For the estimations, the Matlab code was provided by the authors [171].
- Peter Clark momentary conditional independence algorithm (PCMCI+) addresses both lagged as well as contemporaneous causal discovery. Its an extension of PCMCI, which searches for causal parents based on conditional independence tests. The information-theoretic framework is considered here where the conditional mutual information is utilized as a general test statistic. Computations are performed using the python codes in https://github.com/jakobrunge/tigramite (accessed on 23 October 2021).
5.1. Simulation System 1
5.2. Example 2
5.3. Example 3
6. Conclusions
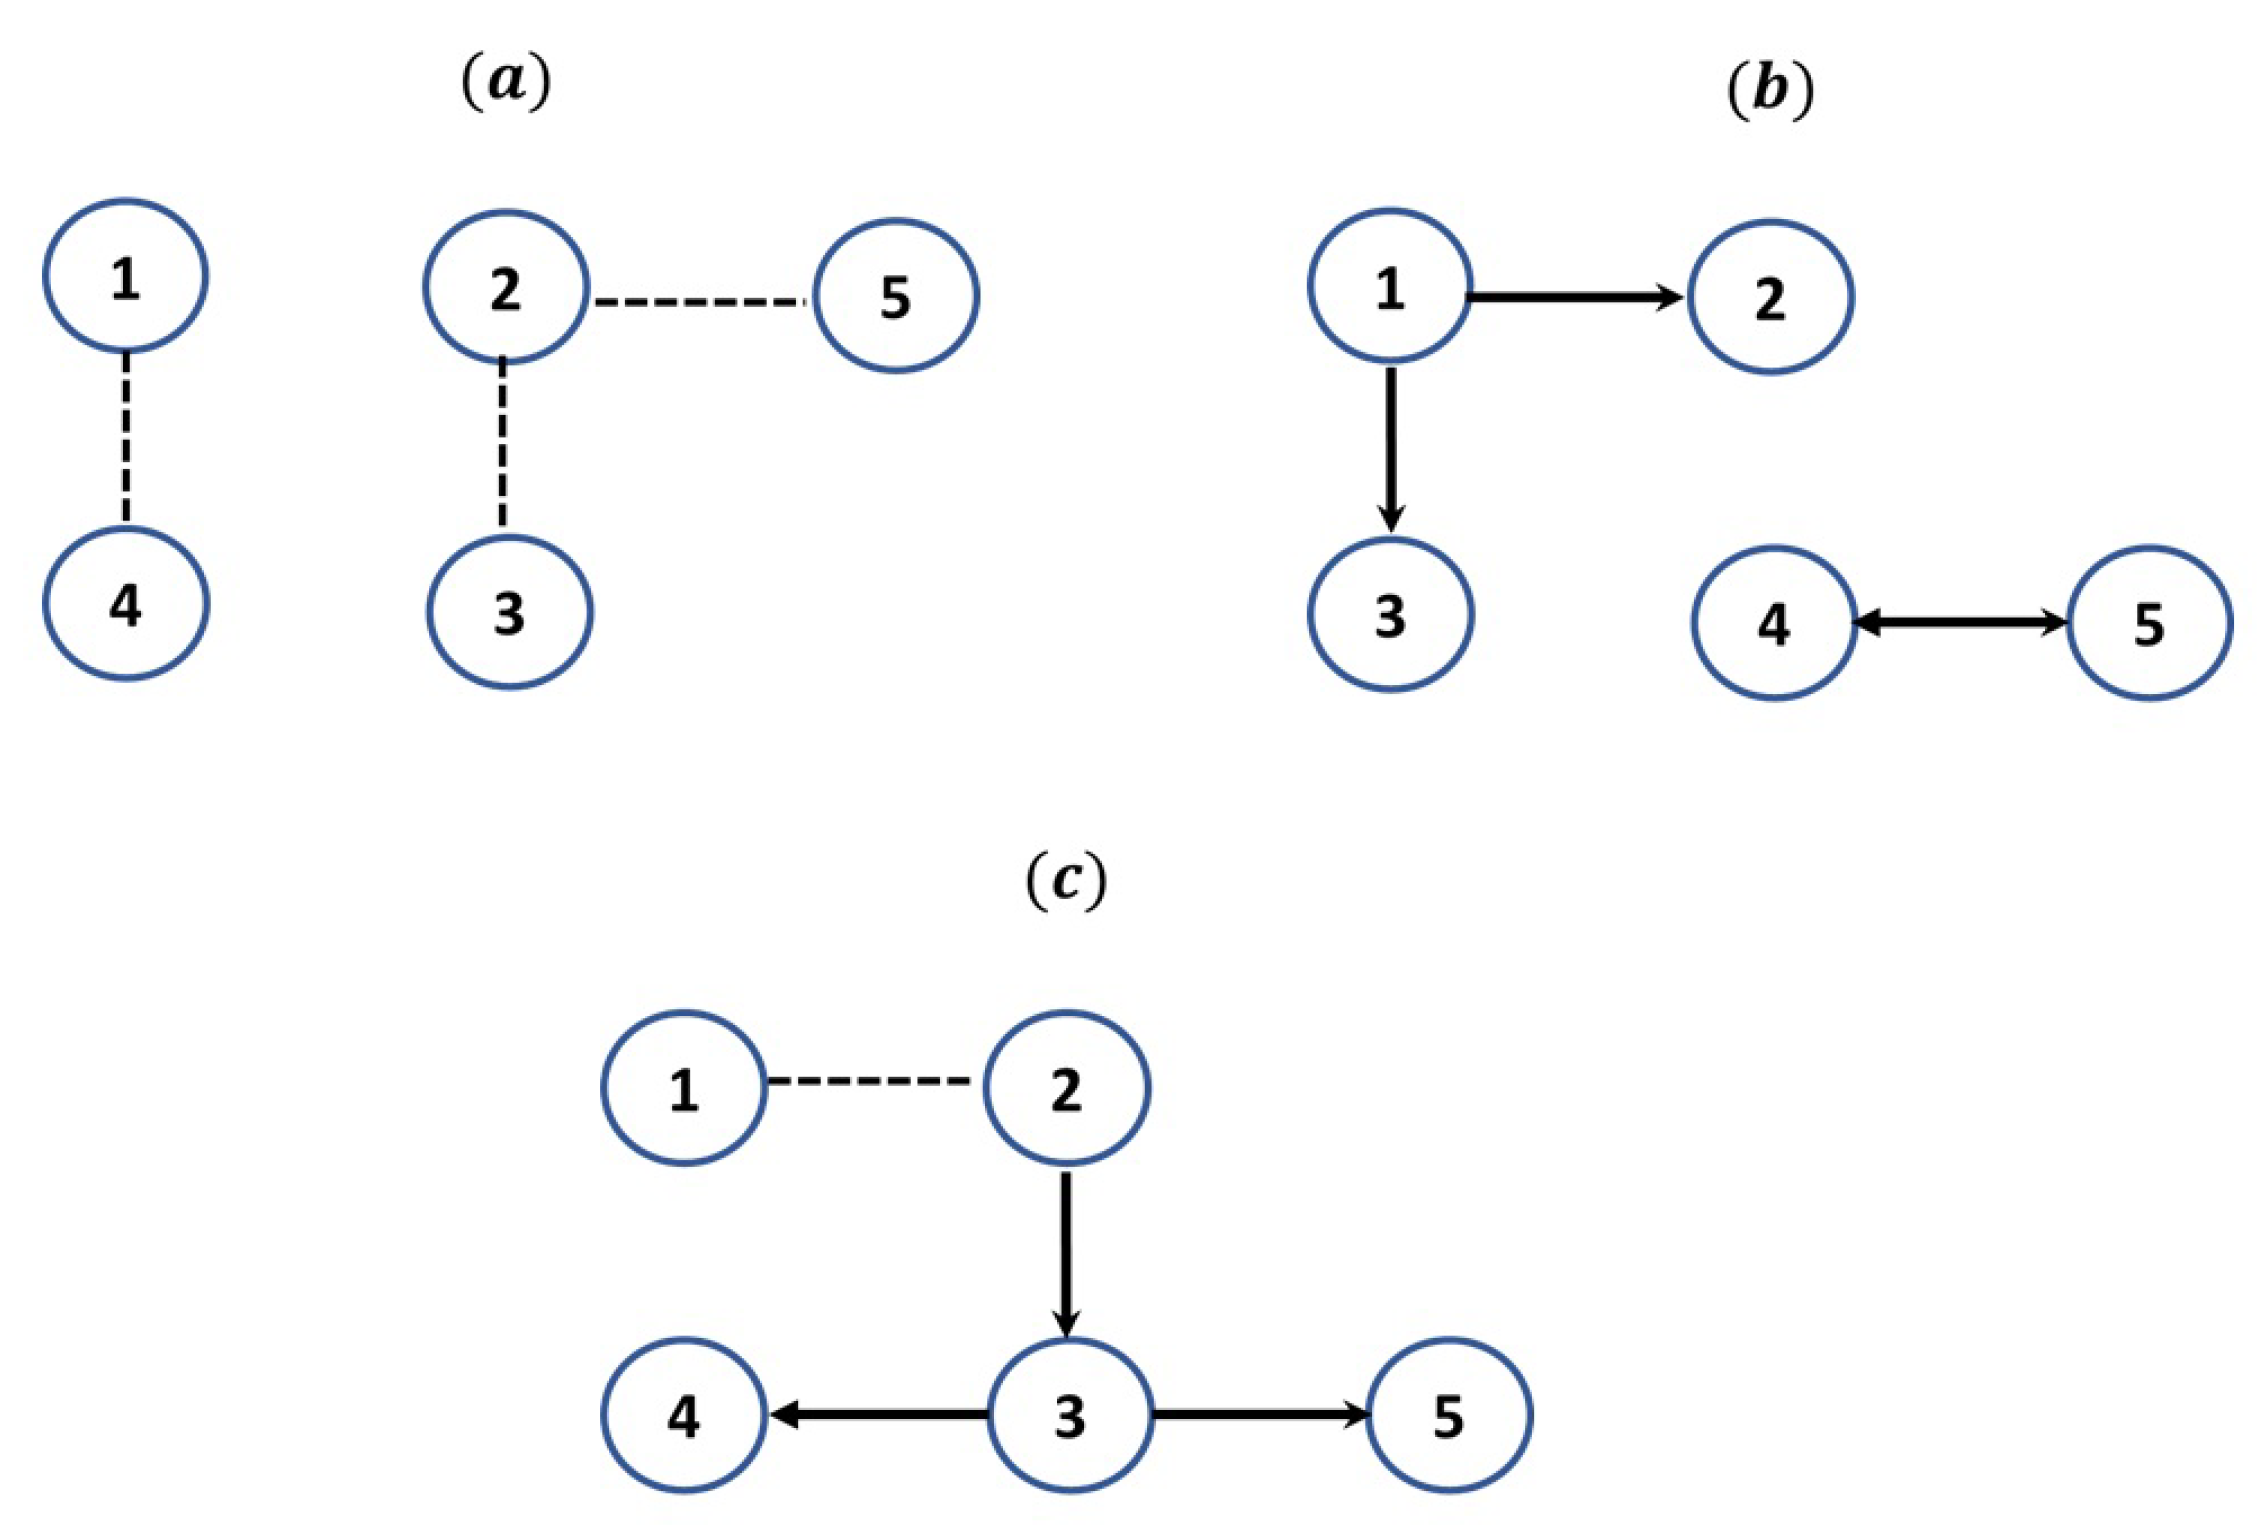
- (a)
- Results suggest the sensitivity of correlation measures when temporal dependencies exist in the data. Correlation measures tend to erroneously indicate contemporaneous relations even though only lagged dependencies exist.
- (b)
- Causality measures do not spuriously indicate causal effects when data present only contemporaneous dependencies. We should note here that the poor performance of PDC for systems 2 and 3 may be due to the fact that significant PDC values are reported comprehensively for all the examined frequencies. In real applications, usually specific frequency bands are selected according to the types of samples [211,212].
- (c)
- Instantaneous causality measures handle contemporaneous and causal effects at the same time. Therefore, it seems to be highly promising for analyzing the connectivity structure of real data.Although both considered instantaneous causality measures seem to have potential and effectively infer the dependencies of most examined systems, they tend to give high percentages of significant causal effects for non-causal pairs of variables. This is a problem that explicitly reduces the effectiveness of the measures. The consideration of different values for the free parameters of the measures, such as the significance level or the number of neighbors for PMIME0, may improve the performance of the measures; however, here, only standard values of free parameters are used at all the examined systems for all causality measures. A possible optimization of the free parameters of the measures is out of the scopes of this work. However, the necessity of an automatic selection of standard free parameters of any connectivity measure in case of real applications should be pointed out.
Funding
Data Availability Statement
Conflicts of Interest
References
- Granger, C. Investigating causal relations by econometric models and cross-spectral methods. Econom. J. Econom. Soc. 1969, 37, 424–438. [Google Scholar] [CrossRef]
- Scher, M.; Sun, M.; Steppe, D.; Guthrie, R.; Sclabassi, R. Comparisons of EEG spectral and correlation measures between healthy term and preterm infants. Pediatr. Neurol. 1994, 10, 104–108. [Google Scholar] [CrossRef]
- Kelly, E.; Lenz, J.; Franaszczuk, P.; Truong, Y. A general statistical framework for frequency-domain analysis of EEG topographic structure. Comput. Biomed. Res. 1997, 30, 129–164. [Google Scholar] [CrossRef] [Green Version]
- Precup, O.; Iori, G. A comparison of high-frequency cross-correlation measures. Phys. A Stat. Mech. Its Appl. 2004, 344, 252–256. [Google Scholar] [CrossRef] [Green Version]
- Bolboaca, S.D.; Jäntschi, L. Pearson versus Spearman, Kendall’s tau correlation analysis on structure-activity relationships of biologic active compounds. Leonardo J. Sci. 2006, 5, 179–200. [Google Scholar]
- Song, L.; Langfelder, P.; Horvath, S. Comparison of co-expression measures: Mutual information, correlation, and model based indices. BMC Bioinform. 2012, 13, 328. [Google Scholar] [CrossRef] [PubMed] [Green Version]
- Cutts, C.; Eglen, S. Detecting pairwise correlations in spike trains: An objective comparison of methods and application to the study of retinal waves. J. Neurosci. 2014, 34, 14288–14303. [Google Scholar] [CrossRef] [Green Version]
- Gencaga, D.; Malakar, N.; Lary, D. Survey on the estimation of mutual information methods as a measure of dependency versus correlation analysis. AIP Conf. Proc. 2014, 1636, 80–87. [Google Scholar]
- Wang, Y.; Li, Y.; Cao, H.; Xiong, M.; Shugart, Y.Y.; Jin, L. Efficient test for nonlinear dependence of two continuous variables. BMC Bioinform. 2015, 16, 260. [Google Scholar] [CrossRef] [Green Version]
- Skotarczak, E.; Dobek, A.; Moliński, K. Comparison of some correlation measures for continuous and categorical data. Biom. Lett. 2019, 56, 253–261. [Google Scholar] [CrossRef] [Green Version]
- Ombao, H.; Pinto, M. Spectral dependence. arXiv 2021, arXiv:2103.17240. [Google Scholar]
- Mormann, F.; Lehnertz, K.; David, P.; Elger, C. Mean phase coherence as a measure for phase synchronization and its application to the EEG of epilepsy patients. Phys. D Nonlinear Phenom. 2000, 144, 358–369. [Google Scholar] [CrossRef]
- Quiroga, R.; Kreuz, T.; Grassberger, P. Event synchronization: A simple and fast method to measure synchronicity and time delay patterns. Phys. Rev. E 2002, 66, 041904. [Google Scholar] [CrossRef] [PubMed] [Green Version]
- Guevara, R.; Velazquez, J.; Nenadovic, V.; Wennberg, R.; Senjanović, G.; Dominguez, L. Phase synchronization measurements using electroencephalographic recordings. Neuroinformatics 2005, 3, 301–313. [Google Scholar] [CrossRef]
- Liang, Z.; Bai, Y.; Ren, Y.; Li, X. Synchronization measures in EEG signals. In Signal Processing in Neuroscience; Springer: Singapore, 2016; pp. 167–202. [Google Scholar]
- Yoshinaga, K.; Matsuhashi, M.; Mima, T.; Fukuyama, H.; Takahashi, R.; Hanakawa, T.; Ikeda, A. Comparison of phase synchronization measures for identifying stimulus-induced functional connectivity in human magnetoencephalographic and simulated data. Front. Neurosci. 2020, 14, 648. [Google Scholar] [CrossRef]
- Honari, H.; Choe, A.; Lindquist, M. Evaluating phase synchronization methods in fMRI: A comparison study and new approaches. NeuroImage 2021, 228, 117704. [Google Scholar] [CrossRef] [PubMed]
- Ostermark, R.; Aaltonen, J. Comparison of univariate and multivariate Granger causality in international asset pricing. Evidence from Finnish and Japanese financial economies. Appl. Financ. Econ. 1999, 9, 155–165. [Google Scholar] [CrossRef]
- Nolte, G.; Ziehe, A.; Krämer, N.; Popescu, F.; Müller, K.R. Comparison of Granger causality and phase slope index. Causality Object. Assess. 2010, 6, 267–276. [Google Scholar]
- Florin, E.; Gross, J.; Pfeifer, J.; Fink, G.; Timmermann, L. Reliability of multivariate causality measures for neural data. J. Neurosci. Methods 2011, 198, 344–358. [Google Scholar] [CrossRef]
- Wu, M.H.; Frye, R.; Zouridakis, G. A comparison of multivariate causality based measures of effective connectivity. Comput. Biol. Med. 2011, 41, 1132–1141. [Google Scholar] [CrossRef]
- Fasoula, A.; Attal, Y.; Schwartz, D. Comparative performance evaluation of data-driven causality measures applied to brain networks. J. Neurosci. Methods 2013, 215, 170–189. [Google Scholar] [CrossRef] [PubMed]
- Zaremba, A.; Aste, T. Measures of causality in complex datasets with application to financial data. Entropy 2014, 16, 2309–2349. [Google Scholar] [CrossRef] [Green Version]
- Siggiridou, E.; Kimiskidis, V.; Kugiumtzis, D. Dimension reduction of frequency-based direct Granger causality measures on short time series. J. Neurosci. Methods 2017, 289, 64–74. [Google Scholar] [CrossRef]
- Siggiridou, E.; Koutlis, C.; Tsimpiris, A.; Kugiumtzis, D. Evaluation of Granger causality measures for constructing networks from multivariate time series. Entropy 2019, 21, 1080. [Google Scholar] [CrossRef] [Green Version]
- Papana, A.; Siggiridou, E.; Kugiumtzis, D. Detecting direct causality in multivariate time series: A comparative study. Commun. Nonlinear Sci. Numer. Simul. 2021, 99, 105797. [Google Scholar] [CrossRef]
- Cartwright, P.; Kamerschen, D.; Huang, M.Y. Price correlation and Granger causality tests for market definition. Rev. Ind. Organ. 1989, 4, 79–98. [Google Scholar] [CrossRef]
- Beck, T.; Levine, R. Stock Markets, Banks, and Growth: Correlation or Causality? World Bank Publications: Washington, VA, USA, 2001; Volume 2670. [Google Scholar]
- Billio, M.; Getmansky, M.; Lo, A.; Pelizzon, L. Econometric measures of connectedness and systemic risk in the finance and insurance sectors. J. Financ. Econ. 2012, 104, 535–559. [Google Scholar] [CrossRef]
- Ateş, E.; Güran, A. Pearson correlation and Granger causality analysis of Twitter sentiments and the daily changes in Bist30 index returns. J. Fac. Eng. Archit. Gazi Univ. 2021, 36, 1687–1701. [Google Scholar]
- Kozak, M. What is strong correlation? Teach. Stat. 2009, 31, 85–86. [Google Scholar] [CrossRef]
- Aggarwal, R.; Ranganathan, P. Common pitfalls in statistical analysis: The use of correlation techniques. Perspect. Clin. Res. 2016, 7, 187. [Google Scholar]
- Armstrong, R. Should Pearson’s correlation coefficient be avoided? Ophthalmic Physiol. Opt. 2019, 39, 316–327. [Google Scholar] [CrossRef] [PubMed] [Green Version]
- Saccenti, E.; Hendriks, M.; Smilde, A. Corruption of the Pearson correlation coefficient by measurement error and its estimation, bias, and correction under different error models. Sci. Rep. 2020, 10, 438. [Google Scholar] [CrossRef] [PubMed] [Green Version]
- Janse, R.; Hoekstra, T.; Jager, K.; Zoccali, C.; Tripepi, G.; Dekker, F.; van Diepen, M. Conducting correlation analysis: Important limitations and pitfalls. Clin. Kidney J. 2021, 14, 2332–2337. [Google Scholar] [CrossRef] [PubMed]
- Nalatore, H.; Ding, M.; Rangarajan, G. Mitigating the effects of measurement noise on Granger causality. Phys. Rev. E 2007, 75, 031123. [Google Scholar] [CrossRef] [Green Version]
- Ramb, R.; Eichler, M.; Ing, A.; Thiel, M.; Weiller, C.; Grebogi, C.; Schwarzbauer, C.; Timmer, J.; Schelter, B. The impact of latent confounders in directed network analysis in neuroscience. Philos. Trans. R. Soc. A Math. Phys. Eng. Sci. 2013, 371, 20110612. [Google Scholar] [CrossRef] [Green Version]
- Bastos, A.; Schoffelen, J.M. A tutorial review of functional connectivity analysis methods and their interpretational pitfalls. Front. Syst. Neurosci. 2016, 9, 175. [Google Scholar] [CrossRef] [Green Version]
- Trongnetrpunya, A.; Nandi, B.; Kang, D.; Kocsis, B.; Schroeder, C.; Ding, M. Assessing granger causality in electrophysiological data: Removing the adverse effects of common signals via bipolar derivations. Front. Syst. Neurosci. 2016, 9, 189. [Google Scholar] [CrossRef] [Green Version]
- Antonacci, Y.; Astolfi, L.; Faes, L. Testing different methodologies for Granger causality estimation: A simulation study. In Proceedings of the 28th European Signal Processing Conference (EUSIPCO), Amsterdam, The Netherlands, 24–28 August 2021; pp. 940–944. [Google Scholar]
- Koutlis, C.; Kugiumtzis, D. The effect of a hidden source on the estimation of connectivity networks from multivariate time series. Entropy 2021, 23, 208. [Google Scholar] [CrossRef]
- Moraffah, R.; Sheth, P.; Karami, M.; Bhattacharya, A.; Wang, Q.; Tahir, A.; Raglin, A.; Liu, H. Causal inference for time series analysis: Problems, methods and evaluation. arXiv 2021, arXiv:2102.05829. [Google Scholar] [CrossRef]
- Pearson, K., VII. Note on regression and inheritance in the case of two parents. Proc. R. Soc. Lond. 1895, 58, 240–242. [Google Scholar]
- Spearman, C. The proof and measurement of association between two things. J. Psychol. 1094, 15, 72–101. [Google Scholar] [CrossRef]
- Kendall, M. Rank Correlation Methods, 2nd ed.; Hafner Publishing Co.: New York, NY, USA, 1955. [Google Scholar]
- Hoeffding, W. A non-parametric test of independence. Ann. Math. Stat. 1948, 19, 546–557. [Google Scholar] [CrossRef]
- Gaißer, S.; Ruppert, M.; Schmid, F. A multivariate version of Hoeffding’s phi-square. J. Multivar. Anal. 2010, 101, 2571–2586. [Google Scholar] [CrossRef] [Green Version]
- Rao, C. Linear Statistical Inference and Its Applications; Wiley: New York, NY, USA, 1973; Volume 2. [Google Scholar]
- Székely, G.; Rizzo, M.; Bakirov, N. Measuring and testing dependence by correlation of distances. Ann. Stat. 2007, 35, 2769–2794. [Google Scholar] [CrossRef]
- Székely, G.; Rizzo, M. Brownian distance covariance. Ann. Appl. Stat. 2009, 3, 1236–1265. [Google Scholar] [CrossRef] [Green Version]
- Székely, G.; Rizzo, M. Partial distance correlation with methods for dissimilarities. Ann. Stat. 2014, 42, 2382–2412. [Google Scholar] [CrossRef]
- Yule, G. On the association of attributes in statistics: With illustrations from the material of the childhood society &c. Philos. Trans. R. Soc. Lond. Ser. A 1900, 194, 257–319. [Google Scholar]
- Yule, G. On the methods of measuring association between two attributes. J. R. Stat. Soc. 1912, 75, 579–652. [Google Scholar] [CrossRef] [Green Version]
- Digby, P. Approximating the tetrachoric correlation coefficient. Biometrics 1983, 39, 753–757. [Google Scholar] [CrossRef]
- Bonett, D.; Price, R. Statistical inference for generalized Yule coefficients in 2 × 2 contingency tables. Sociol. Methods Res. 2007, 35, 429–446. [Google Scholar] [CrossRef]
- Lopez-Paz, D.; Hennig, P.; Schölkopf, B. The randomized dependence coefficient. Adv. Neural Inf. Process. Syst. 2013, 26, 1–9. [Google Scholar]
- Ding, A.; Li, Y. Copula correlation: An equitable dependence measure and extension of Pearson’s correlation. arXiv 2013, arXiv:1312.7214. [Google Scholar]
- Wen, F.; Liu, Z. A copula-based correlation measure and its application in Chinese stock market. Int. J. Inf. Technol. Decis. Mak. 2009, 8, 787–801. [Google Scholar] [CrossRef]
- Schmid, F.; Schmidt, R.; Blumentritt, T.; Gaißer, S.; Ruppert, M. Copula-based measures of multivariate association. In Copula Theory and Its Applications; Springer: Berlin/Heidelberg, Germany, 2010; pp. 209–236. [Google Scholar]
- Kim, J.M.; Jung, Y.S.; Choi, T.; Sungur, E. Partial correlation with copula modeling. Comput. Stat. Data Anal. 2011, 55, 1357–1366. [Google Scholar] [CrossRef]
- Póczos, B.; Ghahramani, Z.; Schneider, J. Copula-based kernel dependency measures. arXiv 2012, arXiv:1206.4682. [Google Scholar]
- García-Gómez, C.; Pérez, A.; Prieto-Alaiz, M. Copula-based analysis of multivariate dependence patterns between dimensions of poverty in Europe. Rev. Income Wealth 2021, 67, 165–195. [Google Scholar] [CrossRef]
- Shih, J.H.; Emura, T. On the copula correlation ratio and its generalization. J. Multivar. Anal. 2021, 182, 104708. [Google Scholar] [CrossRef]
- Wang, Q.; Shen, Y.; Zhang, J. A nonlinear correlation measure for multivariable data set. Phys. D Nonlinear Phenom. 2005, 200, 287–295. [Google Scholar] [CrossRef]
- Fraser, A.; Swinney, H. Independent coordinates for strange attractors from mutual information. Phys. Rev. A 1986, 33, 1134. [Google Scholar] [CrossRef]
- Cover, T.; Thomas, J. Gambling and data compression. In Elements of Information Theory; John Wiley & Sons, Inc.: Hoboken, NJ, USA, 1991; pp. 125–140. [Google Scholar] [CrossRef]
- Contreras-Reyes, J.E. Mutual information matrix based on asymmetric Shannon entropy for nonlinear interactions of time series. Nonlinear Dyn. 2021, 104, 3913–3924. [Google Scholar] [CrossRef]
- Eshima, N.; Tabata, M. Entropy for measuring predictive power of generalized linear models. Stat. Probab. Lett. 2007, 77, 588–593. [Google Scholar] [CrossRef]
- Eshima, N.; Tabata, M. Entropy coefficient of determination for generalized linear models. Comput. Stat. Data Anal. 2010, 54, 1381–1389. [Google Scholar] [CrossRef]
- Reshef, D.; Reshef, Y.; Finucane, H.; Grossman, S.; McVean, G.; Turnbaugh, P.; Lander, E.; Mitzenmacher, M.; Sabeti, P. Detecting novel associations in large data sets. Science 2011, 334, 1518–1524. [Google Scholar] [CrossRef] [PubMed] [Green Version]
- Qiuheng, T.; Jiang, H.; Yiming, D. Model selection method based on maximal information coefficient of residuals. Acta Math. Sci. 2014, 34, 579–592. [Google Scholar]
- Wilmer, A.; de Lussanet, M.; Lappe, M. Time-delayed mutual information of the phase as a measure of functional connectivity. PLoS ONE 2012, 7, e44633. [Google Scholar] [CrossRef] [PubMed]
- Nunez, P. Electric Fields of the Brain: The Neurophysics of EEG; Oxford University Press: Oxford, OH, USA, 2006. [Google Scholar]
- Bendat, J.; Piersol, A. Random Data; Wiley-Interscience: Hoboken, NJ, USA, 1986. [Google Scholar]
- Rosenberg, J.; Halliday, D.; Breeze, P.; Conway, B. Identification of patterns of neuronal connectivity—Partial spectra, partial coherence, and neuronal interactions. J. Neurosci. Methods 1998, 83, 57–72. [Google Scholar] [CrossRef]
- Makhtar, S.; Halliday, D.; Senik, M.; Mason, R. Multivariate partial coherence analysis for identification of neuronal connectivity from multiple electrode array recordings. In Proceedings of the IEEE Conference on Biomedical Engineering and Sciences (IECBES), Kuala Lumpur, Malaysia, 8–10 December 2014; pp. 77–82. [Google Scholar]
- Rosenblum, M.; Pikovsky, A.; Kurths, J. Phase synchronization of chaotic oscillators. Phys. Rev. Lett. 1996, 76, 1804. [Google Scholar] [CrossRef]
- Lachaux, J.P.; Rodriguez, E.; Martinerie, J.; Varela, F. Measuring phase synchrony in brain signals. Hum. Brain Mapp. 1999, 8, 194–208. [Google Scholar] [CrossRef] [Green Version]
- Kuramoto, Y. Cooperative dynamics of oscillator communitya study based on lattice of rings. Prog. Theor. Phys. Suppl. 1984, 79, 223–240. [Google Scholar] [CrossRef]
- Eckmann, J. Recurrence plots of dynamical systems. Europhys. Lett. 1987, 5, 973–977. [Google Scholar] [CrossRef] [Green Version]
- Zbilut, J.; Giuliani, A.; Webber, C., Jr. Detecting deterministic signals in exceptionally noisy environments using cross-recurrence quantification. Phys. Lett. A 1998, 246, 122–128. [Google Scholar] [CrossRef]
- Marwan, N.; Kurths, J. Nonlinear analysis of bivariate data with cross recurrence plots. Phys. Lett. A 2002, 302, 299–307. [Google Scholar] [CrossRef] [Green Version]
- Zbilut, J.; Webber, C., Jr. Embeddings and delays as derived from quantification of recurrence plots. Phys. Lett. A 1992, 171, 199–203. [Google Scholar] [CrossRef]
- Webber, C., Jr.; Zbilut, J. Dynamical assessment of physiological systems and states using recurrence plot strategies. J. Appl. Physiol. 1994, 76, 965–973. [Google Scholar] [CrossRef]
- Dobrushin, R. General formulation of Shannon’s main theorem in information theory. Am. Math. Soc. Transl. 1963, 33, 323–438. [Google Scholar]
- Wyner, A. A definition of conditional mutual information for arbitrary ensembles. Inf. Control. 1978, 38, 51–59. [Google Scholar] [CrossRef] [Green Version]
- Cover, T.; Thomas, J. Elements of Information Theory, 2nd ed.; John Wiley & Sons: Hoboken, NJ, USA, 2012. [Google Scholar]
- Wilcox, R. Introduction to Robust Estimation and Hypothesis Testing, 3rd ed.; Academic Press: Cambridge, MA, USA, 2011. [Google Scholar]
- De La Fuente, A.; Bing, N.; Hoeschele, I.; Mendes, P. Discovery of meaningful associations in genomic data using partial correlation coefficients. Bioinformatics 2004, 20, 3565–3574. [Google Scholar] [CrossRef] [PubMed] [Green Version]
- Fujita, A.; Sato, J.R.; Demasi, M.; Sogayar, M.; Ferreira, C.; Miyano, S. Comparing Pearson, Spearman and Hoeffding’s D measure for gene expression association analysis. J. Bioinform. Comput. Biol. 2009, 7, 663–684. [Google Scholar] [CrossRef]
- Kobayashi, H.; Ujike, H.; Hasegawa, J.; Yamamoto, M.; Kanzaki, A.; Sora, I. Correlation of tau gene polymorphism with age at onset of Parkinson’s disease. Neurosci. Lett. 2006, 405, 202–206. [Google Scholar] [CrossRef] [PubMed]
- Sleeman, R.; Van Wettum, A.; Trampert, J. Three-channel correlation analysis: A new technique to measure instrumental noise of digitizers and seismic sensors. Bull. Seismol. Soc. Am. 2006, 96, 258–271. [Google Scholar] [CrossRef]
- Benesty, J.; Chen, J.; Huang, Y. On the importance of the Pearson correlation coefficient in noise reduction. IEEE Trans. Audio Speech Lang. Process. 2008, 16, 757–765. [Google Scholar] [CrossRef]
- Huang, H.C.; Zheng, S.; Zhao, Z. Application of Pearson correlation coefficient (PCC) and Kolmogorov-Smirnov distance (KSD) metrics to identify disease-specific biomarker genes. BMC Bioinform. 2010, 11, P23. [Google Scholar] [CrossRef] [Green Version]
- Cahill, N. Normalized measures of mutual information with general definitions of entropy for multimodal image registration. In International Workshop on Biomedical Image Registration; Springer: Berlin/Heidelberg, Germany, 2010; pp. 258–268. [Google Scholar]
- Edirisinghe, C.; Zhou, W. Portfolio optimization using rank correlation. In Encyclopedia of Business Analytics and Optimization; IGI Global: Hershey, PA, USA, 2014; pp. 1866–1879. [Google Scholar]
- Haluszczynski, A.; Laut, I.; Modest, H.; Räth, C. Linear and nonlinear market correlations: Characterizing financial crises and portfolio optimization. Phys. Rev. E 2017, 96, 062315. [Google Scholar] [CrossRef] [Green Version]
- Tai-Yuen, H. Rank correlation analysis of investment decision for small investors in the Hong Kong derivatives markets. J. Econ. Bibliogr. 2015, 2, 106–116. [Google Scholar]
- Che, Y.; Jia, Y.; Tang, Z.; Lan, F. Application of Pearson correlation coefficient in wind power combination prediction. Guangxi Electr. Power 2016, 3, 50–53. [Google Scholar]
- Roverato, A.; Castelo, R. The networked partial correlation and its application to the analysis of genetic interactions. J. R. Stat. Soc. Ser. C Appl. Stat. 2017, 66, 647–665. [Google Scholar] [CrossRef] [Green Version]
- Jayaweera, C.; Aziz, N. Reliability of principal component analysis and Pearson correlation coefficient, for application in artificial neural network model development, for water treatment plants. IOP Conf. Ser. Mater. Sci. Eng. 2018, 458, 012076. [Google Scholar] [CrossRef]
- Podhorodecka, K. Tourism economies and islands’ resilience to the global financial crisis. Isl. Stud. J. 2018, 13, 163–184. [Google Scholar] [CrossRef]
- Farahmand, S.; Sobayo, T.; Mogul, D. Noise-assisted multivariate EMD-based mean-phase coherence analysis to evaluate phase-synchrony dynamics in epilepsy patients. IEEE Trans. Neural Syst. Rehabil. Eng. 2018, 26, 2270–2279. [Google Scholar] [CrossRef]
- Fiedor, P. Networks in financial markets based on the mutual information rate. Phys. Rev. E 2014, 89, 052801. [Google Scholar] [CrossRef] [Green Version]
- Millington, T.; Niranjan, M. Quantifying influence in financial markets via partial correlation network inference. In Proceedings of the 11th IEEE International Symposium on Image and Signal Processing and Analysis (ISPA), Dubrovnik, Croatia, 23–25 September 2019; pp. 306–311. [Google Scholar]
- Zhao, G.; Zhang, Y.; Zhang, G.; Zhang, D.; Liu, Y.J. Multi-target positive emotion recognition from EEG signals. IEEE Trans. Affect. Comput. 2020, 99, 1949–3045. [Google Scholar] [CrossRef]
- Kumar, G.; Kumar, R. A correlation study between meteorological parameters and COVID-19 pandemic in Mumbai, India. Diabetes Metab. Syndr. Clin. Res. Rev. 2020, 14, 1735–1742. [Google Scholar] [CrossRef]
- Maguluri, L.; Ragupathy, R. An efficient stock market trend prediction using the real-time stock technical data and stock social media data. Int. J. Intell. Eng. Syst. 2020, 13, 316–332. [Google Scholar] [CrossRef]
- Thakkar, A.; Patel, D.; Shah, P. Pearson correlation coefficient-based performance enhancement of Vanilla neural network for stock trend prediction. Neural Comput. Appl. 2021, 33, 16985–17000. [Google Scholar] [CrossRef]
- Wiener, N. What is information theory. IRE Trans. Inf. Theory 1956, 2, 48. [Google Scholar] [CrossRef]
- Geweke, J. Measurement of linear dependence and feedback between multiple time series. J. Am. Stat. Assoc. 1982, 77, 304–313. [Google Scholar] [CrossRef]
- Guo, S.; Seth, A.; Kendrick, K.; Zhou, C.; Feng, J. Partial Granger causality—Eliminating exogenous inputs and latent variables. J. Neurosci. Methods 2008, 172, 79–93. [Google Scholar] [CrossRef] [PubMed] [Green Version]
- Ancona, N.; Marinazzo, D.; Stramaglia, S. Radial basis function approach to nonlinear Granger causality of time series. Phys. Rev. E 2004, 70, 056221. [Google Scholar] [CrossRef] [Green Version]
- Marinazzo, D.; Pellicoro, M.; Stramaglia, S. Kernel-Granger causality and the analysis of dynamical networks. Phys. Rev. E 2008, 77, 056215. [Google Scholar] [CrossRef] [Green Version]
- Zhao, Y.; Billings, S.; Wei, H.; He, F.; Sarrigiannis, P. A new NARX-based Granger linear and nonlinear casual influence detection method with applications to EEG data. J. Neurosci. Methods 2013, 212, 79–86. [Google Scholar] [CrossRef]
- Baek, E.; Brock, W. A General Test for Granger Causality: Bivariate Model; Working Paper; Iowa State University and University of Wisconsin: Madison, WI, USA, 1992. [Google Scholar]
- Hiemstra, C.; Jones, J. Testing for linear and nonlinear Granger causality in the stock price-volume relation. J. Financ. 1994, 49, 1639–1664. [Google Scholar]
- Diks, C.; Panchenko, V. A new statistic and practical guidelines for nonparametric Granger causality testing. J. Econ. Dyn. Control. 2006, 30, 1647–1669. [Google Scholar] [CrossRef] [Green Version]
- Bai, Z.; Wong, W.K.; Zhang, B. Multivariate linear and nonlinear causality tests. Math. Comput. Simul. 2010, 81, 5–17. [Google Scholar] [CrossRef] [Green Version]
- Schreiber, T. Measuring information transfer. Phys. Rev. Lett. 2000, 85, 461. [Google Scholar] [CrossRef] [Green Version]
- Vakorin, V.; Krakovska, O.; McIntosh, A. Confounding effects of indirect connections on causality estimation. J. Neurosci. Methods 2009, 184, 152–160. [Google Scholar] [CrossRef] [PubMed]
- Papana, A.; Kugiumtzis, D.; Larsson, P. Detection of direct causal effects and application to epileptic electroencephalogram analysis. Int. J. Bifurc. Chaos 2012, 22, 1250222. [Google Scholar] [CrossRef]
- Montalto, A.; Faes, L.; Marinazzo, D. MuTE: A MATLAB toolbox to compare established and novel estimators of the multivariate transfer entropy. PLoS ONE 2014, 9, e109462. [Google Scholar]
- Vlachos, I.; Kugiumtzis, D. Nonuniform state-space reconstruction and coupling detection. Phys. Rev. E 2010, 82, 016207. [Google Scholar] [CrossRef] [PubMed] [Green Version]
- Kugiumtzis, D. Direct-coupling information measure from nonuniform embedding. Phys. Rev. E 2013, 87, 062918. [Google Scholar] [CrossRef] [Green Version]
- Zhang, J. Low-dimensional approximation searching strategy for transfer entropy from non-uniform embedding. PLoS ONE 2018, 13, e0194382. [Google Scholar] [CrossRef] [PubMed] [Green Version]
- Jia, Z.; Lin, Y.; Jiao, Z.; Ma, Y.; Wang, J. Detecting causality in multivariate time series via non-uniform embedding. Entropy 2019, 21, 1233. [Google Scholar] [CrossRef] [Green Version]
- Quiroga, R.; Kraskov, A.; Kreuz, T.; Grassberger, P. Performance of different synchronization measures in real data: A case study on electroencephalographic signals. Phys. Rev. E 2002, 65, 041903. [Google Scholar] [CrossRef] [PubMed] [Green Version]
- Arnhold, J.; Grassberger, P.; Lehnertz, K.; Elger, C. A robust method for detecting interdependences: Application to intracranially recorded EEG. Phys. D Nonlinear Phenom. 1999, 134, 419–430. [Google Scholar] [CrossRef] [Green Version]
- Quian Quiroga, R.; Arnhold, J.; Grassberger, P. Learning driver-response relationships from synchronization patterns. Phys. Rev. E 2000, 61, 5142. [Google Scholar] [CrossRef] [Green Version]
- Breakspear, M.; Terry, J. Topographic organization of nonlinear interdependence in multichannel human EEG. NeuroImage 2002, 16, 822–835. [Google Scholar] [CrossRef] [PubMed]
- Breakspear, M.; Terry, J. Nonlinear interdependence in neural systems: Motivation, theory, and relevance. Int. J. Neurosci. 2002, 112, 1263–1284. [Google Scholar] [CrossRef]
- Andrzejak, R.; Kraskov, A.; Stögbauer, H.; Mormann, F.; Kreuz, T. Bivariate surrogate techniques: Necessity, strengths, and caveats. Phys. Rev. E 2003, 68, 066202. [Google Scholar] [CrossRef] [PubMed] [Green Version]
- Bhattacharya, J.; Pereda, E.; Petsche, H. Effective detection of coupling in short and noisy bivariate data. IEEE Trans. Syst. Man Cybern. Part B Cybern. 2003, 33, 85–95. [Google Scholar] [CrossRef]
- Chen, Y.; Rangarajan, G.; Feng, J.; Ding, M. Analyzing multiple nonlinear time series with extended Granger causality. Phys. Lett. A 2004, 324, 26–35. [Google Scholar] [CrossRef] [Green Version]
- Sugihara, G.; May, R.; Ye, H.; Hsieh, C.H.; Deyle, E.; Fogarty, M.; Munch, S. Detecting causality in complex ecosystems. Science 2012, 338, 496–500. [Google Scholar] [CrossRef]
- Pearl, J. Probabilistic Reasoning in Intelligent Systems: Networks of Plausible Inference; Morgan Kaufmann: Burlington, MA, USA, 1988. [Google Scholar]
- Spirtes, P. Detecting causal relations in the presence of unmeasured variables. In Uncertainty Proceedings 1991; Elsevier: Amsterdam, The Netherlands, 1991; pp. 392–397. [Google Scholar]
- Spirtes, P.; Glymour, C.; Schienes, R. Causation Prediction and Search: Springer Lecture Notes in Statistics, 1st ed.; Springer: Berlin, Germany, 1993. [Google Scholar]
- Spirtes, P.; Glymour, C.; Scheines, R.; Heckerman, D. Causation, Prediction, and Search; MIT Press: Cambridge, MA, USA, 2000. [Google Scholar]
- Pearl, J. Causality: Models, Reasoning and Inference; Cambridge University Press: Cambridge, UK, 2000; p. 400. [Google Scholar]
- Shimizu, S.; Hoyer, P.; Hyvärinen, A.; Kerminen, A.; Jordan, M. A linear non-Gaussian acyclic model for causal discovery. J. Mach. Learn. Res. 2006, 7, 2003–2030. [Google Scholar]
- Hoyer, P.; Janzing, D.; Mooij, J.; Peters, J.; Schölkopf, B. Nonlinear causal discovery with additive noise models. In Proceedings of the Twenty-Second Annual Conference on Neural Information Processing Systems, Vancouver, BC, Canada, 8–11 December 2008; Volume 21, pp. 689–696. [Google Scholar]
- Koller, D.; Friedman, N. Probabilistic Graphical Models: Principles and Techniques, 1st ed.; MIT Press: Cambridge, MA, USA, 2009. [Google Scholar]
- Entner, D.; Hoyer, P. On causal discovery from time series data using FCI. In Probabilistic Graphical Models; MIT Press: Cambridge, MA, USA, 2010; pp. 121–128. [Google Scholar]
- Runge, J.; Nowack, P.; Kretschmer, M.; Flaxman, S.; Sejdinovic, D. Detecting and quantifying causal associations in large nonlinear time series datasets. Sci. Adv. 2019, 5, eaau4996. [Google Scholar] [CrossRef] [PubMed] [Green Version]
- Kořenek, J.; Hlinka, J. Causal network discovery by iterative conditioning: Comparison of algorithms. Chaos Interdiscip. J. Nonlinear Sci. 2020, 30, 013117. [Google Scholar] [CrossRef] [PubMed] [Green Version]
- Kaminski, M.; Blinowska, K. A new method of the description of the information flow in the brain structures. Biol. Cybern. 1991, 65, 203–210. [Google Scholar] [CrossRef]
- Baccalá, L.; Sameshima, K. Partial directed coherence: A new concept in neural structure determination. Biol. Cybern. 2001, 84, 463–474. [Google Scholar] [CrossRef]
- Korzeniewska, A.; Mańczak, M.; Kamiński, M.; Blinowska, K.; Kasicki, S. Determination of information flow direction among brain structures by a modified directed transfer function (dDTF) method. J. Neurosci. Methods 2003, 125, 195–207. [Google Scholar] [CrossRef]
- Baccala, L.; Sameshima, K.; Takahashi, D. Generalized partial directed coherence. In Proceedings of the 15th International Conference on Digital Signal Processing, Cardiff, UK, 1–4 July 2007; pp. 163–166. [Google Scholar]
- Nolte, G.; Ziehe, A.; Nikulin, V.; Schlögl, A.; Krämer, N.; Brismar, T.; Müller, K.R. Robustly estimating the flow direction of information in complex physical systems. Phys. Rev. Lett. 2008, 100, 234101. [Google Scholar] [CrossRef] [Green Version]
- Breitung, J.; Candelon, B. Testing for short-and long-run causality: A frequency-domain approach. J. Econom. 2006, 132, 363–378. [Google Scholar] [CrossRef]
- Dhamala, M.; Rangarajan, G.; Ding, M. Analyzing information flow in brain networks with nonparametric Granger causality. NeuroImage 2008, 41, 354–362. [Google Scholar] [CrossRef] [Green Version]
- Jachan, M.; Henschel, K.; Nawrath, J.; Schad, A.; Timmer, J.; Schelter, B. Inferring direct directed-information flow from multivariate nonlinear time series. Phys. Rev. E 2009, 80, 011138. [Google Scholar] [CrossRef] [Green Version]
- Omidvarnia, A.; Mesbah, M.; Khlif, M.; O’Toole, J.; Colditz, P.; Boashash, B. Kalman filter-based time-varying cortical connectivity analysis of newborn EEG. In Proceedings of the 2011 Annual International Conference of the IEEE Engineering in Medicine and Biology Society, Boston, MA, USA, 30 August–3 September 2011; pp. 1423–1426. [Google Scholar]
- He, F.; Billings, S.; Wei, H.L.; Sarrigiannis, P. A nonlinear causality measure in the frequency domain: Nonlinear partial directed coherence with applications to EEG. J. Neurosci. Methods 2014, 225, 71–80. [Google Scholar] [CrossRef]
- Lütkepohl, H. New Introduction to Multiple Time Series Analysis; Springer Science & Business Media: Cham, Switzerland, 2005. [Google Scholar]
- Schiatti, L.; Nollo, G.; Rossato, G.; Faes, L. Extended Granger causality: A new tool to identify the structure of physiological networks. Physiol. Meas. 2015, 36, 827. [Google Scholar] [CrossRef]
- Gianetto, Q.; Raïssi, H. Testing instantaneous causality in presence of nonconstant unconditional covariance. J. Bus. Econ. Stat. 2015, 33, 46–53. [Google Scholar] [CrossRef]
- Hyvärinen, A.; Zhang, K.; Shimizu, S.; Hoyer, P. Estimation of a structural vector autoregression model using non-gaussianity. J. Mach. Learn. Res. 2010, 11, 1709–1731. [Google Scholar]
- Peters, J.; Janzing, D.; Schölkopf, B. Causal inference on time series using restricted structural equation models. In Proceedings of the 26th International Conference on Neural Information Processing Systems, Lake Tahoe, NV, USA, 5–10 December 2013; pp. 154–162. [Google Scholar]
- Lopez-Paz, D.; Muandet, K.; Schölkopf, B.; Tolstikhin, I. Towards a learning theory of cause-effect inference. In Proceedings of the International Conference on Machine Learning, Lille, France, 6–11 July 2015; pp. 1452–1461. [Google Scholar]
- Peters, J.; Janzing, D.; Schölkopf, B. Elements of Causal Inference: Foundations and Learning Algorithms; The MIT Press: Cambridge, MA, USA, 2017. [Google Scholar]
- Faes, L.; Erla, S.; Porta, A.; Nollo, G. A framework for assessing frequency domain causality in physiological time series with instantaneous effects. Philos. Trans. R. Soc. A Math. Phys. Eng. Sci. 2013, 371, 20110618. [Google Scholar] [CrossRef] [Green Version]
- Baccalá, L.; Sameshima, K. Frequency domain repercussions of instantaneous Granger causality. Entropy 2021, 23, 1037. [Google Scholar] [CrossRef]
- Rodrigues, J.; Andrade, A. Instantaneous Granger causality with the Hilbert-Huang transform. Int. Sch. Res. Not. 2013, 2013, 374064. [Google Scholar] [CrossRef] [Green Version]
- Faes, L.; Nollo, G. Extended causal modeling to assess partial directed coherence in multiple time series with significant instantaneous interactions. Biol. Cybern. 2010, 103, 387–400. [Google Scholar] [CrossRef] [PubMed]
- Faes, L.; Nollo, G.; Porta, A. Compensated transfer entropy as a tool for reliably estimating information transfer in physiological time series. Entropy 2013, 15, 198–219. [Google Scholar] [CrossRef] [Green Version]
- Gao, W.; Cui, W.; Ye, W. Directed information graphs for the Granger causality of multivariate time series. Phys. A Stat. Mech. Its Appl. 2017, 486, 701–710. [Google Scholar] [CrossRef]
- Koutlis, C.; Kimiskidis, V.; Kugiumtzis, D. Identification of hidden sources by estimating instantaneous causality in high-dimensional biomedical time series. Int. J. Neural Syst. 2019, 29, 1850051. [Google Scholar] [CrossRef]
- Runge, J. Discovering contemporaneous and lagged causal relations in autocorrelated nonlinear time series datasets. In Proceeding of the Conference on Uncertainty in Artificial Intelligence, Toronto, ON, Canada, 3–6 August 2020; pp. 1388–1397. [Google Scholar]
- Gow, D., Jr.; Segawa, J.; Ahlfors, S.; Lin, F.H. Lexical influences on speech perception: A Granger causality analysis of MEG and EEG source estimates. NeuroImage 2008, 43, 614–623. [Google Scholar] [CrossRef] [Green Version]
- Seth, A.; Barrett, A.; Barnett, L. Granger causality analysis in neuroscience and neuroimaging. J. Neurosci. 2015, 35, 3293–3297. [Google Scholar] [CrossRef] [PubMed]
- He, J.; Shang, P. Comparison of transfer entropy methods for financial time series. Phys. A Stat. Mech. Appl. 2017, 482, 772–785. [Google Scholar] [CrossRef]
- Tang, Y.; Xiong, J.; Luo, Y.; Zhang, Y.C. How do the global stock markets Influence one another? Evidence from finance big data and granger causality directed network. Int. J. Electron. Commer. 2019, 23, 85–109. [Google Scholar] [CrossRef] [Green Version]
- Basti, A.; Pizzella, V.; Chella, F.; Romani, G.; Nolte, G.; Marzetti, L. Disclosing large-scale directed functional connections in MEG with the multivariate phase slope index. NeuroImage 2018, 175, 161–175. [Google Scholar] [CrossRef]
- Meng, Q.; Zhang, Y. Discovery of spatial-temporal causal interactions between thermal and methane anomalies associated with the Wenchuan earthquake. Eur. Phys. J. Spec. Top. 2021, 230, 247–261. [Google Scholar] [CrossRef]
- Qu, Y.; Montzka, C.; Vereecken, H. Causation discovery of weather and vegetation condition on global wildfire using the PCMCI Approach. In Proceedings of the 2021 IEEE International Geoscience and Remote Sensing Symposium (IGARSS), Brussels, Belgium, 11–16 July 2021; pp. 8644–8647. [Google Scholar]
- Zhu, J.; Sun, C.; Li, V. An extended spatio-temporal Granger causality model for air quality estimation with heterogeneous urban big data. IEEE Trans. Big Data 2017, 3, 307–319. [Google Scholar] [CrossRef]
- Li, M.; Li, J.; Wan, S.; Chen, H.; Liu, C. Causal identification based on compressive sensing of air pollutants using urban big data. IEEE Access 2020, 8, 109207–109216. [Google Scholar] [CrossRef]
- Erten, E.; Lizier, J.; Piraveenan, M.; Prokopenko, M. Criticality and information dynamics in epidemiological models. Entropy 2017, 19, 194. [Google Scholar] [CrossRef]
- Reich, B.; Yang, S.; Guan, Y.; Giffin, A.; Miller, M.; Rappold, A. A review of spatial causal inference methods for environmental and epidemiological applications. Int. Stat. Rev. 2021, 89, 605–634. [Google Scholar] [CrossRef]
- Embrechts, P.; McNeil, A.; Straumann, D. Correlation and dependence in risk management: Properties and pitfalls. Risk Manag. Value Risk Beyond 2002, 1, 176–223. [Google Scholar]
- Faes, L.; Erla, S.; Nollo, G. Measuring connectivity in linear multivariate processes: Definitions, interpretation, and practical analysis. Comput. Math. Methods Med. 2012, 2012, 140513. [Google Scholar] [CrossRef] [PubMed]
- Florin, E.; Pfeifer, J. Statistical pitfalls in the comparison of multivariate causality measures for effective causality. Comput. Biol. Med. 2013, 43, 131–134. [Google Scholar] [CrossRef] [PubMed]
- Frye, R. A lack of statistical pitfalls in the comparison of multivariate causality measures for effective causality. Comput. Biol. Med. 2013, 43, 962–965. [Google Scholar] [CrossRef]
- Stokes, P.; Purdon, P. A study of problems encountered in Granger causality analysis from a neuroscience perspective. Proc. Natl. Acad. Sci. USA 2017, 114, E7063–E7072. [Google Scholar] [CrossRef] [Green Version]
- Faes, L.; Stramaglia, S.; Marinazzo, D. On the interpretability and computational reliability of frequency-domain Granger causality. F1000Research 2017, 6, 1710. [Google Scholar] [CrossRef]
- Tennant, P.; Arnold, K.; Berrie, L.; Ellison, G.; Gilthorpe, M. Advanced modelling strategies: Challenges and pitfalls in robust causal inference with observational data. In Advanced Modelling Strategies: Challenges and Pitfalls in Robust Causal Inference with Observational Data; Leeds Institute for Data Analytics: Leeds, UK, 2017. [Google Scholar]
- Kozak, M. Teaching statistics = teaching thinking statistically. Model Assist. Stat. Appl. 2009, 4, 275–279. [Google Scholar] [CrossRef]
- Papana, A.; Kyrtsou, C.; Kugiumtzis, D.; Diks, C. Detecting causality in non-stationary time series using partial symbolic transfer entropy: Evidence in financial data. Comput. Econ. 2016, 47, 341–365. [Google Scholar] [CrossRef]
- Kozak, M. Online platform supporting teaching correlation. Model Assist. Stat. Appl. 2011, 6, 71–74. [Google Scholar] [CrossRef]
- Faul, F.; Erdfelder, E.; Buchner, A.; Lang, A.G. Statistical power analyses using G*Power 3.1: Tests for correlation and regression analyses. Behav. Res. Methods 2009, 41, 1149–1160. [Google Scholar] [CrossRef] [PubMed] [Green Version]
- Bujang, M.; Baharum, N. Sample size guideline for correlation analysis. World 2016, 3, 37–46. [Google Scholar] [CrossRef]
- Ramos, A.; Macau, E. Minimum sample size for reliable causal inference using transfer entropy. Entropy 2017, 19, 150. [Google Scholar] [CrossRef] [Green Version]
- Fremeth, A.; Holburn, G.; Richter, B. Making Causal Inferences in Small Samples Using Synthetic Control Methodology: Did Chrysler Benefit from Government Assistance? 2013. Available online: https://papers.ssrn.com/sol3/papers.cfm?abstract_id=2135294 (accessed on 23 October 2021).
- Zhang, B.G.; Li, W.; Shi, Y.; Liu, X.; Chen, L. Detecting causality from short time-series data based on prediction of topologically equivalent attractors. BMC Syst. Biol. 2017, 11, 141–150. [Google Scholar] [CrossRef] [Green Version]
- Helske, J.; Tikka, S.; Karvanen, J. Estimation of causal effects with small data in the presence of trapdoor variables. J. R. Stat. Soc. Ser. A Stat. Soc. 2021, 184, 1030–1051. [Google Scholar] [CrossRef]
- Yu, Z.; Liu, J.; Noda, I. Effect of noise on the evaluation of correlation coefficients in two-dimensional correlation spectroscopy. Appl. Spectrosc. 2003, 57, 1605–1609. [Google Scholar] [CrossRef]
- Khan, S.; Bandyopadhyay, S.; Ganguly, A.; Saigal, S.; Erickson, D., III; Protopopescu, V.; Ostrouchov, G. Relative performance of mutual information estimation methods for quantifying the dependence among short and noisy data. Phys. Rev. E 2007, 76, 026209. [Google Scholar] [CrossRef] [Green Version]
- Hassani, H.; Dionisio, A.; Ghodsi, M. The effect of noise reduction in measuring the linear and nonlinear dependency of financial markets. Nonlinear Anal. Real World Appl. 2010, 11, 492–502. [Google Scholar] [CrossRef]
- Pillow, J.; Latham, P. Neural characterization in partially observed populations of spiking neurons. Adv. Neural Inf. Process. Syst. 2008, 20, 1–8. [Google Scholar]
- Vidne, M.; Ahmadian, Y.; Shlens, J.; Pillow, J.; Kulkarni, J.; Litke, A.; Chichilnisky, E.; Simoncelli, E.; Paninski, L. Modeling the impact of common noise inputs on the network activity of retinal ganglion cells. J. Comput. Neurosci. 2012, 33, 97–121. [Google Scholar] [CrossRef] [PubMed] [Green Version]
- Eichler, M. Causal inference with multiple time series: Principles and problems. PHilosophical Trans. R. Soc. A Math. Phys. Eng. Sci. 2013, 371, 20110613. [Google Scholar] [CrossRef] [Green Version]
- Bachschmid-Romano, L.; Opper, M. Inferring hidden states in a random kinetic Ising model: Replica analysis. J. Stat. Mech. Theory Exp. 2014, 2014, P06013. [Google Scholar] [CrossRef] [Green Version]
- Geiger, P.; Zhang, K.; Schoelkopf, B.; Gong, M.; Janzing, D. Causal inference by identification of vector autoregressive processes with hidden components. In Proceeding of the International Conference on Machine Learning, Lille, France, 6–11 July 2015; pp. 1917–1925. [Google Scholar]
- Runge, J. Causal network reconstruction from time series: From theoretical assumptions to practical estimation. Chaos Interdiscip. J. Nonlinear Sci. 2018, 28, 075310. [Google Scholar] [CrossRef] [PubMed]
- Rizzo, M.; Szekely, G. E-Statistics: Multivariate Inference via the Energy of Data. 2021. Available online: https://github.com/mariarizzo/energy (accessed on 23 October 2021).
- Kraskov, A.; Stögbauer, H.; Grassberger, P. Estimating mutual information. Phys. Rev. E 2004, 69, 066138. [Google Scholar] [CrossRef] [PubMed] [Green Version]
- Varotto, G.; Visani, E.; Canafoglia, L.; Franceschetti, S.; Avanzini, G.; Panzica, F. Enhanced frontocentral EEG connectivity in photosensitive generalized epilepsies: A partial directed coherence study. Epilepsia 2012, 53, 359–367. [Google Scholar] [CrossRef]
- Zhao, Z.; Wang, C. Using partial directed coherence to study alpha-band effective brain networks during a visuospatial attention task. Behav. Neurol. 2019, 2019, 1410425. [Google Scholar] [CrossRef] [PubMed]
- Letson, D.; McCullough, B. ENSO and soybean prices: Correlation without causality. J. Agric. Appl. Econ. 2001, 33, 513–521. [Google Scholar] [CrossRef] [Green Version]
- Roy-García, I.; Rivas-Ruiz, R.; Pérez-Rodríguez, M.; Palacios-Cruz, L. Correlation: Not all correlation entails causality. Rev. Alerg. Mex. 2019, 66, 354–360. [Google Scholar]

| Measure | Reference |
|---|---|
| Pearson product-moment correlation coefficient | [43] |
| Spearman rank correlation coefficient | [44] |
| Kendall’s rank correlation coefficient | [45] |
| Hoeffding’s test of independence | [46] |
| Biweight midcorrelation | [88] |
| Coefficient of determination | [48] |
| Distance correlation | [49,50] |
| Partial distance correlation | [51] |
| Yule’s Q | [52] |
| Yule’s Y | [53] |
| CANOVA | [9] |
| Randomized Dependence Coefficient | [56] |
| Mutual information | [65,66,67] |
| Nonlinear correlation information entropy | [64] |
| Entropy correlation coefficient | [68] |
| Entropy coefficient of determination | [69] |
| Maximal information coefficient | [70] |
| Partial maximal information coefficient | [71] |
| Coherence | [73] |
| Mean phase coherence | [12,79] |
| Phase locking value | [12,78] |
| Determinism | [83,84] |
| Measure | Reference |
|---|---|
| Granger causality | [1] |
| Conditional Granger causality | [111] |
| Partial Granger causality | [112] |
| Granger causality on radial basis functions | [113] |
| Granger causality on kernel functions | [114] |
| Granger causality on nonlinear autoregressive exogenous models | [115] |
| Baek and Brok test | [116] |
| Hiemstra and Jones test | [117] |
| Diks and Panchenko test | [118] |
| Nonlinear multivariate causality test of Hiemstra and Jones | [119] |
| Transfer entropy | [120] |
| Partial transfer entropy | [121,122] |
| Partial transfer entropy with nonuniform embedding | [123] |
| Mutual information on mixed embedding | [124] |
| Partial mutual information on mixed embedding | [125] |
| Low-dimensional approximation of transfer entropy | [126,127] |
| Nonlinear interdependence measures | [129,130,131,132,133,134] |
| (Conditional) extended Granger causality | [135] |
| PC algorithm | [138] |
| Fast Causal Inference | [140] |
| tsFCI | [145] |
| PCMCI | [146] |
| Geweke’s spectral Granger causality | [111] |
| Directed transfer function | [148] |
| Partial directed coherence | [149] |
| Direct directed transfer function | [150] |
| Generalized partial directed coherence | [151] |
| Phase Slope Index | [152] |
| Nonparametric partial directed coherence | [155] |
| DEKF-based Partial directed coherence | [156] |
| Nonlinear partial directed coherence | [157] |
| Extended Granger causality | [159] |
| Compensated transfer entropy | [168,169] |
| PMIME0 | [171] |
| PCMCI+ | [172] |
| PPCor | 1 | 2 | 3 | 4 | 5 | PSpCor | 1 | 2 | 3 | 4 | 5 |
|---|---|---|---|---|---|---|---|---|---|---|---|
| 1 | - | 6 | 6 | 15 | 5 | 1 | - | 5 | 4 | 87 | 3 |
| 2 | - | 100 | 11 | 100 | 2 | - | 100 | 5 | 100 | ||
| 3 | - | 1 | 3 | 3 | - | 6 | 100 | ||||
| 4 | - | 10 | 4 | - | 5 | ||||||
| 5 | - | 5 | - | ||||||||
| pdCor | 1 | 2 | 3 | 4 | 5 | MI | 1 | 2 | 3 | 4 | 5 |
| 1 | - | 4 | 4 | 98 | 1 | 1 | - | 9 | 4 | 31 | 4 |
| 2 | - | 100 | 1 | 100 | 2 | - | 100 | 3 | 100 | ||
| 3 | - | 5 | 100 | 3 | - | 2 | 100 | ||||
| 4 | - | 4 | 4 | - | 1 | ||||||
| 5 | - | 5 | - | ||||||||
| CGCI | 1 | 2 | 3 | 4 | 5 | RCGCI | 1 | 2 | 3 | 4 | 5 |
| 1 | - | 7 | 8 | 8 | 4 | 1 | - | 0 | 0 | 1 | 0 |
| 2 | 8 | - | 8 | 2 | 5 | 2 | 1 | - | 0 | 0 | 4 |
| 3 | 4 | 6 | - | 1 | 2 | 3 | 1 | 1 | - | 0 | 2 |
| 4 | 3 | 3 | 2 | - | 1 | 4 | 0 | 0 | 1 | - | 1 |
| 5 | 4 | 7 | 3 | 4 | - | 5 | 1 | 1 | 0 | 0 | - |
| PTENUE | 1 | 2 | 3 | 4 | 5 | PDC | 1 | 2 | 3 | 4 | 5 |
| 1 | - | 4 | 4 | 3 | 4 | 1 | - | 5 | 7 | 9 | 2 |
| 2 | 2 | - | 3 | 6 | 6 | 2 | 4 | - | 3 | 5 | 4 |
| 3 | 7 | 3 | - | 9 | 4 | 3 | 3 | 4 | - | 3 | 3 |
| 4 | 7 | 4 | 3 | - | 3 | 4 | 0 | 1 | 5 | - | 2 |
| 5 | 4 | 5 | 3 | 3 | - | 5 | 4 | 4 | 3 | 4 | - |
| Contemporaneous Effects | Causal Effects | ||||||||||
| PMIME0 | 1 | 2 | 3 | 4 | 5 | PMIME0 | 1 | 2 | 3 | 4 | 5 |
| 1 | - | 2 | 5 | 42 | 4 | 1 | - | 5 | 28 | 22 | 6 |
| 2 | 5 | - | 100 | 5 | 100 | 2 | 19 | - | 16 | 15 | 15 |
| 3 | 3 | 98 | - | 3 | 3 | 3 | 19 | 2 | - | 25 | 4 |
| 4 | 41 | 3 | 7 | - | 3 | 4 | 18 | 2 | 15 | - | 4 |
| 5 | 3 | 100 | 2 | 1 | - | 5 | 13 | 11 | 7 | 11 | - |
| PCMCI+ | 1 | 2 | 3 | 4 | 5 | PCMCI+ | 1 | 2 | 3 | 4 | 5 |
| 1 | - | 5 | 7 | 89 | 2 | 1 | - | 12 | 7 | 7 | 10 |
| 2 | - | 100 | 2 | 100 | 2 | 9 | - | 12 | 8 | 9 | |
| 3 | - | 5 | 3 | 3 | 6 | 3 | - | 11 | 9 | ||
| 4 | - | 7 | 4 | 11 | 7 | 8 | - | 11 | |||
| 5 | - | 5 | 9 | 7 | 8 | 8 | - | ||||
| PPCor | 1 | 2 | 3 | 4 | 5 | PSpCor | 1 | 2 | 3 | 4 | 5 |
|---|---|---|---|---|---|---|---|---|---|---|---|
| 1 | - | 10 | 100 | 17 | 7 | 1 | - | 12 | 100 | 17 | 8 |
| 2 | - | 16 | 9 | 6 | 2 | - | 10 | 8 | 5 | ||
| 3 | - | 9 | 3 | 3 | - | 8 | 3 | ||||
| 4 | - | 100 | 4 | - | 100 | ||||||
| 5 | - | 5 | - | ||||||||
| pdCor | 1 | 2 | 3 | 4 | 5 | MI | 1 | 2 | 3 | 4 | 5 |
| 1 | - | 72 | 100 | 28 | 10 | 1 | - | 12 | 99 | 8 | 5 |
| 2 | - | 96 | 9 | 7 | 2 | - | 13 | 5 | 5 | ||
| 3 | - | 11 | 4 | 3 | - | 8 | 4 | ||||
| 4 | - | 100 | 4 | - | 23 | ||||||
| 5 | - | 5 | - | ||||||||
| CGCI | 1 | 2 | 3 | 4 | 5 | RCGCI | 1 | 2 | 3 | 4 | 5 |
| 1 | - | 20 | 100 | 3 | 5 | 1 | - | 24 | 100 | 2 | 2 |
| 2 | 2 | - | 6 | 8 | 5 | 2 | 2 | - | 2 | 4 | 1 |
| 3 | 10 | 5 | - | 4 | 4 | 3 | 2 | 4 | - | 0 | 2 |
| 4 | 8 | 4 | 7 | - | 100 | 4 | 0 | 3 | 1 | - | 100 |
| 5 | 7 | 4 | 3 | 84 | - | 5 | 3 | 5 | 0 | 80 | - |
| PDC | 1 | 2 | 3 | 4 | 5 | PTENUE | 1 | 2 | 3 | 4 | 5 |
| 1 | - | 15 | 100 | 4 | 4 | 1 | - | 100 | 100 | 4 | 4 |
| 2 | 0 | - | 12 | 5 | 8 | 2 | 7 | - | 1 | 3 | 5 |
| 3 | 4 | 3 | - | 2 | 2 | 3 | 6 | 5 | - | 3 | 5 |
| 4 | 37 | 52 | 35 | - | 100 | 4 | 3 | 5 | 3 | - | 44 |
| 5 | 4 | 4 | 1 | 92 | - | 5 | 3 | 5 | 3 | 100 | - |
| Contemporaneous Effects | Causal Effects | ||||||||||
| PMIME0 | 1 | 2 | 3 | 4 | 5 | PMIME0 | 1 | 2 | 3 | 4 | 5 |
| 1 | - | 7 | 0 | 3 | 7 | 1 | - | 100 | 100 | 8 | 13 |
| 2 | 5 | - | 2 | 5 | 4 | 2 | 12 | - | 5 | 11 | 13 |
| 3 | 7 | 6 | - | 3 | 5 | 3 | 12 | 14 | - | 6 | 16 |
| 4 | 5 | 5 | 0 | - | 13 | 4 | 15 | 11 | 6 | - | 74 |
| 5 | 7 | 2 | 3 | 3 | - | 5 | 15 | 16 | 8 | 100 | - |
| PCMCI+ | 1 | 2 | 3 | 4 | 5 | PCMCI+ | 1 | 2 | 3 | 4 | 5 |
| 1 | - | 6 | 7 | 3 | 4 | 1 | - | 100 | 100 | 19 | 10 |
| 2 | 6 | - | 4 | 5 | 7 | 2 | 21 | - | 41 | 14 | 8 |
| 3 | 7 | 4 | - | 3 | 5 | 3 | 32 | 21 | - | 13 | 13 |
| 4 | 3 | 5 | 3 | - | 4 | 4 | 13 | 7 | 14 | - | 88 |
| 5 | 4 | 7 | 5 | 4 | - | 5 | 12 | 12 | 10 | 100 | - |
| PPCor | 1 | 2 | 3 | 4 | 5 | PSpCor | 1 | 2 | 3 | 4 | 5 |
|---|---|---|---|---|---|---|---|---|---|---|---|
| 1 | - | 100 | 100 | 2 | 38 | 1 | - | 100 | 100 | 4 | 30 |
| 2 | - | 100 | 2 | 11 | 2 | - | 100 | 5 | 10 | ||
| 3 | - | 100 | 100 | 3 | - | 100 | 100 | ||||
| 4 | - | 43 | 4 | - | 41 | ||||||
| 5 | - | 5 | - | ||||||||
| pdCor | 1 | 2 | 3 | 4 | 5 | MI | 1 | 2 | 3 | 4 | 5 |
| 1 | - | 100 | 0 | 0 | 0 | 1 | - | 100 | 24 | 2 | 10 |
| 2 | - | 100 | 0 | 1 | 2 | - | 89 | 6 | 19 | ||
| 3 | - | 100 | 100 | 3 | - | 53 | 96 | ||||
| 4 | - | 91 | 4 | - | 8 | ||||||
| 5 | - | 5 | - | ||||||||
| CGCI | 1 | 2 | 3 | 4 | 5 | RCGCI | 1 | 2 | 3 | 4 | 5 |
| 1 | - | 100 | 27 | 4 | 18 | 1 | - | 100 | 22 | 1 | 4 |
| 2 | 8 | - | 100 | 3 | 20 | 2 | 7 | - | 100 | 0 | 5 |
| 3 | 2 | 3 | - | 100 | 100 | 3 | 5 | 5 | - | 100 | 100 |
| 4 | 7 | 6 | 3 | - | 5 | 4 | 0 | 2 | 2 | - | 3 |
| 5 | 7 | 7 | 4 | 4 | - | 5 | 2 | 3 | 2 | 3 | - |
| PTENUE | 1 | 2 | 3 | 4 | 5 | PDC | 1 | 2 | 3 | 4 | 5 |
| 1 | - | 77 | 0 | 2 | 2 | 1 | - | 0 | 92 | 88 | 92 |
| 2 | 6 | - | 100 | 8 | 3 | 2 | 0 | - | 0 | 96 | 92 |
| 3 | 5 | 2 | - | 100 | 100 | 3 | 69 | 65 | - | 0 | 0 |
| 4 | 4 | 9 | 0 | - | 4 | 4 | 94 | 97 | 98 | - | 98 |
| 5 | 4 | 3 | 0 | 4 | - | 5 | 85 | 89 | 7 | 1 | - |
| Contemporaneous Effects | Causal Effects | ||||||||||
| PMIME0 | 1 | 2 | 3 | 4 | 5 | PMIME0 | 1 | 2 | 3 | 4 | 5 |
| 1 | - | 100 | 0 | 8 | 10 | 1 | - | 0 | 13 | 21 | 18 |
| 2 | 100 | - | 1 | 5 | 5 | 2 | 97 | - | 100 | 18 | 18 |
| 3 | 0 | 0 | - | 7 | 5 | 3 | 0 | 0 | - | 100 | 100 |
| 4 | 0 | 0 | 0 | - | 2 | 4 | 0 | 0 | 4 | - | 26 |
| 5 | 0 | 0 | 0 | 3 | - | 5 | 0 | 1 | 1 | 22 | - |
| PCMCI+ | 1 | 2 | 3 | 4 | 5 | PCMCI+ | 1 | 2 | 3 | 4 | 5 |
| 1 | - | 100 | 2 | 7 | 5 | 1 | - | 39 | 2 | 36 | 33 |
| 2 | 100 | - | 1 | 8 | 3 | 2 | 32 | - | 100 | 49 | 30 |
| 3 | 2 | 1 | - | 2 | 3 | 3 | 26 | 27 | - | 72 | 100 |
| 4 | 7 | 8 | 2 | - | 6 | 4 | 17 | 21 | 61 | - | 36 |
| 5 | 5 | 3 | 3 | 6 | - | 5 | 23 | 35 | 52 | 33 | - |
Publisher’s Note: MDPI stays neutral with regard to jurisdictional claims in published maps and institutional affiliations. |
© 2021 by the author. Licensee MDPI, Basel, Switzerland. This article is an open access article distributed under the terms and conditions of the Creative Commons Attribution (CC BY) license (https://creativecommons.org/licenses/by/4.0/).
Share and Cite
Papana, A. Connectivity Analysis for Multivariate Time Series: Correlation vs. Causality. Entropy 2021, 23, 1570. https://doi.org/10.3390/e23121570
Papana A. Connectivity Analysis for Multivariate Time Series: Correlation vs. Causality. Entropy. 2021; 23(12):1570. https://doi.org/10.3390/e23121570
Chicago/Turabian StylePapana, Angeliki. 2021. "Connectivity Analysis for Multivariate Time Series: Correlation vs. Causality" Entropy 23, no. 12: 1570. https://doi.org/10.3390/e23121570
APA StylePapana, A. (2021). Connectivity Analysis for Multivariate Time Series: Correlation vs. Causality. Entropy, 23(12), 1570. https://doi.org/10.3390/e23121570