Rolling Bearing Fault Diagnosis Based on VMD-MPE and PSO-SVM
Abstract
:1. Introduction
- (1)
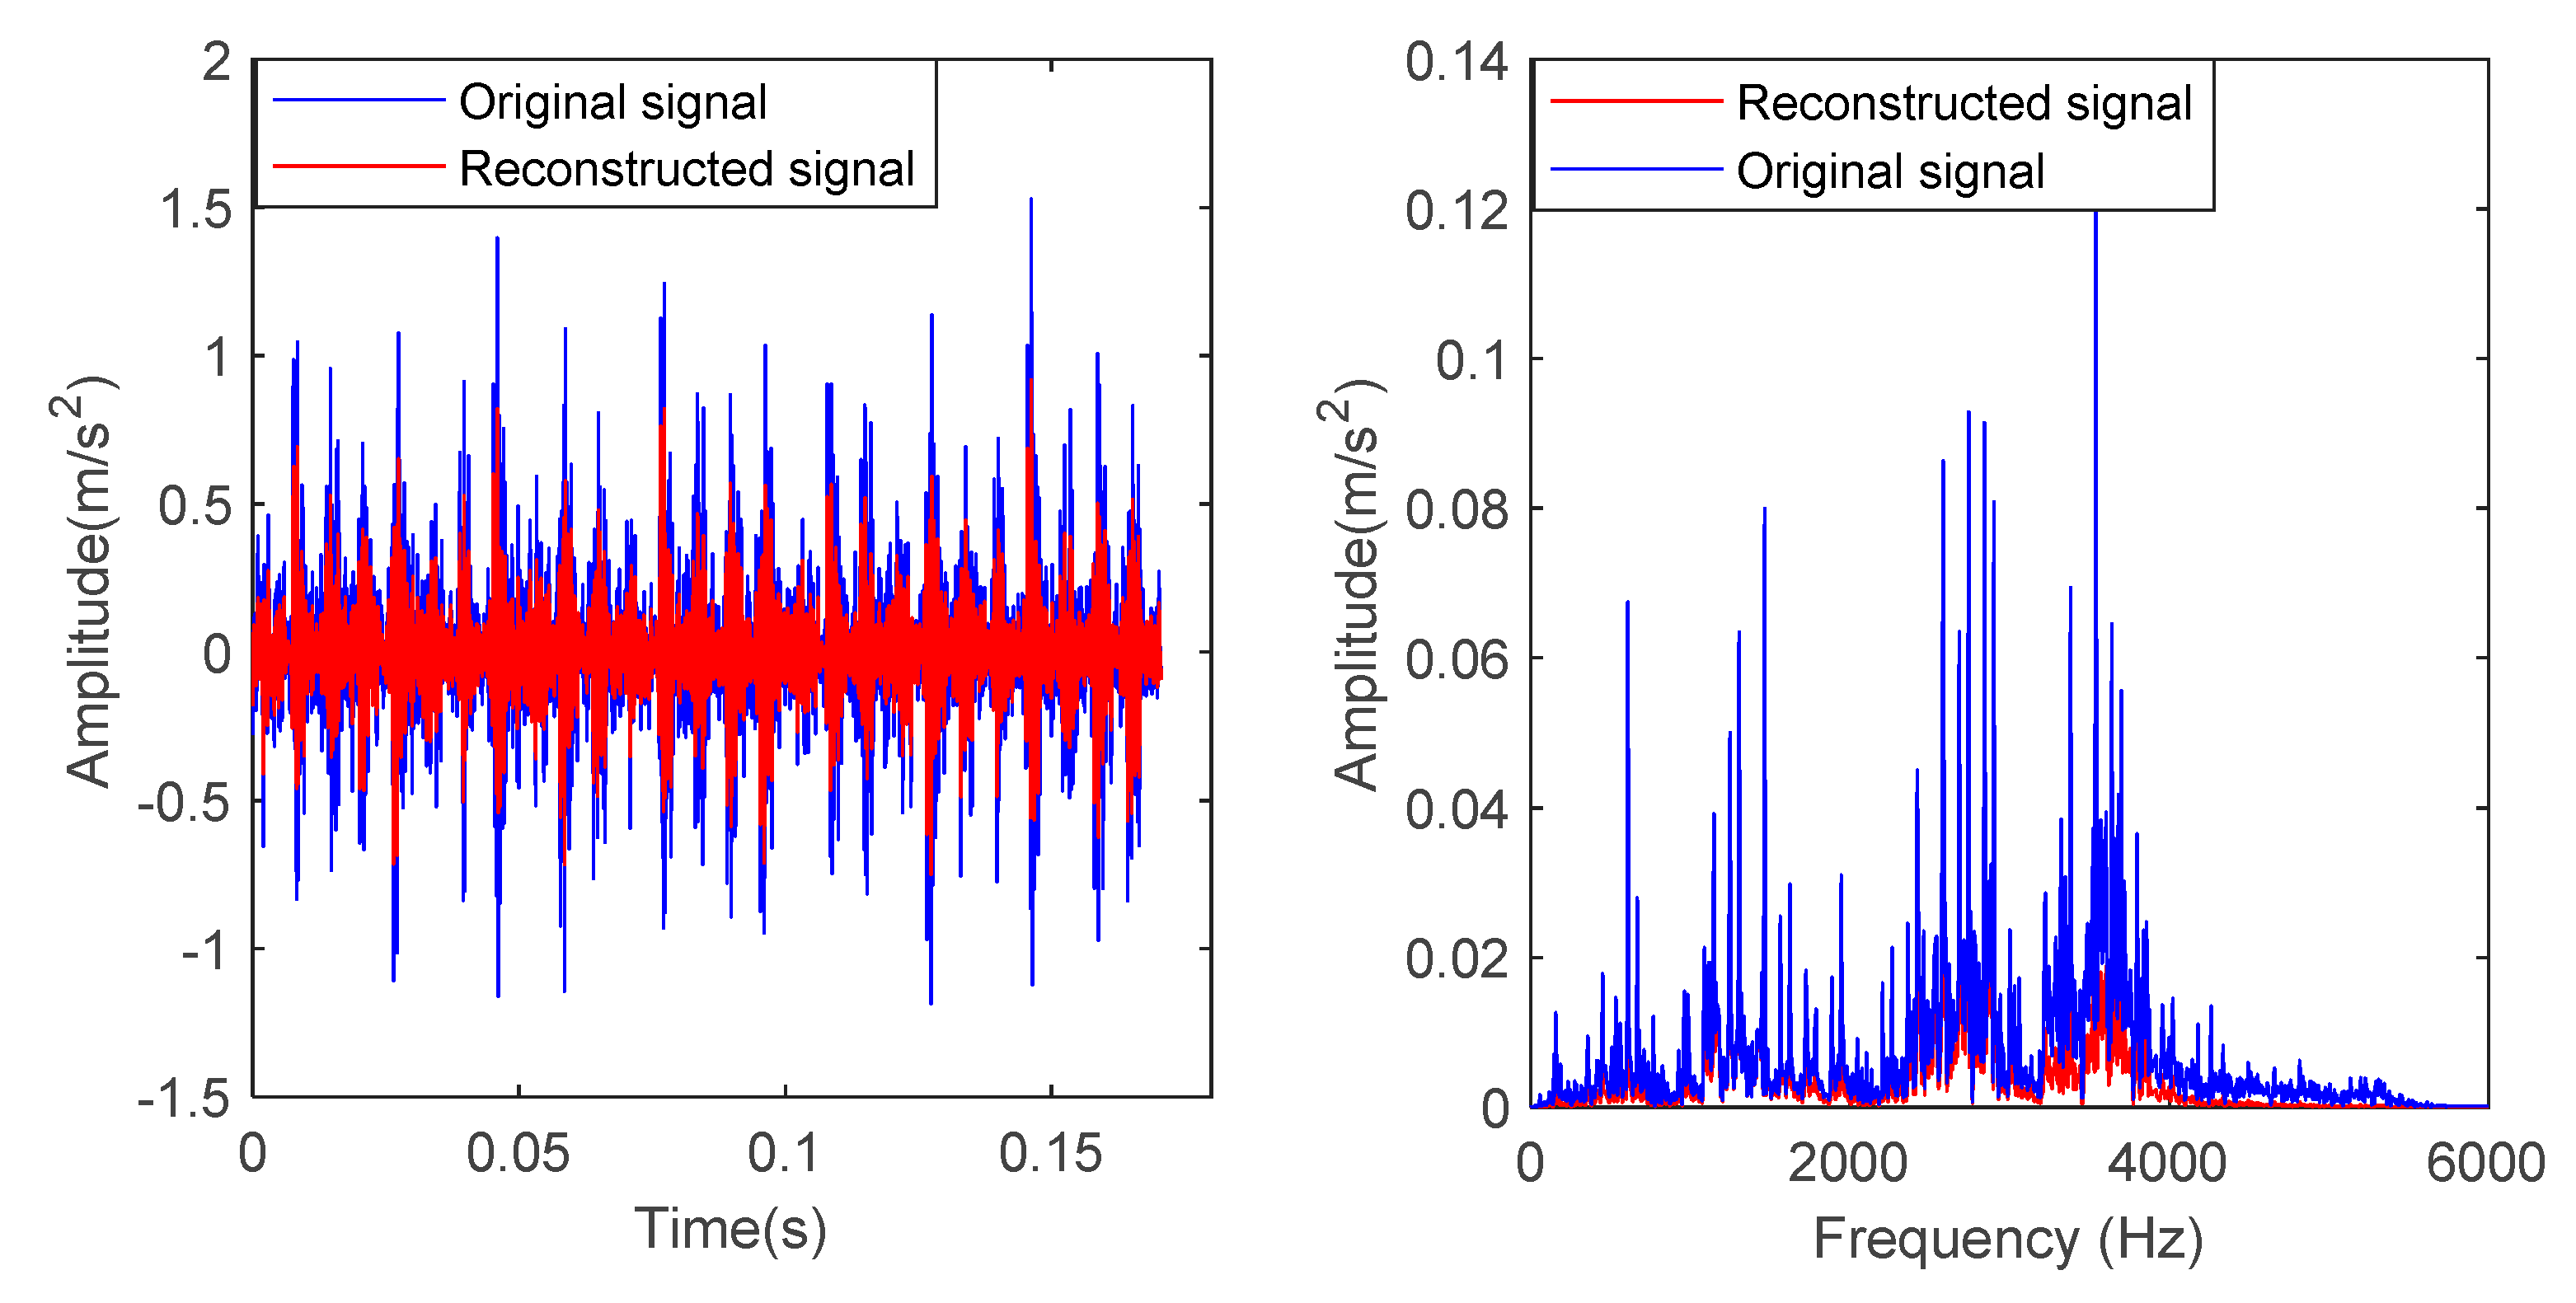
- The VMD method based on the feature energy ratio (FER) criterion is presented to decompose and reconstruct the original bearing vibration signal, which can retain the abundant bearing fault information and remove some interference components.
- (2)
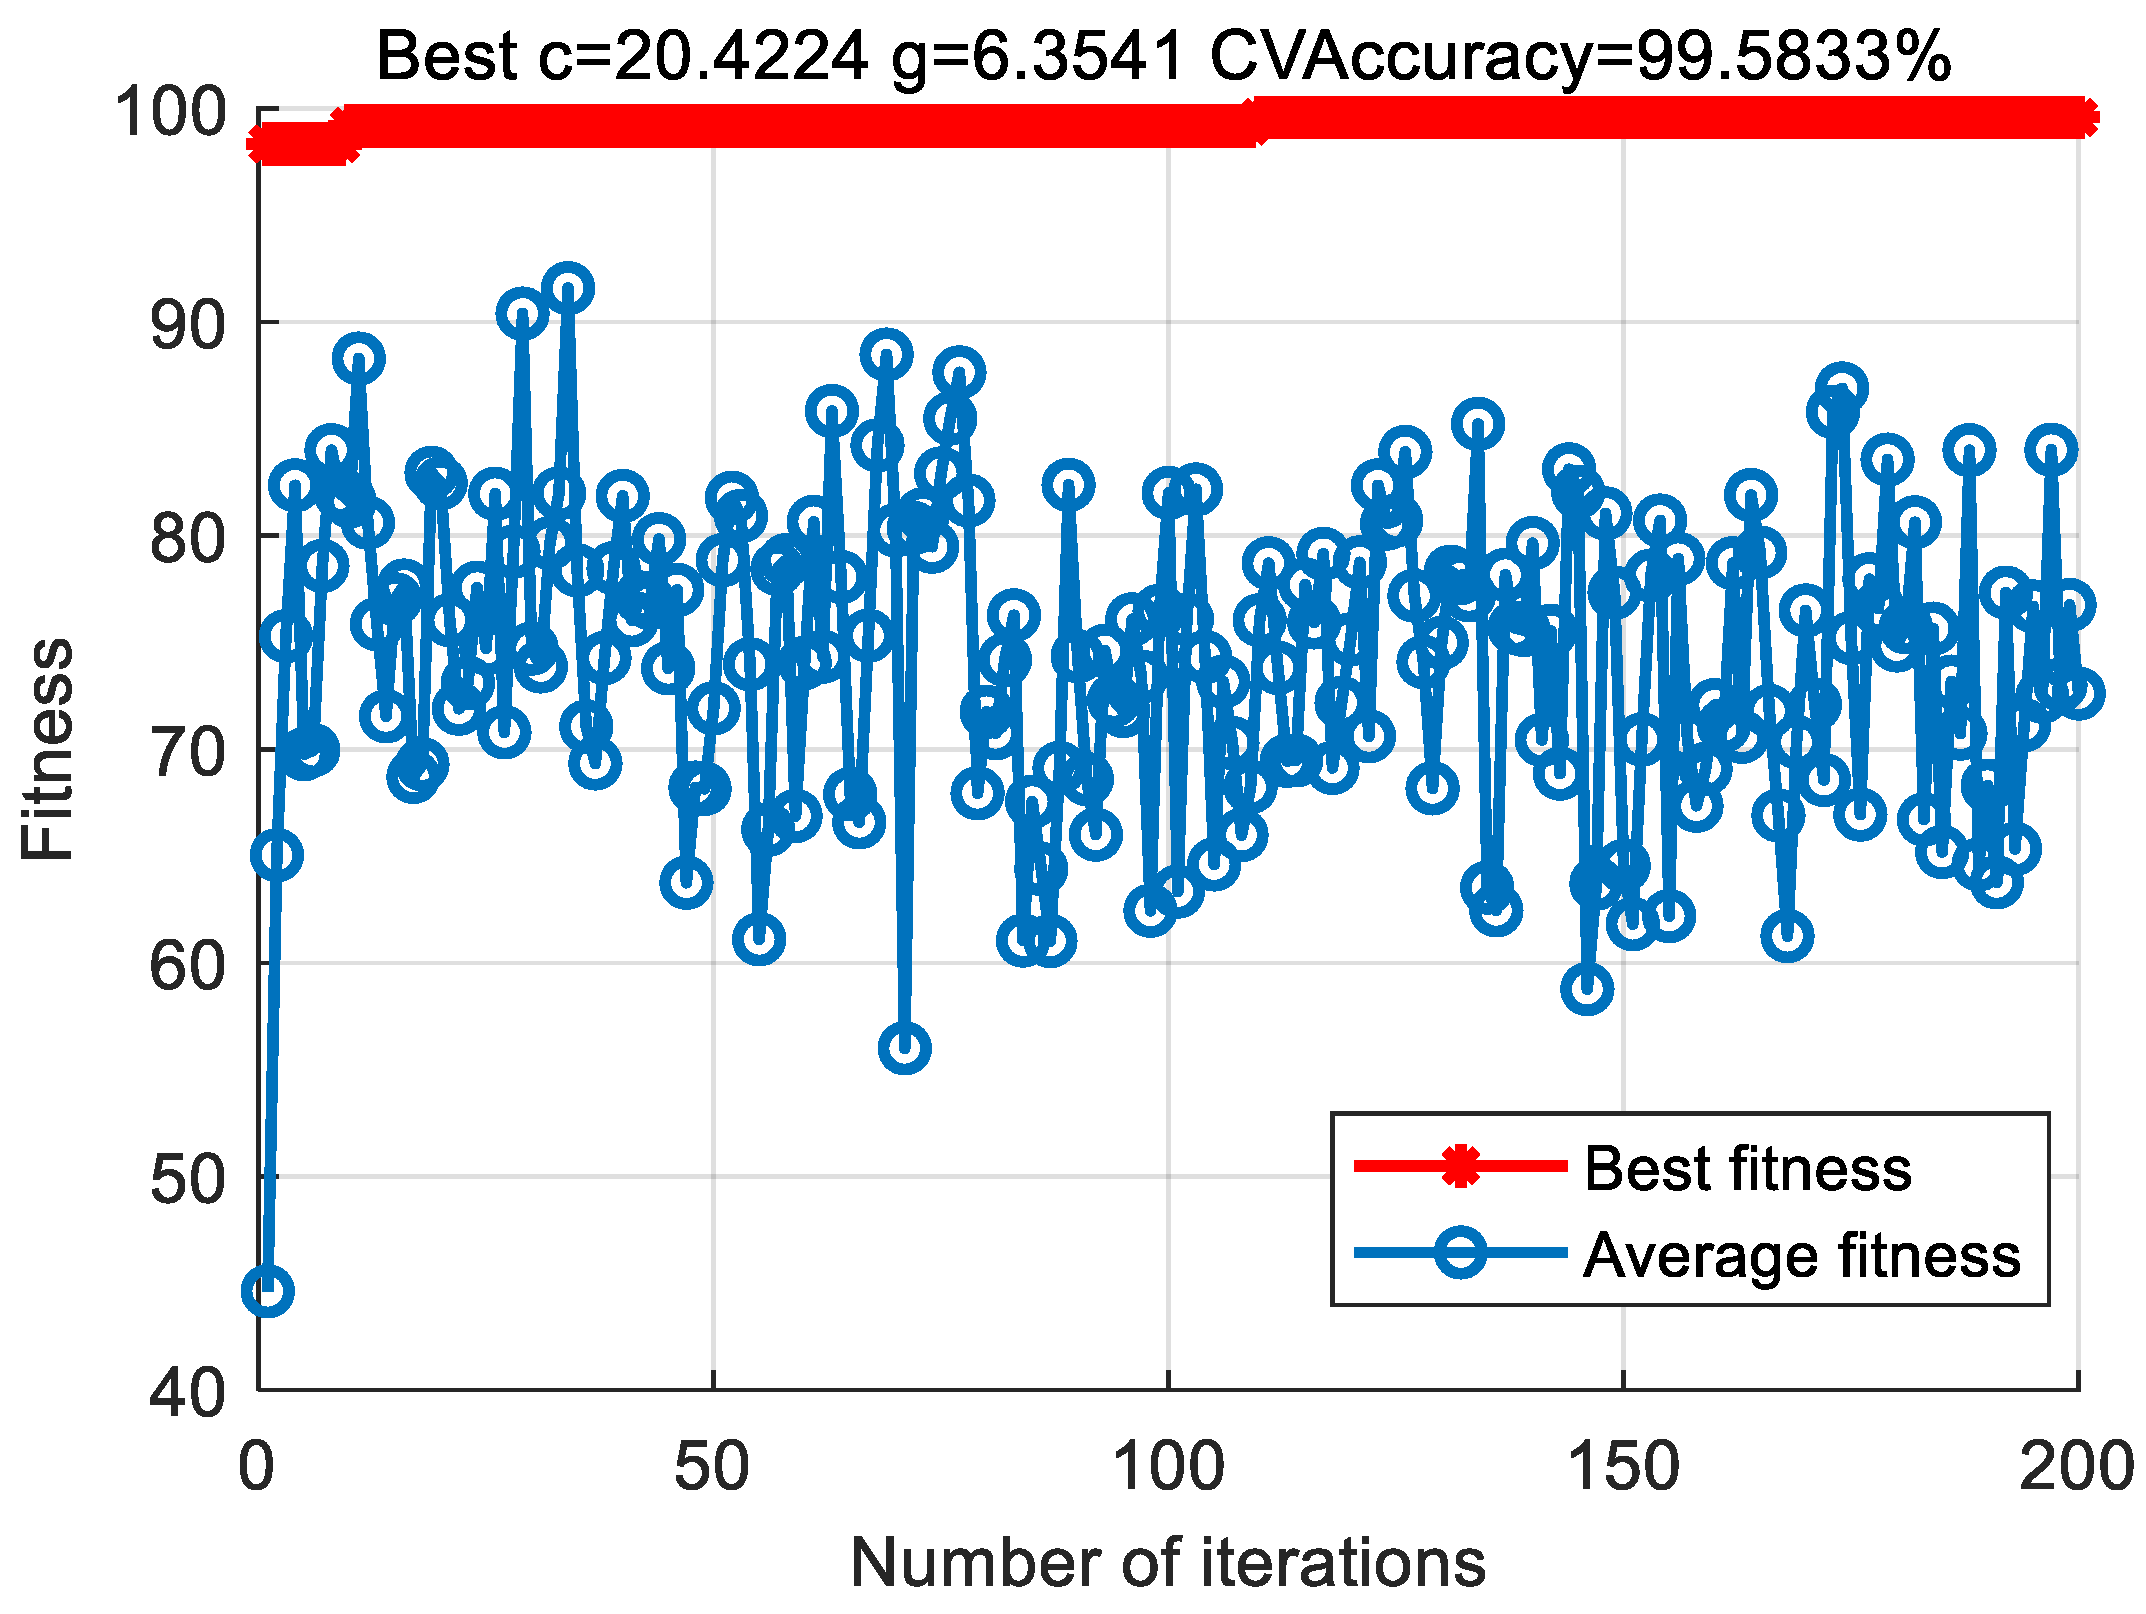
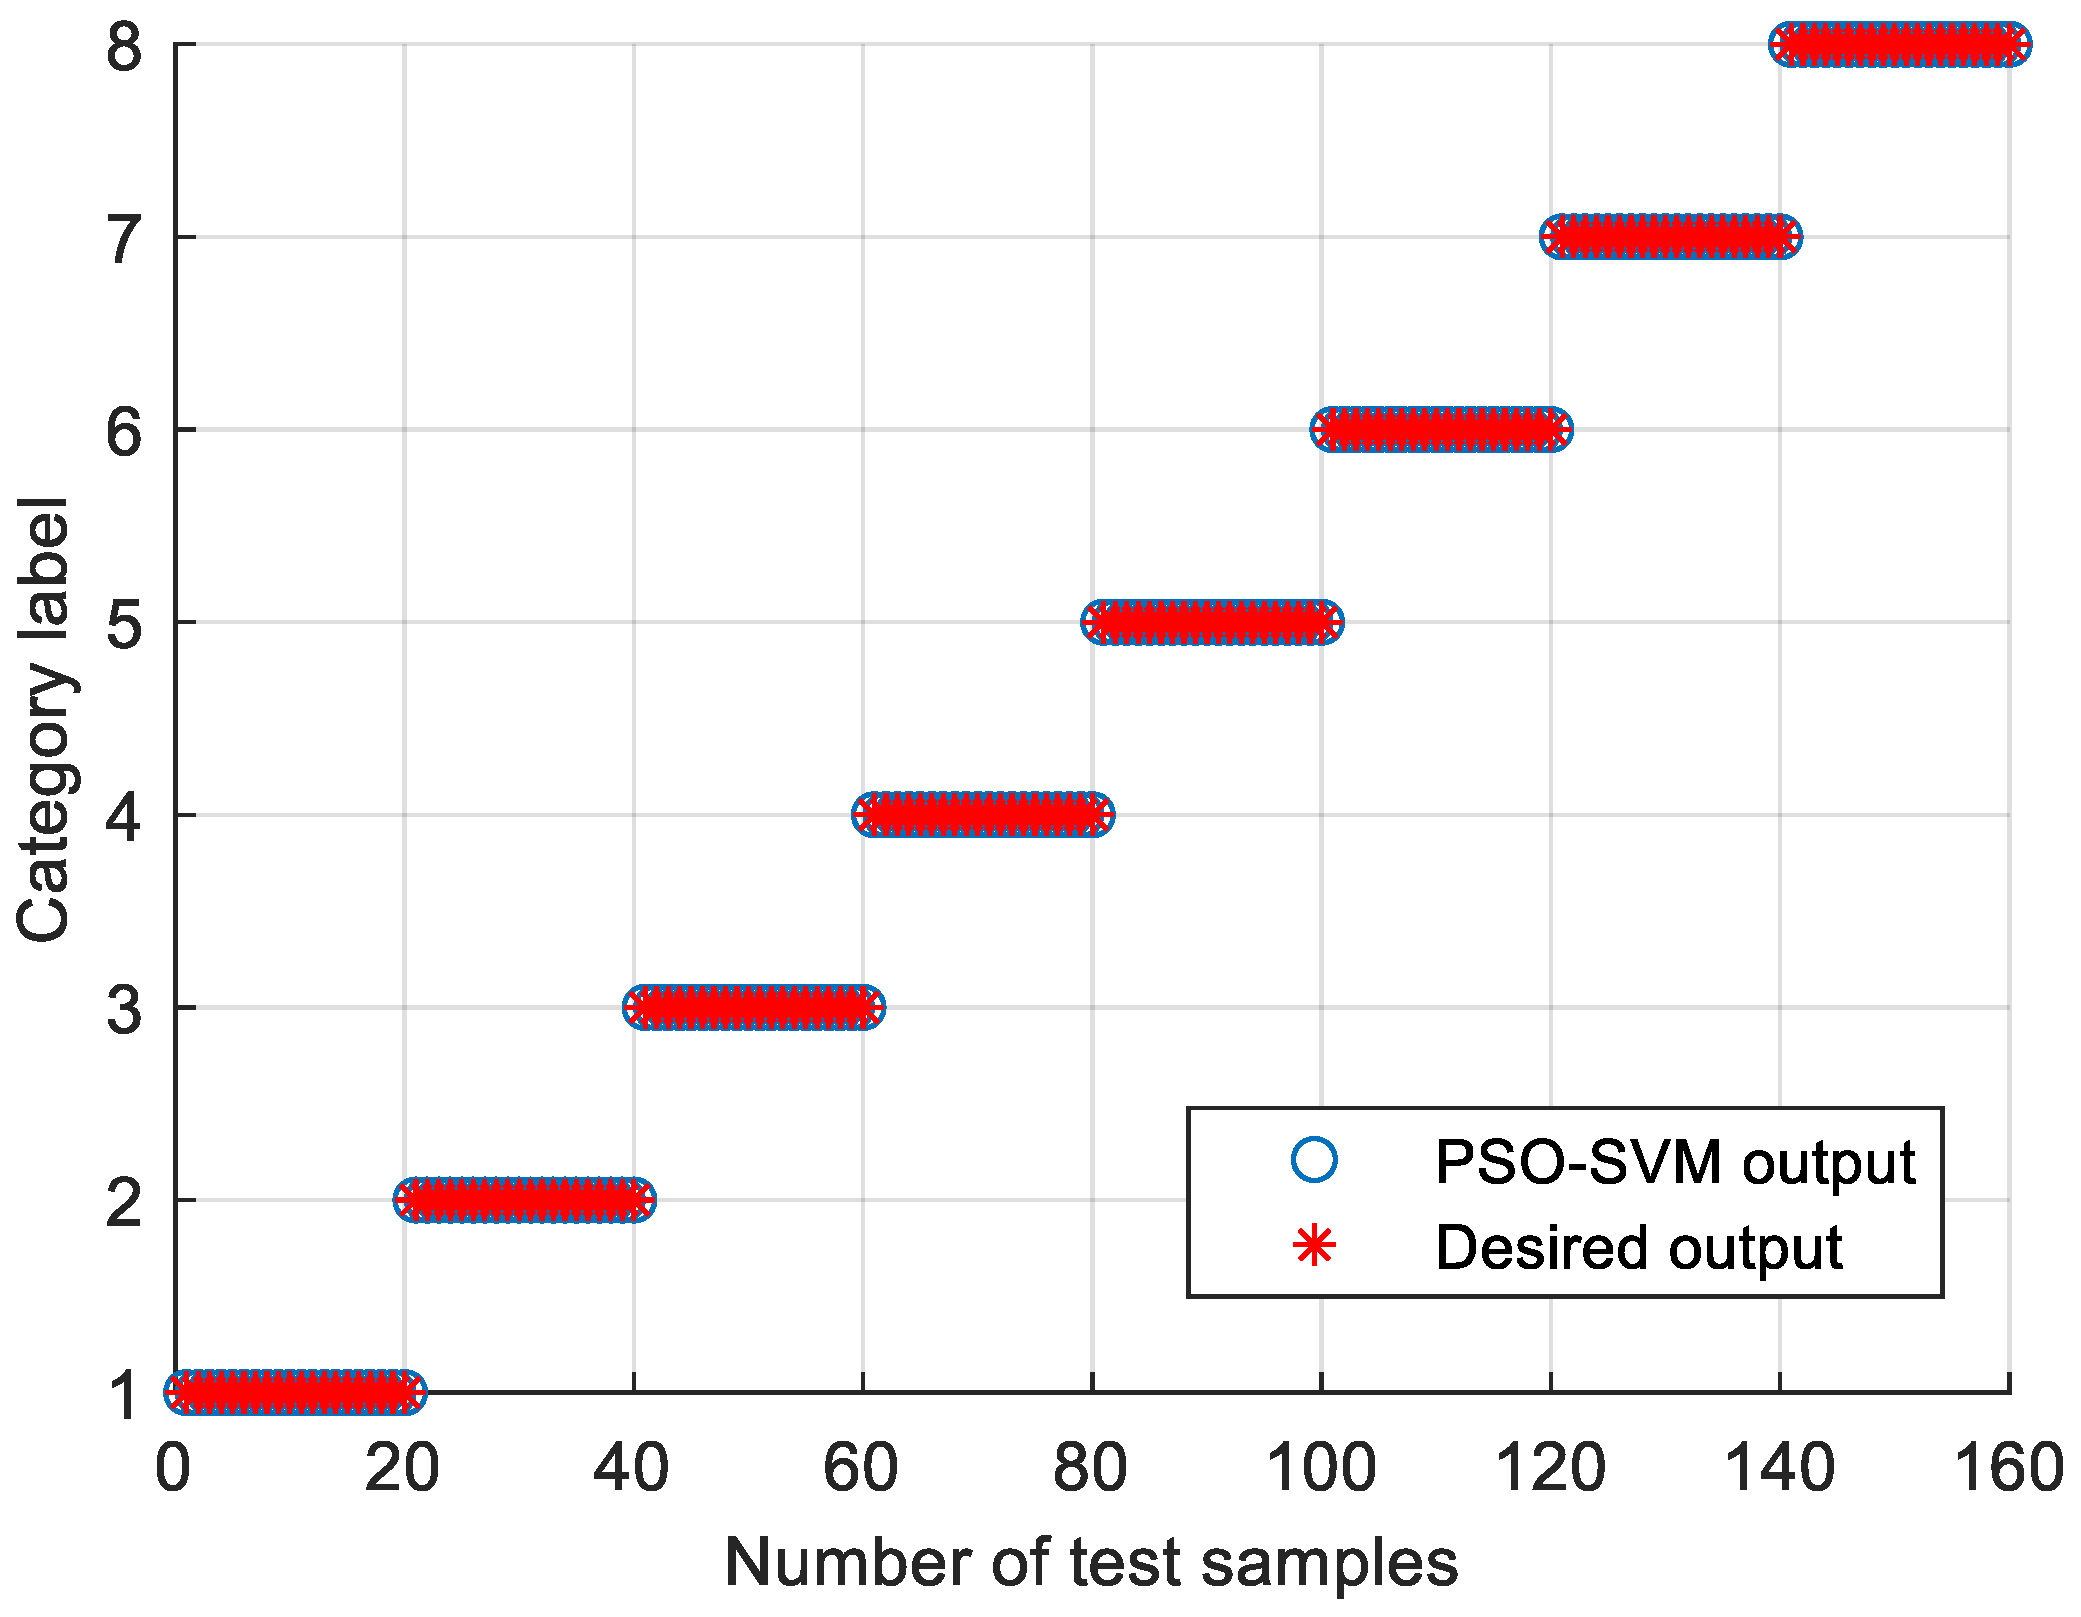
- The VMD, MPE and PSO-SVM are combined into an effective fault diagnosis method, which can improve the identification accuracy of bearing faults.
- (3)
- Two experimental cases are conducted to show the effectiveness of the proposed method in bearing fault identification.
2. Related Algorithm
2.1. Variational Mode Decomposition
2.2. Signal Reconstruction Based on Feature Energy Ratio Criterion
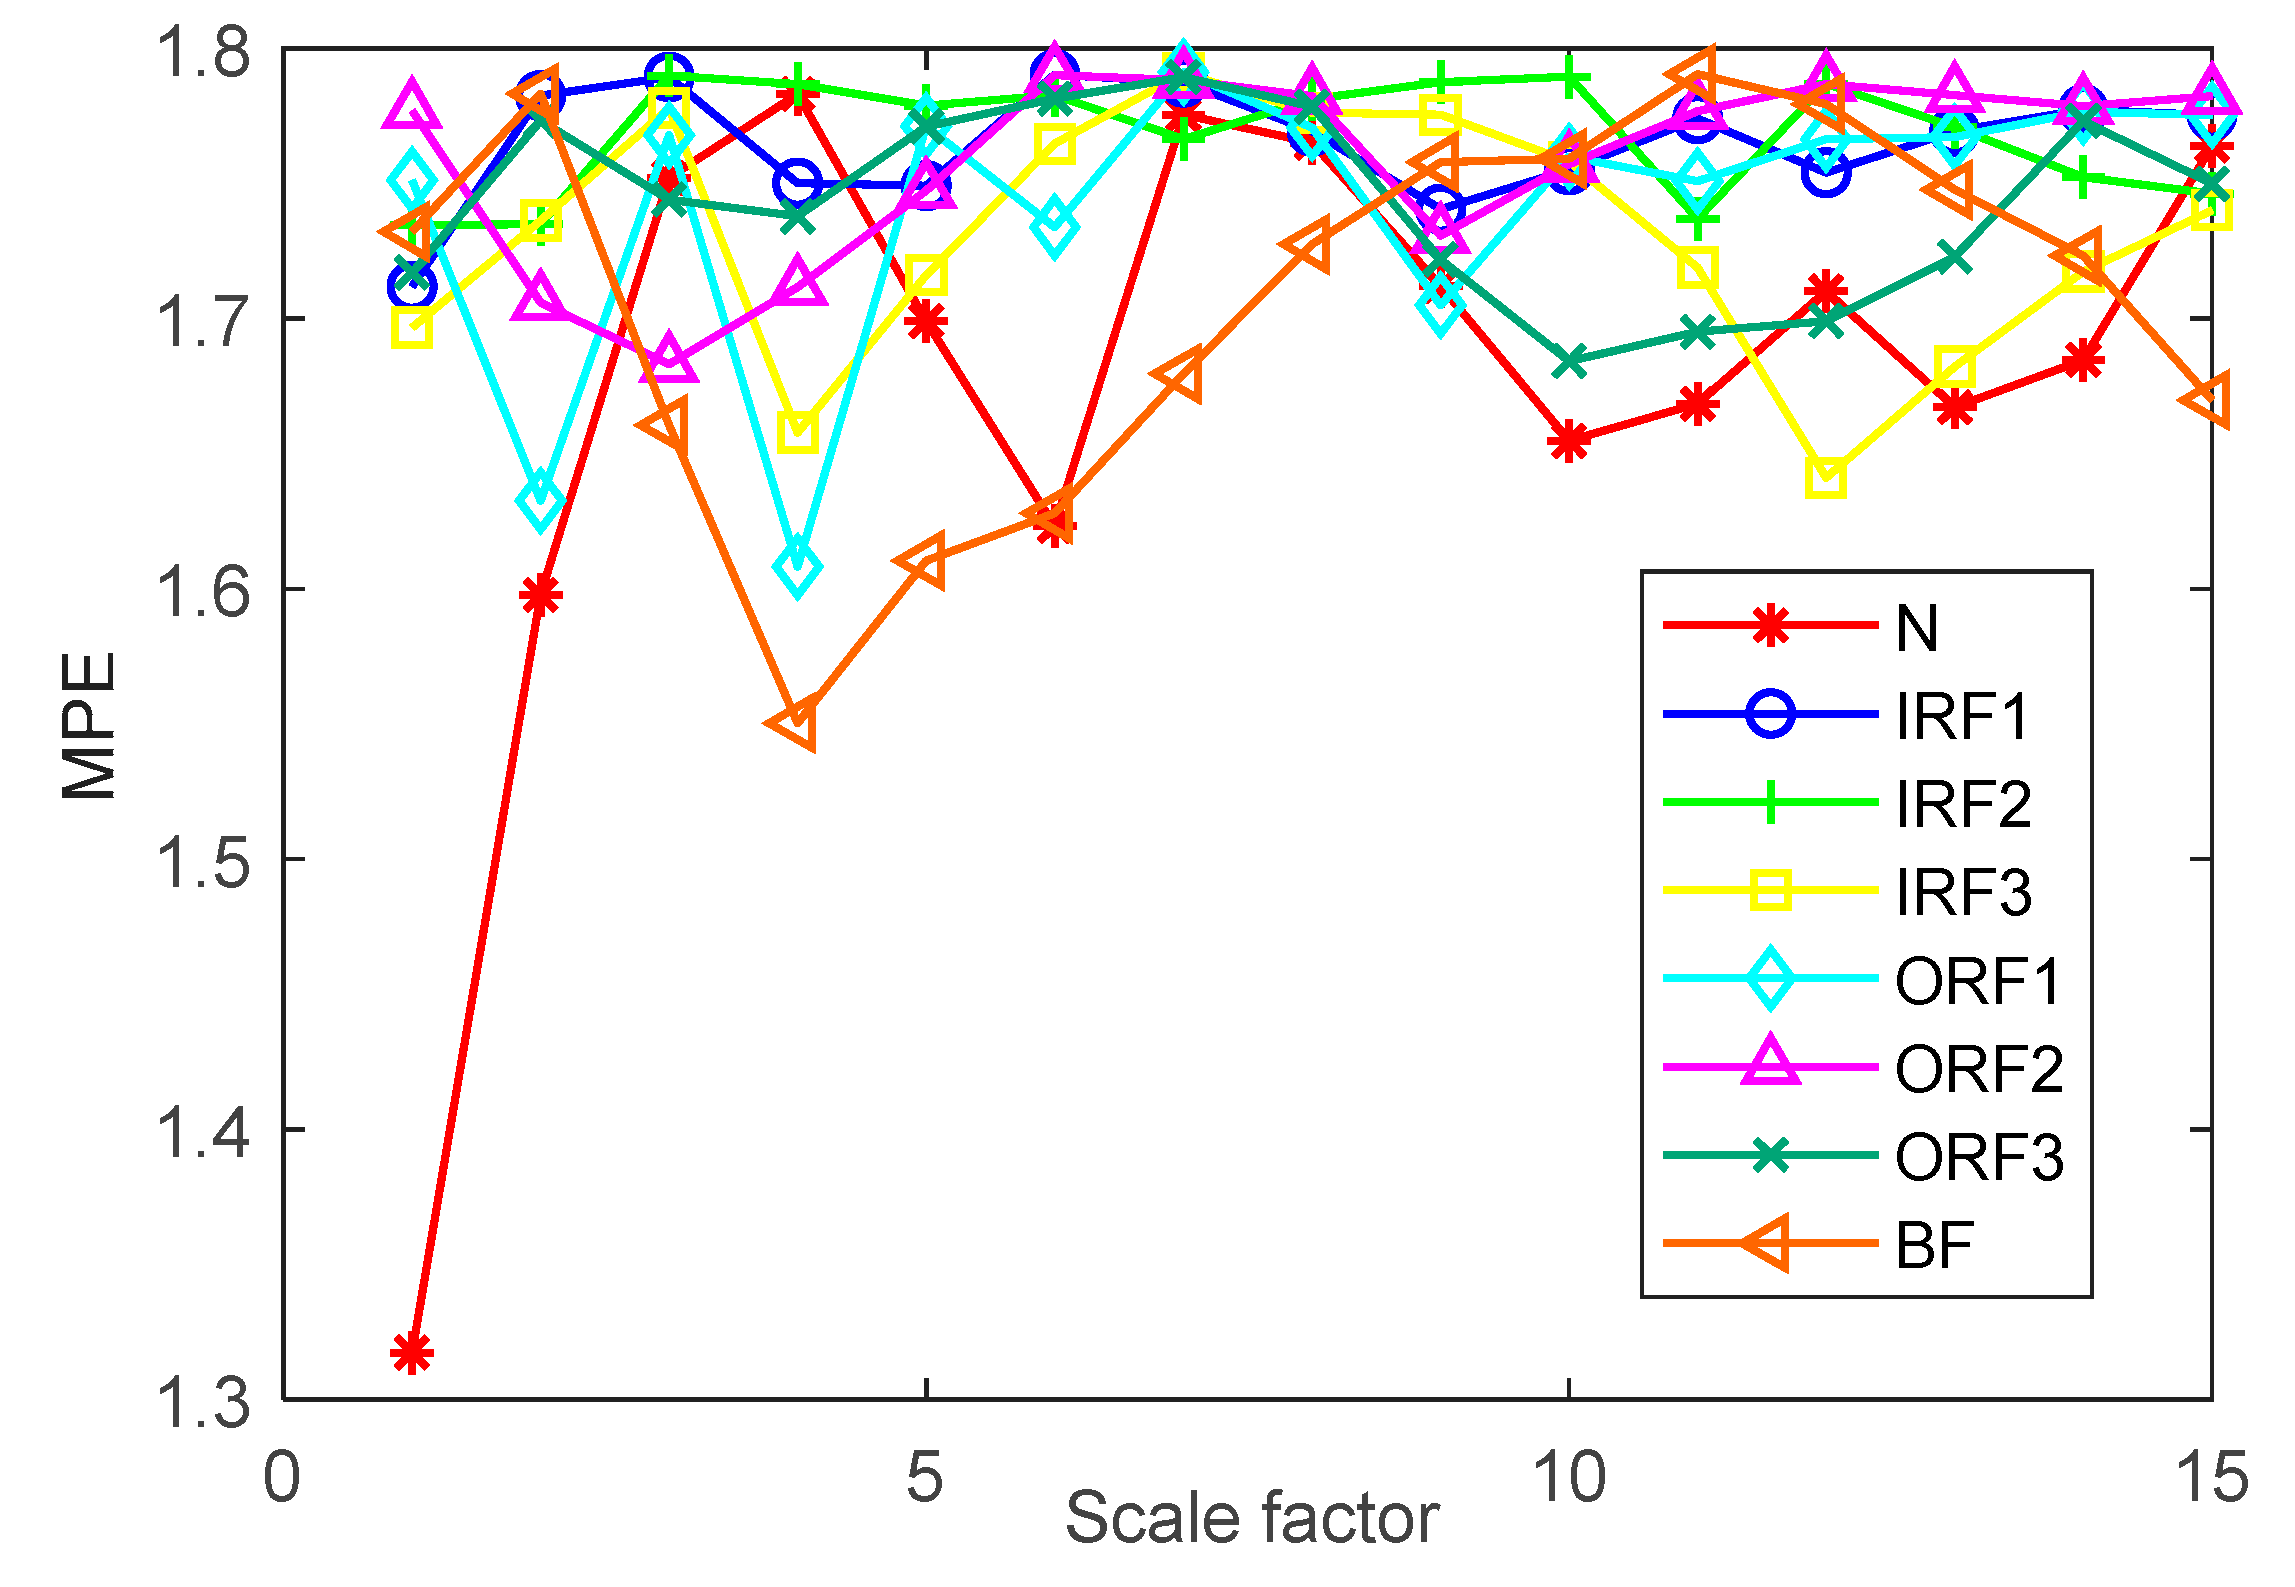
2.3. Multiscale Permutation Entropy
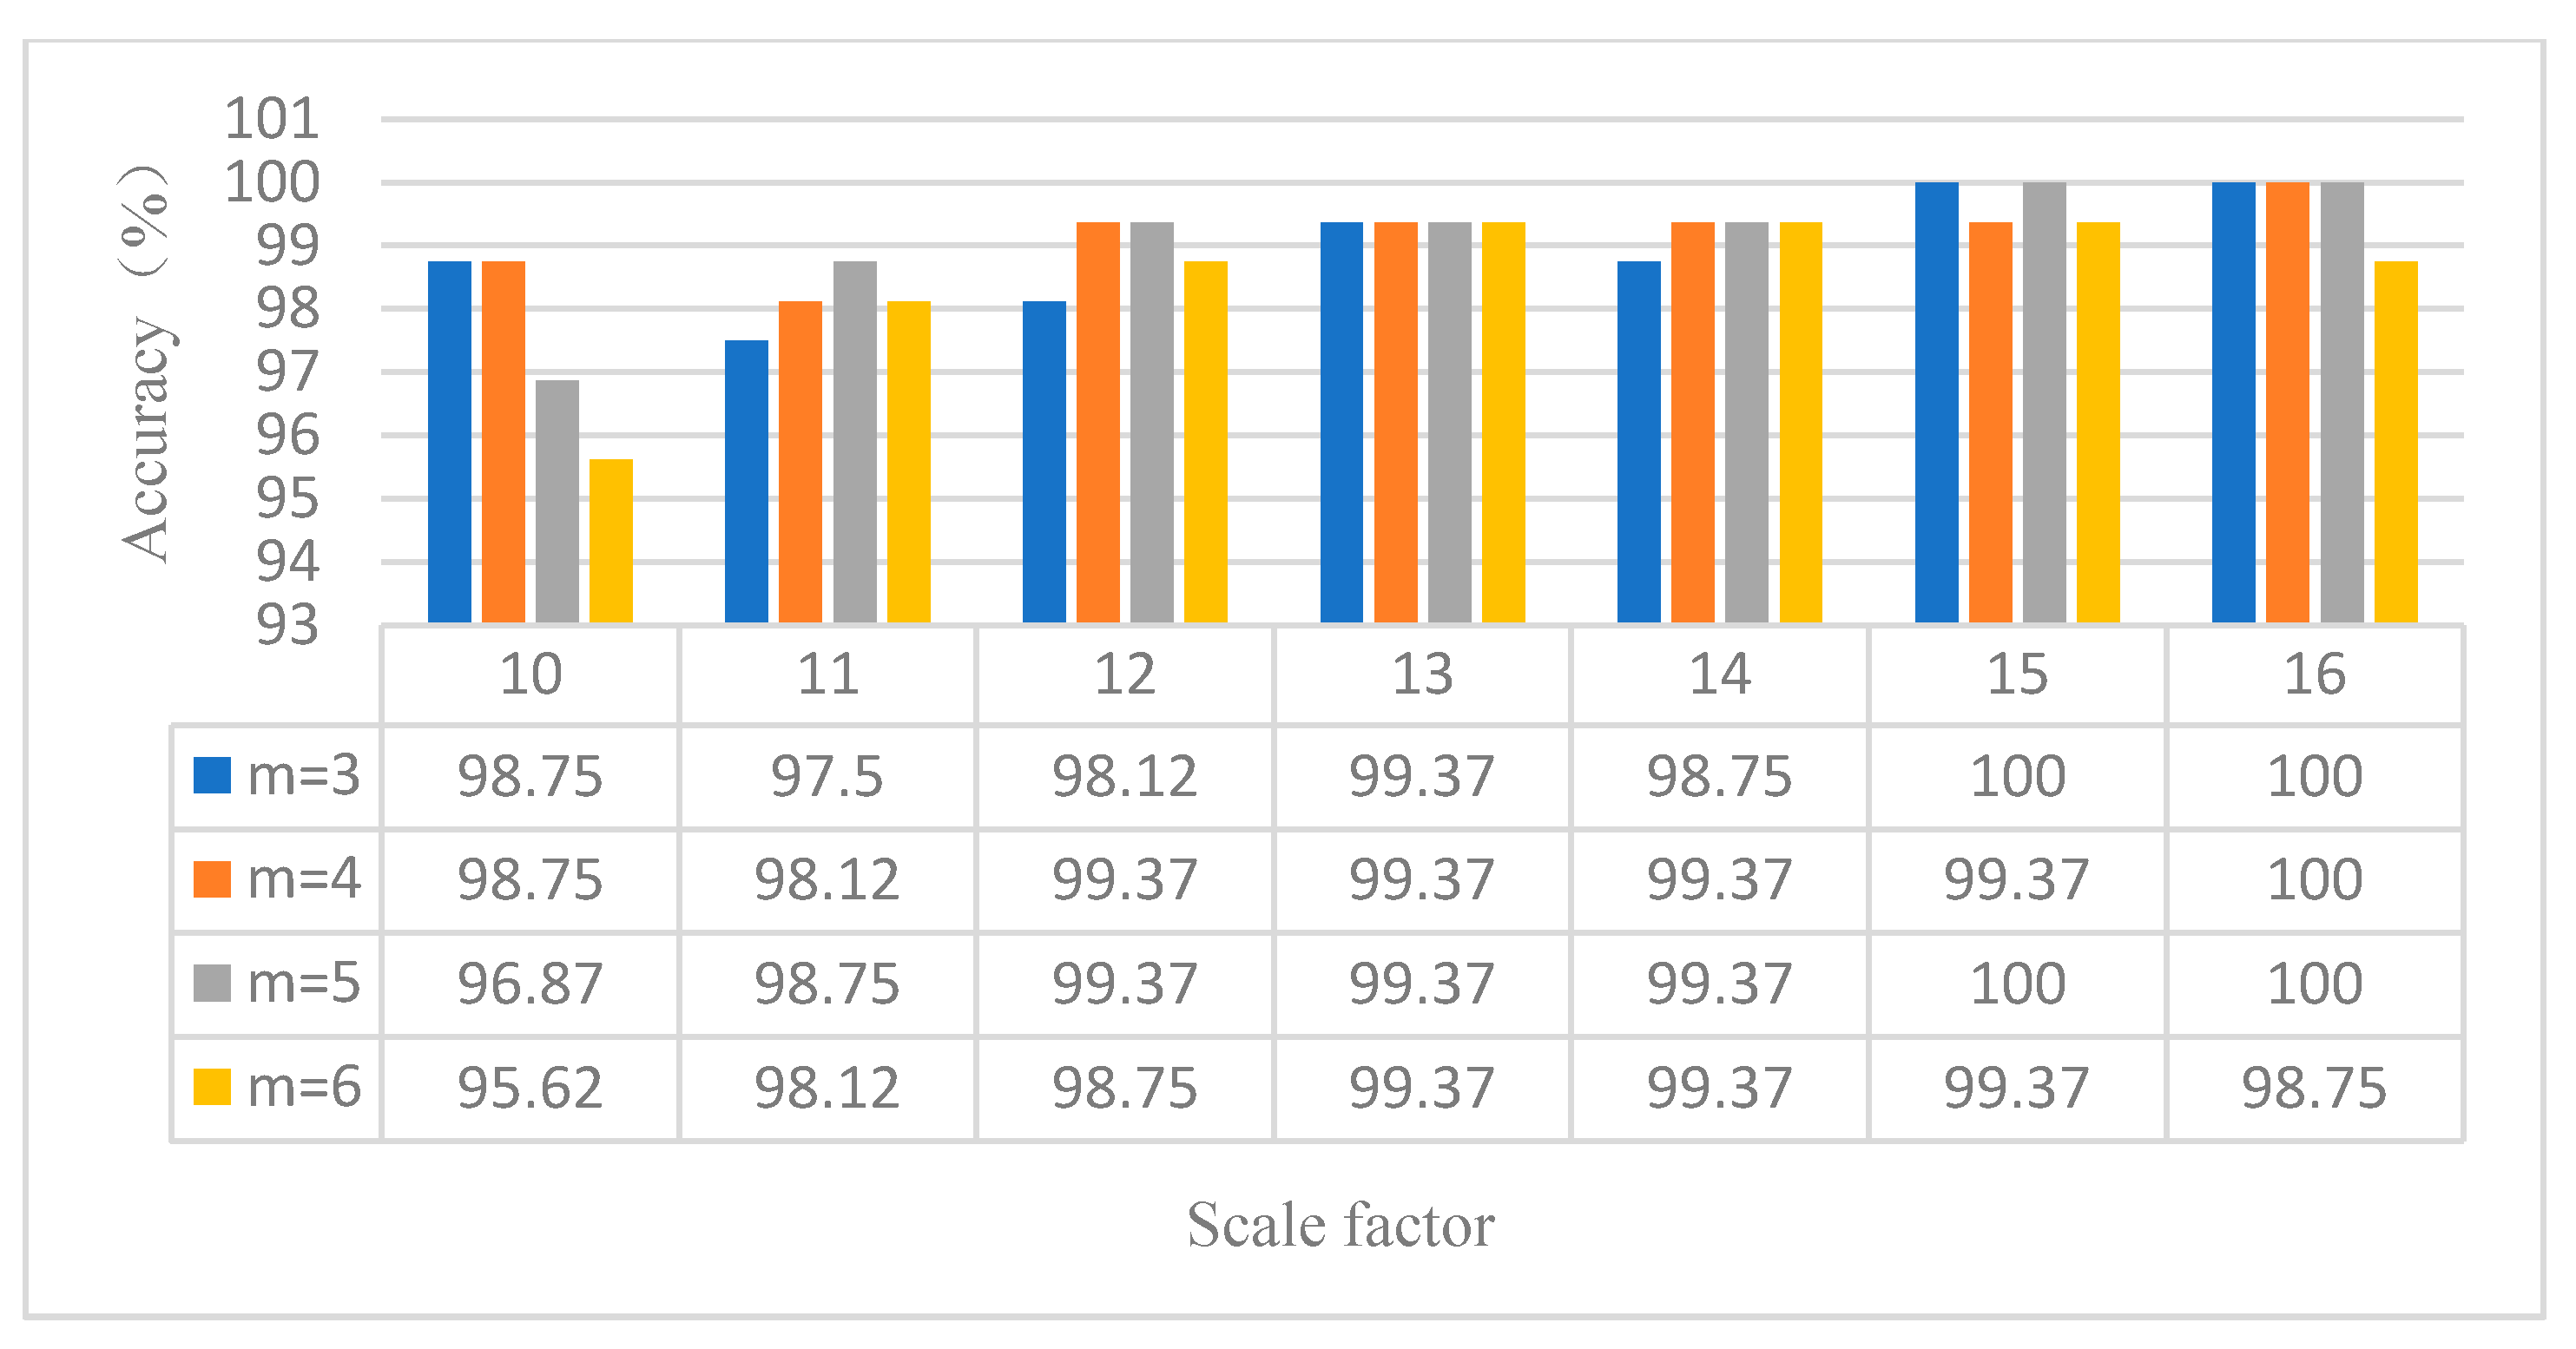
- The original time series is set as , and the new sequence is obtained by coarse granulation:where s represents the scale factor.
- is obtained by phase space reconstruction for each coarse-grained sequence :where represents the embedded dimension, and represents the delay time.
- Arrange the reconstructed time series in ascending order. There are possible permutations for the phase space embedded in m dimensions. Count the number of possible occurrences of the r-th permutation, denoted as , where . Then, the probability of the occurrences of the r-th permutation is
- Finally, the multiscale permutation entropy is obtained:
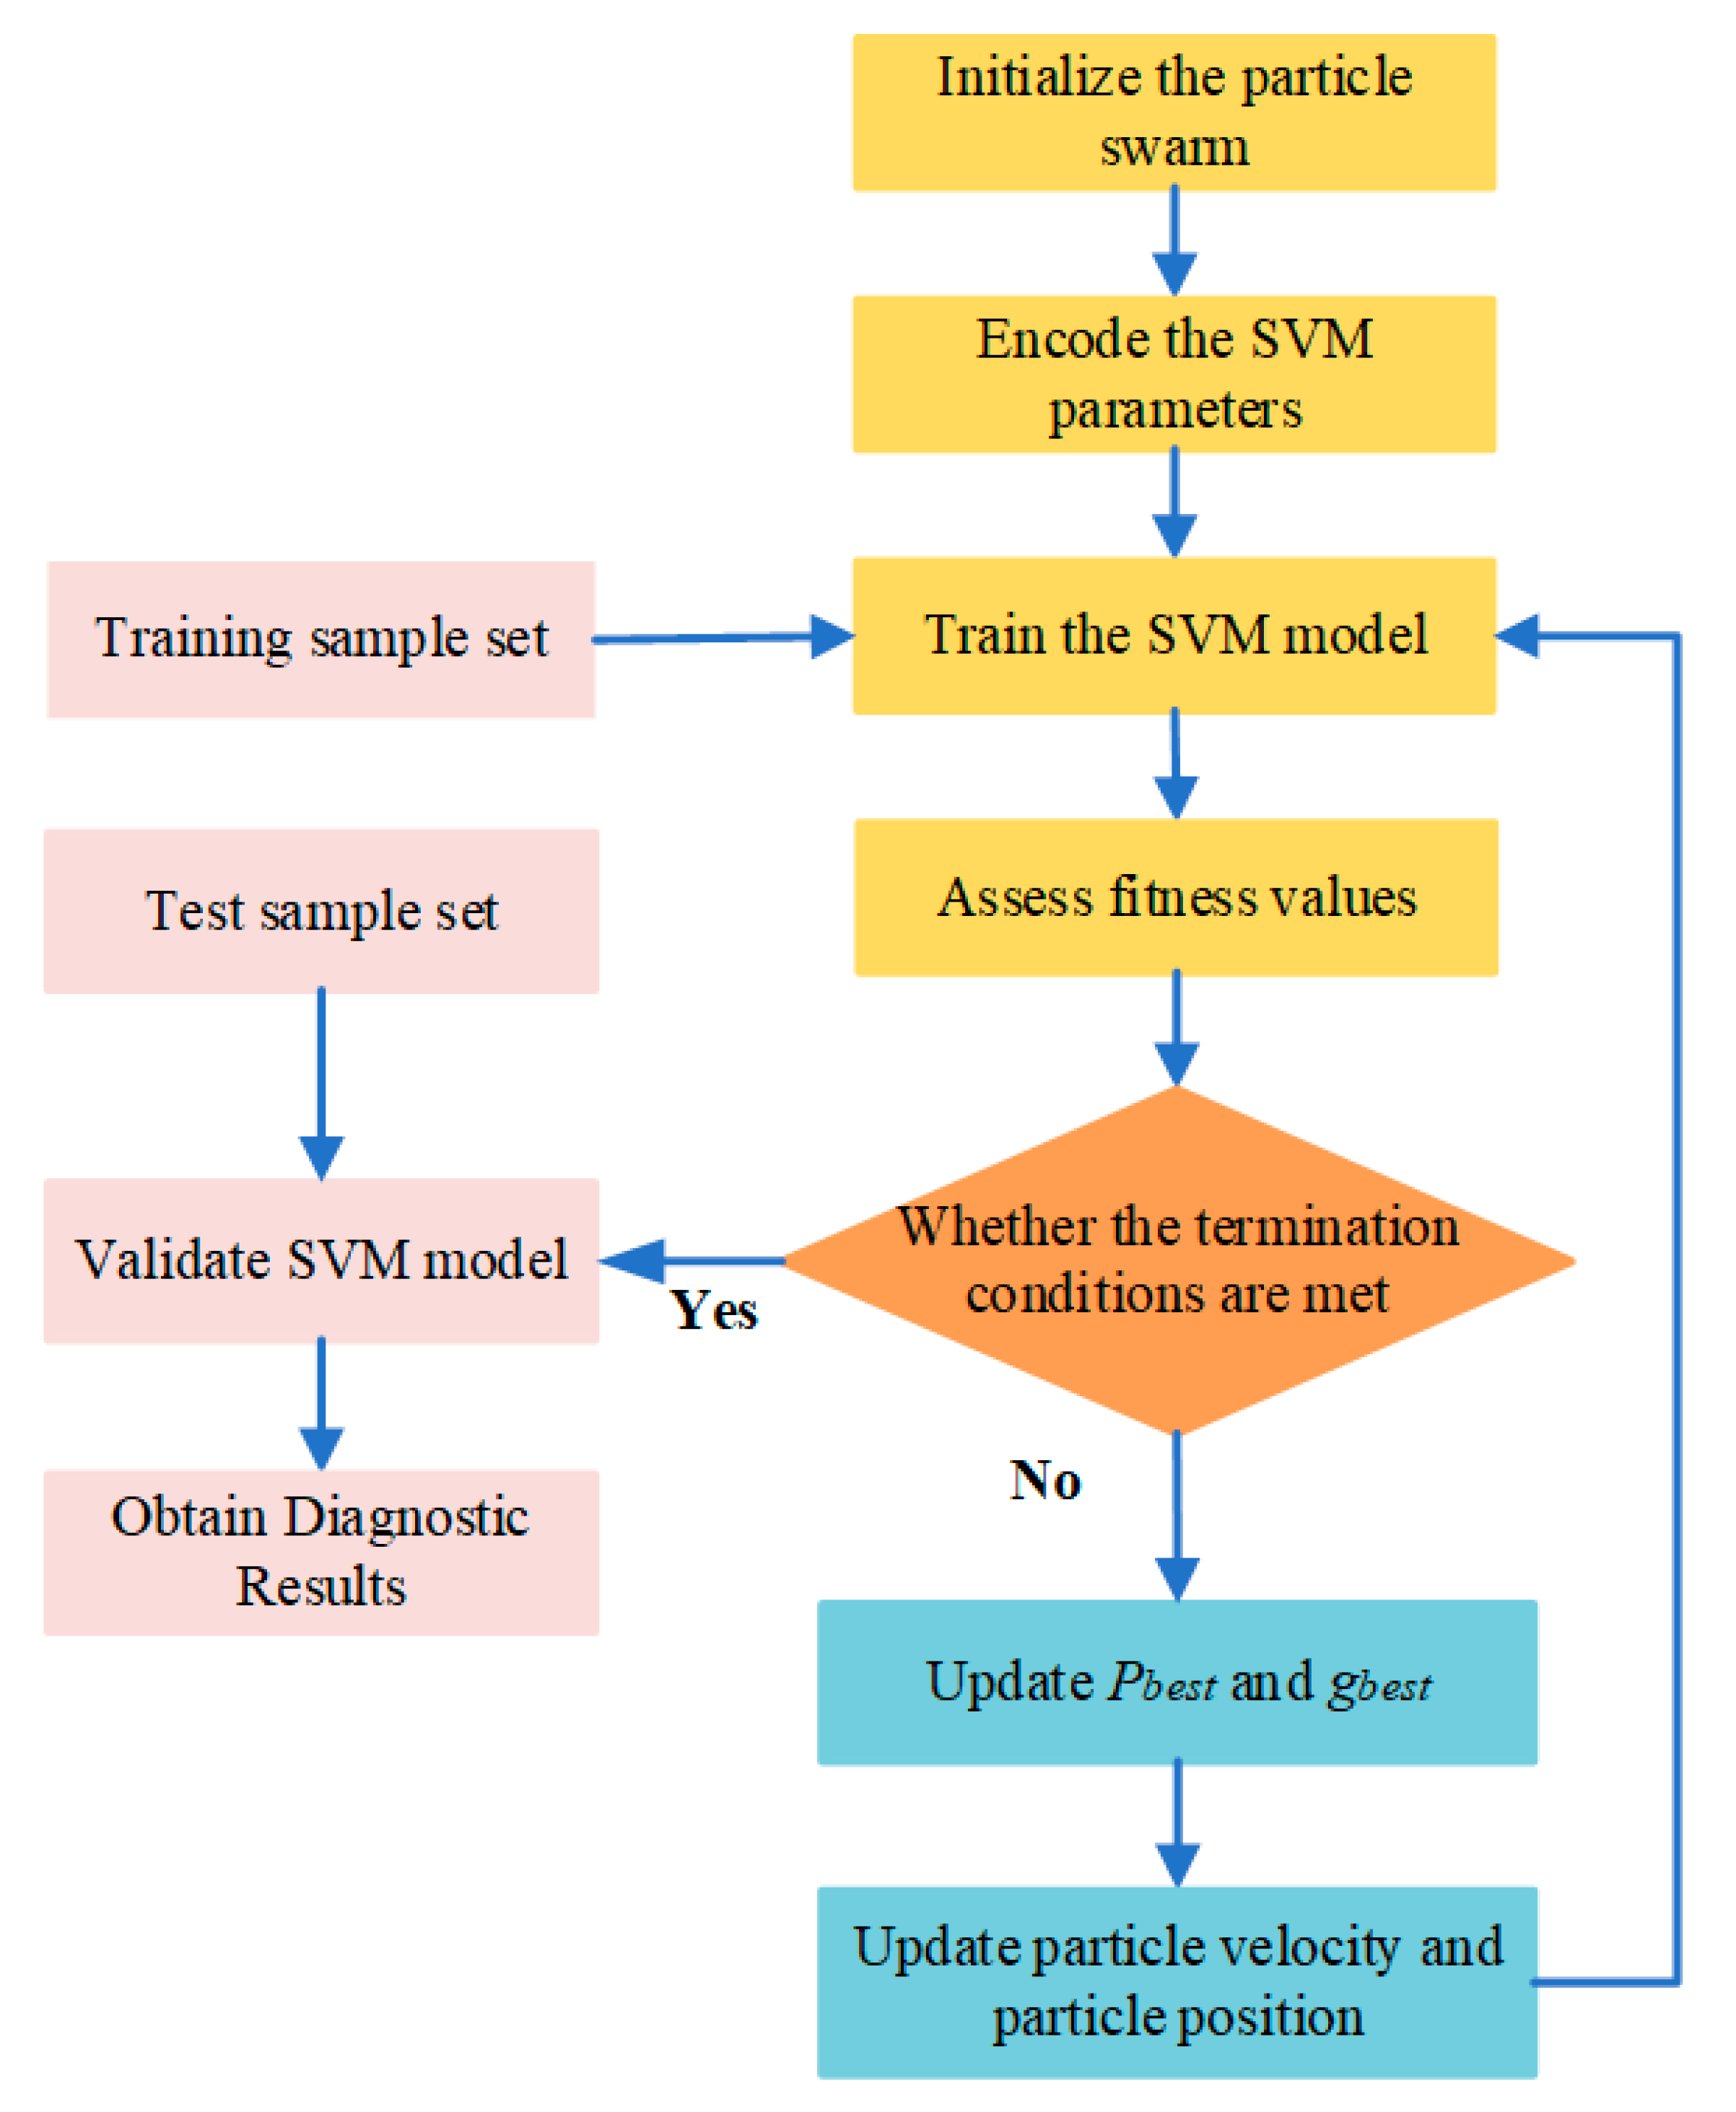
2.4. Particle Swarm Optimization-Based SVM
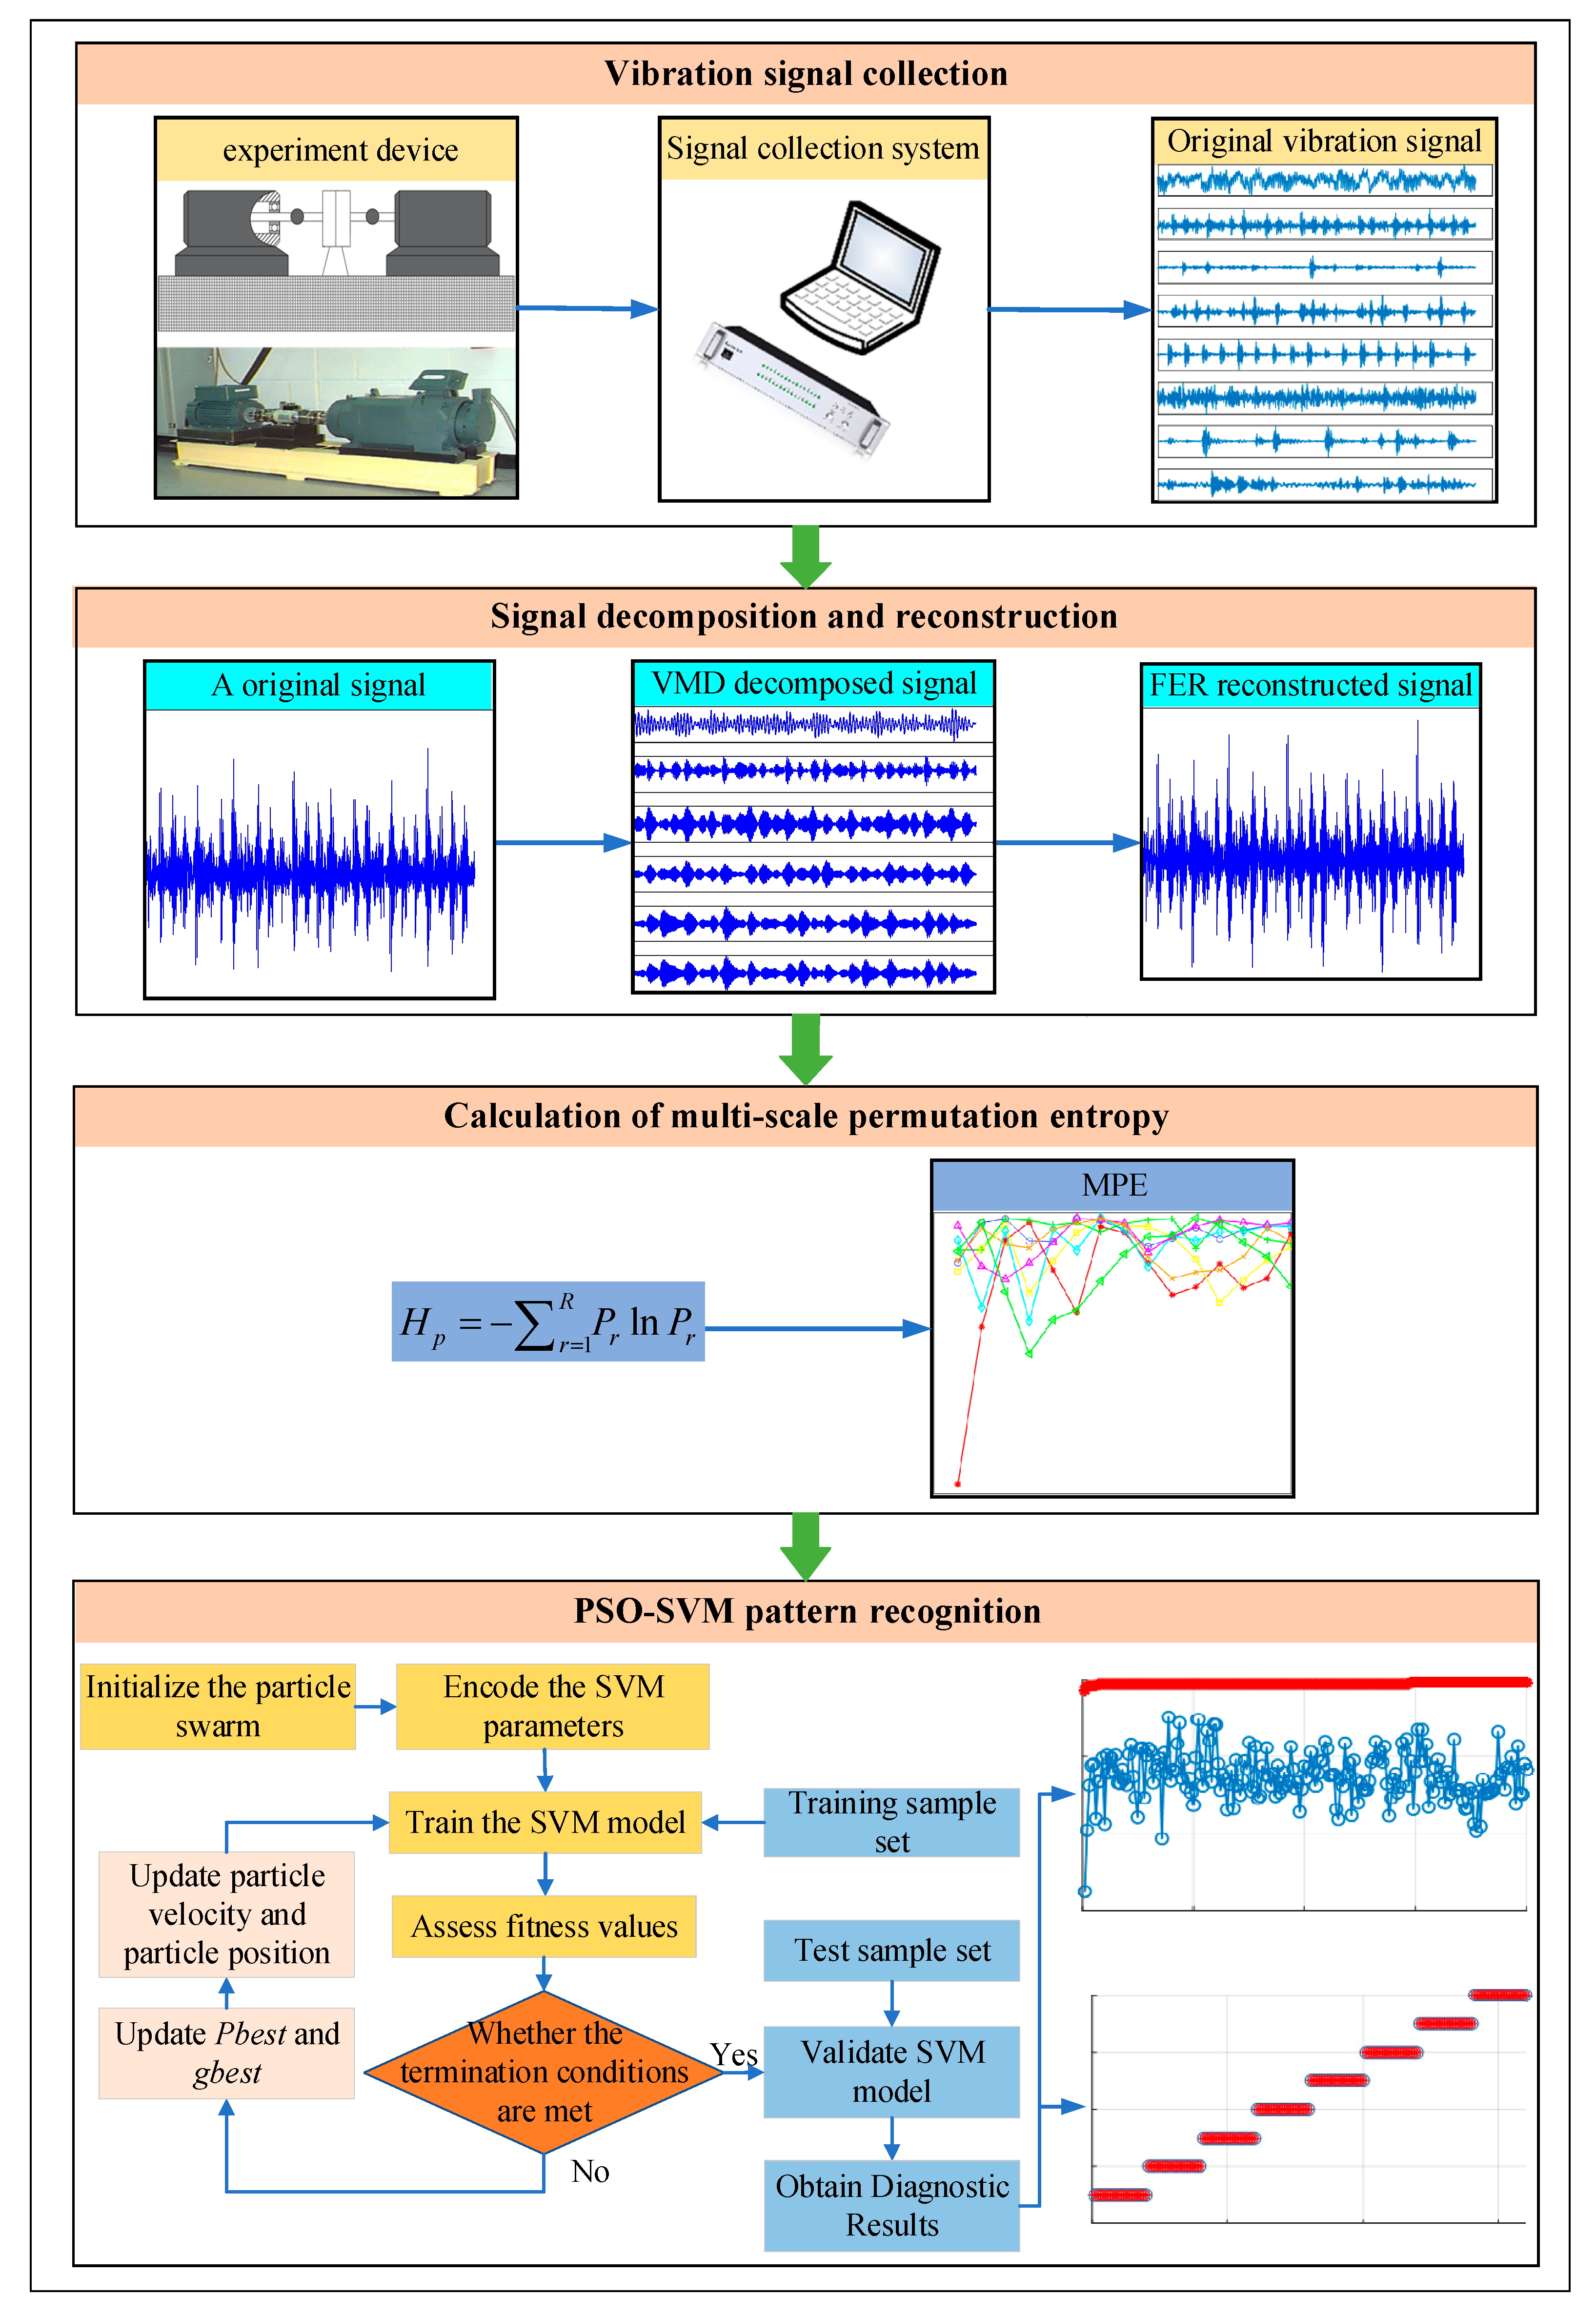
3. Rolling Bearing Fault Diagnosis Based on VMD-MPE and PSO-SVM
4. Experimental Verification
4.1. Case 1: Bearing Data from CWRU
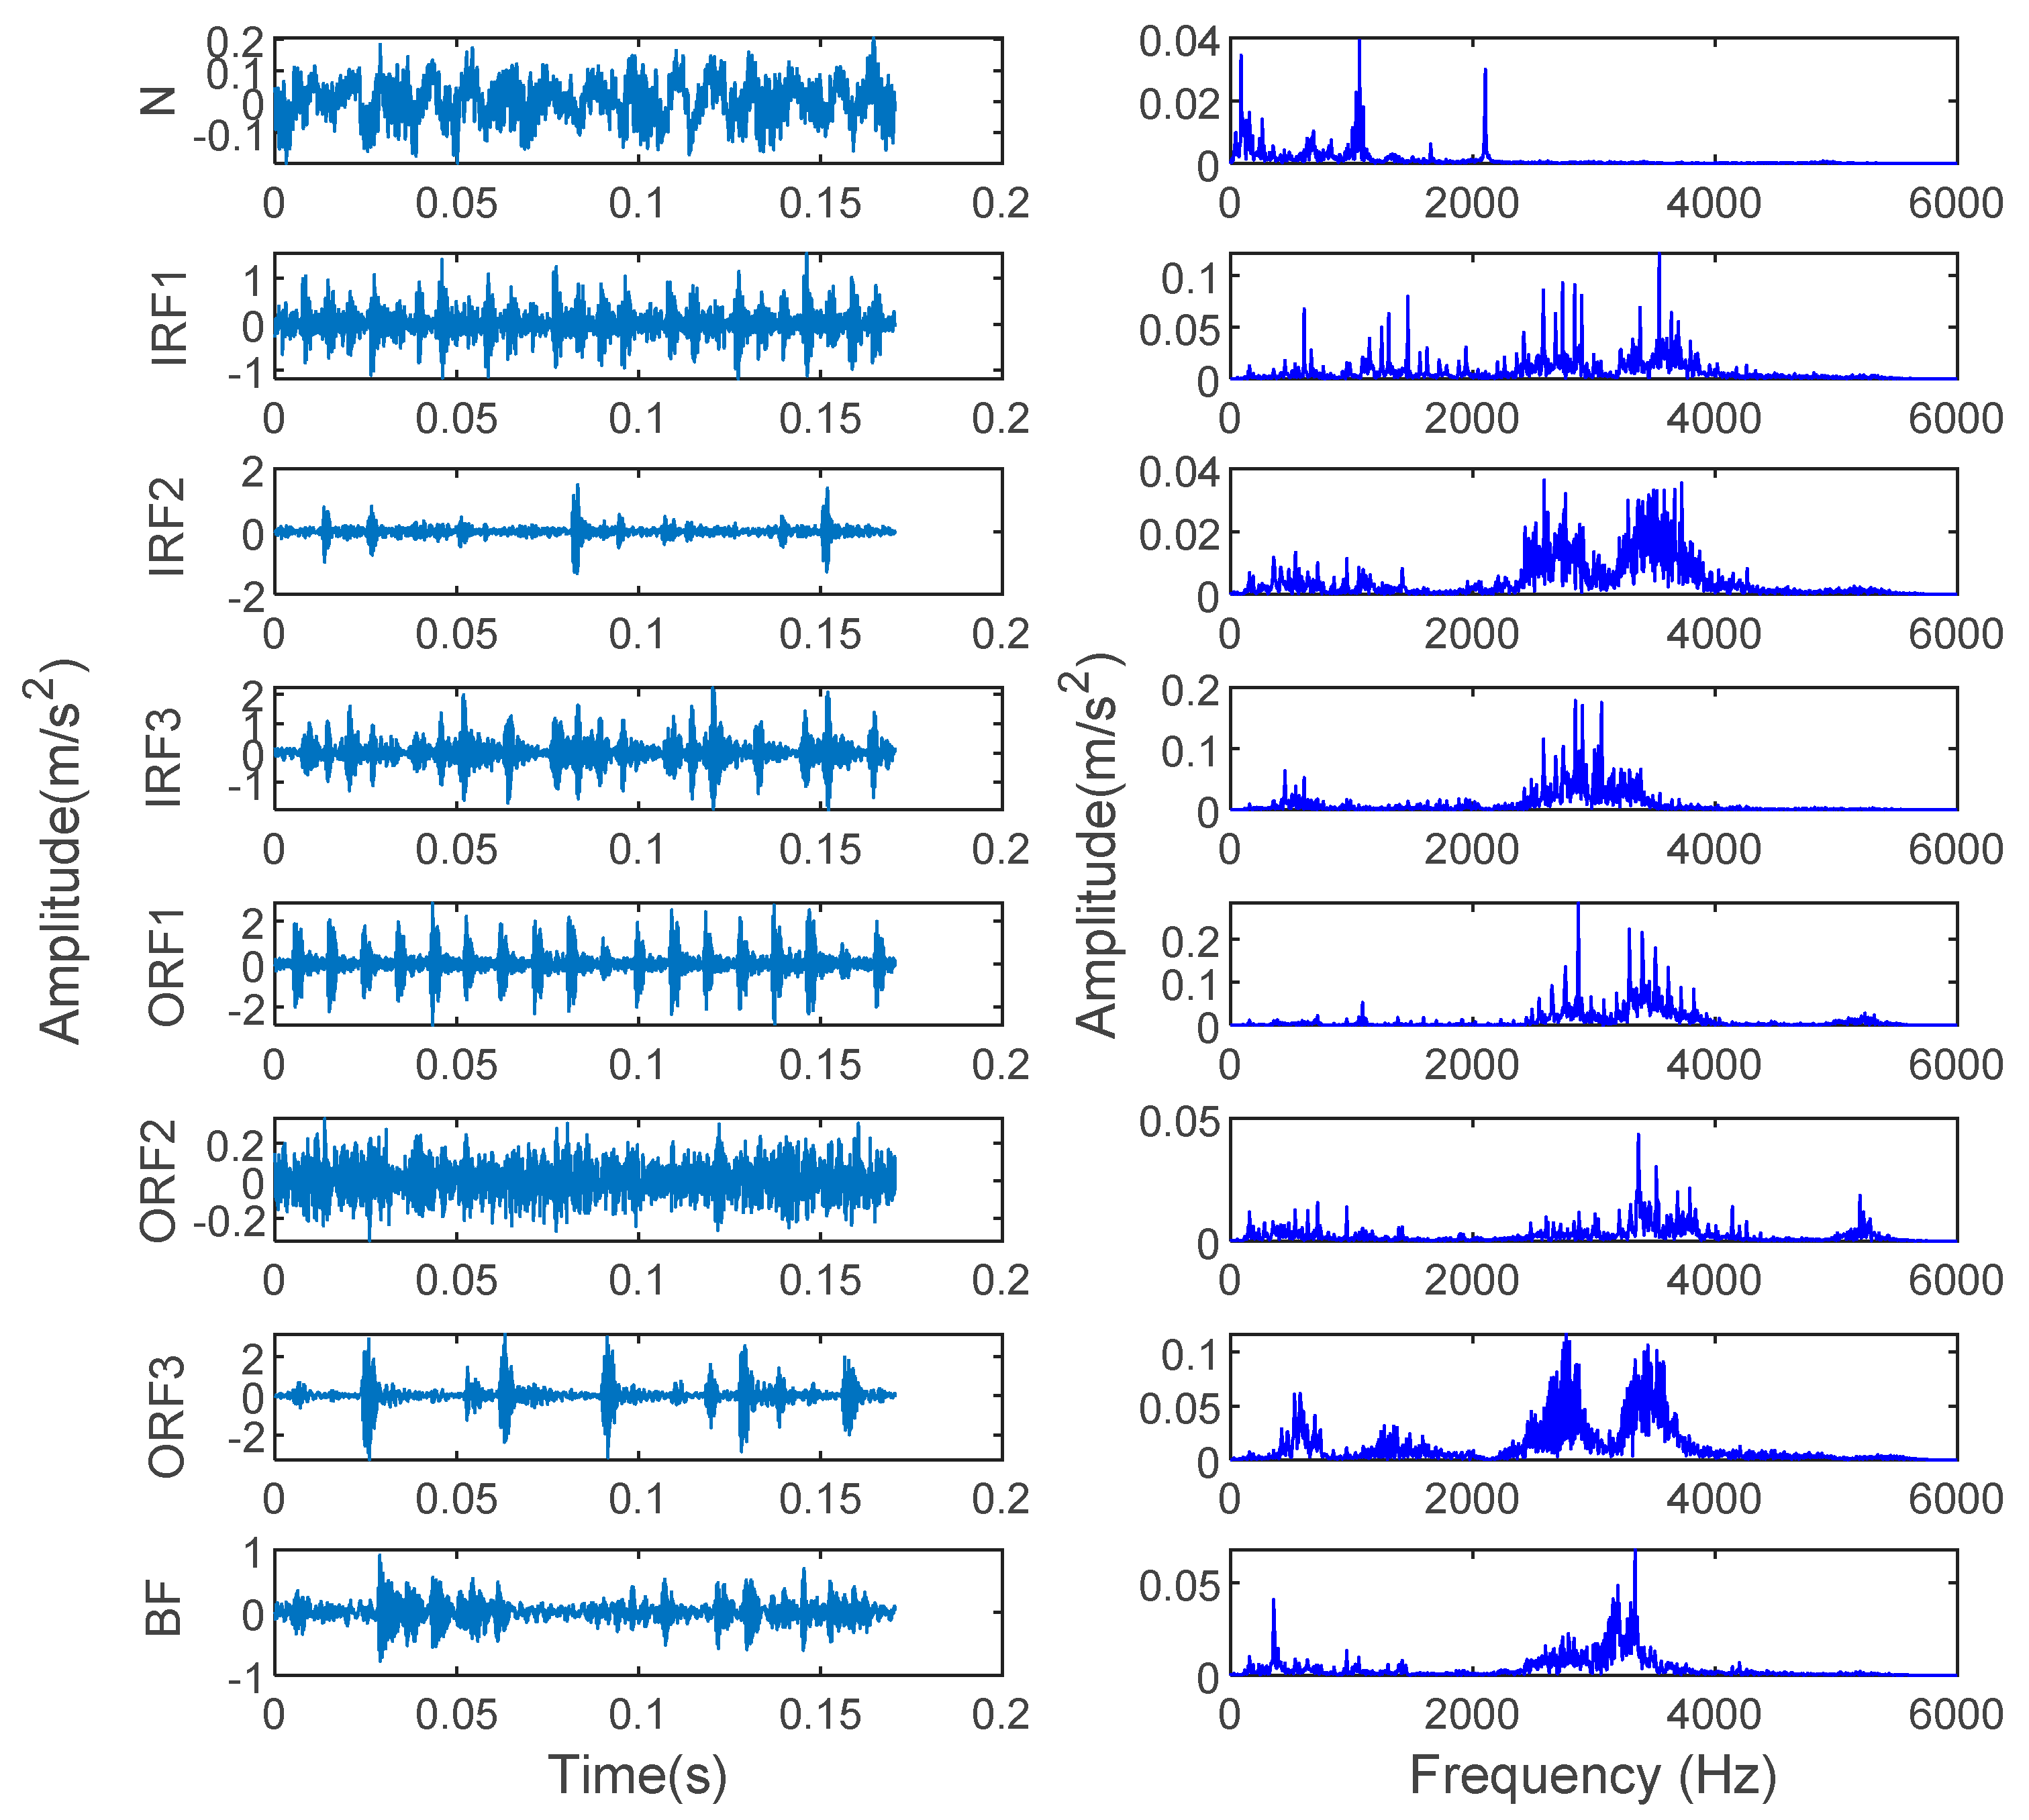
4.1.1. Data Collection and Sample Selection
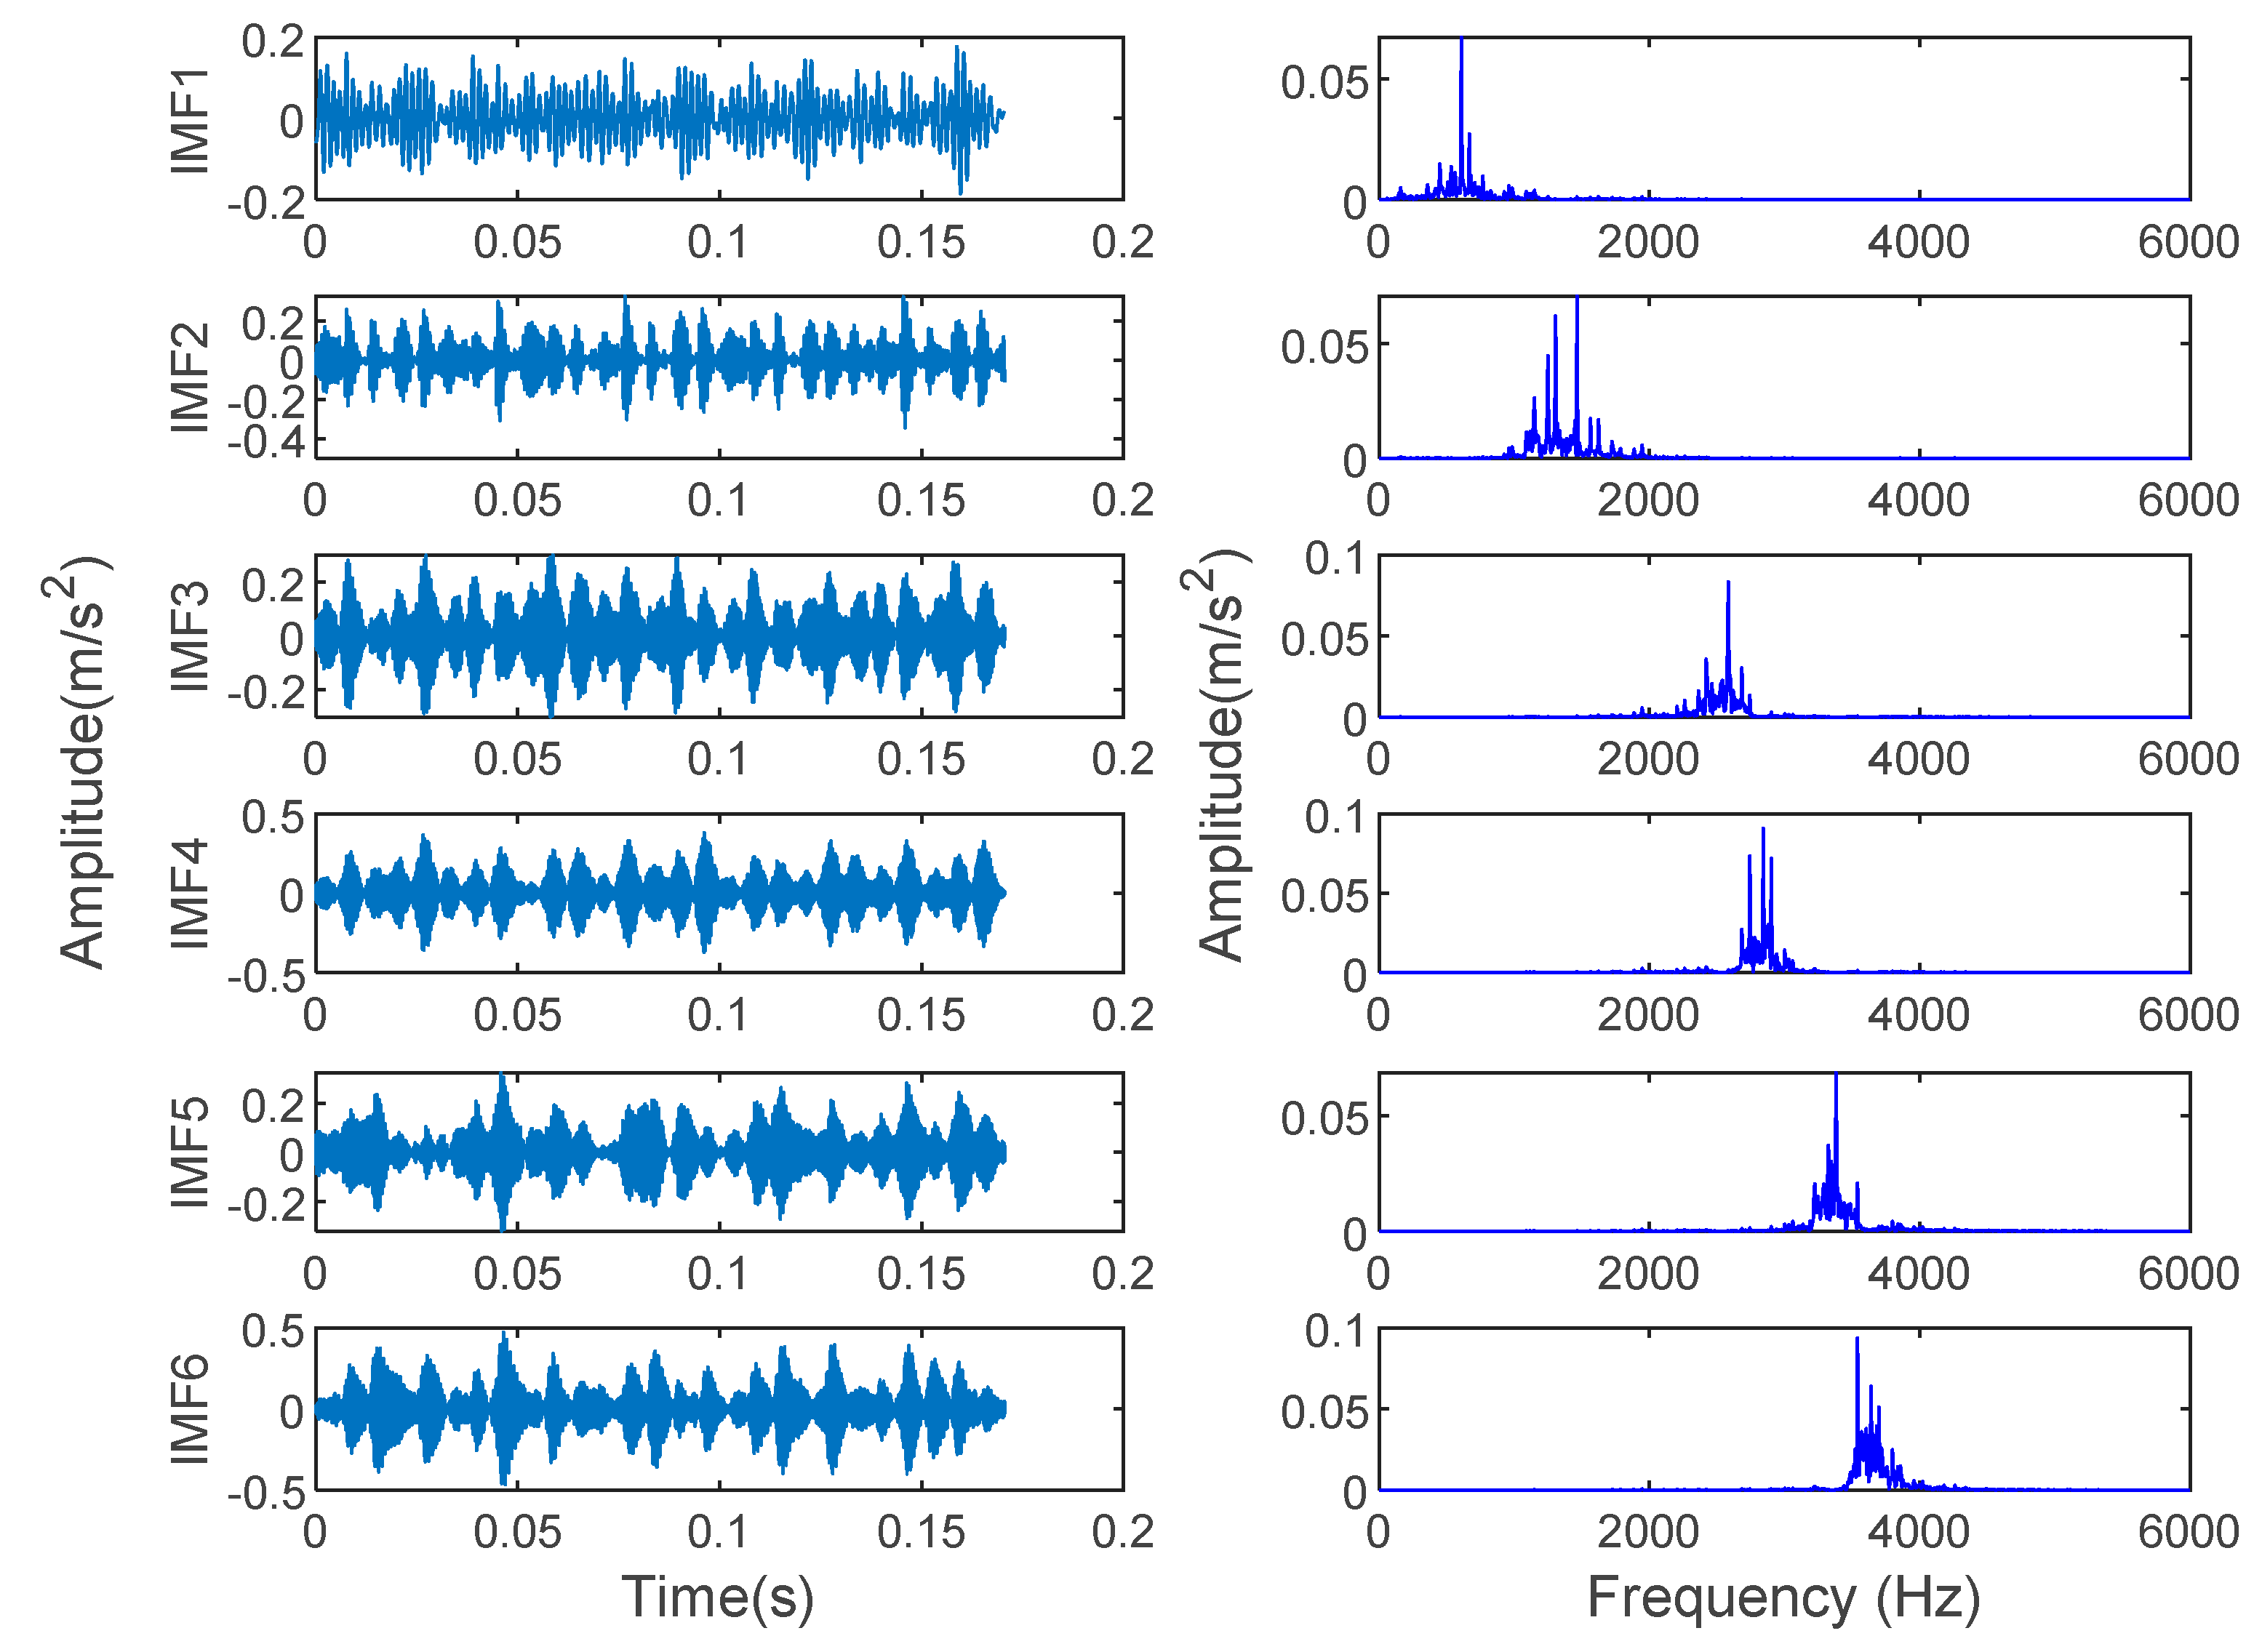
4.1.2. Fault Diagnosis Results and Comparative Analysis
4.2. Case 2: Bearing Data from Laboratory
4.2.1. Data Collection and Sample Selection
4.2.2. Fault Diagnosis Results and Comparative Analysis
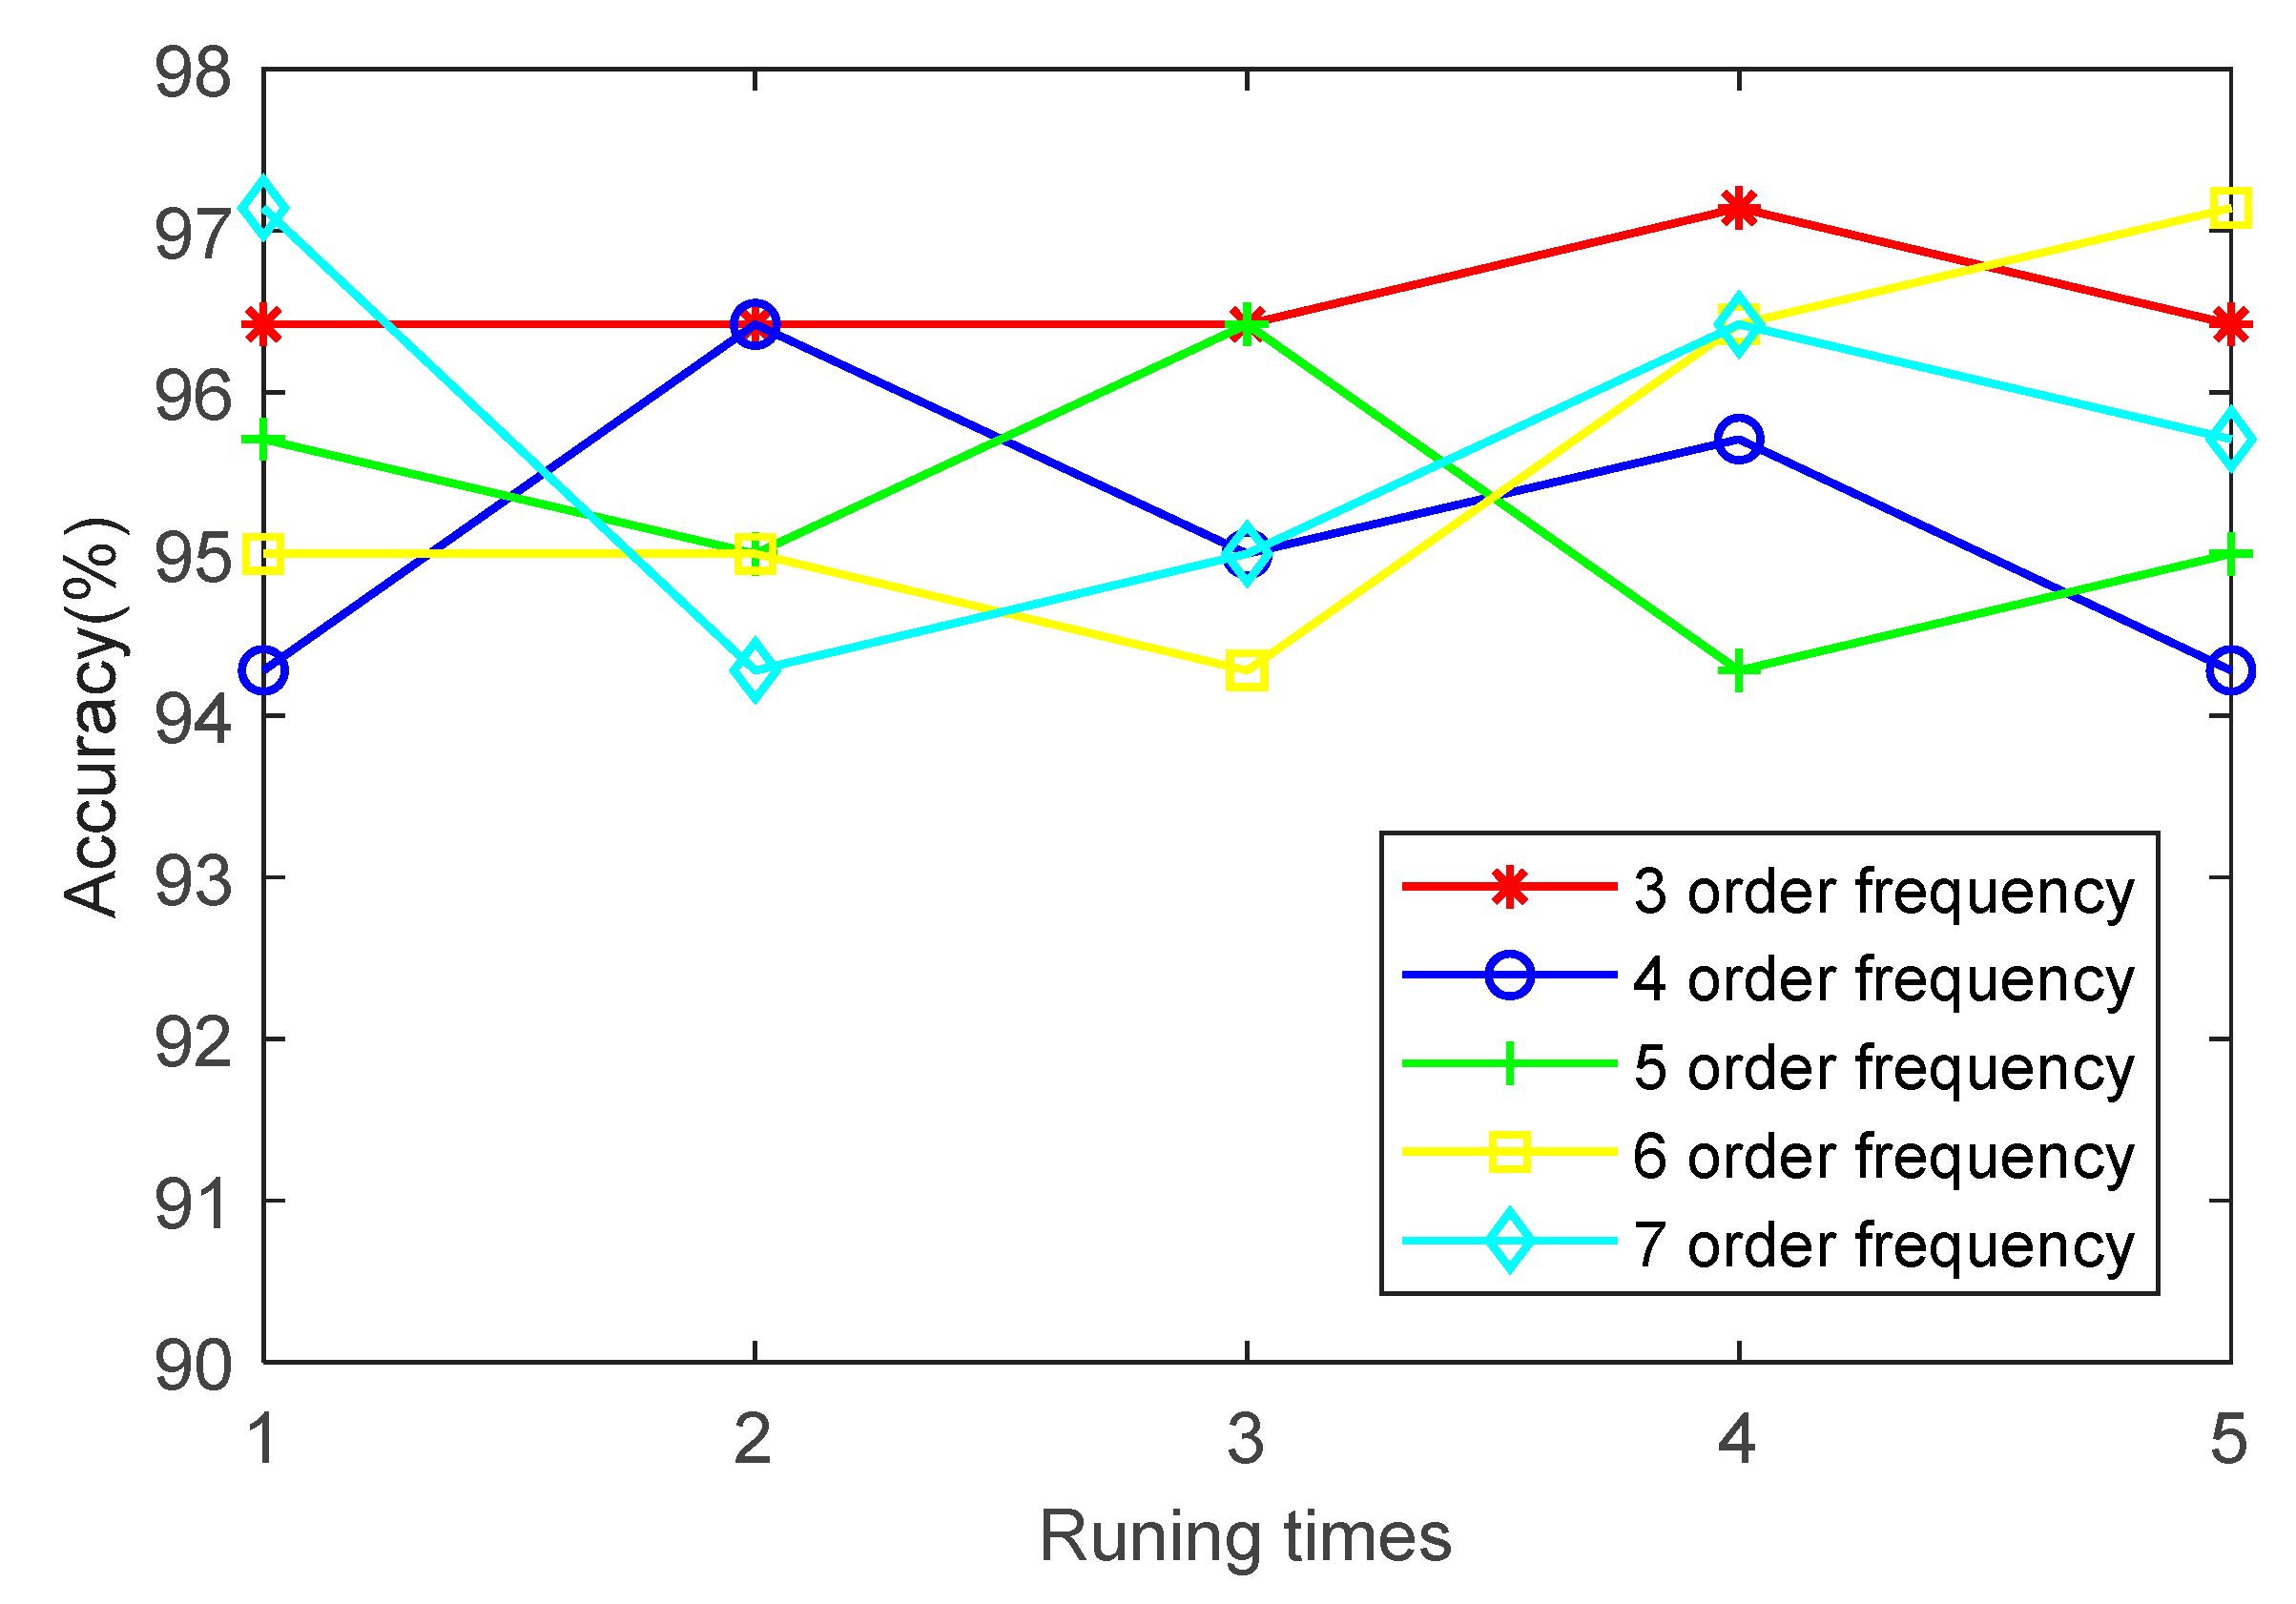
4.3. Further Discusses
5. Conclusions
Author Contributions
Funding
Data Availability Statement
Acknowledgments
Conflicts of Interest
Nomenclature
| VMD | Variational mode decomposition |
| WT | Wavelet transform |
| FER | Feature energy ratio |
| EMD | Empirical mode decomposition |
| SVM | Support vector machine |
| NB | Naive bayes |
| MSE | Multiscale sample entropy |
| IMF | Intrinsic mode functions |
| EEMD | Ensemble empirical mode decomposition |
| PE | Permutation entropy |
| DL | Deep learning |
| ANN | Artificial neural network |
| ELM | Extreme learning machine |
| WOA | Whale optimization algorithm |
| PSO | Particle swarm optimization |
| MFE | Multiscale fuzzy entropy |
| GA | Genetic algorithm |
| MPE | Multiscale permutation entropy |
| MFCNN | Multichannel fusion convolutional neural network |
| HMDSOF | Self-organizing fuzzy classifier based on harmonic mean difference |
| LMFO | Moth-flame optimization algorithm based on Lévy flight |
| GCMSDE | Generalized compound multiscale symbolic dynamic entropy |
References
- El Laithy, M.; Wang, L.; Harvey, T.J.; Vierneusel, B.; Correns, M.; Blass, T. Further understanding of rolling contact fatigue in rolling element bearings—A review. Tribol. Int. 2019, 140, 105849. [Google Scholar] [CrossRef]
- Liu, J.; Shao, Y. Overview of dynamic modelling and analysis of rolling element bearings with localized and distributed faults. Nonlinear Dyn. 2018, 93, 1765–1798. [Google Scholar] [CrossRef]
- Zhu, H.; Xie, C.; Fei, Y.; Tao, H. Attention mechanisms in CNN-based single image super-resolution: A brief review and a new perspective. Electronics 2021, 10, 1187. [Google Scholar] [CrossRef]
- Gao, Z.; Liu, X. An overview on fault diagnosis, prognosis and resilient control for wind turbine systems. Processes 2021, 9, 300. [Google Scholar] [CrossRef]
- Duan, L.; Xie, M.; Wang, J.; Bai, T. Deep learning enabled intelligent fault diagnosis: Overview and applications. J. Intell. Fuzzy Syst. 2018, 35, 5771–5784. [Google Scholar] [CrossRef]
- Huang, S.; Wang, X.; Li, C.; Kang, C. Data decomposition method combining permutation entropy and spectral substitution with ensemble empirical mode decomposition. Measurement 2019, 139, 438–453. [Google Scholar] [CrossRef]
- Wang, D.; Zhao, Y.; Yi, C.; Tsui, K.-L.; Lin, J. Sparsity guided empirical wavelet transform for fault diagnosis of rolling element bearings. Mech. Syst. Signal Process. 2018, 101, 292–308. [Google Scholar] [CrossRef]
- Li, H.; Liu, T.; Wu, X.; Chen, Q. An optimized VMD method and its applications in bearing fault diagnosis. Measurement 2020, 166, 108185. [Google Scholar] [CrossRef]
- Yan, X.; Liu, Y.; Zhang, W.; Jia, M.; Wang, X. Research on a novel improved adaptive variational mode decomposition method in rotor fault diagnosis. Appl. Sci-Basel 2020, 10, 1696. [Google Scholar] [CrossRef] [Green Version]
- Sun, S.; Przystupa, K.; Wei, M.; Yu, H.; Ye, Z.; Kochan, O. Fast bearing fault diagnosis of rolling element using Levy Moth-Flame optimization algorithm and Naive Bayes. Eksploat. Niezawodn. 2020, 22, 730–740. [Google Scholar] [CrossRef]
- Zhang, L.; Wang, Z.; Quan, L. Research on weak fault extraction method for alleviating the mode mixing of LMD. Entropy 2018, 20, 387. [Google Scholar] [CrossRef] [PubMed] [Green Version]
- Dragomiretskiy, K.; Zosso, D. Variational mode decomposition. IEEE Trans. Signal Process. 2014, 62, 531–544. [Google Scholar] [CrossRef]
- Li, H.; Chang, J.; Xu, F.; Liu, Z.; Yang, Z.; Zhang, L.; Zhang, S.; Mao, R.; Dou, X.; Liu, B. Efficient lidar signal denoising algorithm using variational mode decomposition combined with a whale optimization algorithm. Remote Sens. 2019, 11, 126. [Google Scholar] [CrossRef] [Green Version]
- Li, Y.; Li, G.; Wei, Y.; Liu, B.; Liang, X. Health condition identification of planetary gearboxes based on variational mode decomposition and generalized composite multi-scale symbolic dynamic entropy. ISA Trans. 2018, 81, 329–341. [Google Scholar] [CrossRef] [PubMed]
- Li, H.; Xie, J.; Wei, W. Permutation entropy and Lyapunov exponent: Detecting and monitoring the chaotic edge of a closed planar under-actuated system. Mech. Syst. Signal Process. 2019, 123, 206–221. [Google Scholar] [CrossRef]
- Li, J.; Shang, P.; Zhang, X. Financial time series analysis based on fractional and multiscale permutation entropy. Commun. Nonlinear Sci. Numer. Simul. 2019, 78, 104880. [Google Scholar] [CrossRef]
- Yin, Y.; Shang, P. Multivariate weighted multiscale permutation entropy for complex time series. Nonlinear Dynam. 2017, 88, 1707–1722. [Google Scholar] [CrossRef]
- Du, W.; Guo, X.; Wang, Z.; Wang, J.; Yu, M.; Li, C.; Wang, G.; Wang, L.; Guo, H.; Zhou, J.; et al. A new fuzzy logic classifier based on multiscale permutation entropy and its application in bearing fault diagnosis. Entropy 2020, 22, 27. [Google Scholar] [CrossRef] [Green Version]
- Li, H.; Huang, J.; Yang, X.; Luo, J.; Zhang, L.; Pang, Y. Fault diagnosis for rotating machinery using multiscale permutation entropy and convolutional neural networks. Entropy 2020, 22, 851. [Google Scholar] [CrossRef]
- Mocanu, D.C.; Mocanu, E.; Stone, P.; Nguyen, P.H.; Gibescu, M.; Liotta, A. Scalable training of artificial neural networks with adaptive sparse connectivity inspired by network science. Nat. Commun. 2018, 9, 2383. [Google Scholar] [CrossRef] [Green Version]
- Yan, X.; Liu, Y.; Ding, P.; Jia, M. Fault diagnosis of rolling-element bearing using multiscale pattern gradient spectrum entropy coupled with laplacian score. Complexity 2020, 2020, 4032628. [Google Scholar] [CrossRef] [Green Version]
- Zhou, Z.; Chen, J.; Zhu, Z. Regularization incremental extreme learning machine with random reduced kernel for regression. Neurocomputing 2018, 321, 72–81. [Google Scholar] [CrossRef]
- Wang, Z.; Yao, L.; Cai, Y.; Zhang, J. Mahalanobis semi-supervised mapping and beetle antennae search based support vector machine for wind turbine rolling bearings fault diagnosis. Renew. Energy 2020, 155, 1312–1327. [Google Scholar] [CrossRef]
- Yan, X.; Liu, Y.; Xu, Y.; Jia, M. Multistep forecasting for diurnal wind speed based on hybrid deep learning model with improved singular spectrum decomposition. Energy Convers. Manag. 2020, 225, 113456. [Google Scholar] [CrossRef]
- Mao, X.; Wang, Z.; Crossley, P.; Jarman, P.; Fieldsend-Roxborough, A.; Wilson, G. Transformer winding type recognition based on FRA data and a support vector machine model. High Volt. 2020, 5, 704–715. [Google Scholar] [CrossRef]
- Arrieta Paternina, M.R.; Tripathy, R.K.; Zamora-Mendez, A.; Dotta, D. Identification of electromechanical oscillatory modes based on variational mode decomposition. Electr. Power Syst. Res. 2019, 167, 71–85. [Google Scholar] [CrossRef]
- Si, L.; Wang, Z.; Tan, C.; Liu, X. A feature extraction method based on composite multi-scale permutation entropy and Laplacian score for shearer cutting state recognition. Measurement 2019, 145, 84–93. [Google Scholar] [CrossRef]
- Zhang, B.; Wang, X.; Wang, H. Virtual machine placement strategy using cluster-based genetic algorithm. Neurocomputing 2021, 428, 310–316. [Google Scholar] [CrossRef]
- Cai, X.; Gao, L.; Li, F. Sequential approximation optimization assisted particle swarm optimization for expensive problems. Appl. Soft Comput. 2019, 83, 105659. [Google Scholar] [CrossRef]
- Li, X.; Wu, S.; Li, X.; Yuan, H.; Zhao, D. Particle swarm optimization-support vector machine model for machinery fault diagnoses in high-voltage circuit breakers. Chin. J. Mech. Eng. 2020, 33, 6. [Google Scholar] [CrossRef] [Green Version]
- Xue, S.; Tan, J.; Shi, L.; Deng, J. Rope tension fault diagnosis in hoisting systems based on vibration signals using EEMD, improved permutation entropy, and PSO-SVM. Entropy 2020, 22, 209. [Google Scholar] [CrossRef] [PubMed] [Green Version]
- Liu, T.; Yao, W.; Wu, M.; Shi, Z.; Wang, J.; Ning, X. Multiscale permutation entropy analysis of electrocardiogram. Phys. A 2017, 471, 492–498. [Google Scholar] [CrossRef]
- Zunino, L.; Olivares, F.; Scholkmann, F.; Rosso, O.A. Permutation entropy based time series analysis: Equalities in the input signal can lead to false conclusions. Phys. Lett. A 2017, 381, 1883–1892. [Google Scholar] [CrossRef] [Green Version]
- Xie, C.; Liu, Y.; Zeng, W.; Lu, X. An improved method for single image super-resolution based on deep learning. Signal Image Video Process. 2019, 13, 557–565. [Google Scholar] [CrossRef]
- Xie, C.; Zeng, W.; Lu, X. Fast single-image super-resolution via deep network with component learning. IEEE Trans. Circuits Syst. Video Technol. 2019, 29, 3473–3486. [Google Scholar] [CrossRef]




| Fault Type | Fault Size/mm | Number of Training Samples | Number of Test Samples | Category Label |
|---|---|---|---|---|
| Normal (N) | 0 | 30 | 20 | 1 |
| IRF1 | 0.1778 | 30 | 20 | 2 |
| IRF2 | 0.3556 | 30 | 20 | 3 |
| IRF3 | 0.5334 | 30 | 20 | 4 |
| ORF1 | 0.1778 | 30 | 20 | 5 |
| ORF2 | 0.3556 | 30 | 20 | 6 |
| ORF3 | 0.5334 | 30 | 20 | 7 |
| BF | 0.3556 | 30 | 20 | 8 |
| IMF | |||
|---|---|---|---|
| 1 | 0.1320 | 0.1150 | 0.4243 |
| 2 | 0.3111 | 0.2711 | 1 |
| 3 | 0.2098 | 0.1828 | 0.6742 |
| 4 | 0.2395 | 0.2087 | 0.7698 |
| 5 | 0.1050 | 0.0915 | 0.3377 |
| 6 | 0.1497 | 0.1304 | 0.4811 |
| Training Samples Ratio | 20% | 30% | 40% | 50% | 60% |
| Identification Accuracy (%) | 93.75 | 95.00 | 96.25 | 98.50 | 100 |
| Feature Extraction Method | Identification Accuracy (%) | Average Identification Accuracy (%) | Standard Deviation | ||||
|---|---|---|---|---|---|---|---|
| 1 | 2 | 3 | 4 | 5 | |||
| VMD-MPE | 100 | 100 | 100 | 100 | 99.37 | 99.87 | 0.06 |
| EMD-MPE | 98.75 | 98.12 | 98.75 | 98.75 | 98.12 | 98.49 | 0.10 |
| WT-MPE | 41.25 | 41.25 | 41.87 | 41.25 | 41.87 | 41.64 | 0.11 |
| VMD-MSE | 93.75 | 92.50 | 94.37 | 92.50 | 92.50 | 93.12 | 0.62 |
| VMD-MFE | 93.75 | 94.37 | 94.37 | 95.00 | 95.62 | 94.62 | 0.41 |
| Classifier | Penalty Parameter c | Nuclear Parameter g | Identification Accuracy (%) |
|---|---|---|---|
| PSO-SVM | 20.42 | 6.35 | 100 |
| SVM | 4.36 | 10 | 96.25 |
| 22 | 70.17 | 62.50 | |
| 48.25 | 51.36 | 70.62 | |
| 90 | 35 | 80.62 | |
| 30 | 100 | 51.87 |
| Fault Diagnosis Method | Identification Accuracy (%) | Average Identification Accuracy (%) | ||||
|---|---|---|---|---|---|---|
| 1 | 2 | 3 | 4 | 5 | ||
| VMD-MPE-PSOSVM | 100 | 100 | 100 | 100 | 99.37 | 99.87 |
| MPE-PSOSVM | 93.75 | 90.62 | 95.00 | 92.50 | 95.00 | 93.37 |
| Bearing Type | Inside Diameter | Roll Diameter | Outside Diameter | Number of the Roller | Contact Angle (°) |
|---|---|---|---|---|---|
| HRB 6205 | 25 mm | 7.94 mm | 52 mm | 9 | 0 |
| The Fault Types | Number of Training Samples | Number of Test Samples | Category Label |
|---|---|---|---|
| Normal (N) | 30 | 20 | 1 |
| ORF | 30 | 20 | 2 |
| IRF | 30 | 20 | 3 |
| BF | 30 | 20 | 4 |
| OIF | 30 | 20 | 5 |
| OBF | 30 | 20 | 6 |
| OIBF | 30 | 20 | 7 |
| IMF | |||
|---|---|---|---|
| 1 | 0.0146 | 0.2139 | 0.6691 |
| 2 | 0.0094 | 0.1385 | 0.4332 |
| 3 | 0.0078 | 0.1150 | 0.3597 |
| 4 | 0.0219 | 0.3198 | 1.0000 |
| 5 | 0.0051 | 0.0739 | 0.2311 |
| 6 | 0.0095 | 0.1386 | 0.4336 |
| Training Sample Ratio | 20% | 30% | 40% | 50% | 60% |
| Identification Accuracy (%) | 79.64 | 86.50 | 90.00 | 89.14 | 96.42 |
| Feature Extraction Method | Identification Accuracy (%) | Average Identification Accuracy (%) | Standard Deviation | ||||
|---|---|---|---|---|---|---|---|
| 1 | 2 | 3 | 4 | 5 | |||
| VMD-MPE | 96.42 | 96.42 | 96.42 | 97.14 | 96.42 | 96.56 | 0.08 |
| EMD-MPE | 32.85 | 32.85 | 28.57 | 32.85 | 32.85 | 31.99 | 2.93 |
| WT-MPE | 88.57 | 90.00 | 90.00 | 88.57 | 87.87 | 89.00 | 0.73 |
| VMD-MSE | 85.70 | 84.28 | 82.14 | 82.14 | 84.28 | 83.71 | 1.91 |
| VMD-MFE | 80.71 | 82.14 | 80.71 | 81.42 | 80.71 | 81.14 | 0.33 |
| Classifier | Penalty Parameter c | Nuclear Parameter g | Identification Accuracy (%) |
|---|---|---|---|
| PSO-SVM | 100 | 0.17 | 96.42 |
| SVM | 31.23 | 15.46 | 77.87 |
| 58 | 5 | 92.14 | |
| 42 | 49.87 | 48.57 | |
| 89 | 30 | 63.57 | |
| 98.52 | 81 | 35.00 |
| Fault Diagnosis Method | Identification Accuracy (%) | Average Identification Accuracy (%) | ||||
|---|---|---|---|---|---|---|
| 1 | 2 | 3 | 4 | 5 | ||
| VMD-MPE-PSOSVM | 96.42 | 96.42 | 96.42 | 97.14 | 96.42 | 96.56 |
| MPE-PSOSVM | 90.00 | 91.42 | 89.28 | 91.42 | 89.28 | 90.28 |
Publisher’s Note: MDPI stays neutral with regard to jurisdictional claims in published maps and institutional affiliations. |
© 2021 by the authors. Licensee MDPI, Basel, Switzerland. This article is an open access article distributed under the terms and conditions of the Creative Commons Attribution (CC BY) license (https://creativecommons.org/licenses/by/4.0/).
Share and Cite
Ye, M.; Yan, X.; Jia, M. Rolling Bearing Fault Diagnosis Based on VMD-MPE and PSO-SVM. Entropy 2021, 23, 762. https://doi.org/10.3390/e23060762
Ye M, Yan X, Jia M. Rolling Bearing Fault Diagnosis Based on VMD-MPE and PSO-SVM. Entropy. 2021; 23(6):762. https://doi.org/10.3390/e23060762
Chicago/Turabian StyleYe, Maoyou, Xiaoan Yan, and Minping Jia. 2021. "Rolling Bearing Fault Diagnosis Based on VMD-MPE and PSO-SVM" Entropy 23, no. 6: 762. https://doi.org/10.3390/e23060762
APA StyleYe, M., Yan, X., & Jia, M. (2021). Rolling Bearing Fault Diagnosis Based on VMD-MPE and PSO-SVM. Entropy, 23(6), 762. https://doi.org/10.3390/e23060762


