5.2.1. Performance Simulation of the Chaotic Mapping
In order to further illustrate the advantages of the chaotic map proposed in this paper, the typical one-dimensional chaotic maps, including the Tent, logistic, Chebyshev, and cubic maps, were selected and compared with the proposed map. We analyzed and compared the bifurcation diagrams, maximum Lyapunov exponents, approximate entropies and balances of the chaotic maps.
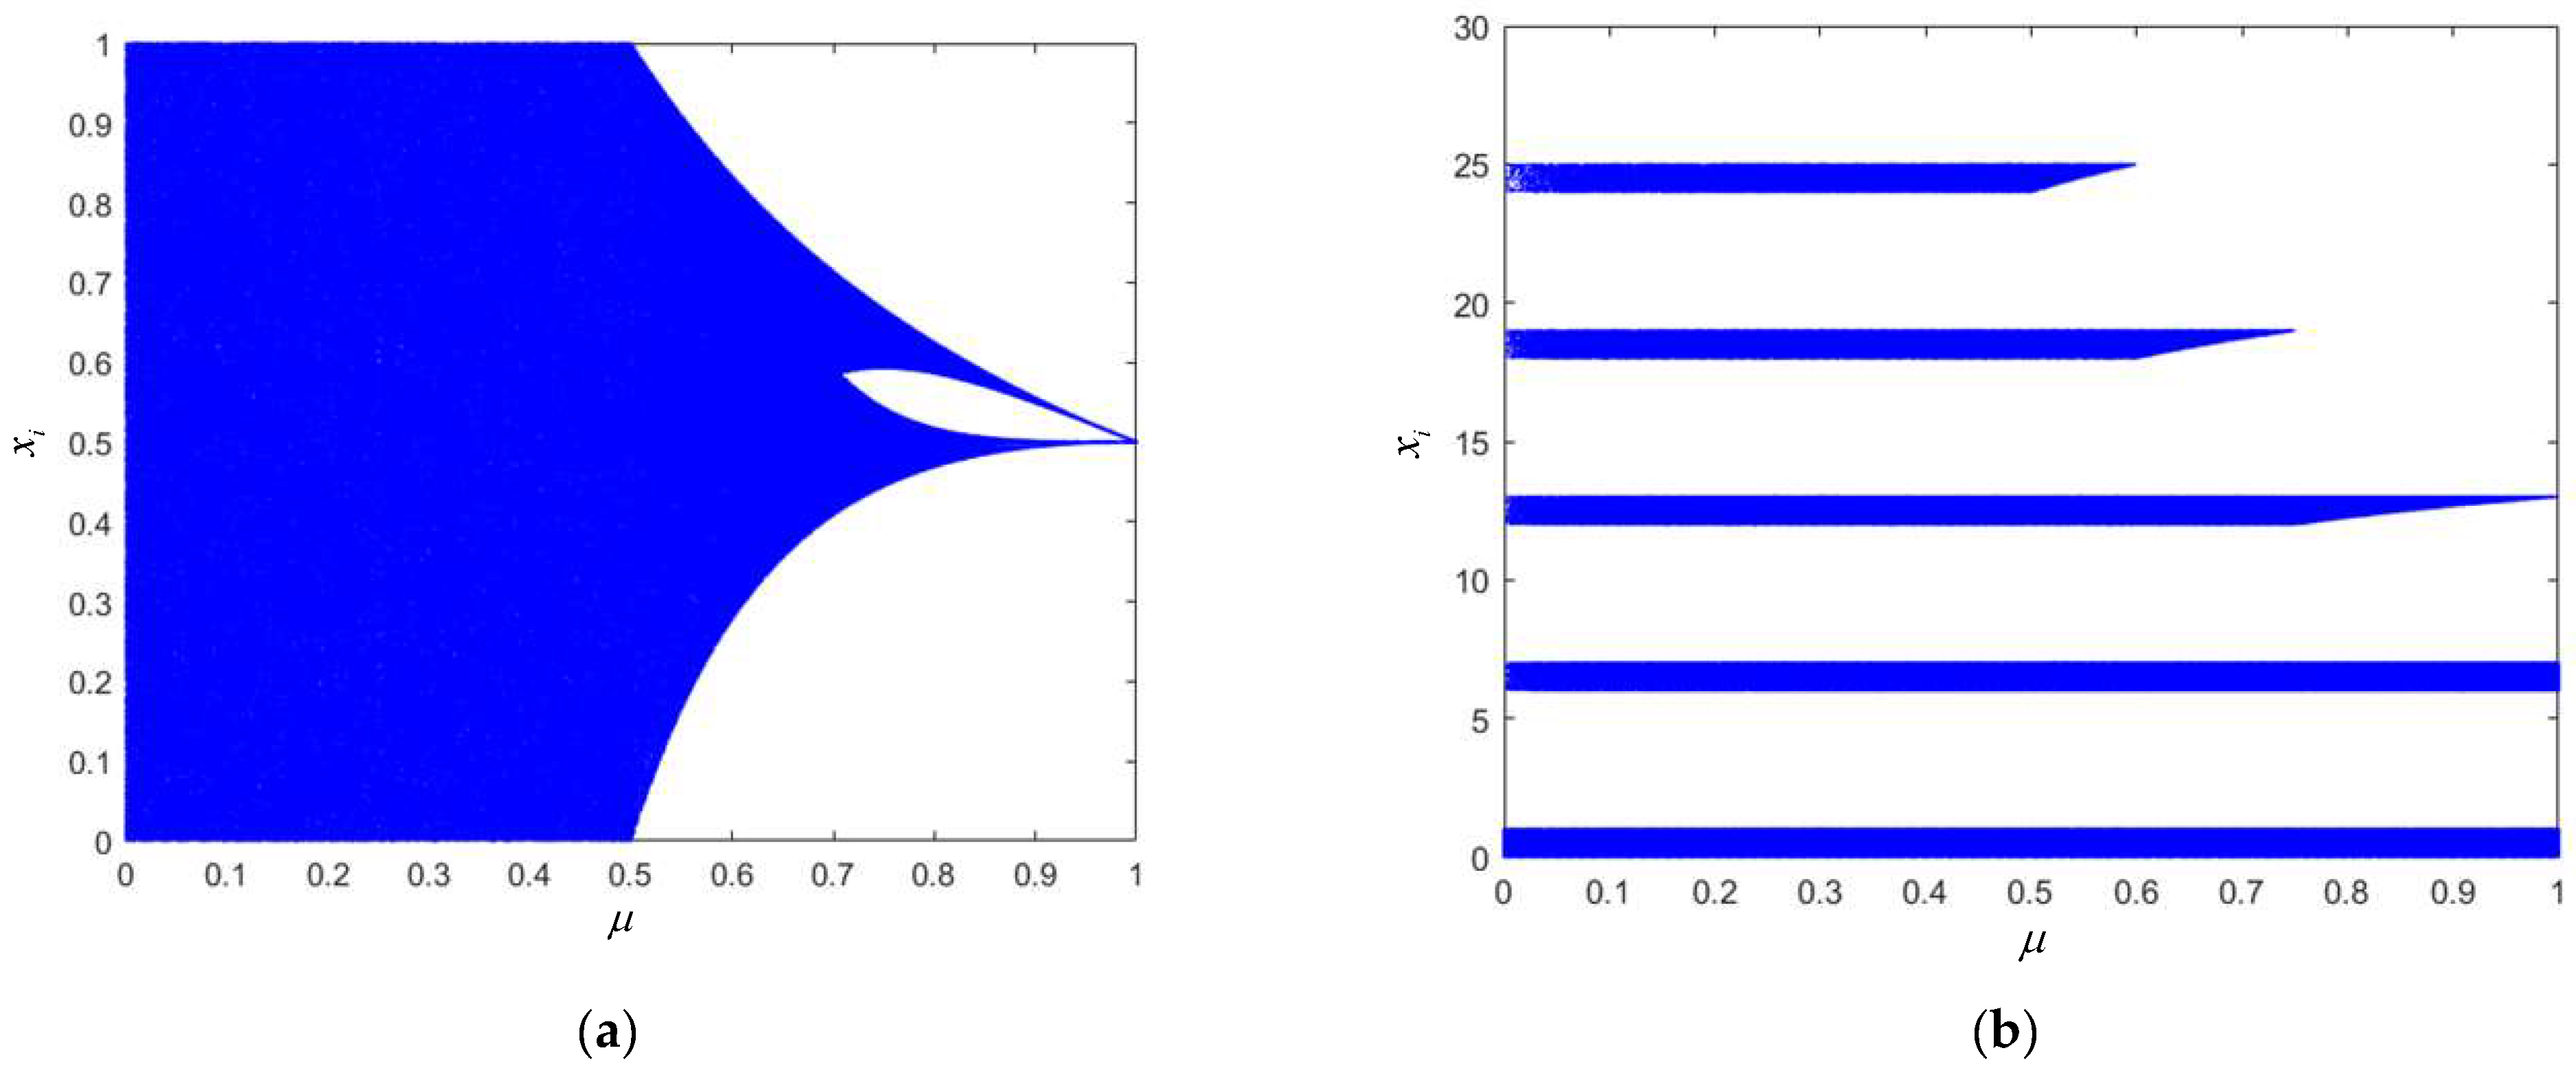
The bifurcation of a chaotic map is one of the signs that the map has entered a chaotic state. By describing the bifurcation diagrams of the maps, we can directly observe the chaotic regions of the maps and the influences of the control parameters in the map on chaos. The bifurcation diagrams are drawn according to the expressions of the five mappings, namely the logistic, Chebyshev, cubic, and Tent mappings and the mapping proposed in this paper (
Figure 13).
As shown in
Figure 13, only when the fractal coefficient of the Tent mapping
, the system can enter a chaotic state; when
, the system is in a periodic state. When the fractal coefficient of the logistic mapping
, the system is in a chaotic state; when
, the system is in a periodic state. As for the cubic mapping, when the fractal coefficient
, the system is in a chaotic state; when
, the system is in a periodic state. When the fractal coefficient of the Chebyshev mapping
, the system can be in a chaotic state; when
, the system is in a periodic state. The chaotic mapping proposed in this paper is not affected by the fractal coefficient, and the points in the bifurcation diagram are more uniformly distributed.
Lyapunov exponents (
LEs) can characterize the motion characteristics of a chaotic system. The positive, negative and magnitude of an
LE value in a certain direction represent the average divergence
or convergence
rate of adjacent orbits in the attractor of a long time system in this direction. Therefore, the minimum
LE determines how fast the orbit converges, and the maximum
LE determines how fast the orbit covers the whole chaotic attractor. The maximum
LE is used to evaluate the randomness of chaotic sequences, and its definition is shown in Equation (43):
where
represents the first derivative of the chaotic map
. When
, the system is in a chaotic state, and a larger value indicates stronger randomness of the chaotic sequence produced by the system. The
LE change curves of the above five chaotic maps with different fractal coefficients are drawn as follows.
According to
Figure 14, the
LEs of the Tent, logistic, Chebyshev and cubic mappings are not always greater than 0, indicating that the four systems are not always in a chaotic state. Taking the sky-blue
LE change curve of the cubic mapping in the figure as an example, we can observe that only when the fractal coefficient
, the
LE is greater than 0, indicating that the system is in a chaotic state. Compared with other classical one-dimensional chaotic maps, the chaotic map designed in this paper has higher
LEs in the variation interval of fractal coefficients, indicating that the chaotic sequences generated by the proposed SNP-PLCM have stronger randomness than the chaotic sequences generated by the other four one-dimensional chaotic maps. The analyses of
l = 3 and
l = 6 curves show that a larger interval number selection parameter of the SNP-PLCM designed in this paper leads to stronger randomness of the sequences generated by chaotic mapping.
Approximate entropies can be used to measure the complexity of the sequences generated by chaotic maps. A larger approximate entropy indicates the higher complexity of a sequence. The approximate entropies of the above four mappings were calculated under the same simulation conditions. The fractal coefficients varied from 0.5 to 4 in steps of 0.5, and the sequence length was set to 10,000. The results are shown in
Table 1. When the system does not enter a chaotic state, the value of approximate entropy is extremely small or even 0. For example, when
and
, the approximate entropies of the logistic and cubic maps are at the order of
or
. When
, the approximate entropy of the cubic map is 0. When
, the approximate entropy of the Chebyshev map is 0. However, the SNP-PLCM designed in this paper maintains an approximate entropy greater than 1 or close to 1 in the variation range of the fractal coefficients of
, showing that the sequence generated by it has higher complexity.
Fourth, the recursion graph is a non-stationary signal processing and analysis method. It has been widely applied in the analysis of chaotic signals and chaotic signal modulation based on chaos. The recursion graph is plotted by the recursive matrix, which can be expressed by Equation (44):
where
is a square matrix of
; N is the number of state vectors
; the threshold
represents a preset critical distance;
is the norm;
is the unit step function,
,
. A recursion graph is obtained by drawing a recursive matrix with different colors to represent its binary. The chaotic signal is analyzed through the recursion graph to obtain the law of the chaotic signal. Periodic or quasi-periodic recursive structures (e.g., checkerboard-like structures) appear in the diagonal direction, and these structures characterize the periodicity of the signal state evolution. If the recursion graphs are all isolated recursive points, and the isolated recursive points follow a uniform distribution with almost no relatively long diagonals, vertical lines, or horizontal lines, it indicates good randomness of the signal. The recursion graphs of the sine sequence
, logistic, cubic, Tent, and the sequence generated by the chaotic map are shown below, with 3,100 sequence point values for each sequence.
As shown in
Figure 15a, the recursion graph of the sinusoidal sequence presents an obvious grid-like recursion structure, indicating that the sinusoidal sequence has a significant periodicity. The recursion graphs of (b) logistic, (c) cubic, and (d) Tent sequences have no significant recurrence structure. The distribution of recurrence points is not uniform, and there are still some short lines, indicating the phenomenon of short periods in the sequence.
Figure 15e,f are the recursion graphs of the designed mappings when the interval parameters are 3 and 6, respectively. As shown in
Figure 15e, when the interval parameter is 3, the uneven distribution of recurrence points also partially emerges in the recurrence graph, with a small grid-like recurrence structure. In
Figure 15f, when the interval parameter is 6, there is only one 45° main diagonal line, and the rest of the recursion points are fully scattered and uniformly distributed in the graph. In addition, the distribution of the local recursion points is consistent, indicating that the chaotic sequence in this study has strong randomness.
Fifth, the recursion graphs are mainly for the qualitative analysis of chaotic signals. Therefore, recursive quantitative analysis is still needed for quantitative analysis and comparison of chaotic sequences. According to the literature [
46], the recursive rate (RR), entropy (ENTR), system determinacy (DET), and maximum diagonal length (
) are mainly used to analyze chaotic sequences. The larger recurrence rate indicates a more concentrated distribution of points in the recursive graph of the system. In contrast, the lower recurrence rate indicates a more uniform distribution of points in the recurrence graph of the system. With higher entropy, the system is more complex, while lower entropy indicates a less complex system. Furthermore, a larger DET value indicates that the chaotic sequence is more deterministic, while a smaller DET value indicates that the chaotic sequence is more random. In the phase space, the faster divergence of the attractor trajectory leads to a shorter maximum diagonal.
It can be seen from
Table 2 that the chaotic map with an interval parameter of 6 has the lowest recurrence rate, indicating that all points of the map are uniformly distributed without aggregation, consistent with the recursion graph in
Figure 15. Regarding system certainty, the proposed chaotic map has the smallest DET value when the interval parameter is 6, which is close to the DET value of white Gaussian noise, indicating that the proposed chaotic map has strong randomness. In terms of maximum diagonal length, the proposed chaotic map has an extremely short diagonal length. The diagonal length of the SNP-PLCM map with interval parameter 6 is approximately the same as that of Gaussian white noise. As a result, the attractor trajectory of the proposed chaotic map diverges rapidly in the phase space. Finally, the chaotic map designed in this paper has the largest entropy, much larger than logistic, cubic, and Tent maps, suggesting that the proposed chaotic map is relatively complex.


