
An Exploratory Study on the Complexity and Machine Learning Predictability of Stock Market Data


Abstract
:1. Introduction
2. Related Work
3. Methodology
- Split data into sub-intervals; in our case, we split the data into annual sub-datasets, i.e., we treated each year separately.
- We measured the signal complexity of each data set, i.e., each year, using the following complexity measures: Fisher’s information, Shannon’s entropy, Approximate Entropy (ApEn), Sample Entropy (SampEn), the fractal dimension using three different algorithms, the Hurst exponent, and the error of the Hurst exponent.
- Refactor the sub-datasets into different prediction problems, i.e., predicting the consecutive value of 1 previous step, predicting the consecutive value of 2 previous steps, and so on up to 100 previous steps. Thus, we get 100 prediction problems differing in their memory of previous values, i.e., 100 different prediction problems for each sub-interval.
- Next, we shuffle the data of each sub-interval and spit it into a train and test dataset, with a relative partitioning of to , respectively.
- We then performed regression analysis using a machine learning algorithm on each prediction problem for each sub-interval and collected the training and test dataset scores.
3.1. Data Sets
- Currency outside the U.S. Treasury, Federal Reserve Banks, and the vaults of depository institutions;
- Demand deposits at commercial banks (excluding those amounts held by depository institutions, the U.S. government, and foreign banks and official institutions), fewer cash items in the process of collection, and Federal Reserve float;
- Other Checkable Deposits (OCDs), consisting of Negotiable Order of Withdrawal (NOW), and Automatic Transfer Service (ATS), accounts at depository institutions, share draft accounts at credit unions, and demand deposits at thrift institutions.
3.1.1. M1 Money Supply
- Time span: 1 January 1959–1 December 2019;
- Data: monthly average;
- Number of data points: 732;
- Source: [30].
3.1.2. Dow Jones Industrial Average
- Time span: 2 January 1959–31 December 2019;
- Data: daily closing values;
- Number of data points: 15,359;
- Source: [31].
3.1.3. NASDAQ Composite
- Time span: 5 February 1971–31 December 2019;
- Data: daily closing values;
- Number of data points: 12,335;
- Source: [32].
3.2. Machine Learning Algorithms
3.2.1. Tree Based Extreme Gradient Boosting (XGBoost)
3.2.2. Lasso Regression
3.2.3. Stochastic Gradient Descent Linear Regression
3.2.4. Optimization
- XGBoost:"n_estimators": stats.randint(50, 1200)"colsample_bytree": [1, 0.9, 0.8, 0.5, 0.4]"eta": stats.expon(scale=.2)"max_depth": stats.randint(1, 12)"gamma": [0, 2, 4]"lambda": stats.uniform(0.0, 2.0)"alpha": stats.uniform(0.0, 2.0)"min_child_weight": stats.randint(1, 3)}
- SGDRgressor:"alpha": [1, 0.1, 0.01, 0.001, 0.0001, 0.00001, 0]"eta0": [0.1, 0.01, 0.001, 0.0001]
- Lasso:"alpha": [1, 0.5, 0.25, 0.1, 0.01, 0.001]
3.3. Error Metrics
3.3.1. Root Mean Squared Error (RMSE)
3.3.2. Coefficient of Determination (-Score)
3.3.3. Cross Validation
3.4. Complexity Analysis
3.4.1. Fractal Dimension
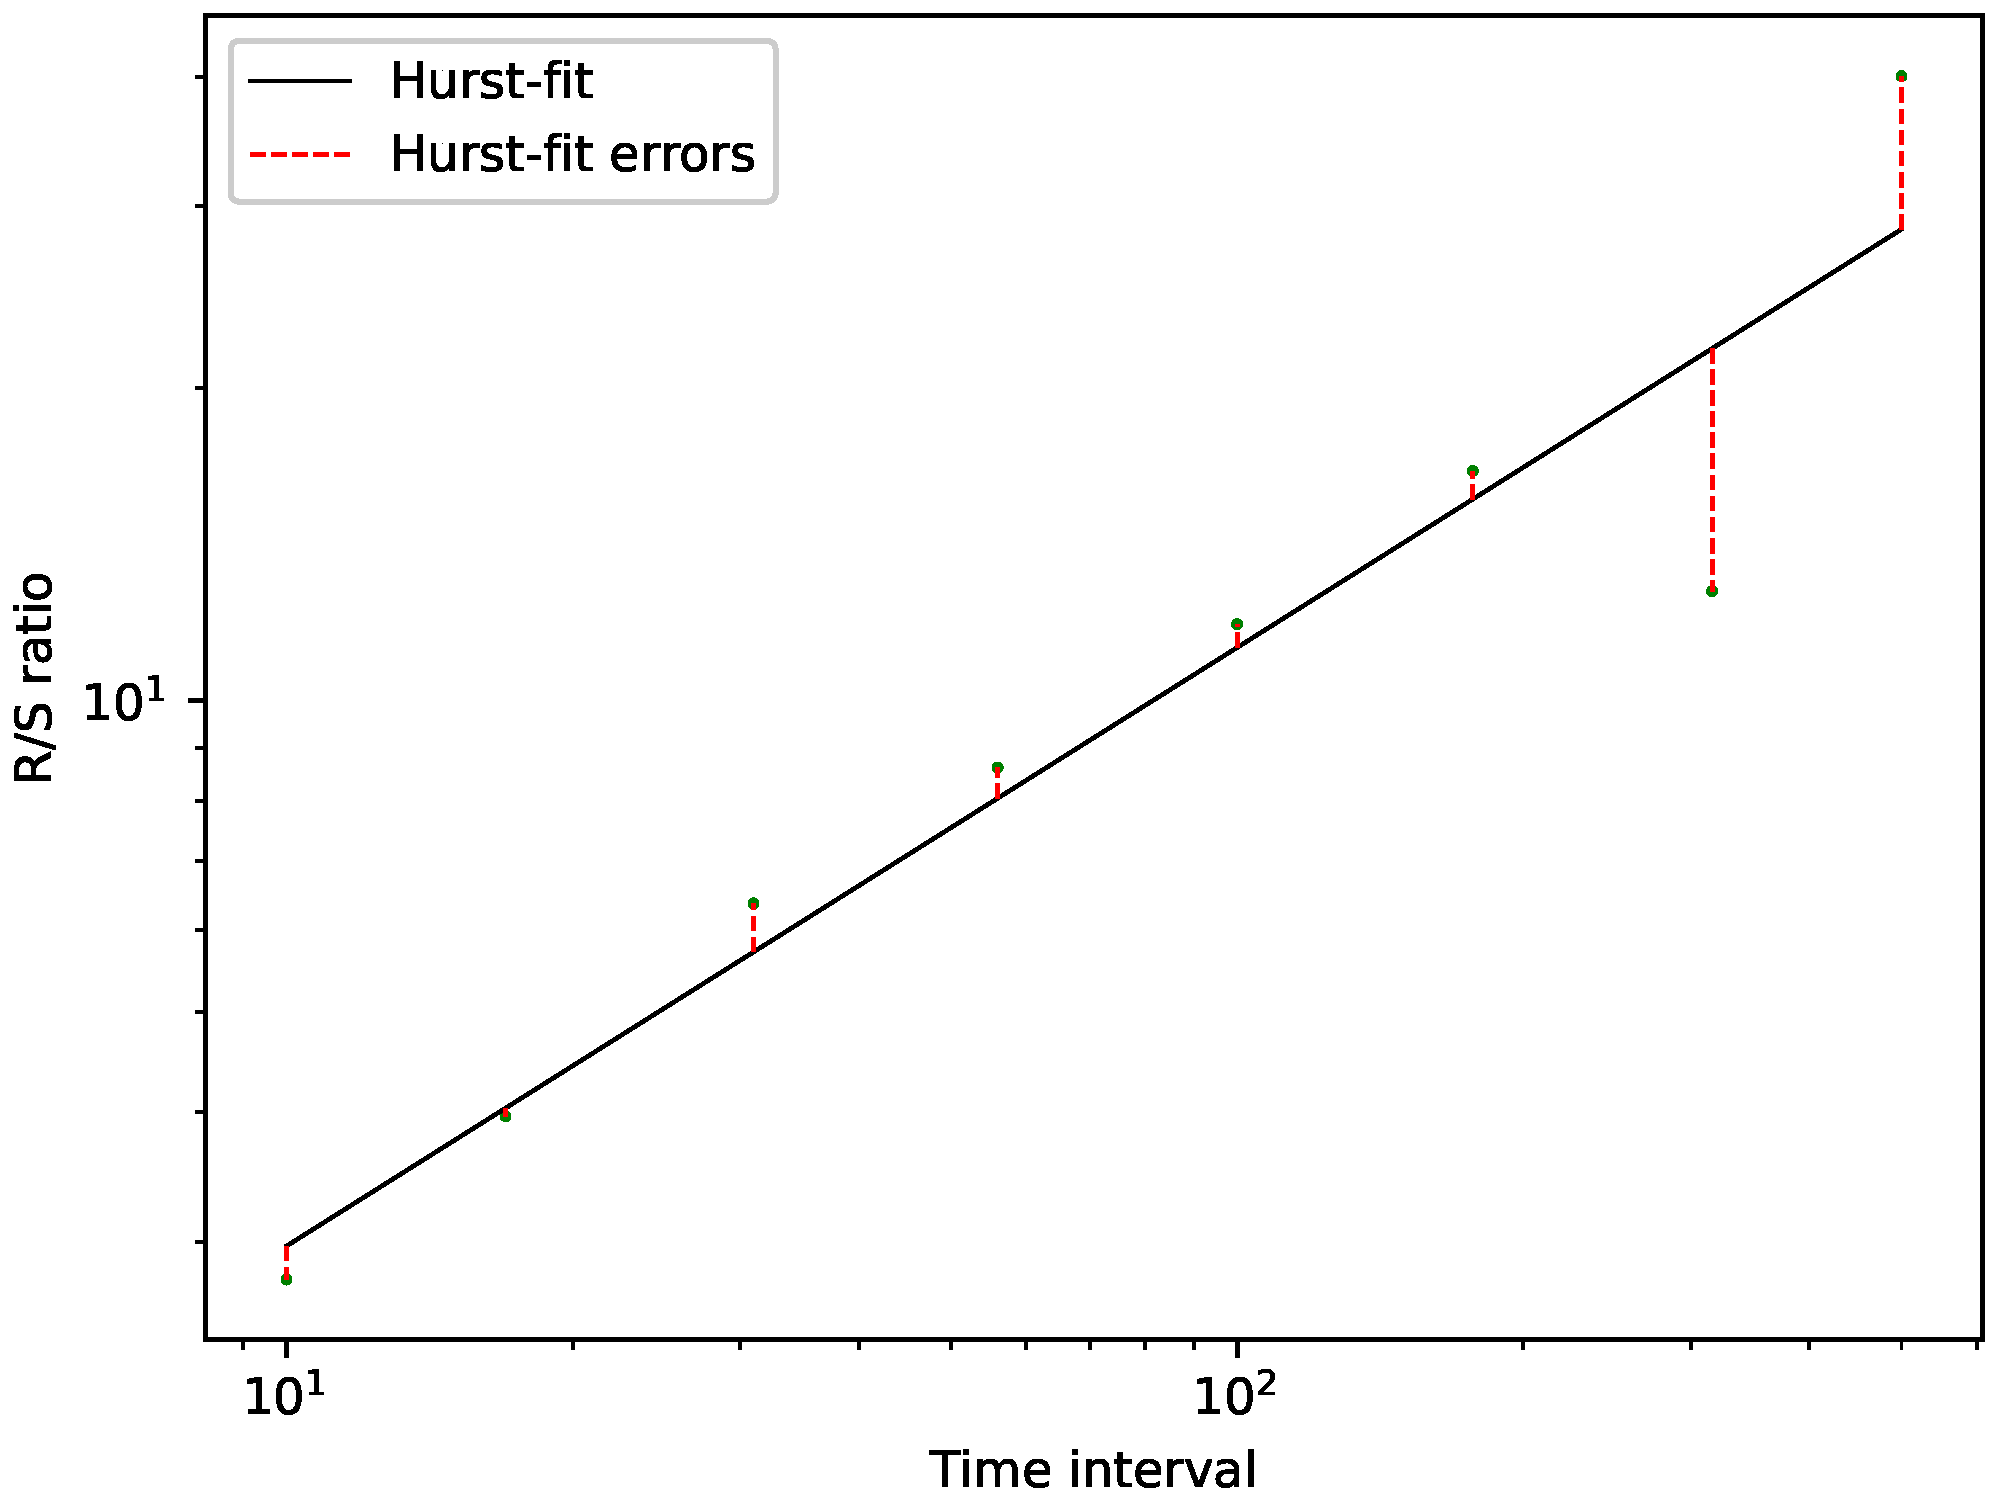
3.4.2. Hurst Exponent, R/S Analysis, Hurst-Error
3.4.3. Fisher’s Information
3.4.4. Approximate Entropy (ApEn)
3.4.5. Sample Entropy (SampEn)
3.4.6. Shannon’s Entropy
3.5. M1 Money Supply Detrending
4. Results and Discussion
4.1. Complexity Analysis
4.1.1. Comparison: M1-Detrended vs. Non-Detrended Data
4.1.2. Temporal Behavior
4.2. Machine Learning Predictability
4.2.1. Comparison: XGBoost vs. Lasso Regression vs. SGD Linear Regression
4.2.2. Comparison: M1-Detrended vs. Non-Detrended Data
4.2.3. Temporal Behavior
4.3. Correlations Predictability/Complexity
- Dow Jones: Degrees of freedom (The number of samples is always two times the number of years available for each data set, as we used both the M1-adjusted and the non-adjusted data) and ;
- NASDAQ: Degrees of freedom and .
4.4. Key Findings
- We found a relation between ApEn/SampEn and the predictability of the employed ML algorithms. We found that we can model this relation using a generalized logistic function. Given the applied test results, we conclude that this relation holds for all algorithms and all data under study. Thus this relation states: High ApEn/SampEn indicates low predictability and vice versa.
- Shannon’s entropy shows an increase of disorder for both Dow Jones and NASDAQ and subsequently for both the M1-detrended and the non-detrended data. We conclude that the disorder in the data increased for later years. We can further see that the M1-adjustment increased Shannon’s entropy for earlier years for all data and thus conclude that it adds disorder to the data, and that later years are inherently more random, and that the disorder induced by M1-adjustment is already present in the data.
- The employed algorithms to calculate a fractal dimension and R/S analysis to calculate the Hurst exponent suggest that the stock market data under study became more random/complex for later years.
- Using the Hurst error, we found that later years for all years are closer to a fractional Brownian motion than earlier years, which is more apparent for the NASDAQ data. On the other hand, the Dow Jones data is closer to a fractional Brownian motion right from the start. Thus, we only observe a slight decrease towards fractional Brownian behavior.
- In general, the M1 adjustment led to decreasing predictability of the data under study, as can be seen in the tables for the average errors, i.e., Table 1 and Table 2. However, given the corresponding large errors and Figure 18 and Figure 19, we see that this is not true for all regions of the data, as there are some parts where the M1-detrending increased the predictability.
- Our analysis of the predictability of both data sets, i.e., Dow Jones and NASDAQ, and both the M1-detrended and the non-detrended data indicate lower predictability for later years.
5. Conclusions
Author Contributions
Funding
Data Availability Statement
Acknowledgments
Conflicts of Interest
Appendix A. ApEn and SampEn vs. Predictability


Appendix B. Memory Plots


Appendix C. Time Delay and Embedding Dimensions


References
- Fama, E.F. Efficient Capital Markets: A Review of Theory and Empirical Work. J. Financ. 1970, 25, 383–417. [Google Scholar] [CrossRef]
- Ţiţan, A.G. The Efficient Market Hypothesis: Review of Specialized Literature and Empirical Research. Emerg. Mark. Queries Financ. Bus. 2015, 32, 442–449. [Google Scholar] [CrossRef] [Green Version]
- Fama, E.F. Random Walks in Stock Market Prices. Financ. Anal. J. 1965, 21, 55–59. [Google Scholar] [CrossRef] [Green Version]
- Lo, A.W.; MacKinlay, A.C. A Non-Random Walk Down Wall Street; Princeton University Press: Princeton, NJ, USA, 1999. [Google Scholar]
- Malkiel, B.G. A Random Walk Down Wall Street; Norton: New York, NY, USA, 1973. [Google Scholar]
- Cajueiro, D.O.; Tabak, B.M. The Hurst exponent over time: Testing the assertion that emerging markets are becoming more efficient. Phys. A Stat. Mech. Appl. 2004, 336, 521–537. [Google Scholar] [CrossRef]
- Hurst, G.W. Forecasting the Severity of Sugar Beet Yellows. Plant Pathol. 1965, 14, 47–53. [Google Scholar] [CrossRef]
- Hashemzadeh, N.; Taylor, P. Stock prices, money supply, and interest rates: The question of causality. Appl. Econ. 1988, 20, 1603–1611. [Google Scholar] [CrossRef]
- Castillo, O.; Melin, P. Hybrid Intelligent Systems for Time Series Prediction Using Neural Networks, Fuzzy Logic, and Fractal Theory. IEEE Trans. Neural Netw. 2002, 13, 1395–1408. [Google Scholar] [CrossRef]
- Yakuwa, F.; Dote, Y.; Yoneyama, M.; Uzurabashi, S. Novel Time Series Analysis & Prediction of Stock Trading using Fractal Theory and Time Delayed Neural Net-work. In Proceedings of the IEEE International Conference on Systems, Man and Cybernetics (SMC’03), Conference Theme—System Security and Assurance (Cat. No.03CH37483), Washington, DC, USA, 5–8 October 2003. [Google Scholar]
- Qian, B.; Rasheed, K. Hurst exponent and financial market predictability. In Proceedings of the 2nd IASTED International Conference on Financial Engineering and Applications, Cambridge, MA, USA, 8–10 November 2004; pp. 203–209. [Google Scholar]
- Selvaratnam, S.; Kirley, M. Predicting Stock Market Time Series Using Evolutionary Artificial Neural Networks with Hurst Exponent Input Windows. In Lecture Notes in Computer Science, Proceedings of the AI 2006: Advances in Artificial Intelligence, Ribeirão Preto, Brazil, 23–27 October 2006; Springer: Berlin/Heidelberg, Germany, 2006; Volume 4304. [Google Scholar] [CrossRef]
- Qian, B.; Rasheed, K. Stock market prediction with multiple classifiers. Appl. Intell. 2007, 26, 25–33. [Google Scholar] [CrossRef]
- Diaconescu, E. The use of NARX neural networks to predict chaotic time series. WSEAS Trans. Comput. Res. 2008, 3, 182–191. [Google Scholar]
- Ghosh, I.; Chaudhuri, T.D. Fractal Investigation and Maximal Overlap Discrete Wavelet Transformation (MODWT)-based Machine Learning Framework for Forecasting Exchange Rates. Stud. Microecon. 2017, 5, 1–27. [Google Scholar] [CrossRef]
- De Mendonça Neto, J.N.; Lopes Fávero, L.P.; Takamatsu, R.T. Hurst exponent, fractals and neural networks for forecasting financial asset returns in Brazil. Int. J. Data Sci. Anal. 2018, 3, 1. [Google Scholar] [CrossRef]
- Karaca, Y.; Zhang, Y.D.; Muhammad, K. A Novel Framework of Rescaled Range Fractal Analysis and Entropy-Based Indicators: Forecasting Modelling for Stock Market Indices. Expert Syst. Appl. 2019, 144, 113098. [Google Scholar] [CrossRef]
- Kristoufek, L.; Vosvrda, M. Measuring capital market efficiency: Long term memory, fractal dimension and approximate entropy. Eur. Phys. J. B 2014, 87, 162. [Google Scholar] [CrossRef] [Green Version]
- Pincus, S.M. Approximate entropy as a measure of system complexity. Proc. Natl. Acad. Sci. USA 1991, 88, 2297–2301. [Google Scholar] [CrossRef] [PubMed] [Green Version]
- Raubitzek, S.; Neubauer, T. Combining Measures of Signal Complexity and Machine Learning for Time Series Analyis: A Review. Entropy 2021, 23, 1672. [Google Scholar] [CrossRef]
- Dey, S.; Kumar, Y.; Saha, S.; Basak, S. Forecasting to Classification: Predicting the Direction of Stock Market Price Using Xtreme Gradient Boosting; PESIT South Campus: Bengaluru, India, 2016. [Google Scholar]
- Yun, K.K.; Yoon, S.W.; Won, D. Prediction of stock price direction using a hybrid GA-XGBoost algorithm with a three-stage feature engineering process. Expert Syst. Appl. 2021, 186, 115716. [Google Scholar] [CrossRef]
- Bhuriya, D.; Kaushal, G.; Sharma, A.; Singh, U. Stock market predication using a linear regression. In Proceedings of the International Conference of Electronics, Communication and Aerospace Technology (ICECA), Coimbatore, India, 20–22 April 2017; Volume 2, pp. 510–513. [Google Scholar]
- Roy, S.S.; Mittal, D.; Basu, A.; Abraham, A. Stock Market Forecasting Using LASSO Linear Regression Model. In Proceedings of the Afro-European Conference for Industrial Advancement, Paris, France, 9–11 September 2015; Abraham, A., Krömer, P., Snasel, V., Eds.; Springer International Publishing: Cham, Switzerland, 2015; pp. 371–381. [Google Scholar]
- Rastogi, A.; Qais, A.; Saxena, A.; Sinha, D. Stock Market Prediction with Lasso Regression using Technical Analysis and Time Lag. In Proceedings of the 6th International Conference for Convergence in Technology (I2CT), Maharashtra, India, 7–9 April 2021; pp. 1–5. [Google Scholar]
- Khattak, M.A.; Ali, M.; Rizvi, S.A.R. Predicting the European stock market during COVID-19: A machine learning approach. MethodsX 2021, 8, 101198. [Google Scholar] [CrossRef]
- Basak, S.; Kar, S.; Saha, S.; Khaidem, L.; Dey, S.R. Predicting the direction of stock market prices using tree-based classifiers. N. Am. J. Econ. Financ. 2019, 47, 552–567. [Google Scholar] [CrossRef]
- Gumus, M.; Kiran, M.S. Crude oil price forecasting using XGBoost. In Proceedings of the International Conference on Computer Science and Engineering (UBMK), Antalya, Turkey, 5–8 October 2017; pp. 1100–1103. [Google Scholar] [CrossRef]
- Nunno, L. Stock Market Price Prediction Using Linear and Polynomial Regression Models; University of New Mexico: Albuquerque, NM, USA, 2014. [Google Scholar]
- Board of Governors of the Federal Reserve System (US). M1 Money Stock [M1SL], Retrieved from FRED, Federal Reserve Bank of St. Louis. 2020. Available online: https://fred.stlouisfed.org/series/M1SL (accessed on 17 January 2022).
- 2020. Available online: https://macrotrends.dpdcart.com/ (accessed on 17 January 2022).
- 2020. Available online: https://finance.yahoo.com/quote/%5EIXIC/ (accessed on 17 January 2022).
- Friedman, J.H. Greedy Function Approximation: A Gradient Boosting Machine. Ann. Stat. 2001, 29, 1189–1232. [Google Scholar] [CrossRef]
- Chen, T.; Guestrin, C. XGBoost: A Scalable Tree Boosting System. In Proceedings of the 22nd ACM SIGKDD International Conference on Knowledge Discovery and Data Mining (KDD ’16), San Francisco, CA, USA, 13–17 August 2016; Association for Computing Machinery: New York, NY, USA, 2016; pp. 785–794. [Google Scholar] [CrossRef] [Green Version]
- Santosa, F.; Symes, W.W. Linear Inversion of Band-Limited Reflection Seismograms. SIAM J. Sci. Stat. Comput. 1986, 7, 1307–1330. [Google Scholar] [CrossRef]
- Tibshirani, R. Regression Shrinkage and Selection via the Lasso. J. R. Stat. Soc. Ser. B (Methodol.) 1996, 58, 267–288. [Google Scholar] [CrossRef]
- Fu, W.J. Penalized Regressions: The Bridge versus the Lasso. J. Comput. Graph. Stat. 1998, 7, 397–416. [Google Scholar] [CrossRef]
- Ighalo, J.O.; Adeniyi, A.G.; Marques, G. Application of linear regression algorithm and stochastic gradient descent in a machine-learning environment for predicting biomass higher heating value. Biofuels Bioprod. Biorefin. 2020, 14, 1286–1295. [Google Scholar] [CrossRef]
- Higuchi, T. Approach to an irregular time series on the basis of the fractal theory. Phys. D Nonlinear Phenom. 1988, 31, 277–283. [Google Scholar] [CrossRef]
- Petrosian, A. Kolmogorov complexity of finite sequences and recognition of different preictal EEG patterns. In Proceedings of the Eighth IEEE Symposium on Computer-Based Medical Systems, Lubbock, TX, USA, 9–10 June 1995; pp. 212–217. [Google Scholar] [CrossRef]
- Katz, M.J. Fractals and the analysis of waveforms. Comput. Biol. Med. 1988, 18, 145–156. [Google Scholar] [CrossRef]
- Hurst, H.; Black, R.; Sinaika, Y. Long-Term Storage in Reservoirs: An Experimental Study; Constable: London, UK, 1965. [Google Scholar]
- Di Matteo, T. Multi-scaling in finance. Quant. Financ. 2007, 7, 21–36. [Google Scholar] [CrossRef]
- Schölzel, C. Nonlinear Measures for Dynamical Systems; Zenodo: Geneva, Switzerland, 2019. [Google Scholar]
- Mayer, A.L.; Pawlowski, C.W.; Cabezas, H. Fisher Information and dynamic regime changes in ecological systems. Ecol. Model. 2006, 195, 72–82. [Google Scholar] [CrossRef]
- Klema, V.; Laub, A. The singular value decomposition: Its computation and some applications. IEEE Trans. Autom. Control 1980, 25, 164–176. [Google Scholar] [CrossRef] [Green Version]
- Makowski, D.; Pham, T.; Lau, Z.J.; Brammer, J.C.; Lespinasse, F.; Pham, H.; Schölzel, C.; Chen, S.H.A. NeuroKit2: A Python Toolbox for Neurophysiological Signal Processing. Behav. Res. Methods 2020, 53, 1689–1696. [Google Scholar] [CrossRef]
- Fraser, A.M.; Swinney, H.L. Independent coordinates for strange attractors from mutual information. Phys. Rev. A 1986, 33, 1134–1140. [Google Scholar] [CrossRef]
- Rhodes, C.; Morari, M. The false nearest neighbors algorithm: An overview. Comput. Chem. Eng. 1997, 21, S1149–S1154. [Google Scholar] [CrossRef]
- Pincus, S.M. Irregularity and asynchrony in biologic network signals. In Methods in Enzymology; Part C; Academic Press: Cambridge, MA, USA, 2000; Volume 321, pp. 149–182. [Google Scholar]
- Delgado-Bonal, A.; Marshak, A. Approximate Entropy and Sample Entropy: A Comprehensive Tutorial. Entropy 2019, 21, 541. [Google Scholar] [CrossRef] [PubMed] [Green Version]
- Richman, J.S.; Moorman, J.R. Physiological time-series analysis using approximate entropy and sample entropy. Am. J. Physiol. Heart Circ. Physiol. 2000, 278, H2039–H2049. [Google Scholar] [CrossRef] [PubMed] [Green Version]
- Shannon, C.E. A mathematical theory of communication. Bell Syst. Tech. J. 1948, 27, 379–423. [Google Scholar] [CrossRef] [Green Version]
- Cincotta, P.M.; Helmi, A.; Méndez, M.; Núñez, J.A.; Vucetich, H. Astronomical time-series analysis—II. A search for periodicity using the Shannon entropy. Mon. Not. R. Astron. Soc. 1999, 302, 582–586. [Google Scholar] [CrossRef] [Green Version]
- Zhou, R.; Cai, R.; Tong, G. Applications of Entropy in Finance: A Review. Entropy 2013, 15, 4909–4931. [Google Scholar] [CrossRef]
- Fieller, E.C.; Hartley, H.O.; Pearson, E.S. Tests for Rank Correlation Coefficients. I. Biometrika 1957, 44, 470–481. [Google Scholar] [CrossRef]
- Pearson, K.F.R.S.X. On the criterion that a given system of deviations from the probable in the case of a correlated system of variables is such that it can be reasonably supposed to have arisen from random sampling. Lond. Edinb. Dublin Philos. Mag. J. Sci. 1900, 50, 157–175. [Google Scholar] [CrossRef] [Green Version]
- Feder, J. Fractals. In Physics of Solids and Liquids; Springer: New York, NY, USA, 1988. [Google Scholar]
- Mandelbrot, B.B.; Van Ness, J.W. Fractional Brownian Motions, Fractional Noises and Applications. SIAM Rev. 1968, 10, 422–437. [Google Scholar] [CrossRef]
- Richards, F.J. A Flexible Growth Function for Empirical Use. J. Exp. Bot. 1959, 10, 290–300. [Google Scholar] [CrossRef]


| R2CV Reg | R2CV M1 | R2 Reg | R2 M1 | RMSE reg | RMSE M1 | |
|---|---|---|---|---|---|---|
| XGBoost | 0.9604 ± 0.031 | 0.9575 ± 0.0342 | 0.9727 ± 0.0213 | 0.9696 ± 0.0277 | 41.2794 ± 47.5003 | 3.4495 ± 2.0942 |
| Lasso | 0.9641 ± 0.0306 | 0.9624 ± 0.0342 | 0.9751 ± 0.0221 | 0.975 ± 0.0244 | 41.6535 ± 51.1356 | 3.2242 ± 1.8485 |
| SGD | 0.9609 ± 0.033 | 0.9583 ± 0.0356 | 0.9711 ± 0.0244 | 0.9706 ± 0.0265 | 45.5918 ± 54.1015 | 3.7737 ± 2.1923 |
| R2CV Reg | R2CV M1 | R2 Reg | R2 M1 | RMSE reg | RMSE M1 | |
|---|---|---|---|---|---|---|
| XGBoost | 0.9734 ± 0.0211 | 0.9678 ± 0.0263 | 0.9811 ± 0.0185 | 0.9779 ± 0.0214 | 15.476 ± 18.4906 | 1.4357 ± 1.8687 |
| Lasso | 0.9777 ± 0.0209 | 0.9736 ± 0.0228 | 0.9837 ± 0.0152 | 0.9827 ± 0.0148 | 14.7437 ± 18.2027 | 1.3279 ± 1.7913 |
| SGD | 0.9754 ± 0.0209 | 0.9702 ± 0.0248 | 0.9794 ± 0.0195 | 0.9782 ± 0.017 | 16.996 ± 20.2584 | 1.564 ± 1.9638 |
| R2CV—ApEn—XGBoost | R2—ApEn—XGBoost | |||
| R2CV—SampEn—XGBoost | R2—SampEn—XGBoost | |||
| R2CV—ApEn—Lasso | R2—ApEn—Lasso | |||
| R2CV—SampEn—Lasso | R2—SampEn—Lasso | |||
| R2CV—ApEn—SGDRegressor | R2—ApEn—SGDRegressor | |||
| R2CV—SampEn—SGDRegressor | R2—SampEn—SGDRegressor |
| R2CV—ApEn—XGBoost | R2—ApEn—XGBoost | |||
| R2CV—SampEn—XGBoost | R2—SampEn—XGBoost | |||
| R2CV—ApEn—Lasso | R2—ApEn—Lasso | |||
| R2CV—SampEn—Lasso | R2—SampEn—Lasso | |||
| R2CV—ApEn—SGDRegressor | R2—ApEn—SGDRegressor | |||
| R2CV—SampEn—SGDRegressor | R2—SampEn—SGDRegressor |
Publisher’s Note: MDPI stays neutral with regard to jurisdictional claims in published maps and institutional affiliations. |
© 2022 by the authors. Licensee MDPI, Basel, Switzerland. This article is an open access article distributed under the terms and conditions of the Creative Commons Attribution (CC BY) license (https://creativecommons.org/licenses/by/4.0/).
Share and Cite
Raubitzek, S.; Neubauer, T. An Exploratory Study on the Complexity and Machine Learning Predictability of Stock Market Data. Entropy 2022, 24, 332. https://doi.org/10.3390/e24030332
Raubitzek S, Neubauer T. An Exploratory Study on the Complexity and Machine Learning Predictability of Stock Market Data. Entropy. 2022; 24(3):332. https://doi.org/10.3390/e24030332
Chicago/Turabian StyleRaubitzek, Sebastian, and Thomas Neubauer. 2022. "An Exploratory Study on the Complexity and Machine Learning Predictability of Stock Market Data" Entropy 24, no. 3: 332. https://doi.org/10.3390/e24030332
APA StyleRaubitzek, S., & Neubauer, T. (2022). An Exploratory Study on the Complexity and Machine Learning Predictability of Stock Market Data. Entropy, 24(3), 332. https://doi.org/10.3390/e24030332