
Optimization of Three Key Geometries of a Steam Ejector under Varied Primary Nozzle Geometries


Abstract
1. Introduction
- The angle and length of both converging and diverging sections of the primary nozzle are optimized, respectively.
- With the given angle and length of the converging section of the primary nozzle, three key geometries were optimized separately or with the sequence of XL3→D5→XL5. Thus, the optimum of the three key dimensions and the corresponding maximum ER are identified.
- With the given angle and length of the diverging section of the primary nozzle, three key geometries were optimized separately or with the sequence of XL3→D5→XL5. The impact of the angle and length of the diverging section of the primary nozzle on the optimal values of the three key dimensions and relevant maximum ER is determined.
- Relative sensitivity of ejector performance to primary nozzle geometries and the other three key geometries is evaluated.
- The effect of the ejector geometries on ejector performance is analyzed with shock cluster number and shock chain length or area of low static pressure zone inside the ejector.
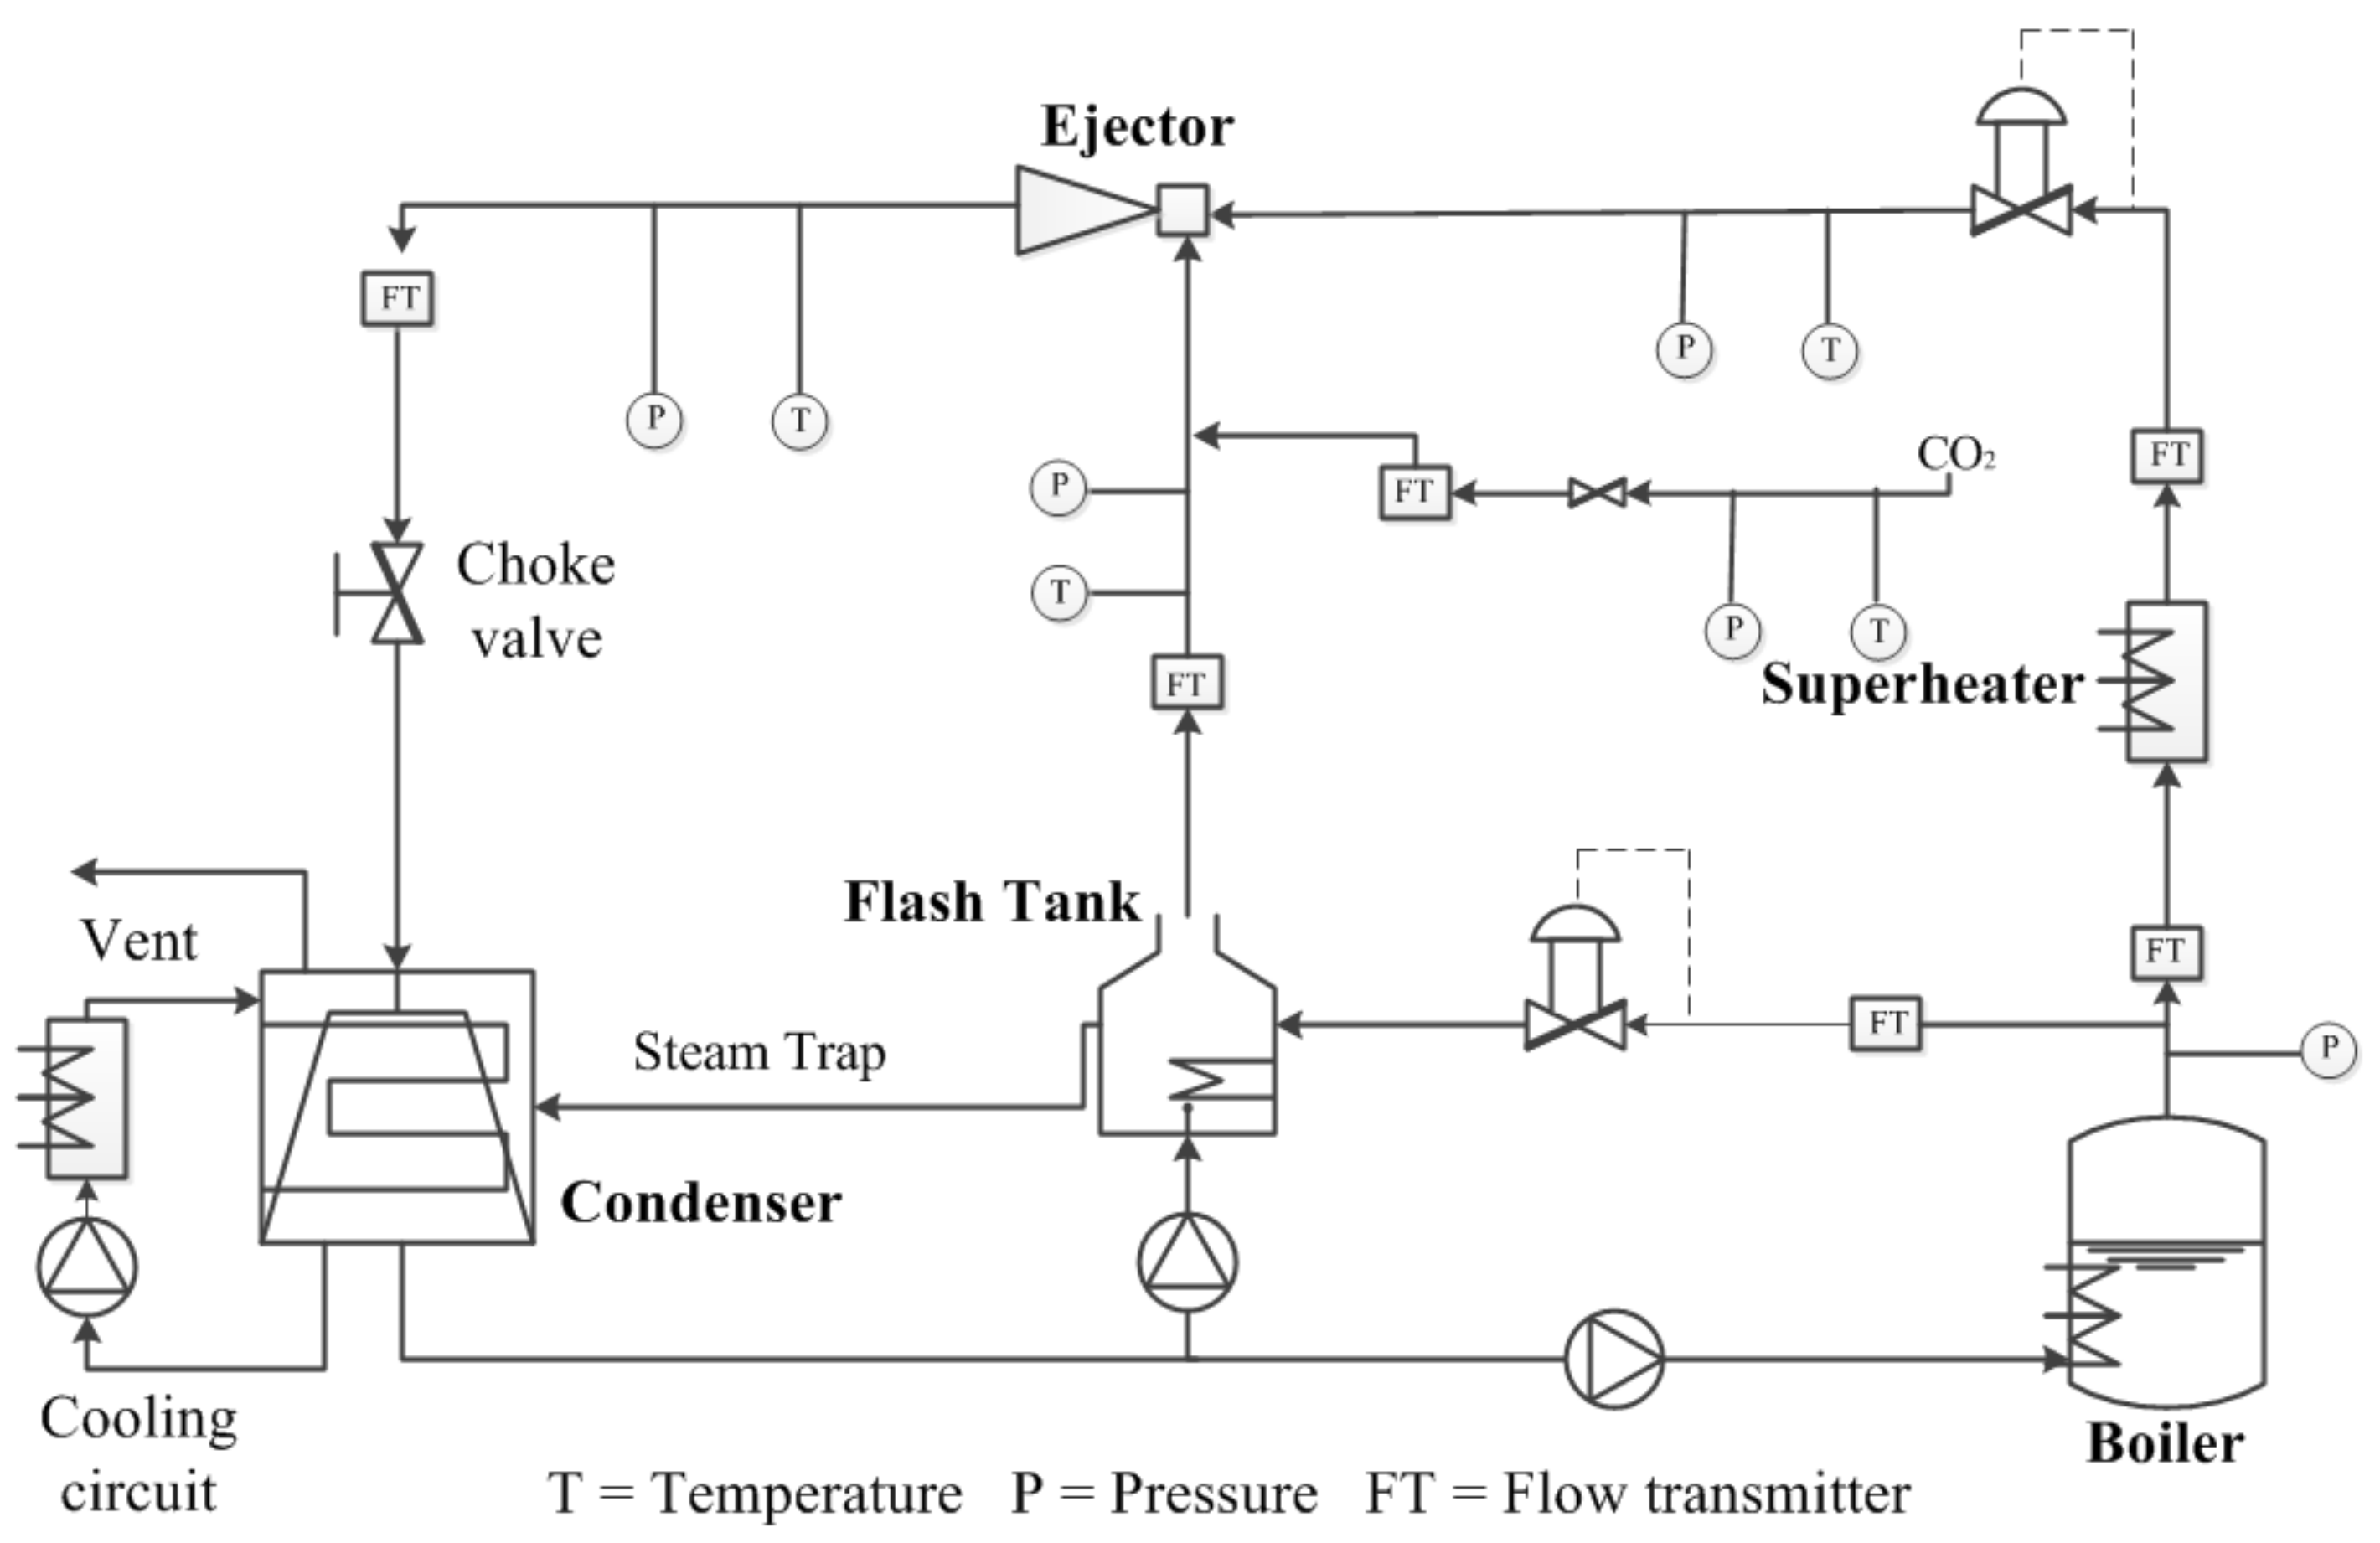
2. Experimental Rig
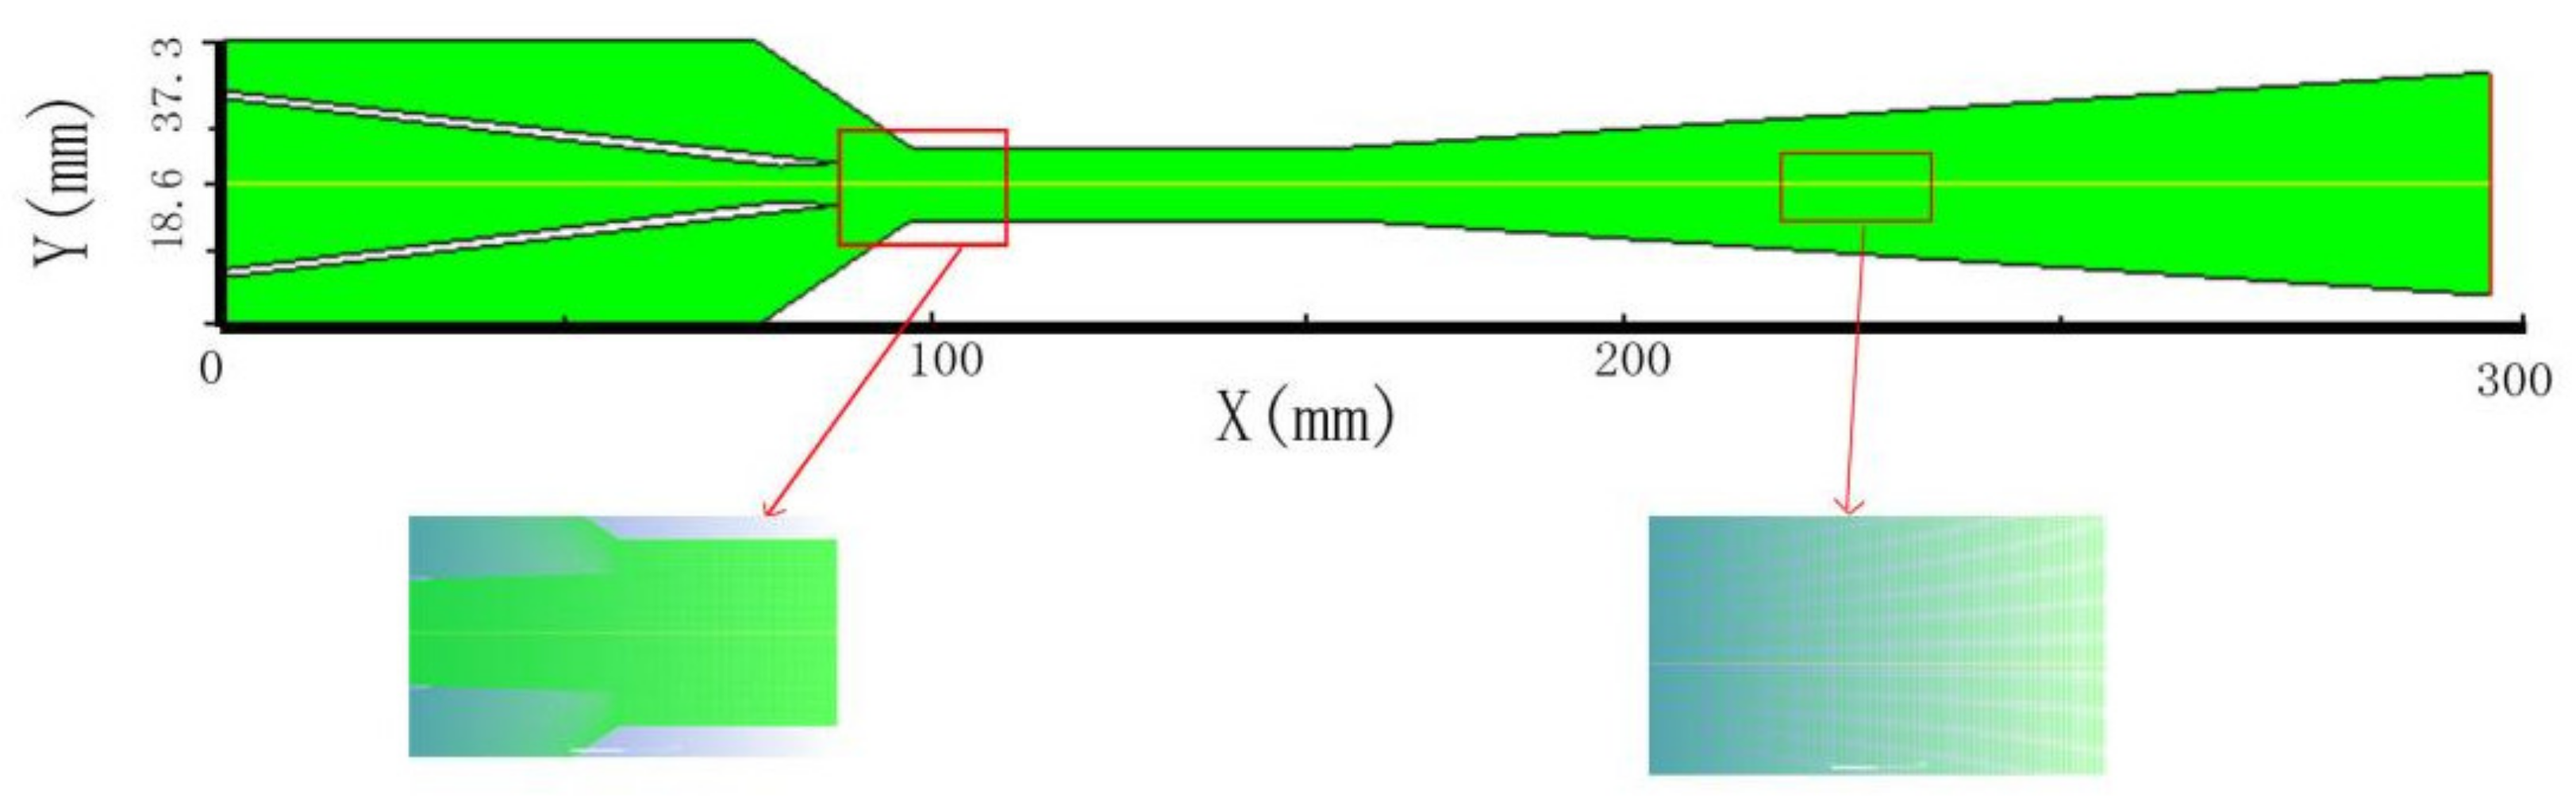
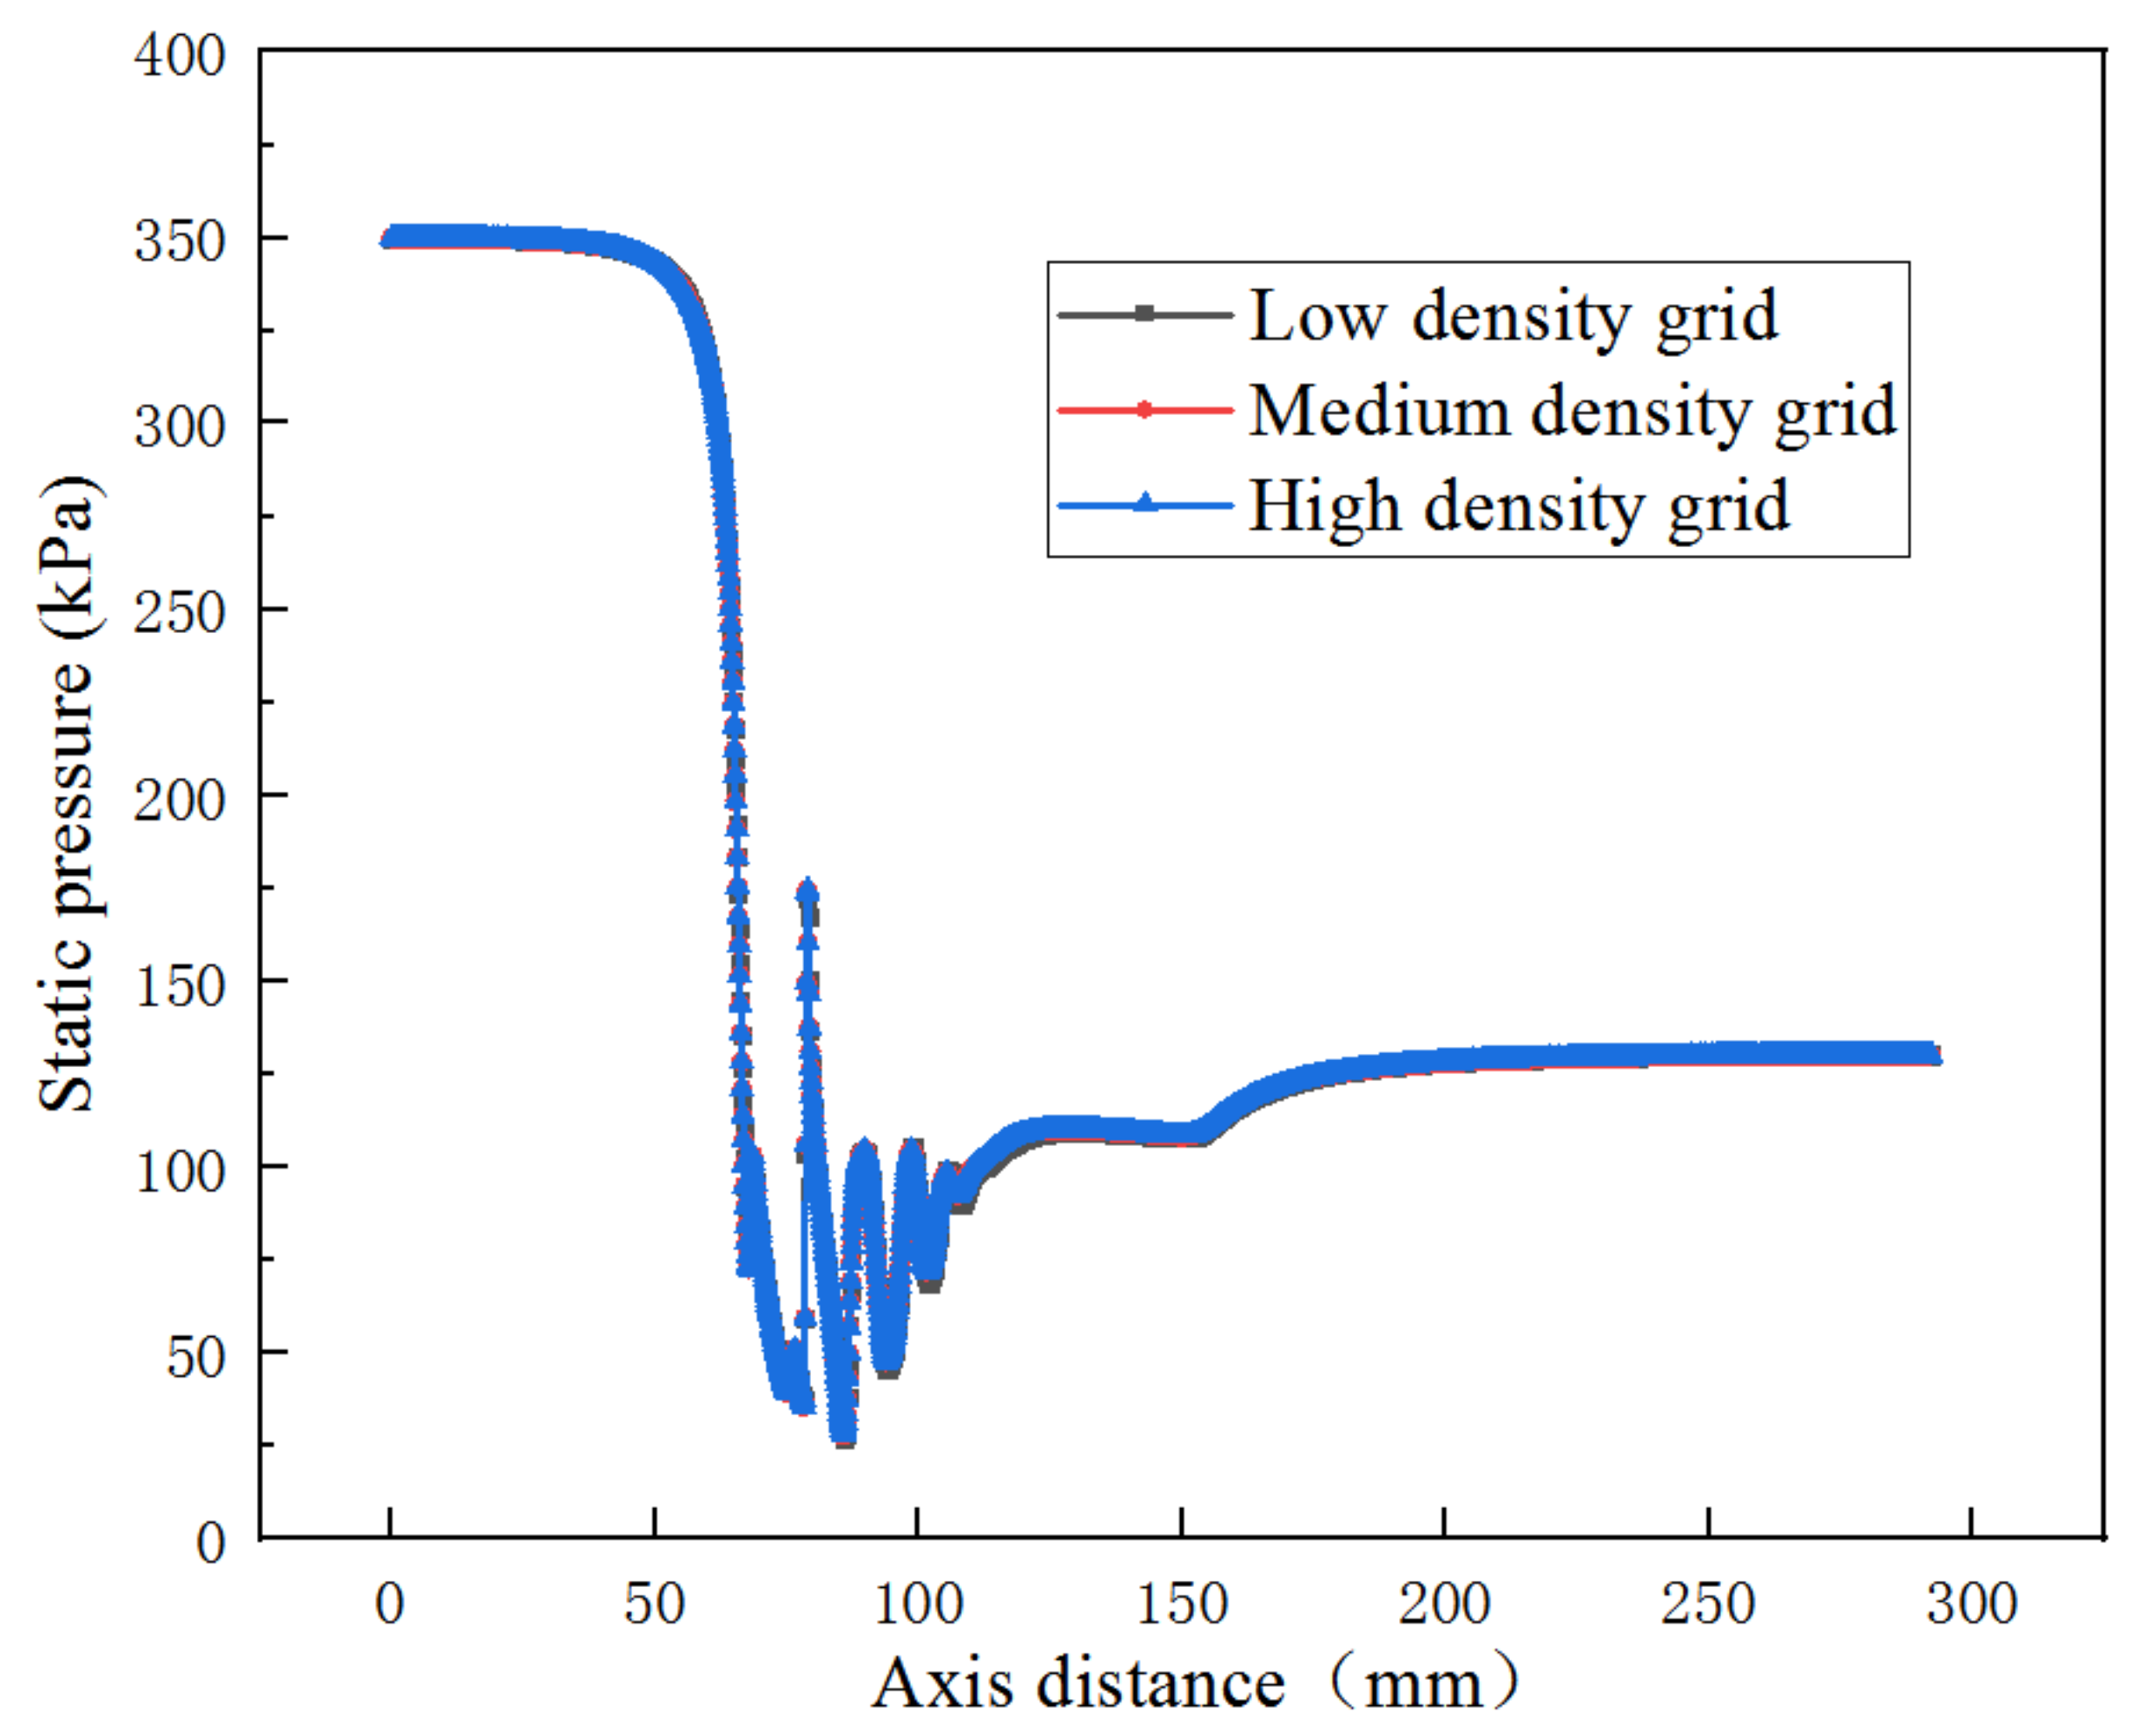
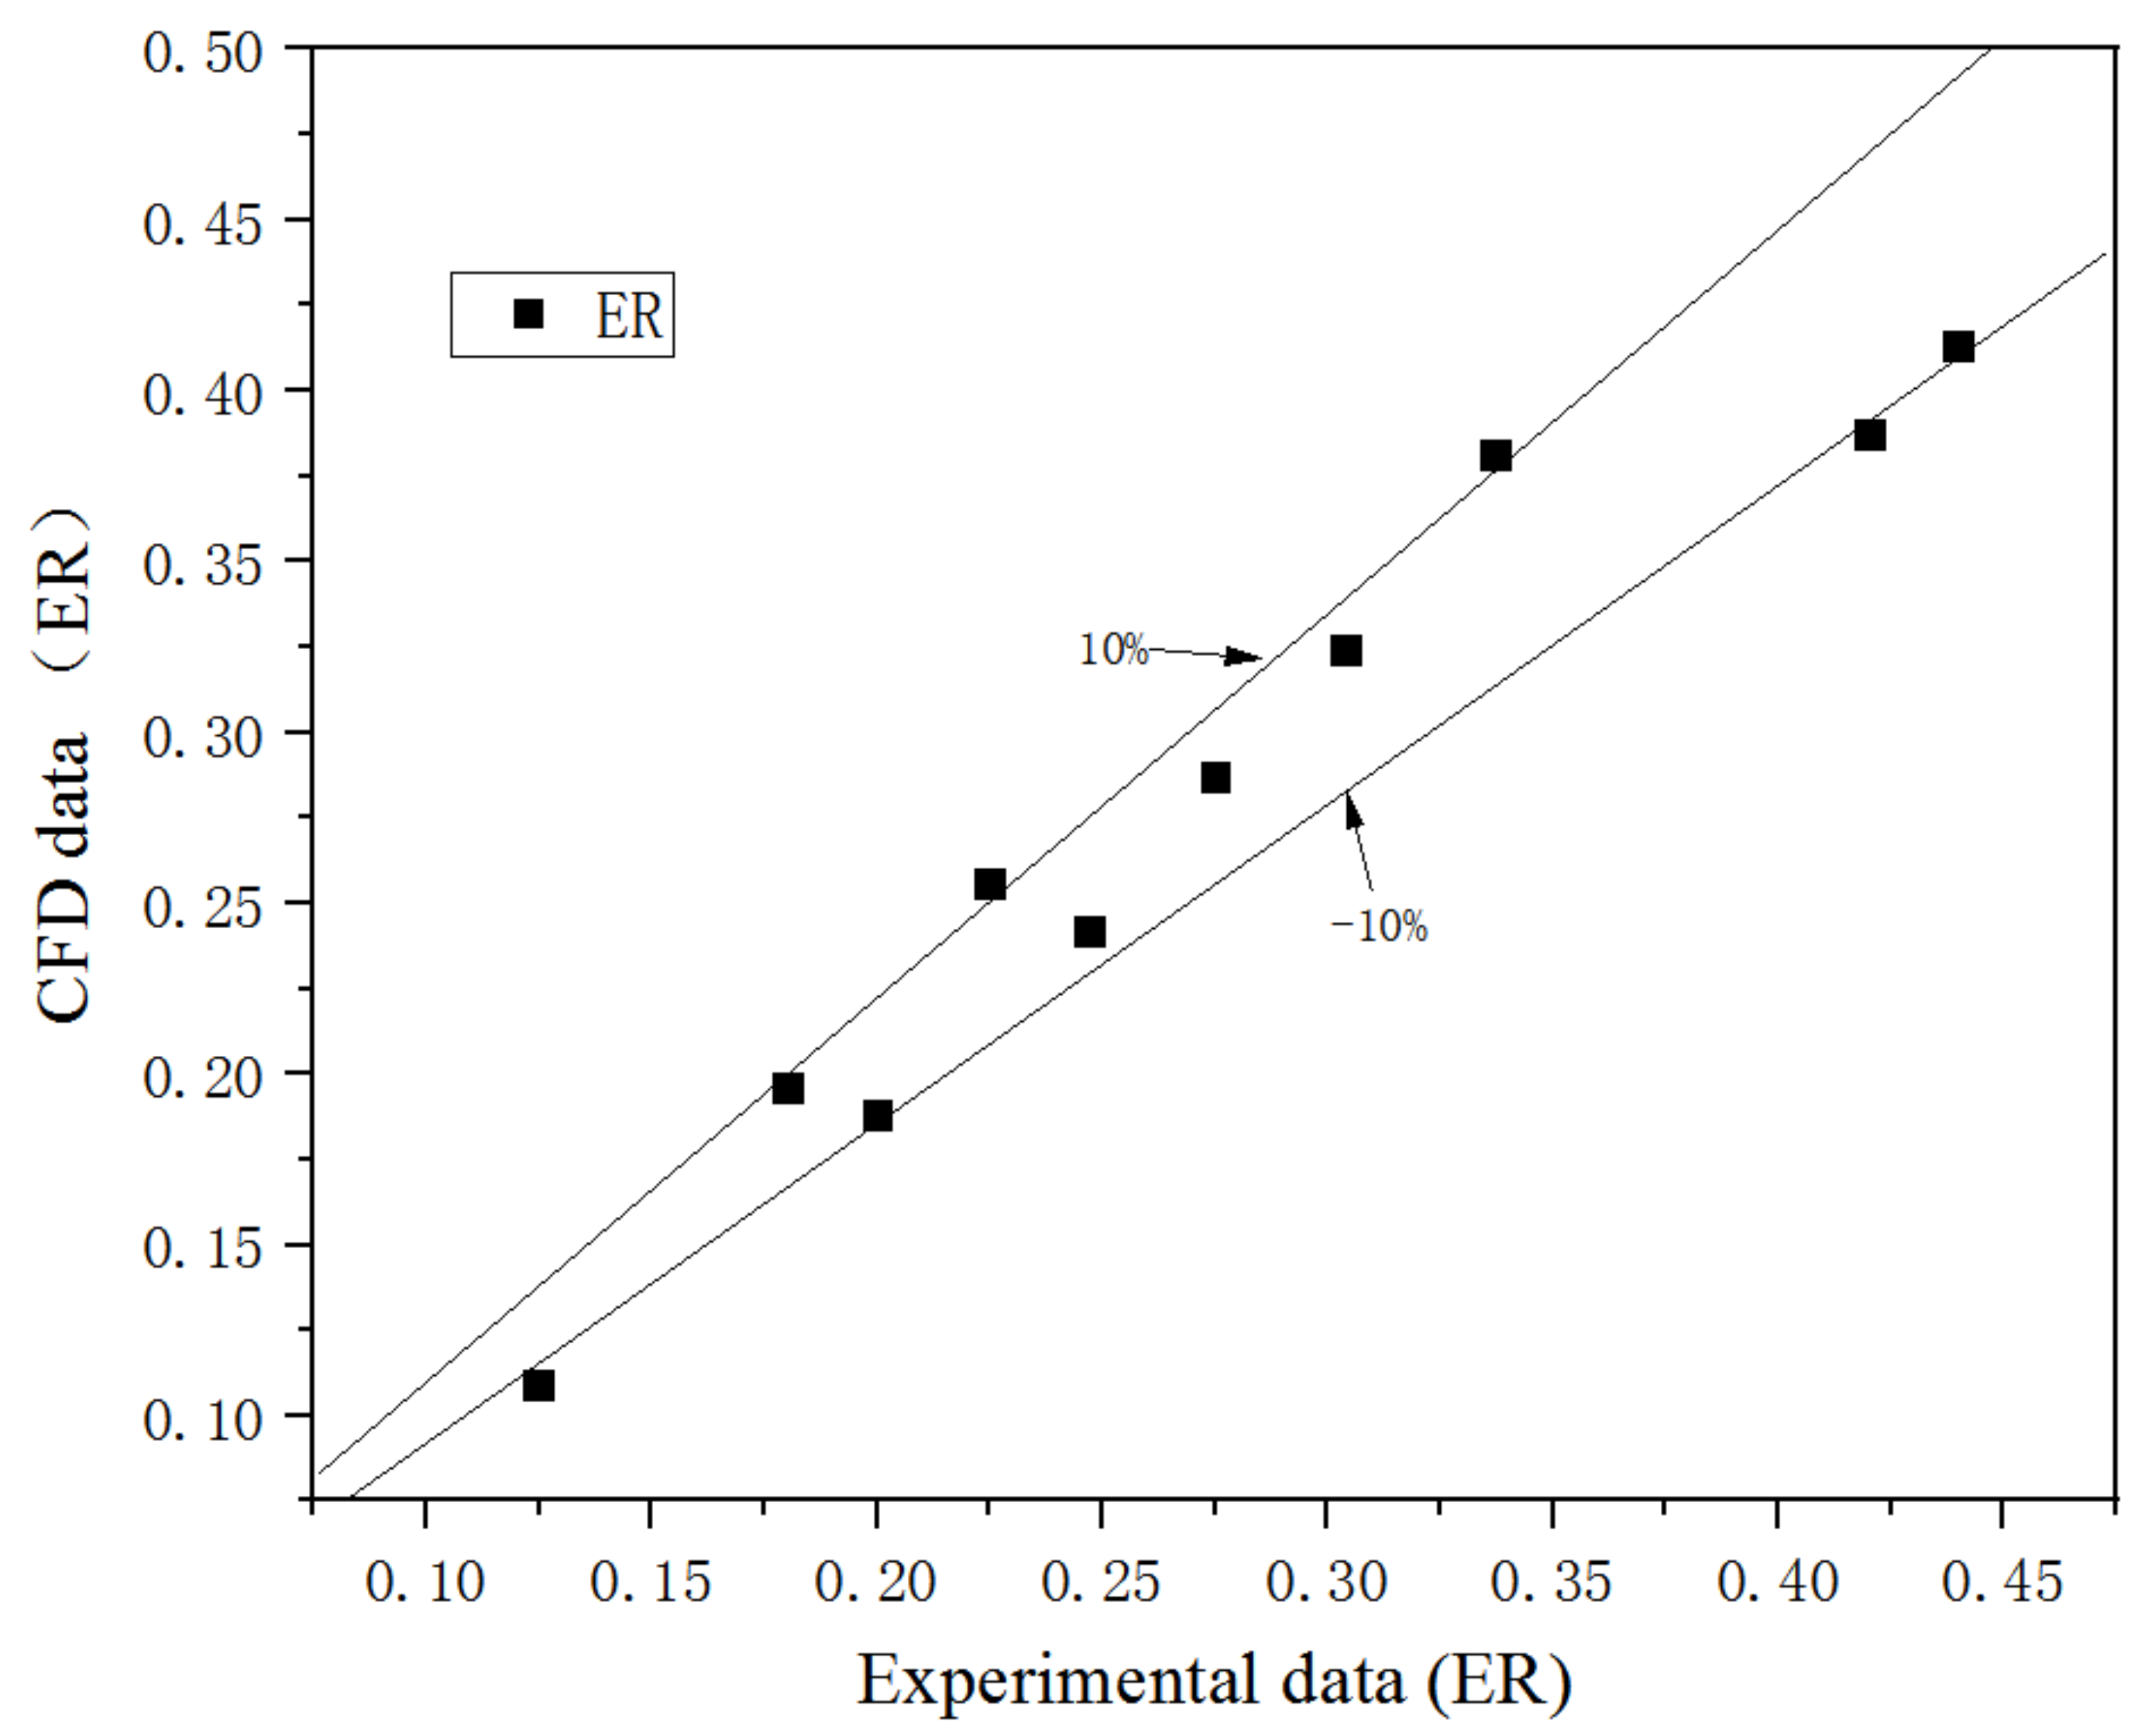
3. CFD Modeling and Model Validation
4. Results and Discussion
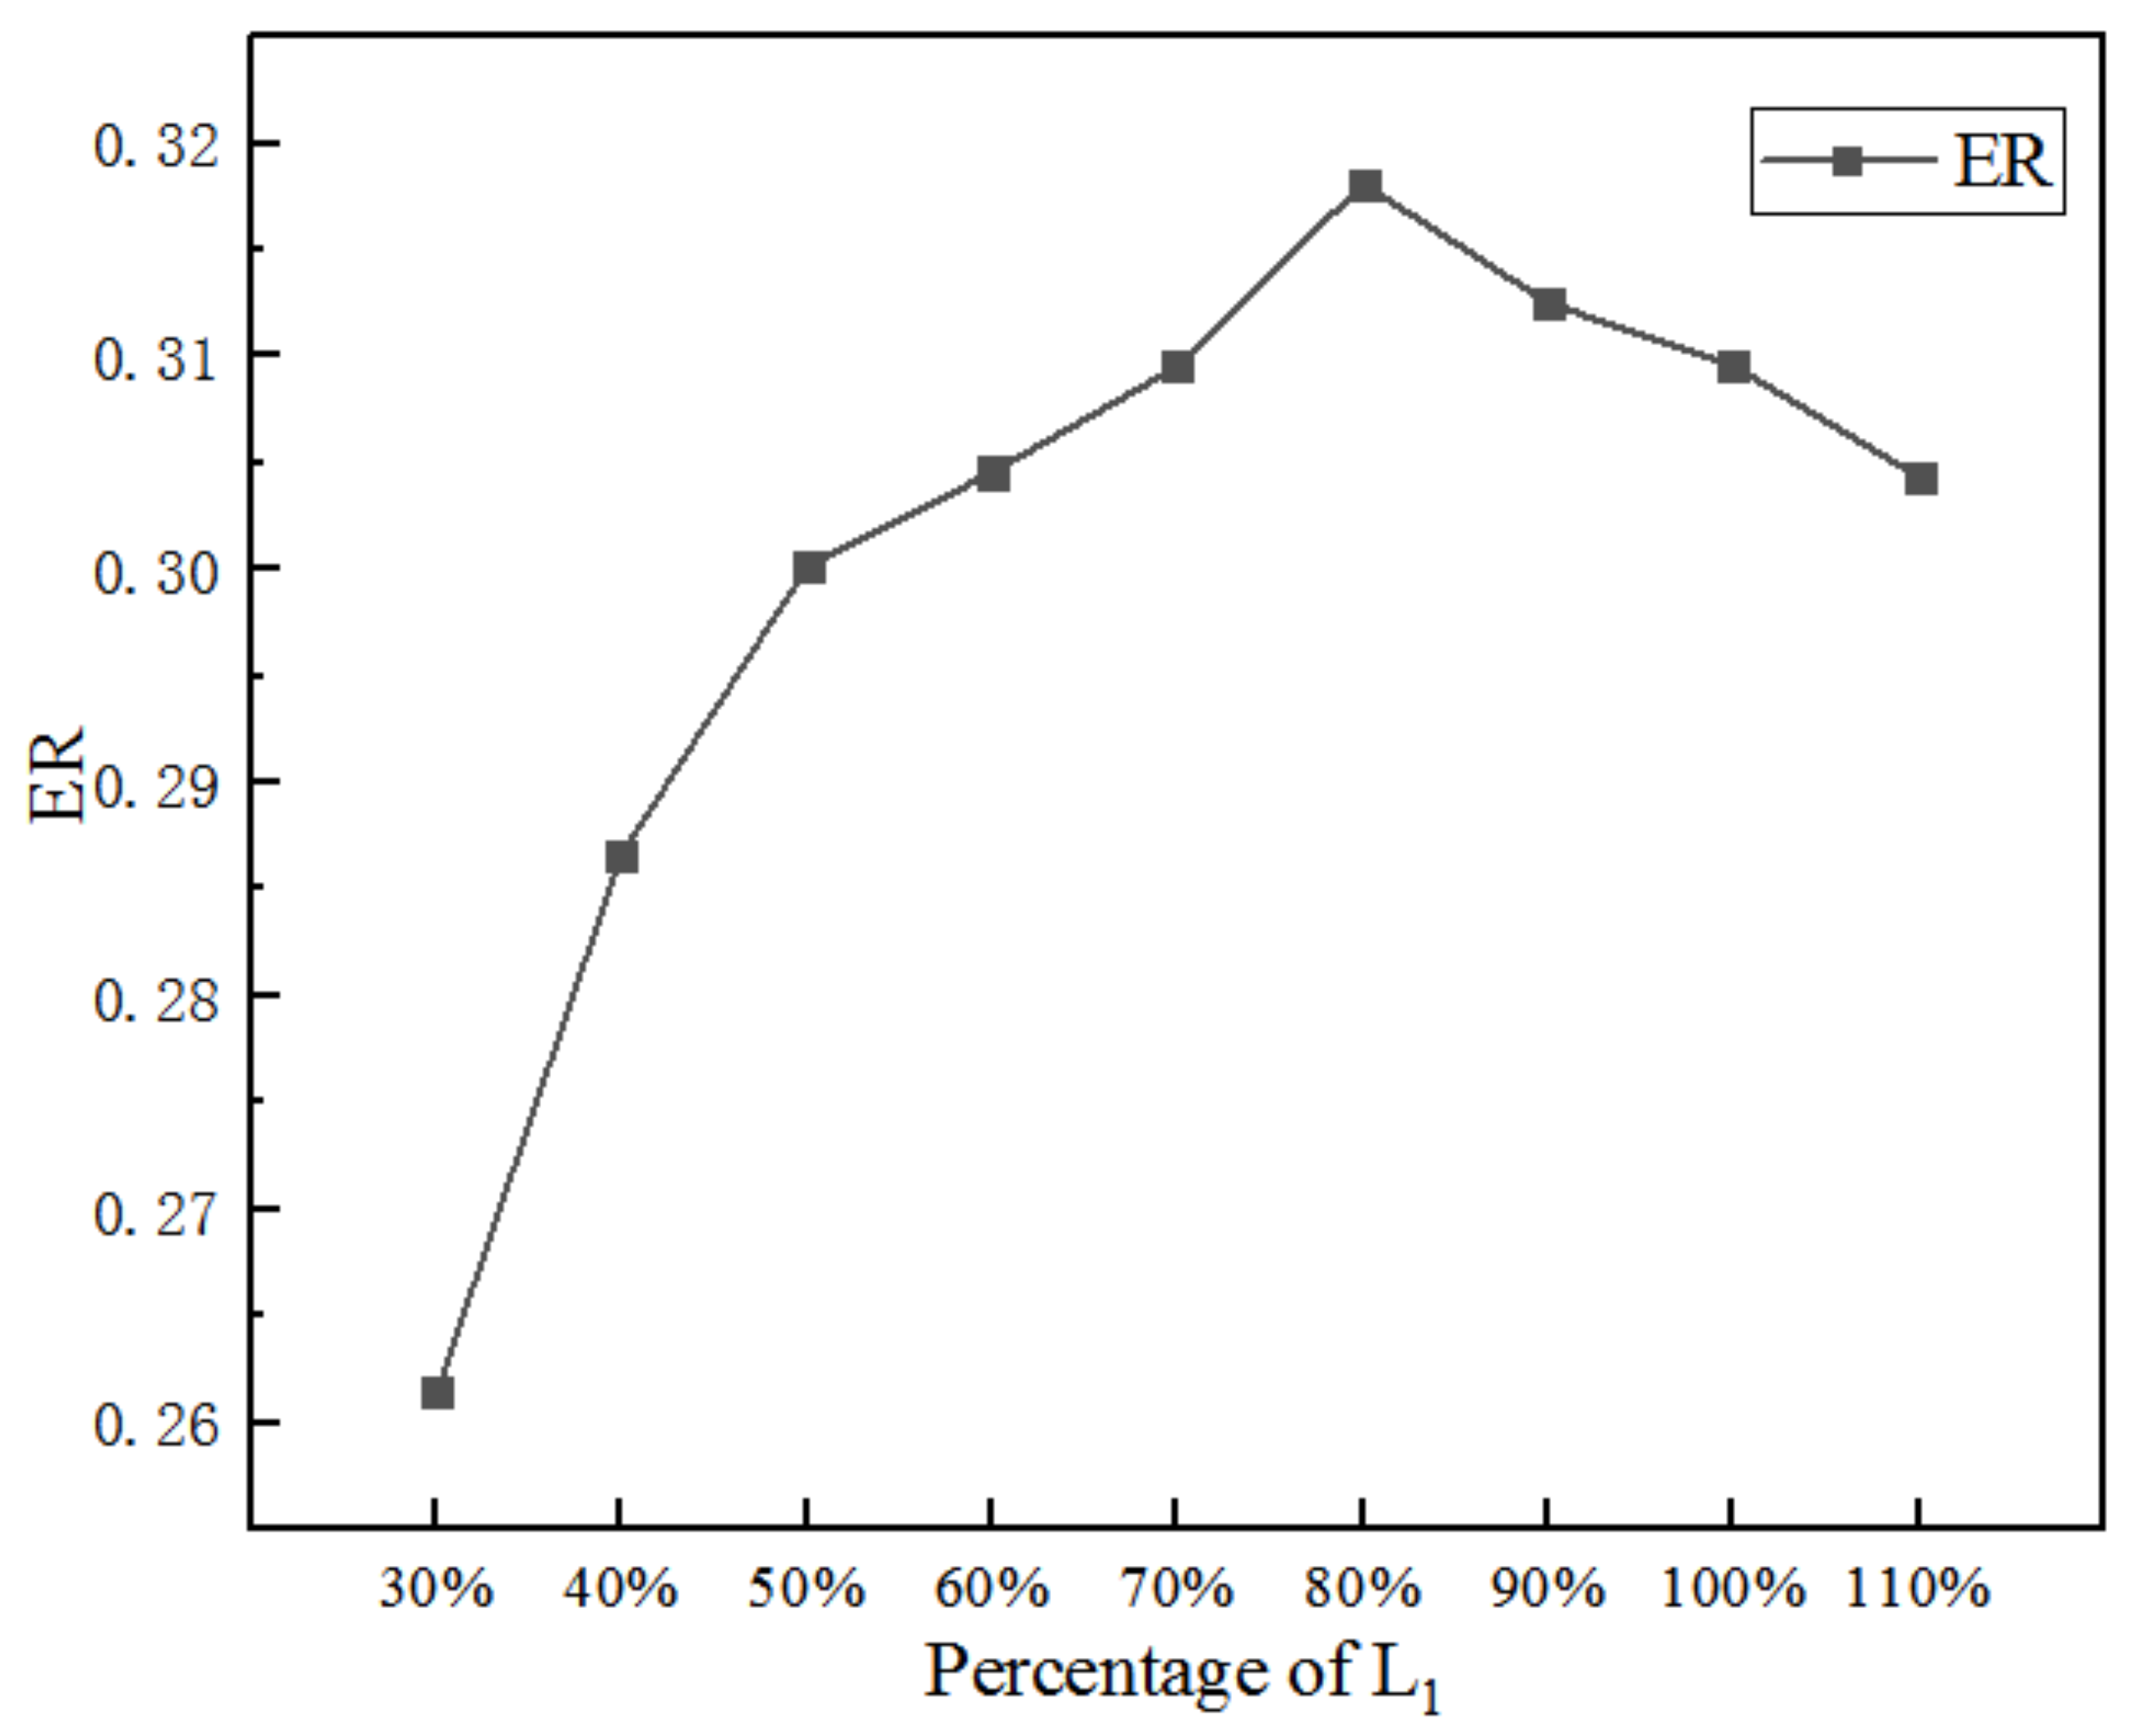
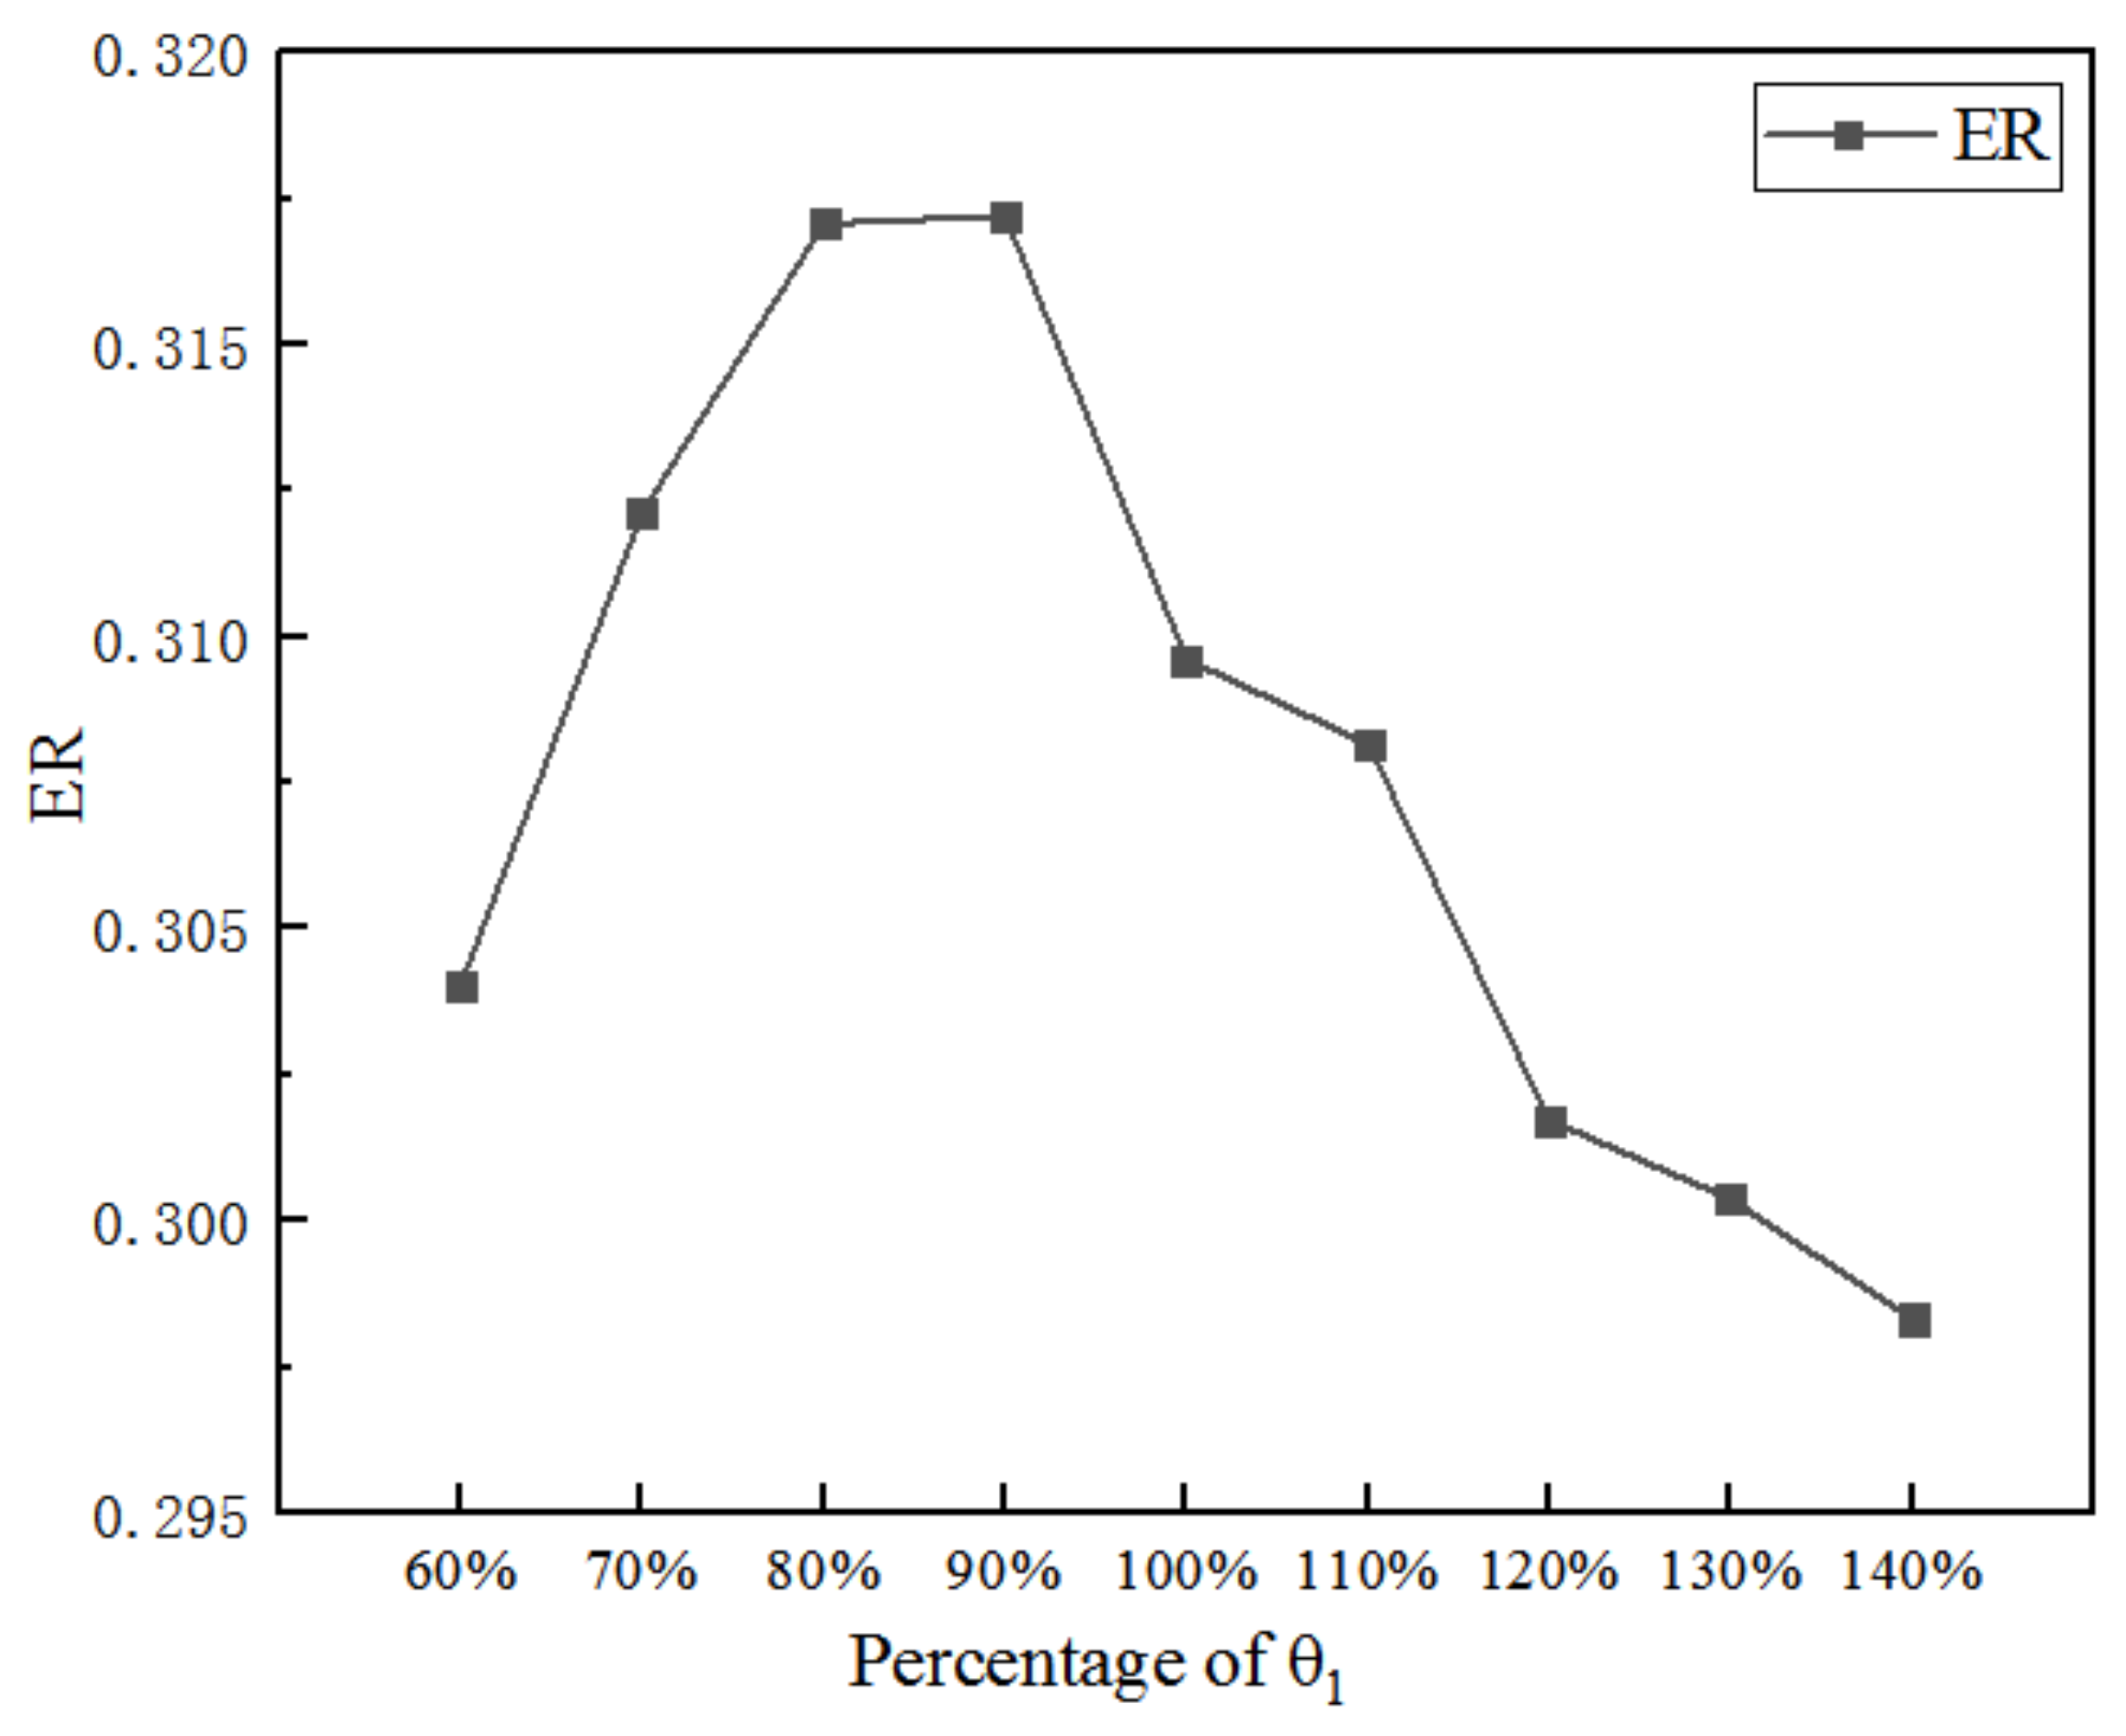
4.1. Effect of the Converging Section of the Primary Nozzle
- (1)
- Ejector performance under varied lengths and angles of converging section
- (2)
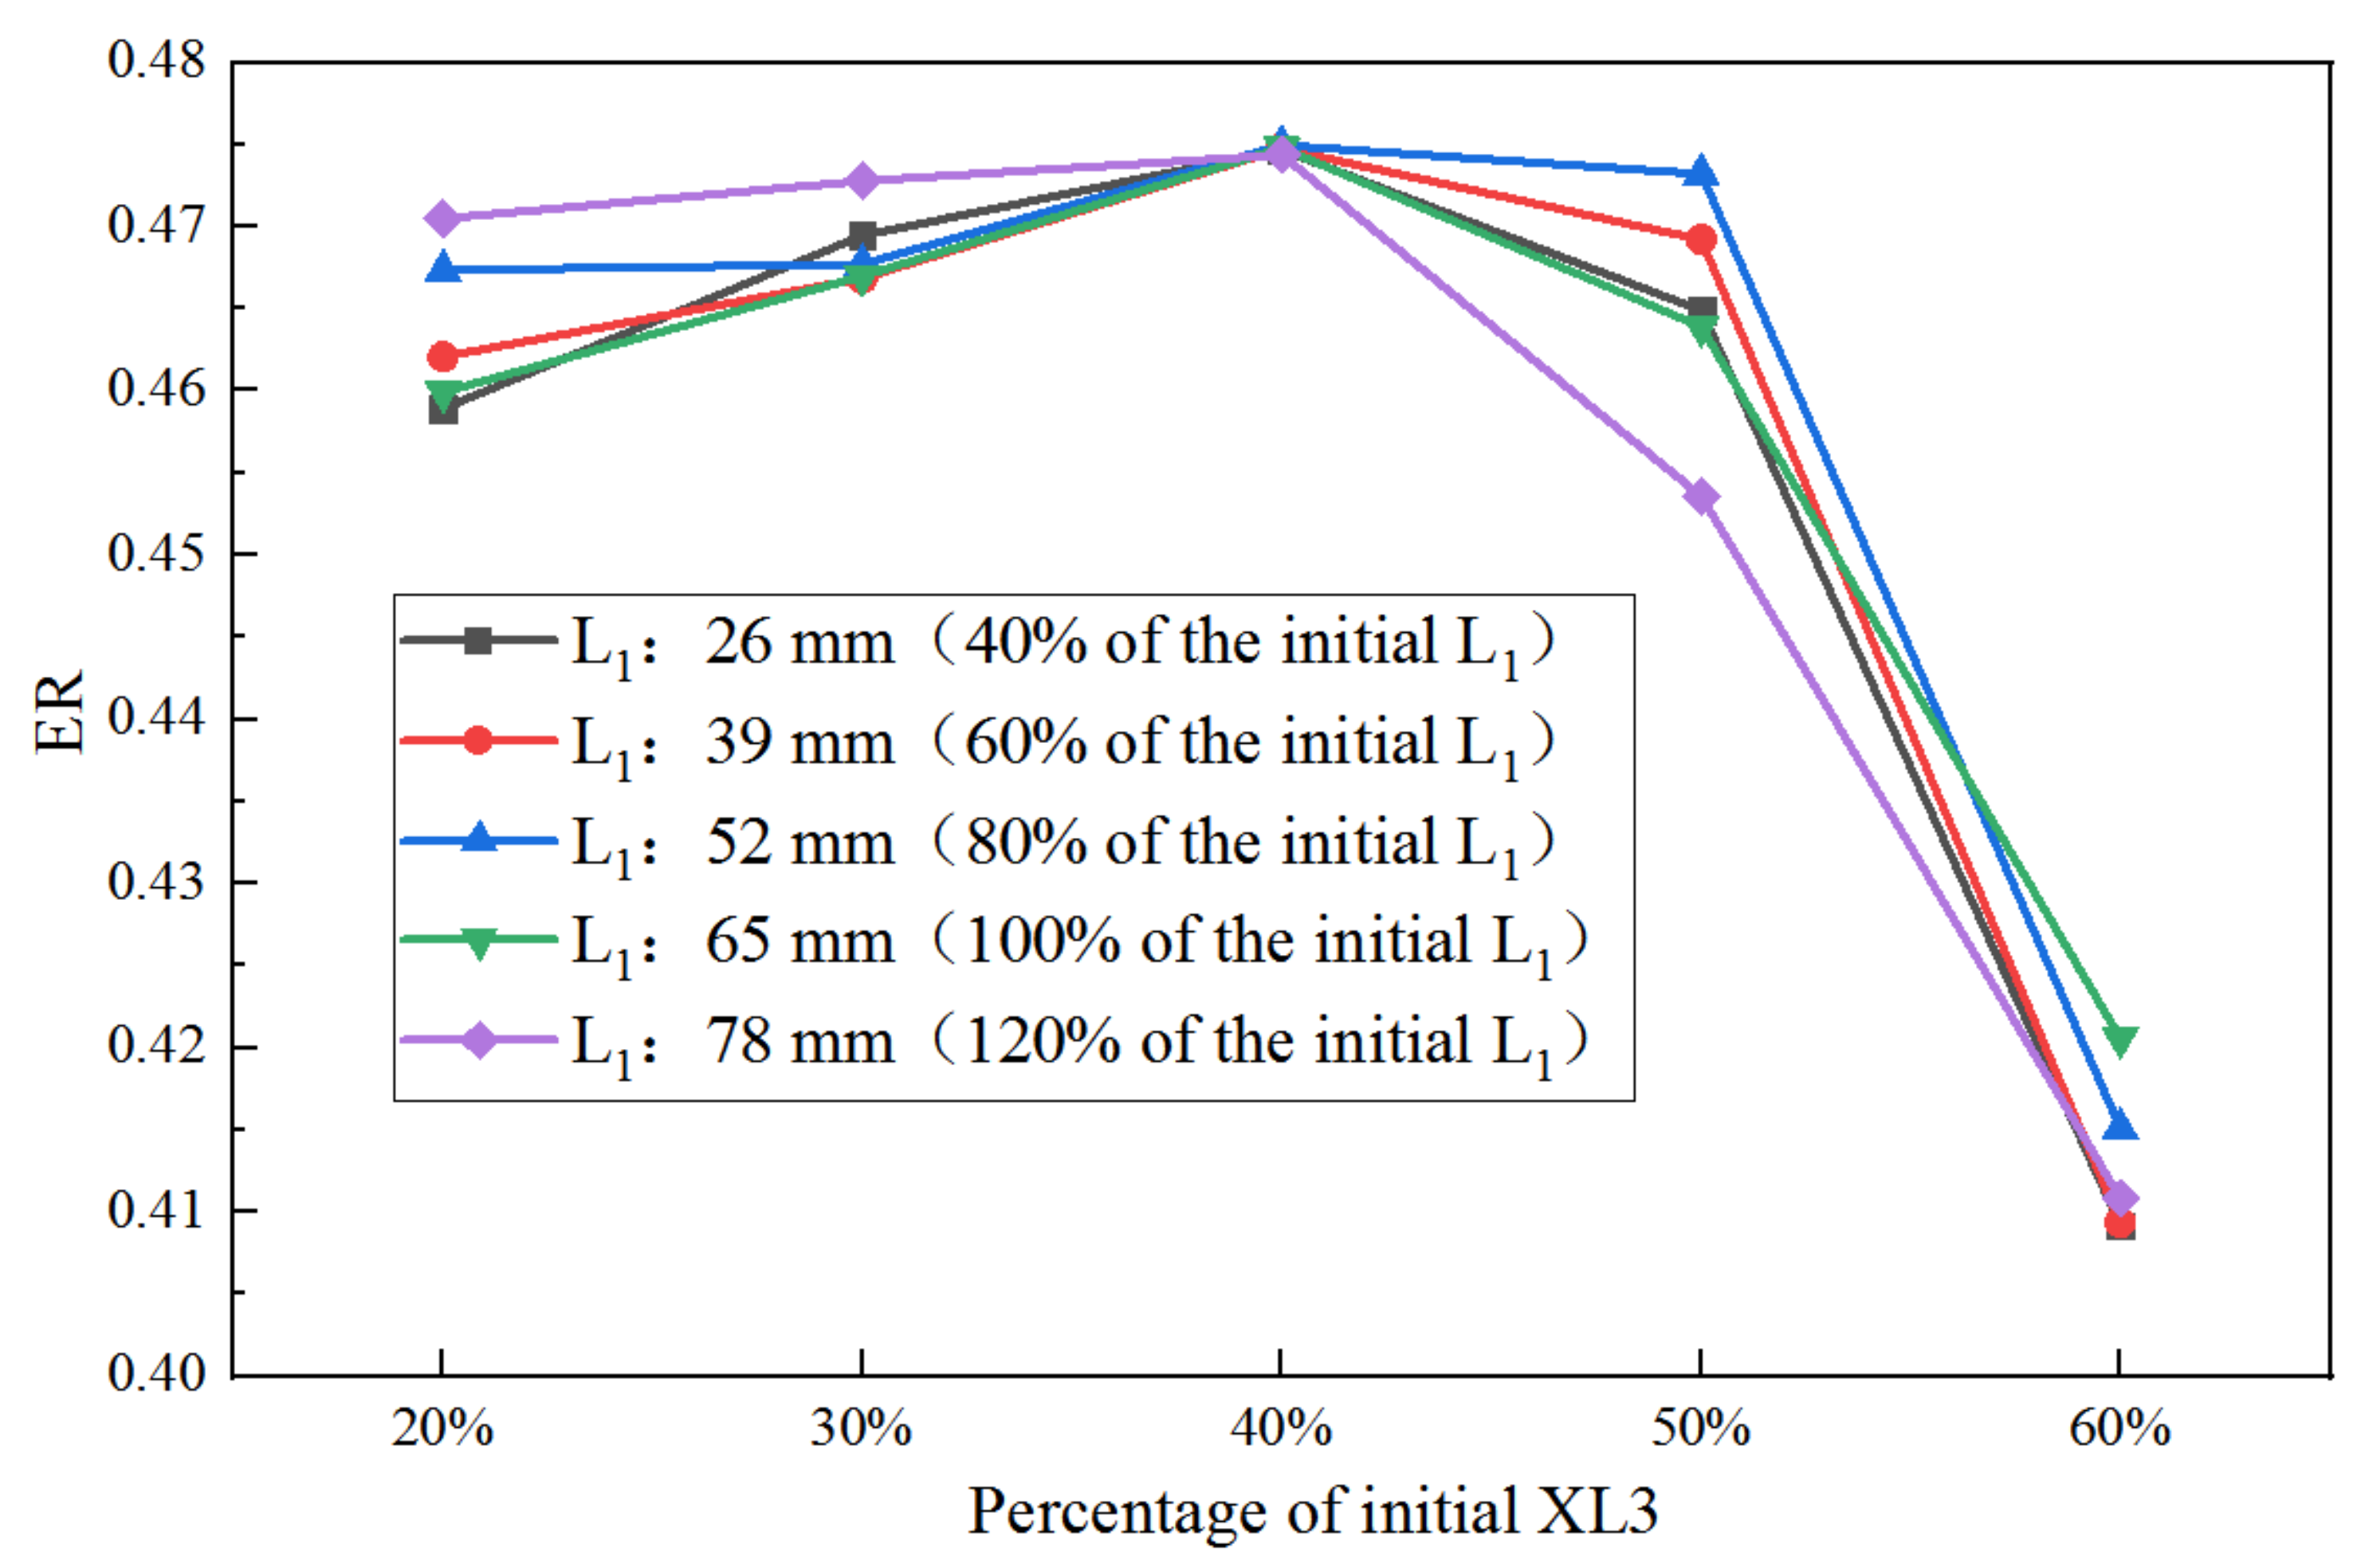
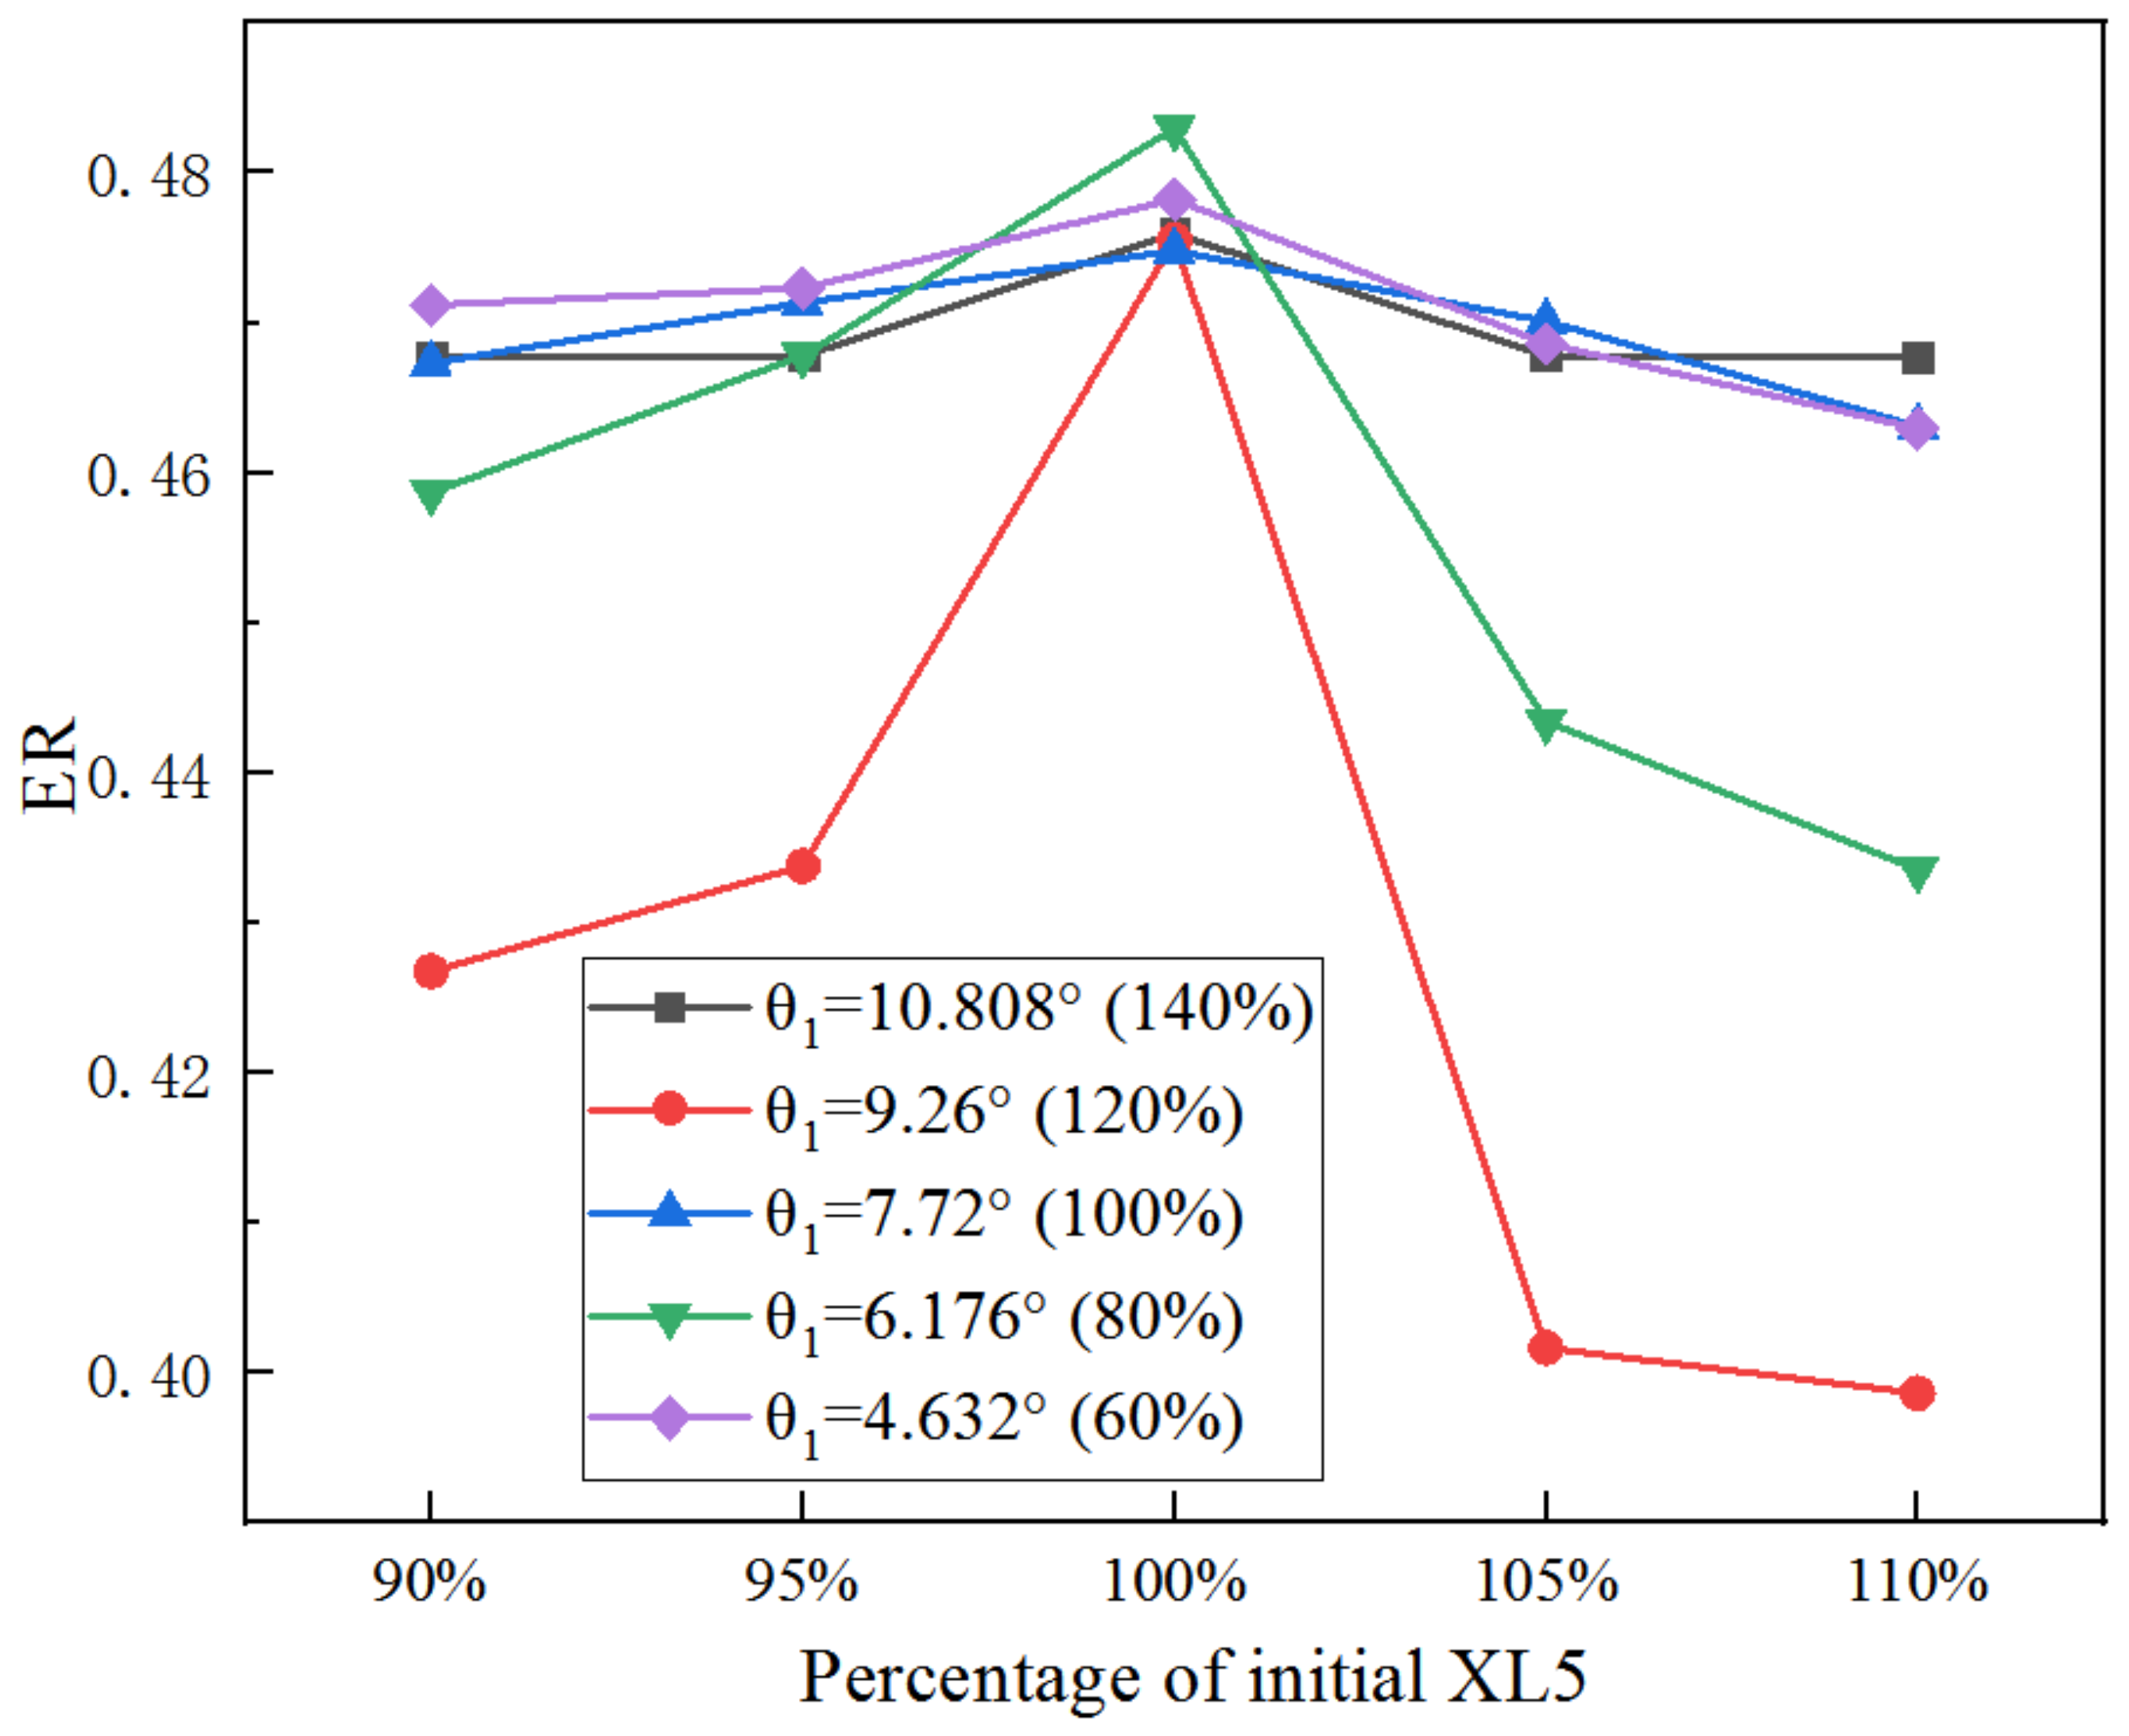
- Individually optimizing each of the other three key geometries under varied lengths and angles of the nozzle converging section
- (3)
- Sequentially optimizing the three key geometries under varied lengths and angles of the nozzle converging section
4.2. Effect of the Diverging Section of the Primary Nozzle
- (1)
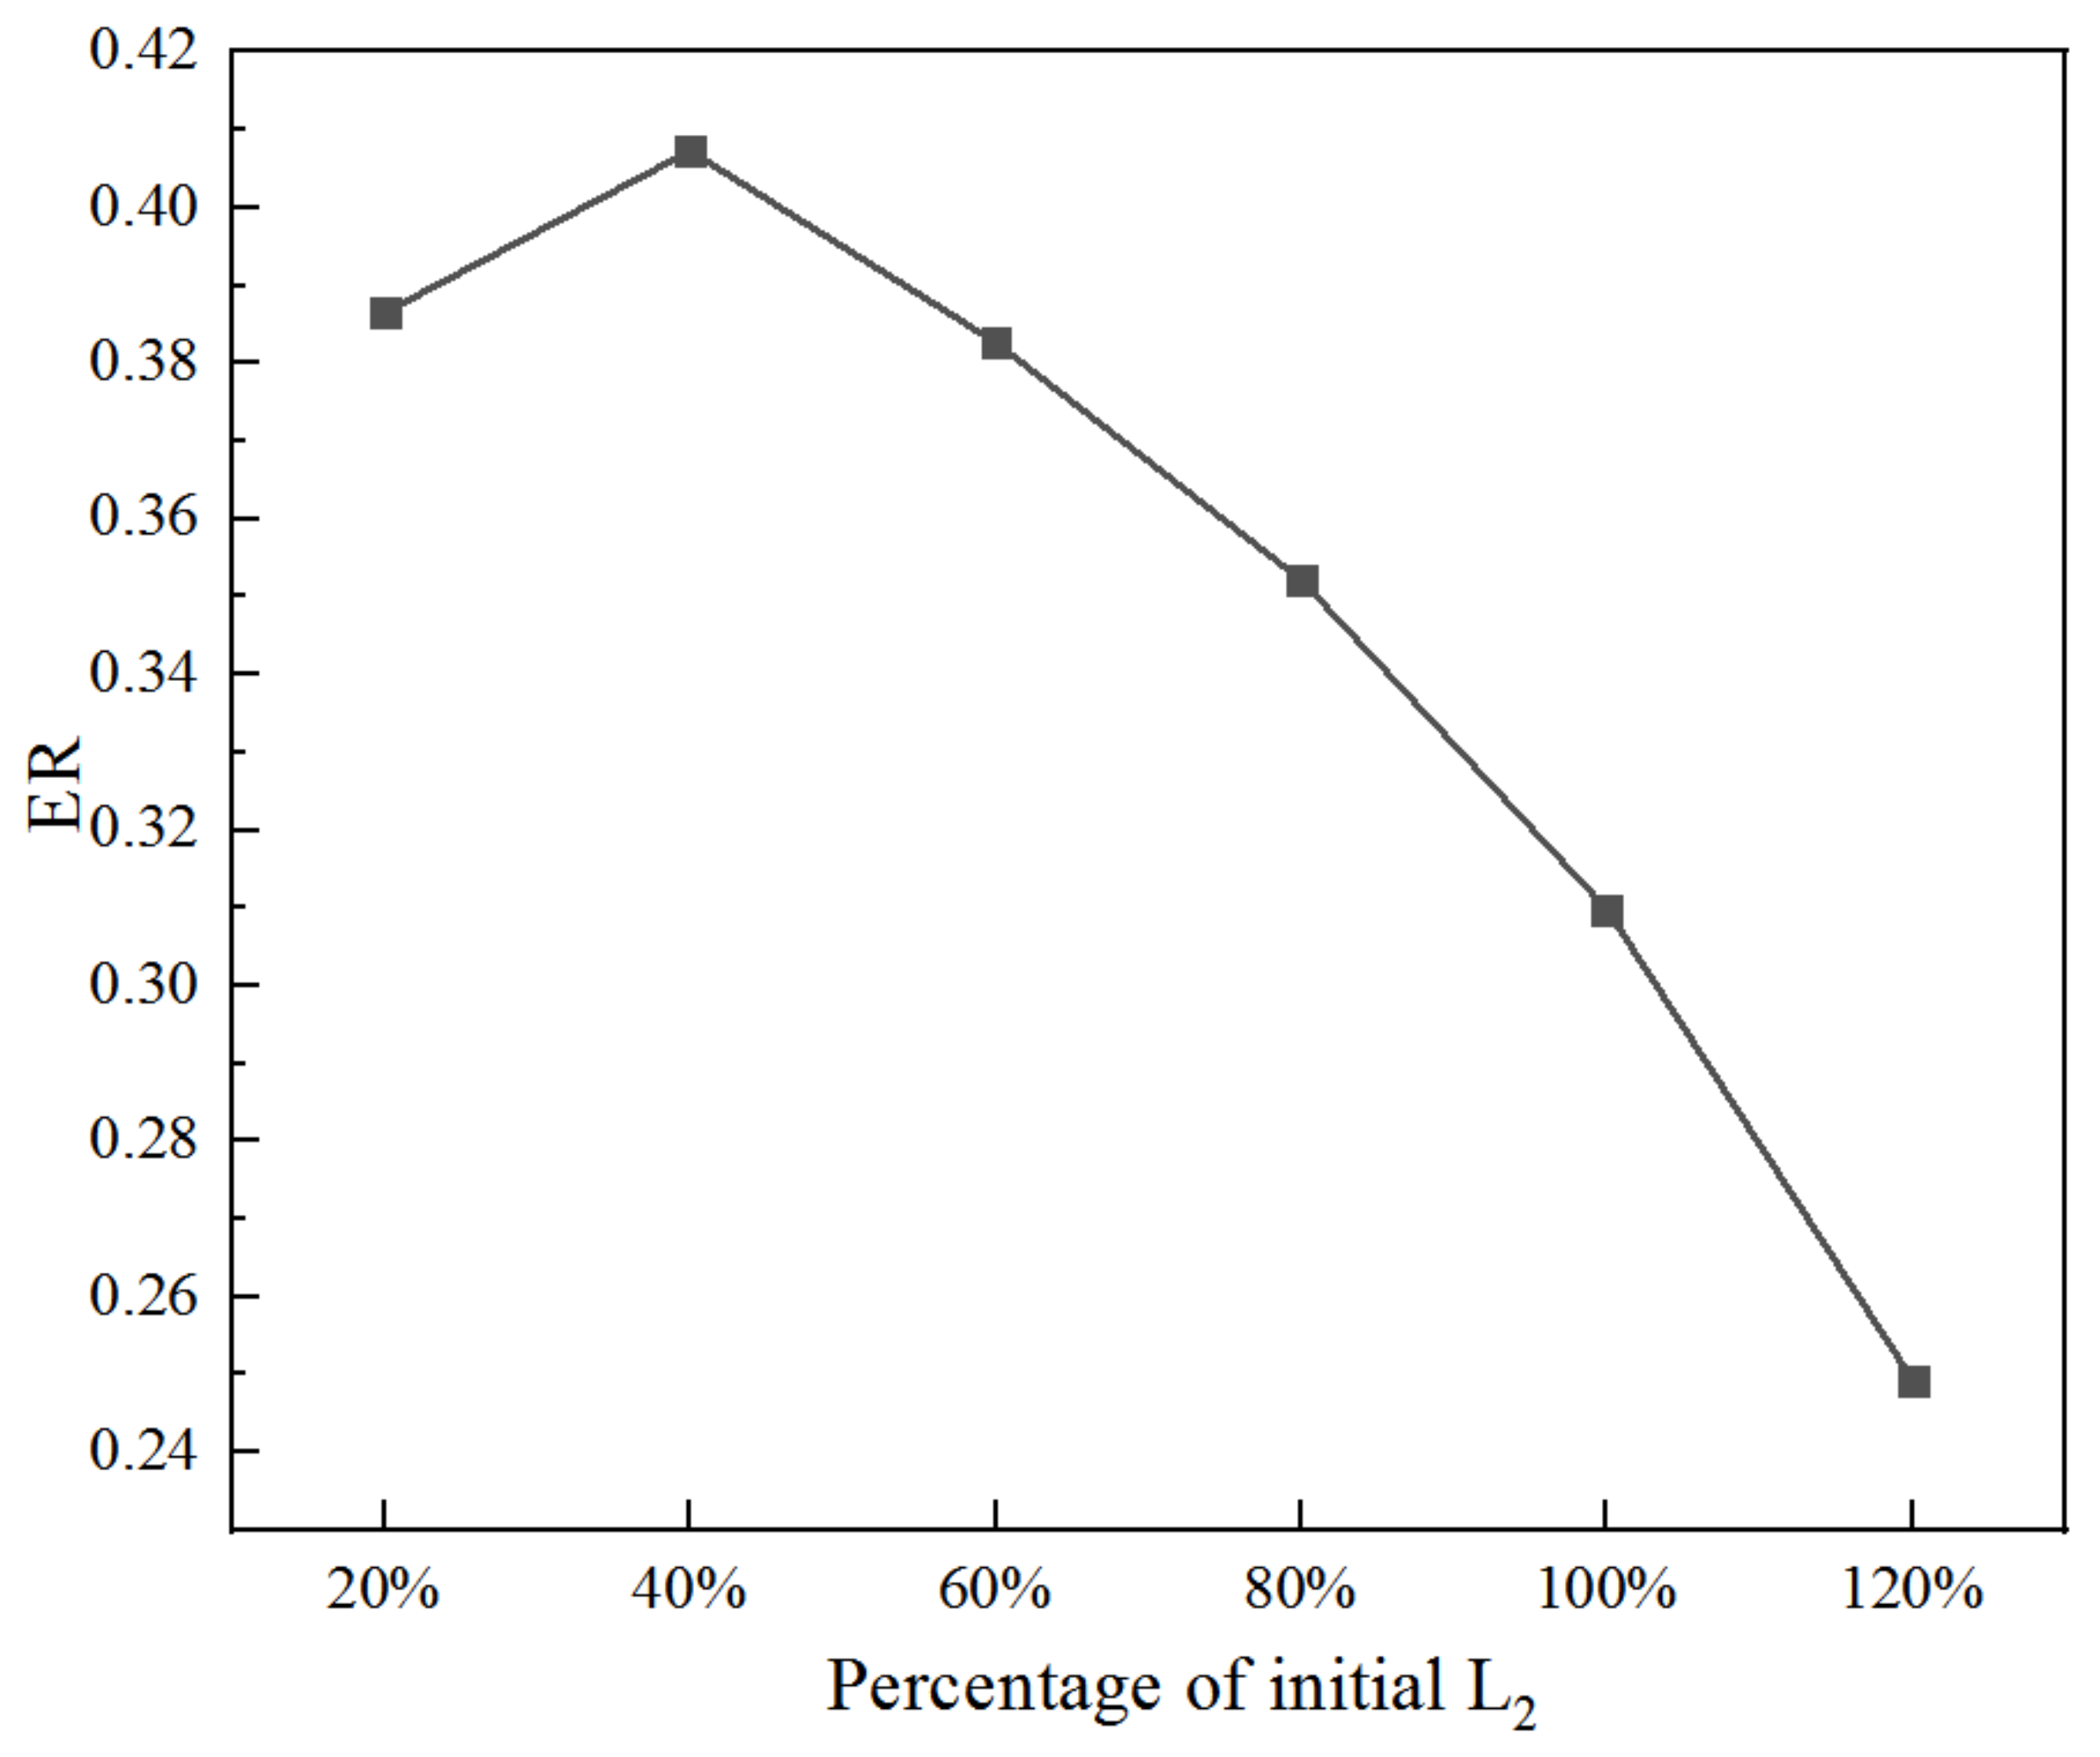
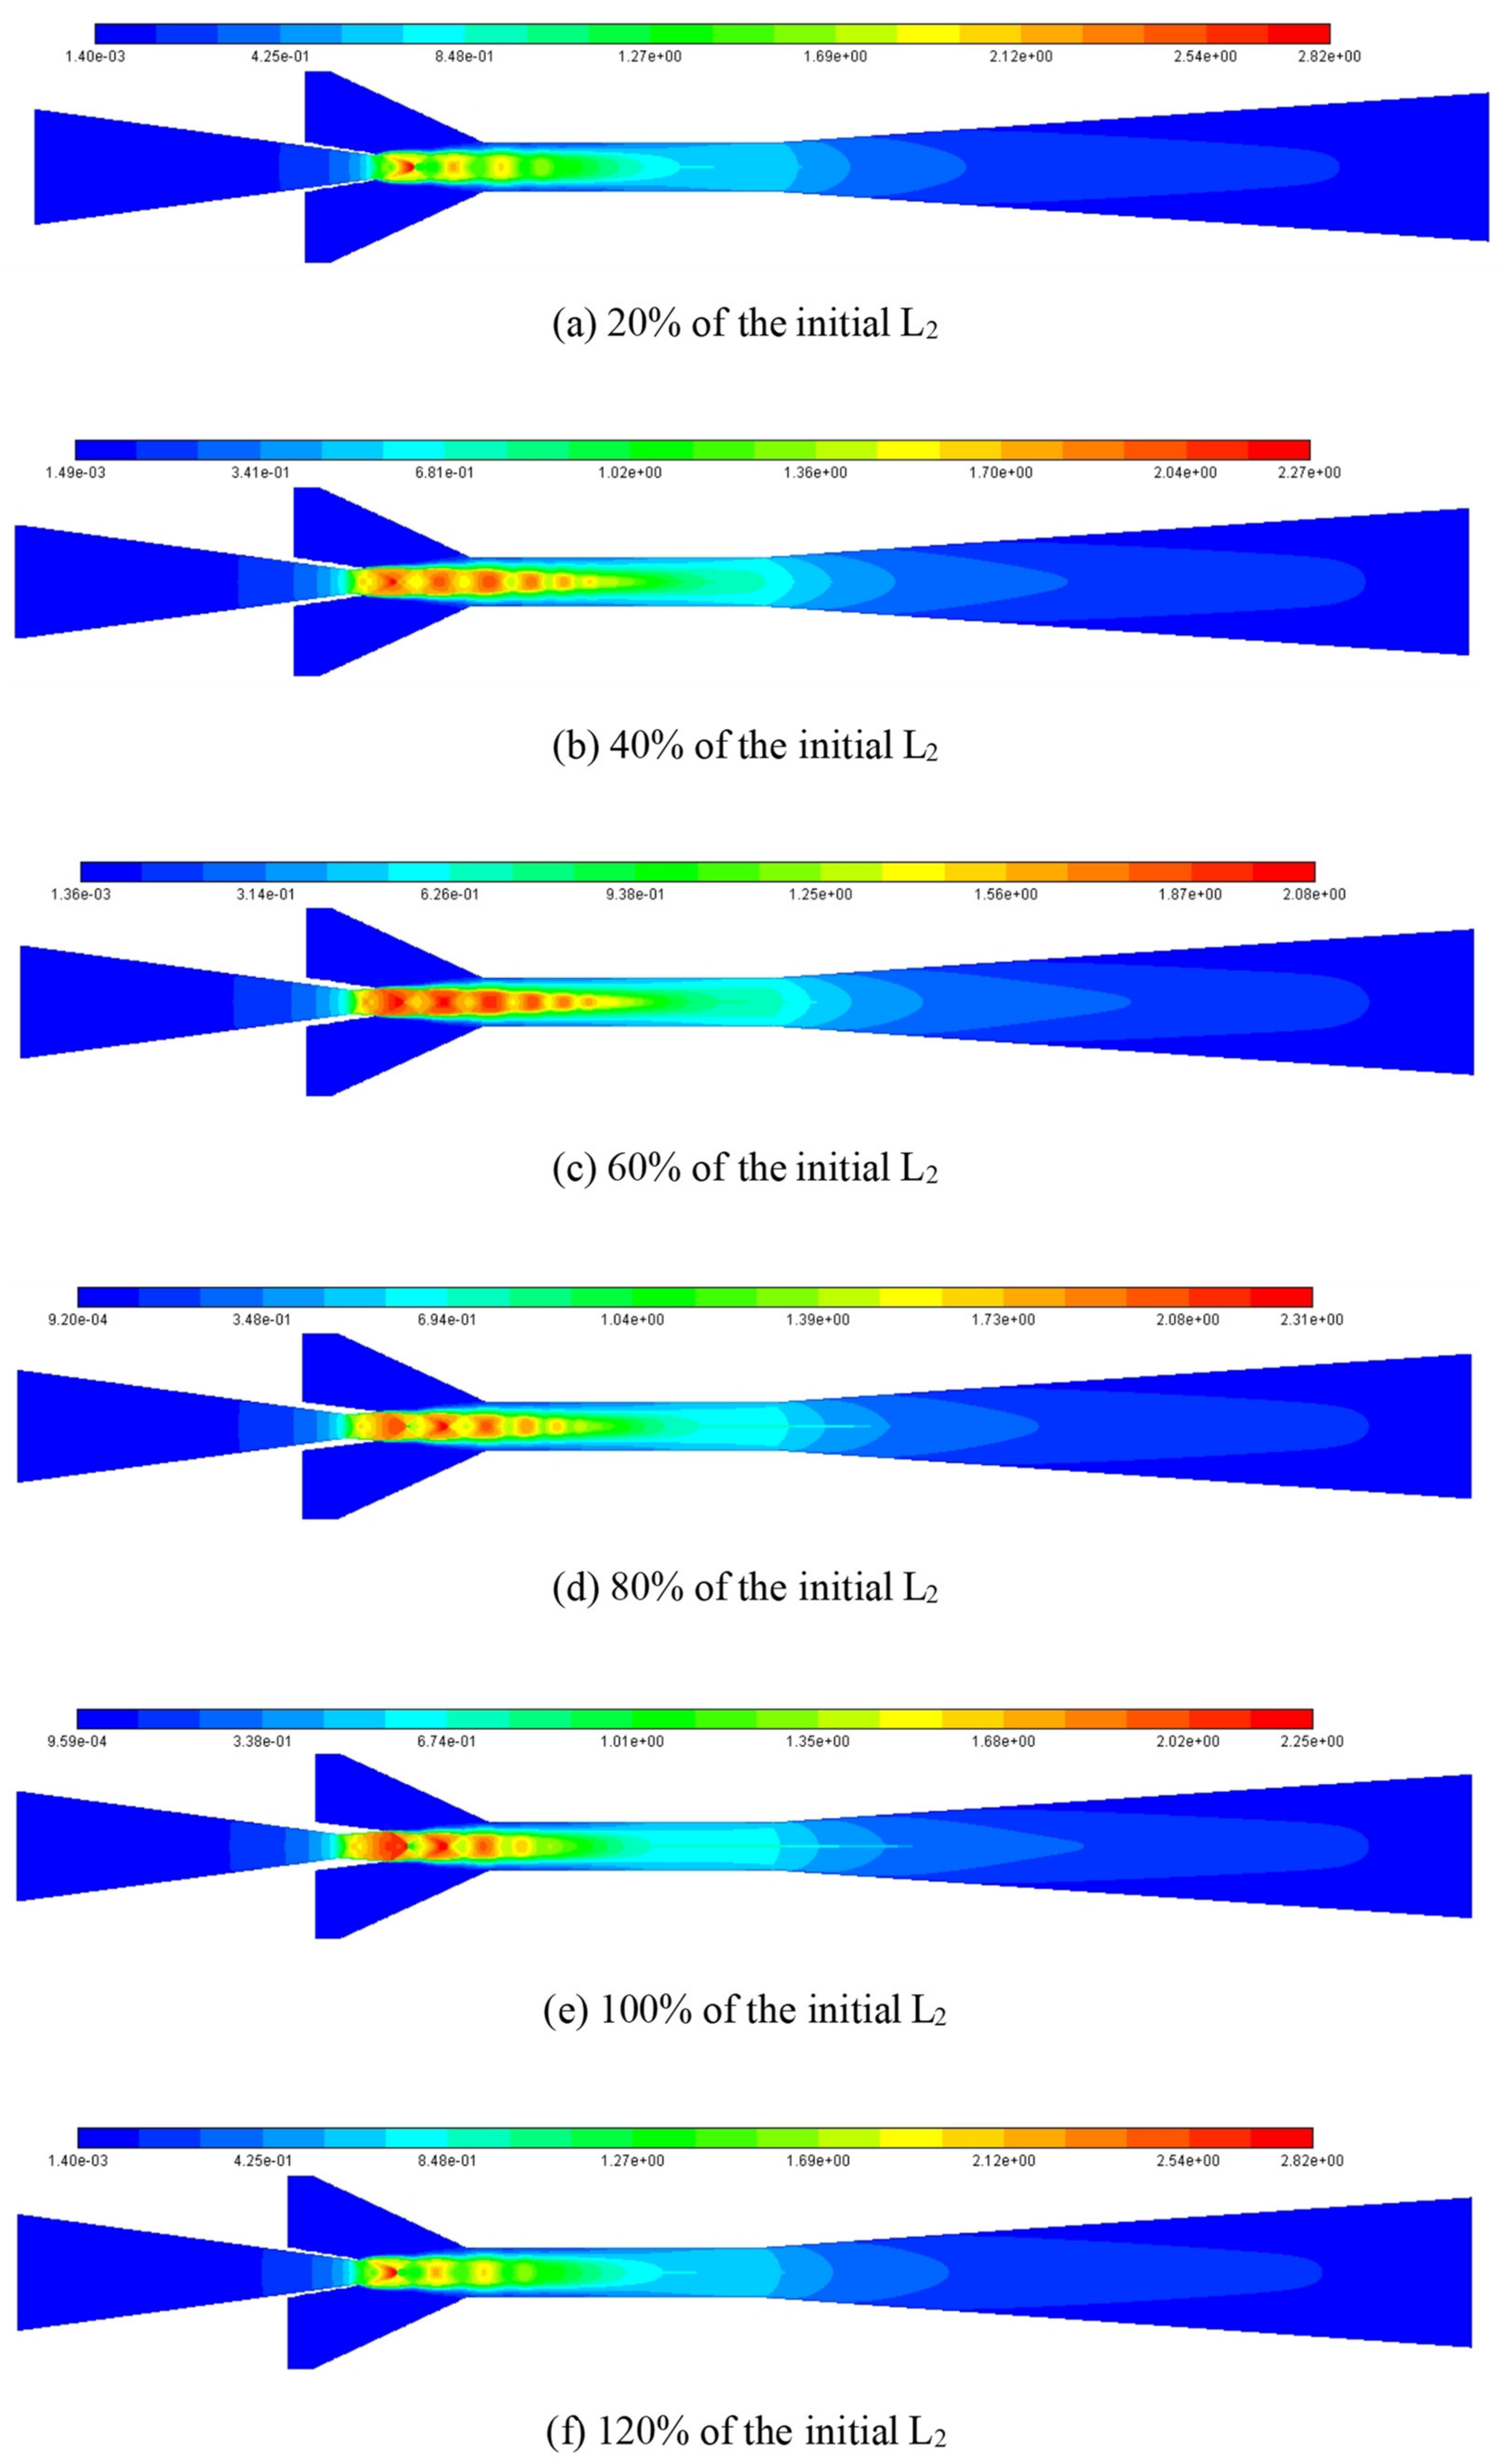
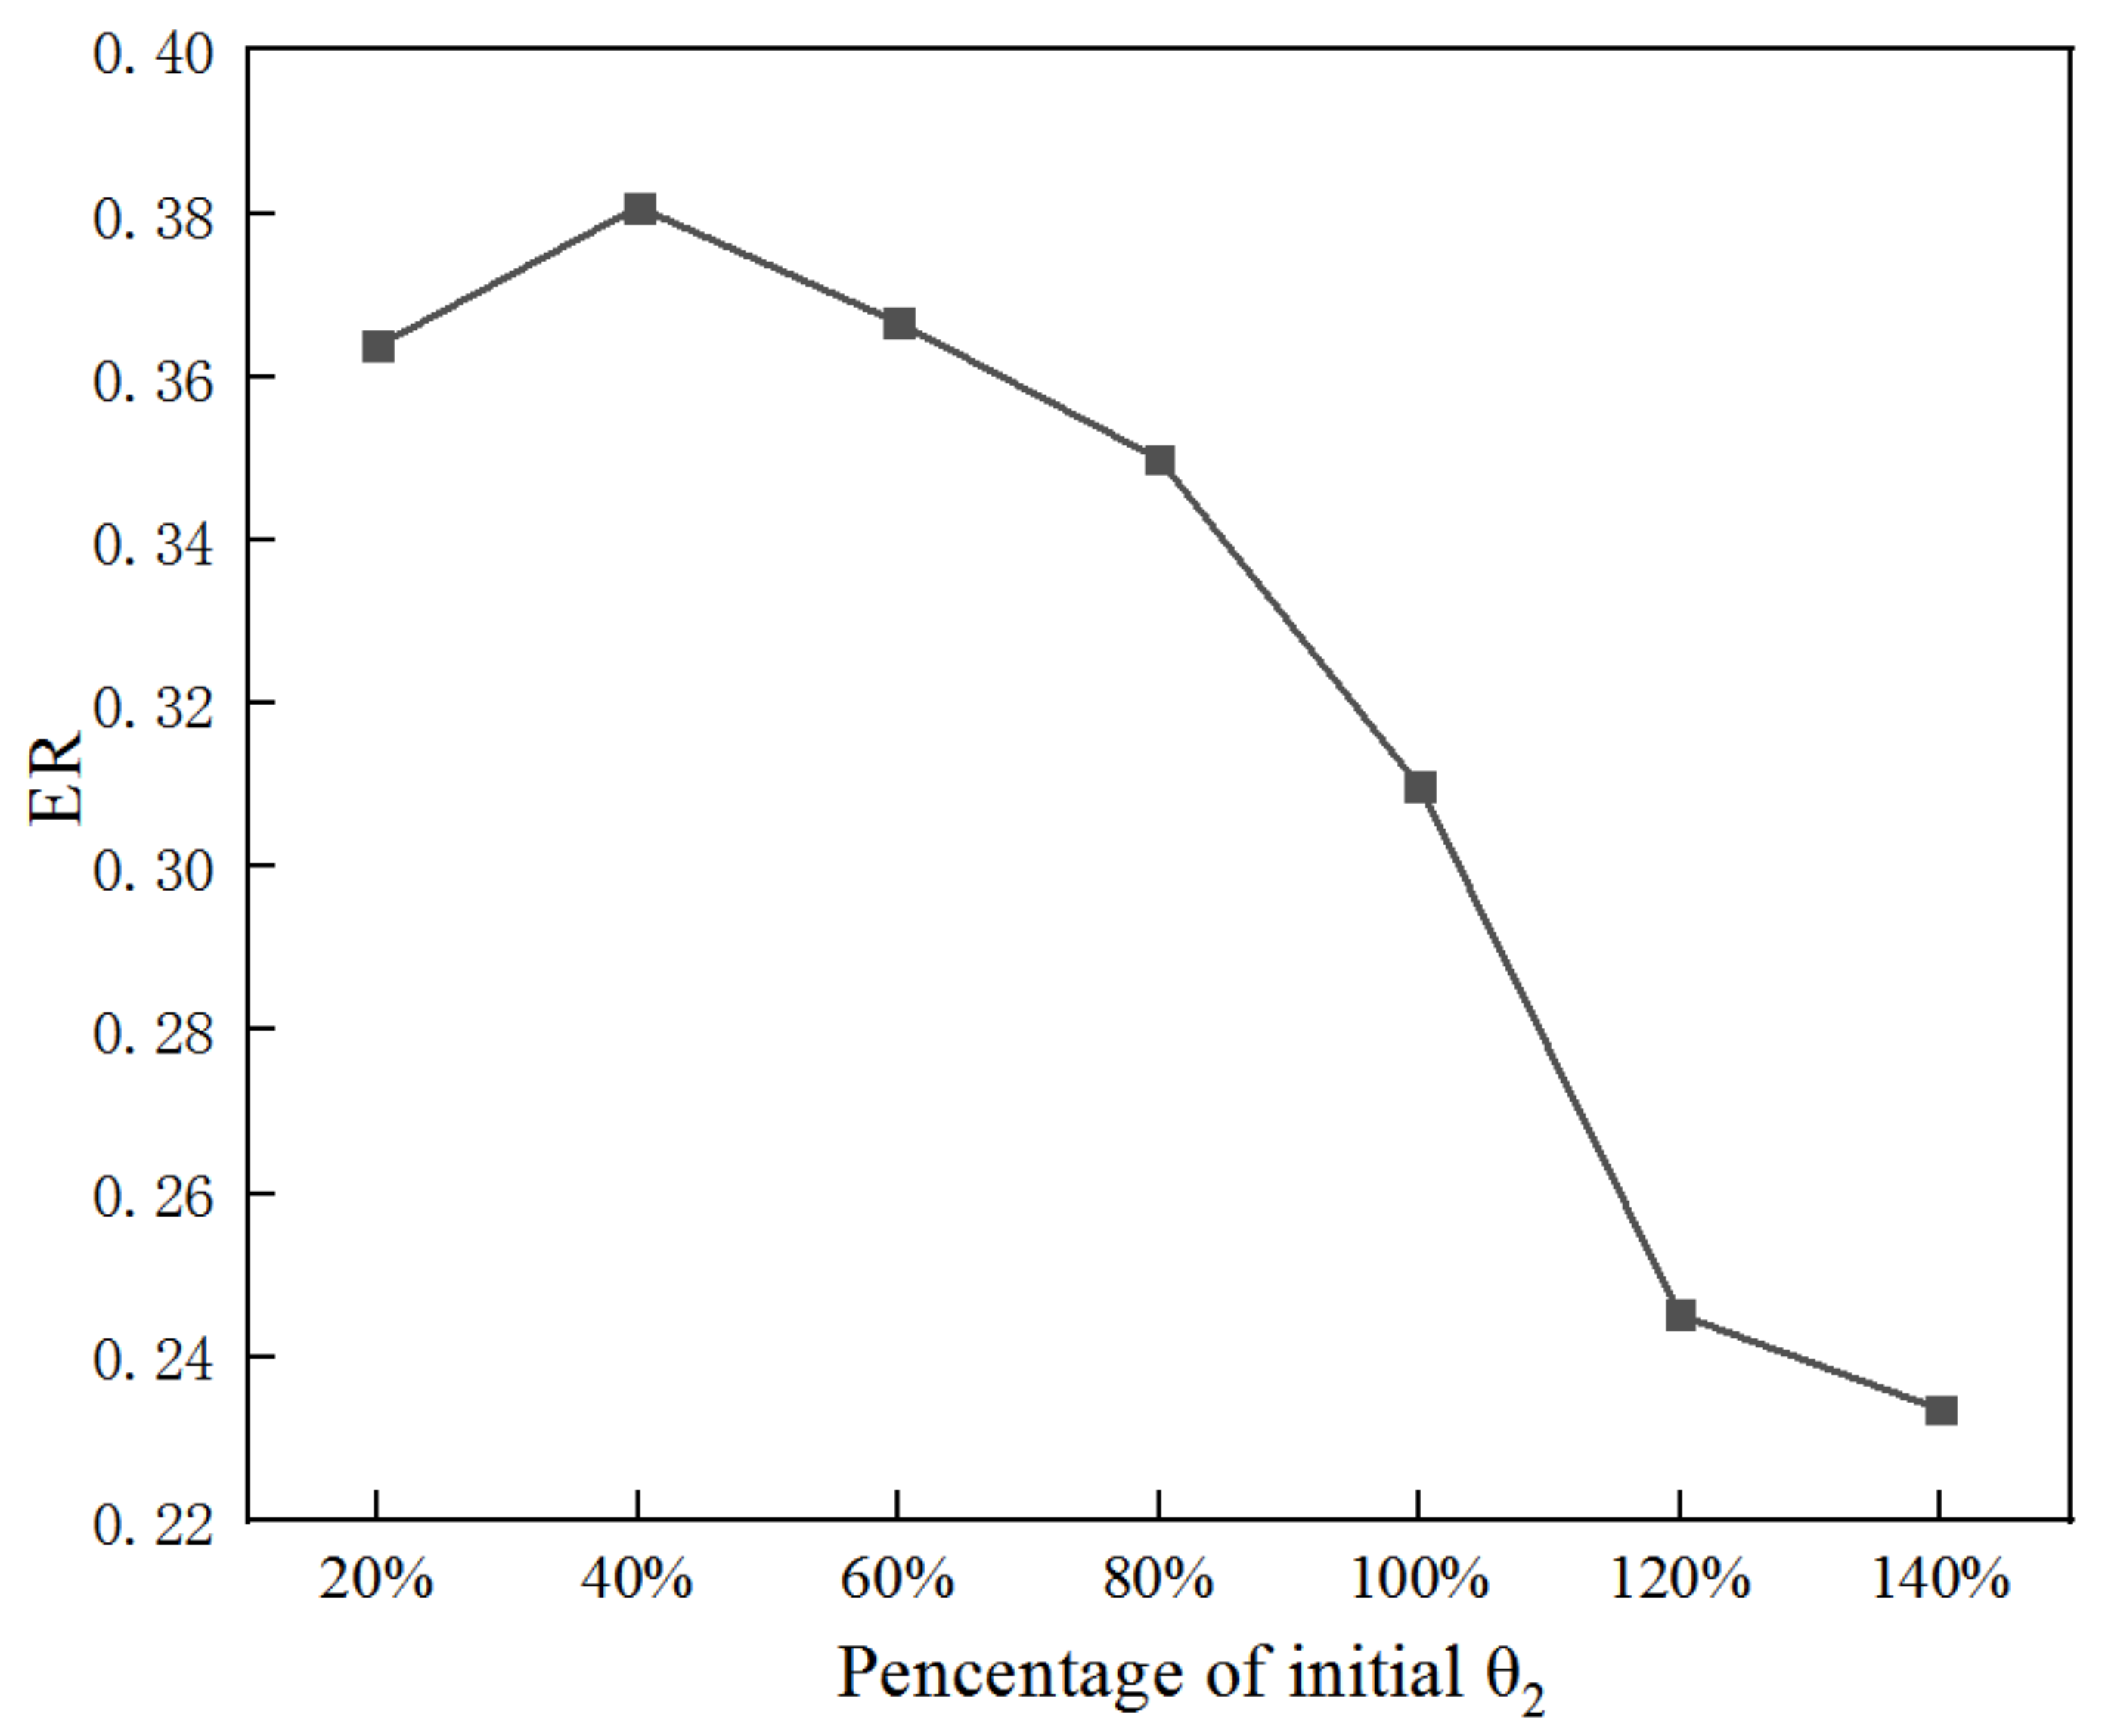
- Ejector performance under varied lengths and angles of the diverging section
- (2)
- Individually optimizing each key geometry under varied θ2 or L2
- (3)
- Sequentially optimizing three key geometries under varied lengths and angles of nozzle diverging section
5. Conclusions
- (1)
- The optimization of L1 and θ1 can improve the ER by 2.9% and 2.4%, while the optimization of those of the diverging section of the nozzle can lift it by 31.5% and 22.9%, respectively. Thus, the ER improvement is quite limited if only one of the four parameters of the nozzle is optimized.
- (2)
- With the increase of XL3, a larger θ1 and a smaller L1 are needed to offer the maximum ER; with the increase of D5, it requires the larger of them to obtain the highest ER; however, ER has not an evident relation with θ1 or L1 with given XL5.
- (3)
- If XL3, D5, or XL5 is separately optimized based on given θ2 or L2. Each of the optimized dimensions is identified with a given angle or length of the nozzle diverging section; furthermore, smaller optimized D5 or XL5 can achieve better optimal ER.
- (4)
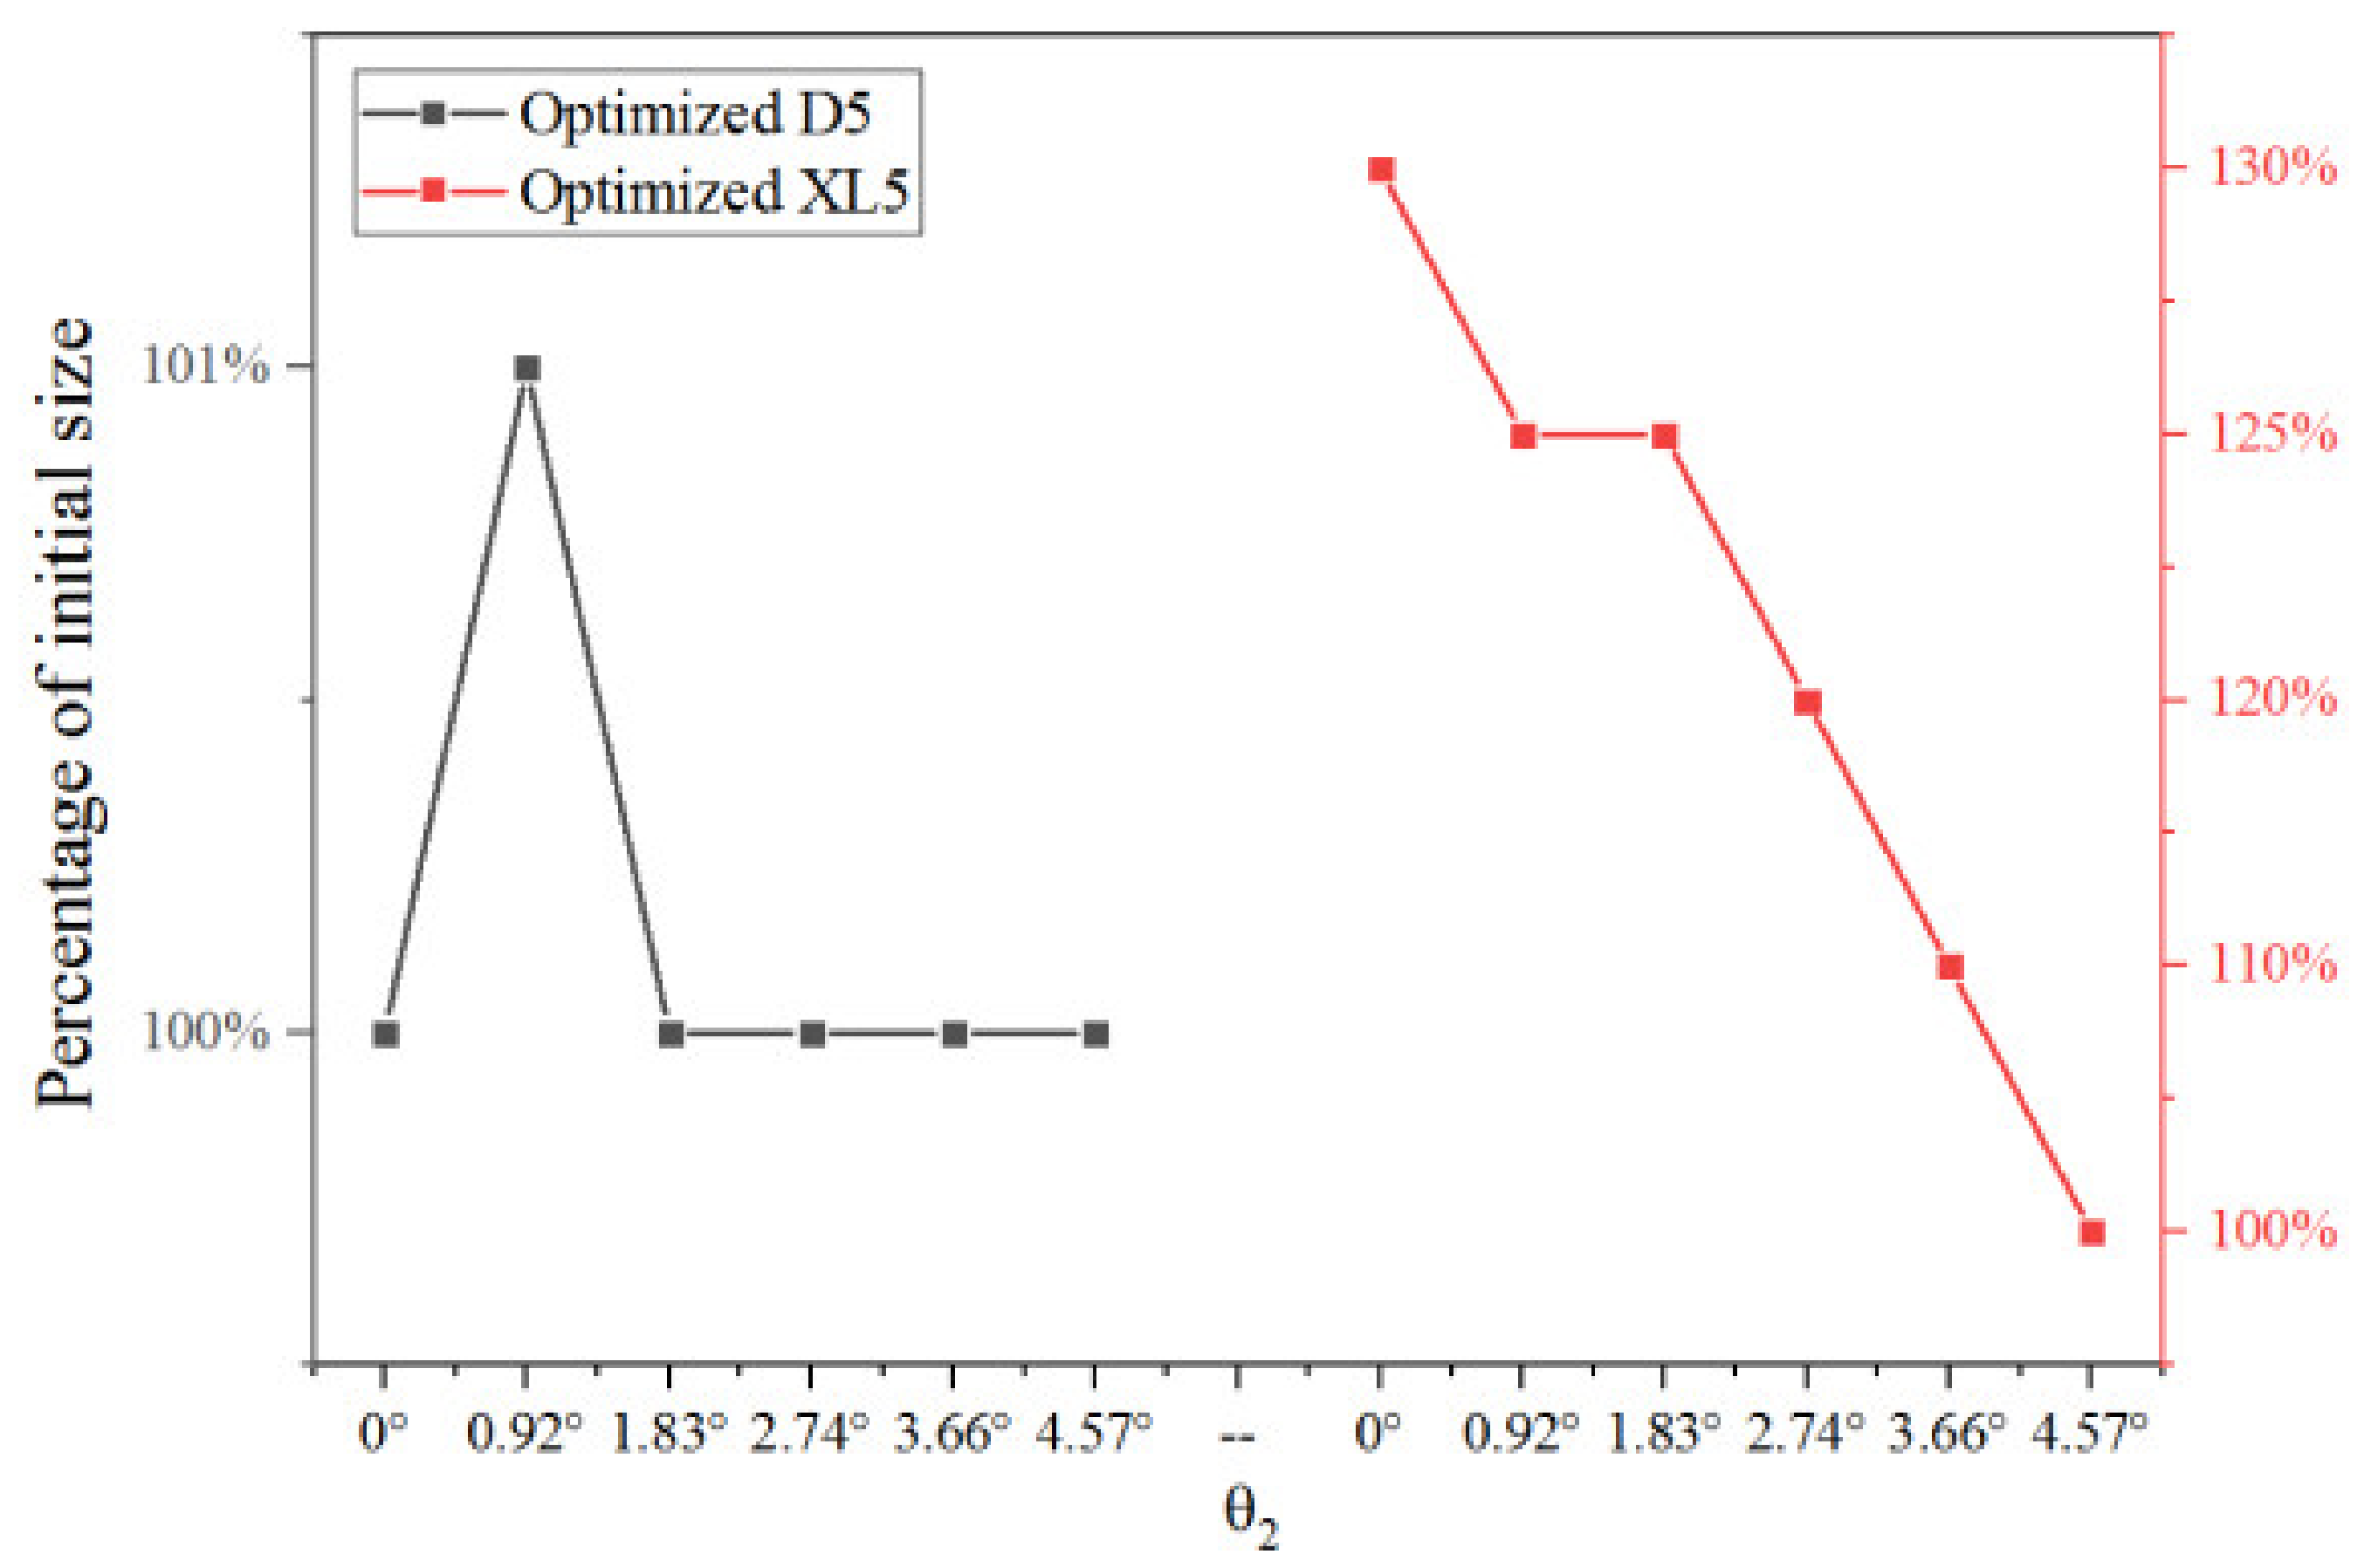
- With the given sequence of XL3→D5→XL5, optimized XL3 and D5 are obtained with given θ2; and optimized XL3 and XL5 are achieved with given L2. However, two exceptions are different from others, one is that the optimized XL5 decreases almost linearly with the increase of θ2; and the other is that the optimized D5 keeps unchanged with L2.
- (5)
- The ejector ER can be explained well with the number of shock clusters and shock chain length or area of low static pressure zone when the geometries vary.
Author Contributions
Funding
Institutional Review Board Statement
Informed Consent Statement
Data Availability Statement
Conflicts of Interest
Nomenclature
| Symbols | |
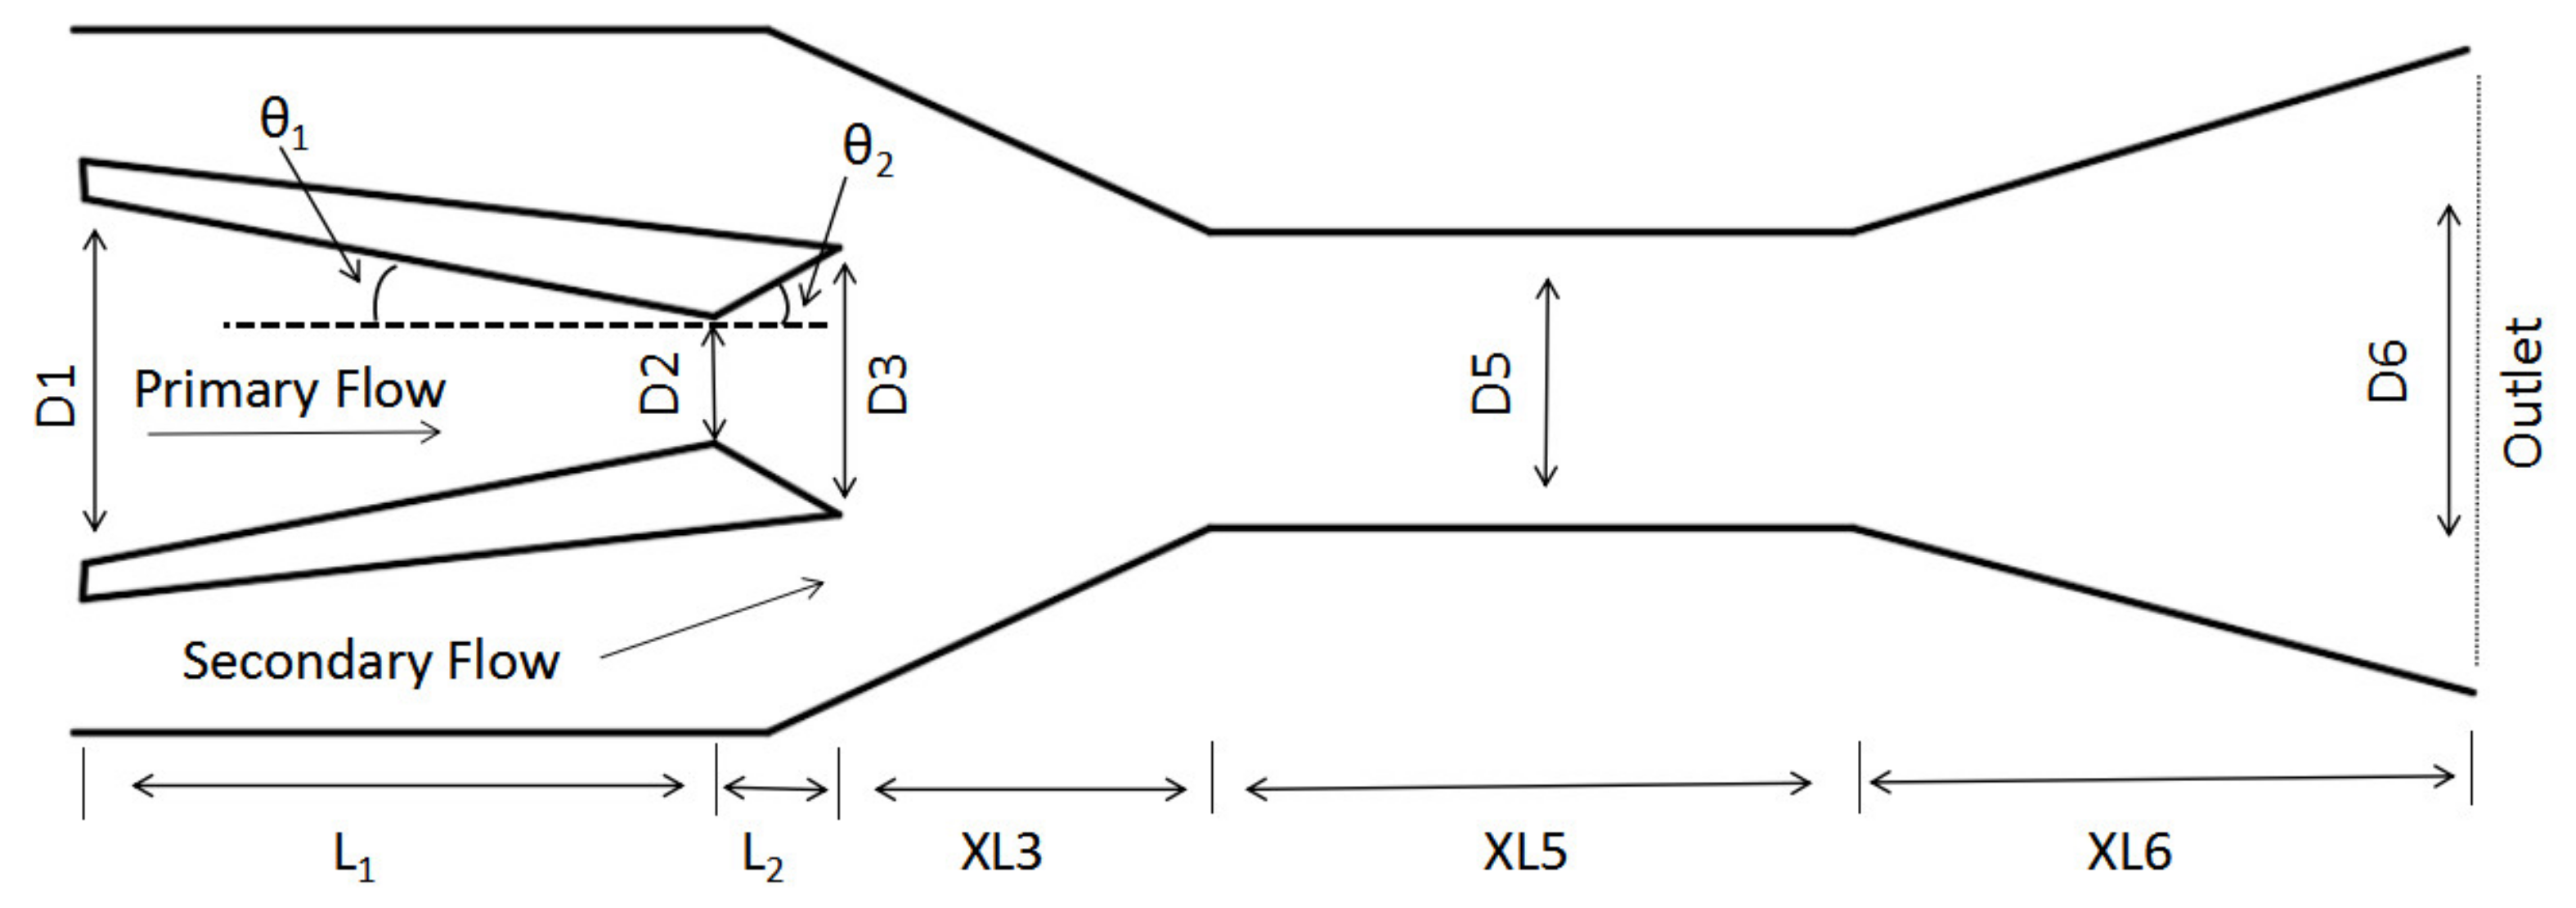
| L1 | length of nozzle converging section, mm |
| L2 | length of nozzle diverging section, mm |
| θ1 | angle of nozzle converging section, ° |
| θ2 | angle of nozzle diverging section, ° |
| XL3 | length of constant-pressure mixing chamber, mm |
| XL5 | length of constant-area mixing chamber, mm |
| D5 | diameter of constant-area mixing chamber, mm |
| S | relative sensitivity |
| ERm | maximum entrainment ratio |
| ERr | entrainment ratio of referred point |
| Gm | optimum geometry, mm |
| Gr | referred geometry, mm |
| P | pressure, kPa |
| T | temperature, K or °C |
| M | mass flow rate, g·s−1 |
| Subscripts | |
| 1 | nozzle converging section |
| 2 | nozzle diverging section |
| p | primary flow |
| s | secondary flow |
| Abbreviations | |
| AR | Area ratio |
| ER | Entrainment ratio |
| NXP | Nozzle exit position |
References
- Dong, H.; Xue, M.; Xiao, Y.; Liu, Y. Do carbon emissions impact the health of residents? Considering China’s industrialization and urbanization. Sci. Total Environ. 2021, 758, 143688. [Google Scholar] [CrossRef] [PubMed]
- Song, Y.; Wang, X.; Wang, L.; Pan, F.; Chen, W.; Xi, F. A twin-nozzle ejector for hydrogen recirculation in wide power operation of polymer electrolyte membrane fuel cell system. Appl. Energy 2021, 300, 117442. [Google Scholar] [CrossRef]
- Kanti, P.; Sharma, K.V.; Said, Z.; Bellos, E. Numerical study on the thermo-hydraulic performance analysis of fly ash nanofluid. J. Therm. Anal. Calorim. 2021, 147, 2101–2113. [Google Scholar] [CrossRef]
- Kanti, P.; Sharma, K.; Said, Z.; Kesti, V. Entropy generation and friction factor analysis of fly ash nanofluids flowing in a horizontal tube: Experimental and numerical study. Int. J. Therm. Sci. 2021, 166, 106972. [Google Scholar] [CrossRef]
- Zhang, K.; Liu, Z.; Wang, Y.; Li, Y.; Li, Q.; Zhang, J.; Liu, H. Flash evaporation and thermal vapor compression aided energy saving CO2 capture systems in coal-fired power plant. Energy 2014, 66, 556–568. [Google Scholar] [CrossRef]
- Reddick, C.; Sorin, M.; Sapoundjiev, H.; Aidoun, Z. Carbon capture simulation using ejectors for waste heat upgrading. Energy 2016, 100, 251–261. [Google Scholar] [CrossRef]
- Sriveerakul, T.; Aphornratana, S.; Chunnanond, K. Performance prediction of steam ejector using computational fluid dynamics: Part 1. Validation of the CFD results. Int. J. Therm. Sci. 2007, 46, 812–822. [Google Scholar] [CrossRef]
- Sriveerakul, T.; Aphornratana, S.; Chunnanond, K. Performance prediction of steam ejector using computational fluid dynamics: Part 2. Flow structure of a steam ejector influenced by operating pressures and geometries. Int. J. Therm. Sci. 2007, 46, 823–833. [Google Scholar] [CrossRef]
- Sun, W.; Ma, X.; Zhang, Y.; Jia, L.; Xue, H. Performance analysis and optimization of a steam ejector through streamlining of the primary nozzle. Case Stud. Therm. Eng. 2021, 27, 101356. [Google Scholar] [CrossRef]
- Sheng, Z.; Zhang, L.; Dan, Y.; Wang, Y. Configuration of the lobed nozzle in an ejector mixer for extreme mixing efficiency. Int. J. Heat Mass Tran. 2022, 183, 122102. [Google Scholar] [CrossRef]
- Li, H.; Wang, X.; Ning, J.; Zhang, P.; Huang, H.; Tu, J. Numerical investigation of the nozzle expansion state and its effect on the performance of the steam ejector based on ideal gas model. Appl. Therm. Eng. 2021, 199, 117509. [Google Scholar] [CrossRef]
- Yan, J.; Li, S.; Liu, Z. Numerical investigation on optimization of ejector primary nozzle geometries with fixed/varied nozzle exit position. Appl. Therm. Eng. 2020, 175, 115426. [Google Scholar] [CrossRef]
- Fu, W.; Liu, Z.; Li, Y.; Wu, H.; Tang, Y. Numerical study for the influences of primary steam nozzle distance and mixing chamber throat diameter on steam ejector performance. Int. J. Therm. Sci. 2018, 132, 509–516. [Google Scholar] [CrossRef]
- Thongtip, T.; Aphornratana, S. Impact of primary nozzle area ratio on the performance of ejector refrigeration system. Appl. Therm. Eng. 2021, 188, 116523. [Google Scholar] [CrossRef]
- Fu, W.; Li, Y.; Liu, Z.; Wu, H.; Wu, T. Numerical study for the influences of primary nozzle on steam ejector performance. Appl. Therm. Eng. 2016, 106, 1148–1156. [Google Scholar] [CrossRef]
- Chen, S.; Chen, G.; Fang, L. An experimental study and 1-D analysis of an ejector with a movable primary nozzle that operates with R236fa. Int. J. Refrig. 2015, 60, 19–25. [Google Scholar] [CrossRef]
- El Zohbi, B.; Bukharin, N.; Assoum, H.H.; Abed-Meraim, K.; Sakout, A.; El Hassan, M. Investigation of the effects of the jet nozzle geometry and location on the performance of supersonic fluid ejectors. Energy Rep. 2022, 8, 228–233. [Google Scholar] [CrossRef]
- Zhu, Y.; Cai, W.; Wen, C.; Li, Y. Numerical investigation of geometry parameters for design of high performance ejectors. Appl. Therm. Eng. 2009, 29, 898–905. [Google Scholar] [CrossRef]
- Dong, J.; Hu, Q.; Yu, M.; Han, Z.; Cui, W.; Liang, D.; Ma, H.; Pan, X. Numerical investigation on the influence of mixing chamber length on steam ejector performance. Appl. Therm. Eng. 2020, 174, 115204. [Google Scholar] [CrossRef]
- Varga, S.; Oliveira, A.C.; Diaconu, B. Influence of geometrical factors on steam ejector performance—A numerical assessment. Int. J. Refrig. 2009, 32, 1694–1701. [Google Scholar] [CrossRef]
- Reis, L.B.; Gioria, R.D.S. Optimization of liquid jet ejector geometry and its impact on flow fields. Appl. Therm. Eng. 2021, 194, 117132. [Google Scholar] [CrossRef]
- Li, R.; Yan, J.; Reddick, C. Optimization of three key ejector geometries under fixed and varied operating conditions: A numerical study. Appl. Therm. Eng. 2022, 211, 118537. [Google Scholar] [CrossRef]
- Reddick, C.; Sorin, M.; Sapoundjiev, H.; Aidoun, Z. Effect of a mixture of carbon dioxide and steam on ejector performance: An experimental parametric investigation. Exp. Therm. Fluid Sci. 2018, 92, 353–365. [Google Scholar] [CrossRef]
- Hemidi, A.; Henry, F.; Leclaire, S.; Seynhaeve, J.; Bartosiewicz, Y. CFD analysis of a supersonic air ejector. Part II: Relation between global operation and local flow features. Appl. Therm. Eng. 2009, 29, 2990–2998. [Google Scholar] [CrossRef]
- Besagni, G.; Cristiani, N.; Croci, L.; Guédon, G.R.; Inzoli, F. Computational fluid-dynamics modelling of supersonic ejectors: Screening of modelling approaches, comprehensive validation and assessment of ejector component efficiencies. Appl. Therm. Eng. 2021, 186, 116431. [Google Scholar] [CrossRef]
- Ji, M.; Utomo, T.; Woo, J.; Lee, Y.; Jeong, H.; Chung, H. CFD investigation on the flow structure inside thermo vapor compressor. Energy 2010, 35, 2694–2702. [Google Scholar] [CrossRef]
- Mohammadi, A. An investigation of geometrical factors of multi-stage steam ejectors for air suction. Energy 2019, 186, 115808. [Google Scholar] [CrossRef]


| Parameters | Value |
|---|---|
| L1 | 65 mm |
| θ1 | 7.72° |
| L2 | 10 mm |
| θ2 | 4.58° |
| XL3 | 20 mm |
| XL5 | 58 mm |
| XL6 | 139 mm |
| D1 | 22.2 mm |
| D2 | 6.4 mm |
| D3 | 6.2 mm |
| D5 | 9.5 mm |
| D6 | 29 mm |
| Primary flow inlet | 350 (kPa) | 427 (K) |
| Secondary flow inlet | 70 (kPa) | 373 (K) |
| Outlet | 130 (kPa) | 388 (K) |
| Percentage of D5 | L1 | ||||
|---|---|---|---|---|---|
| 26 mm | 39 mm | 52 mm | 65 mm | 78 mm | |
| 98% | 0.44141 | 0.44160 | 0.44172 | 0.44170 | 0.44135 |
| 99% | 0.45793 | 0.45806 | 0.45821 | 0.45813 | 0.45775 |
| 100% | 0.47468 | 0.47474 | 0.47495 | 0.47480 | 0.47437 |
| Varied L2 (mm) | Optimal ER with Optimized D5 | Optimal ER with Optimized XL5 |
|---|---|---|
| 0 | 0.4665 | 0.4673 |
| 2 | 0.4828 | 0.4958 |
| 4 | 0.5017 | 0.5027 |
| 6 | 0.4984 | 0.4985 |
| 8 | 0.4971 | 0.5025 |
| 10 | 0.4763 | 0.4889 |
| 12 | 0.4568 | 0.4571 |
| Varied θ2 | Optimal ER with Optimized D5 | Optimal ER with Optimized XL5 |
|---|---|---|
| 0° | 0.4689 | 0.4691 |
| 0.92° | 0.5098 | 0.5169 |
| 1.83° | 0.5094 | 0.5108 |
| 2.74° | 0.5005 | 0.5036 |
| 3.66° | 0.4978 | 0.4978 |
| 4.57° | 0.4764 | 0.4889 |
Disclaimer/Publisher’s Note: The statements, opinions and data contained in all publications are solely those of the individual author(s) and contributor(s) and not of MDPI and/or the editor(s). MDPI and/or the editor(s) disclaim responsibility for any injury to people or property resulting from any ideas, methods, instructions or products referred to in the content. |
© 2022 by the authors. Licensee MDPI, Basel, Switzerland. This article is an open access article distributed under the terms and conditions of the Creative Commons Attribution (CC BY) license (https://creativecommons.org/licenses/by/4.0/).
Share and Cite
Yan, J.; Li, R.; Wang, C. Optimization of Three Key Geometries of a Steam Ejector under Varied Primary Nozzle Geometries. Entropy 2023, 25, 15. https://doi.org/10.3390/e25010015
Yan J, Li R, Wang C. Optimization of Three Key Geometries of a Steam Ejector under Varied Primary Nozzle Geometries. Entropy. 2023; 25(1):15. https://doi.org/10.3390/e25010015
Chicago/Turabian StyleYan, Jia, Ruixin Li, and Chen Wang. 2023. "Optimization of Three Key Geometries of a Steam Ejector under Varied Primary Nozzle Geometries" Entropy 25, no. 1: 15. https://doi.org/10.3390/e25010015
APA StyleYan, J., Li, R., & Wang, C. (2023). Optimization of Three Key Geometries of a Steam Ejector under Varied Primary Nozzle Geometries. Entropy, 25(1), 15. https://doi.org/10.3390/e25010015