
Determinants of the European Sovereign Debt Crisis: Application of Logit, Panel Markov Regime Switching Model and Self Organizing Maps


Abstract
:1. Introduction
2. Data and Methodology
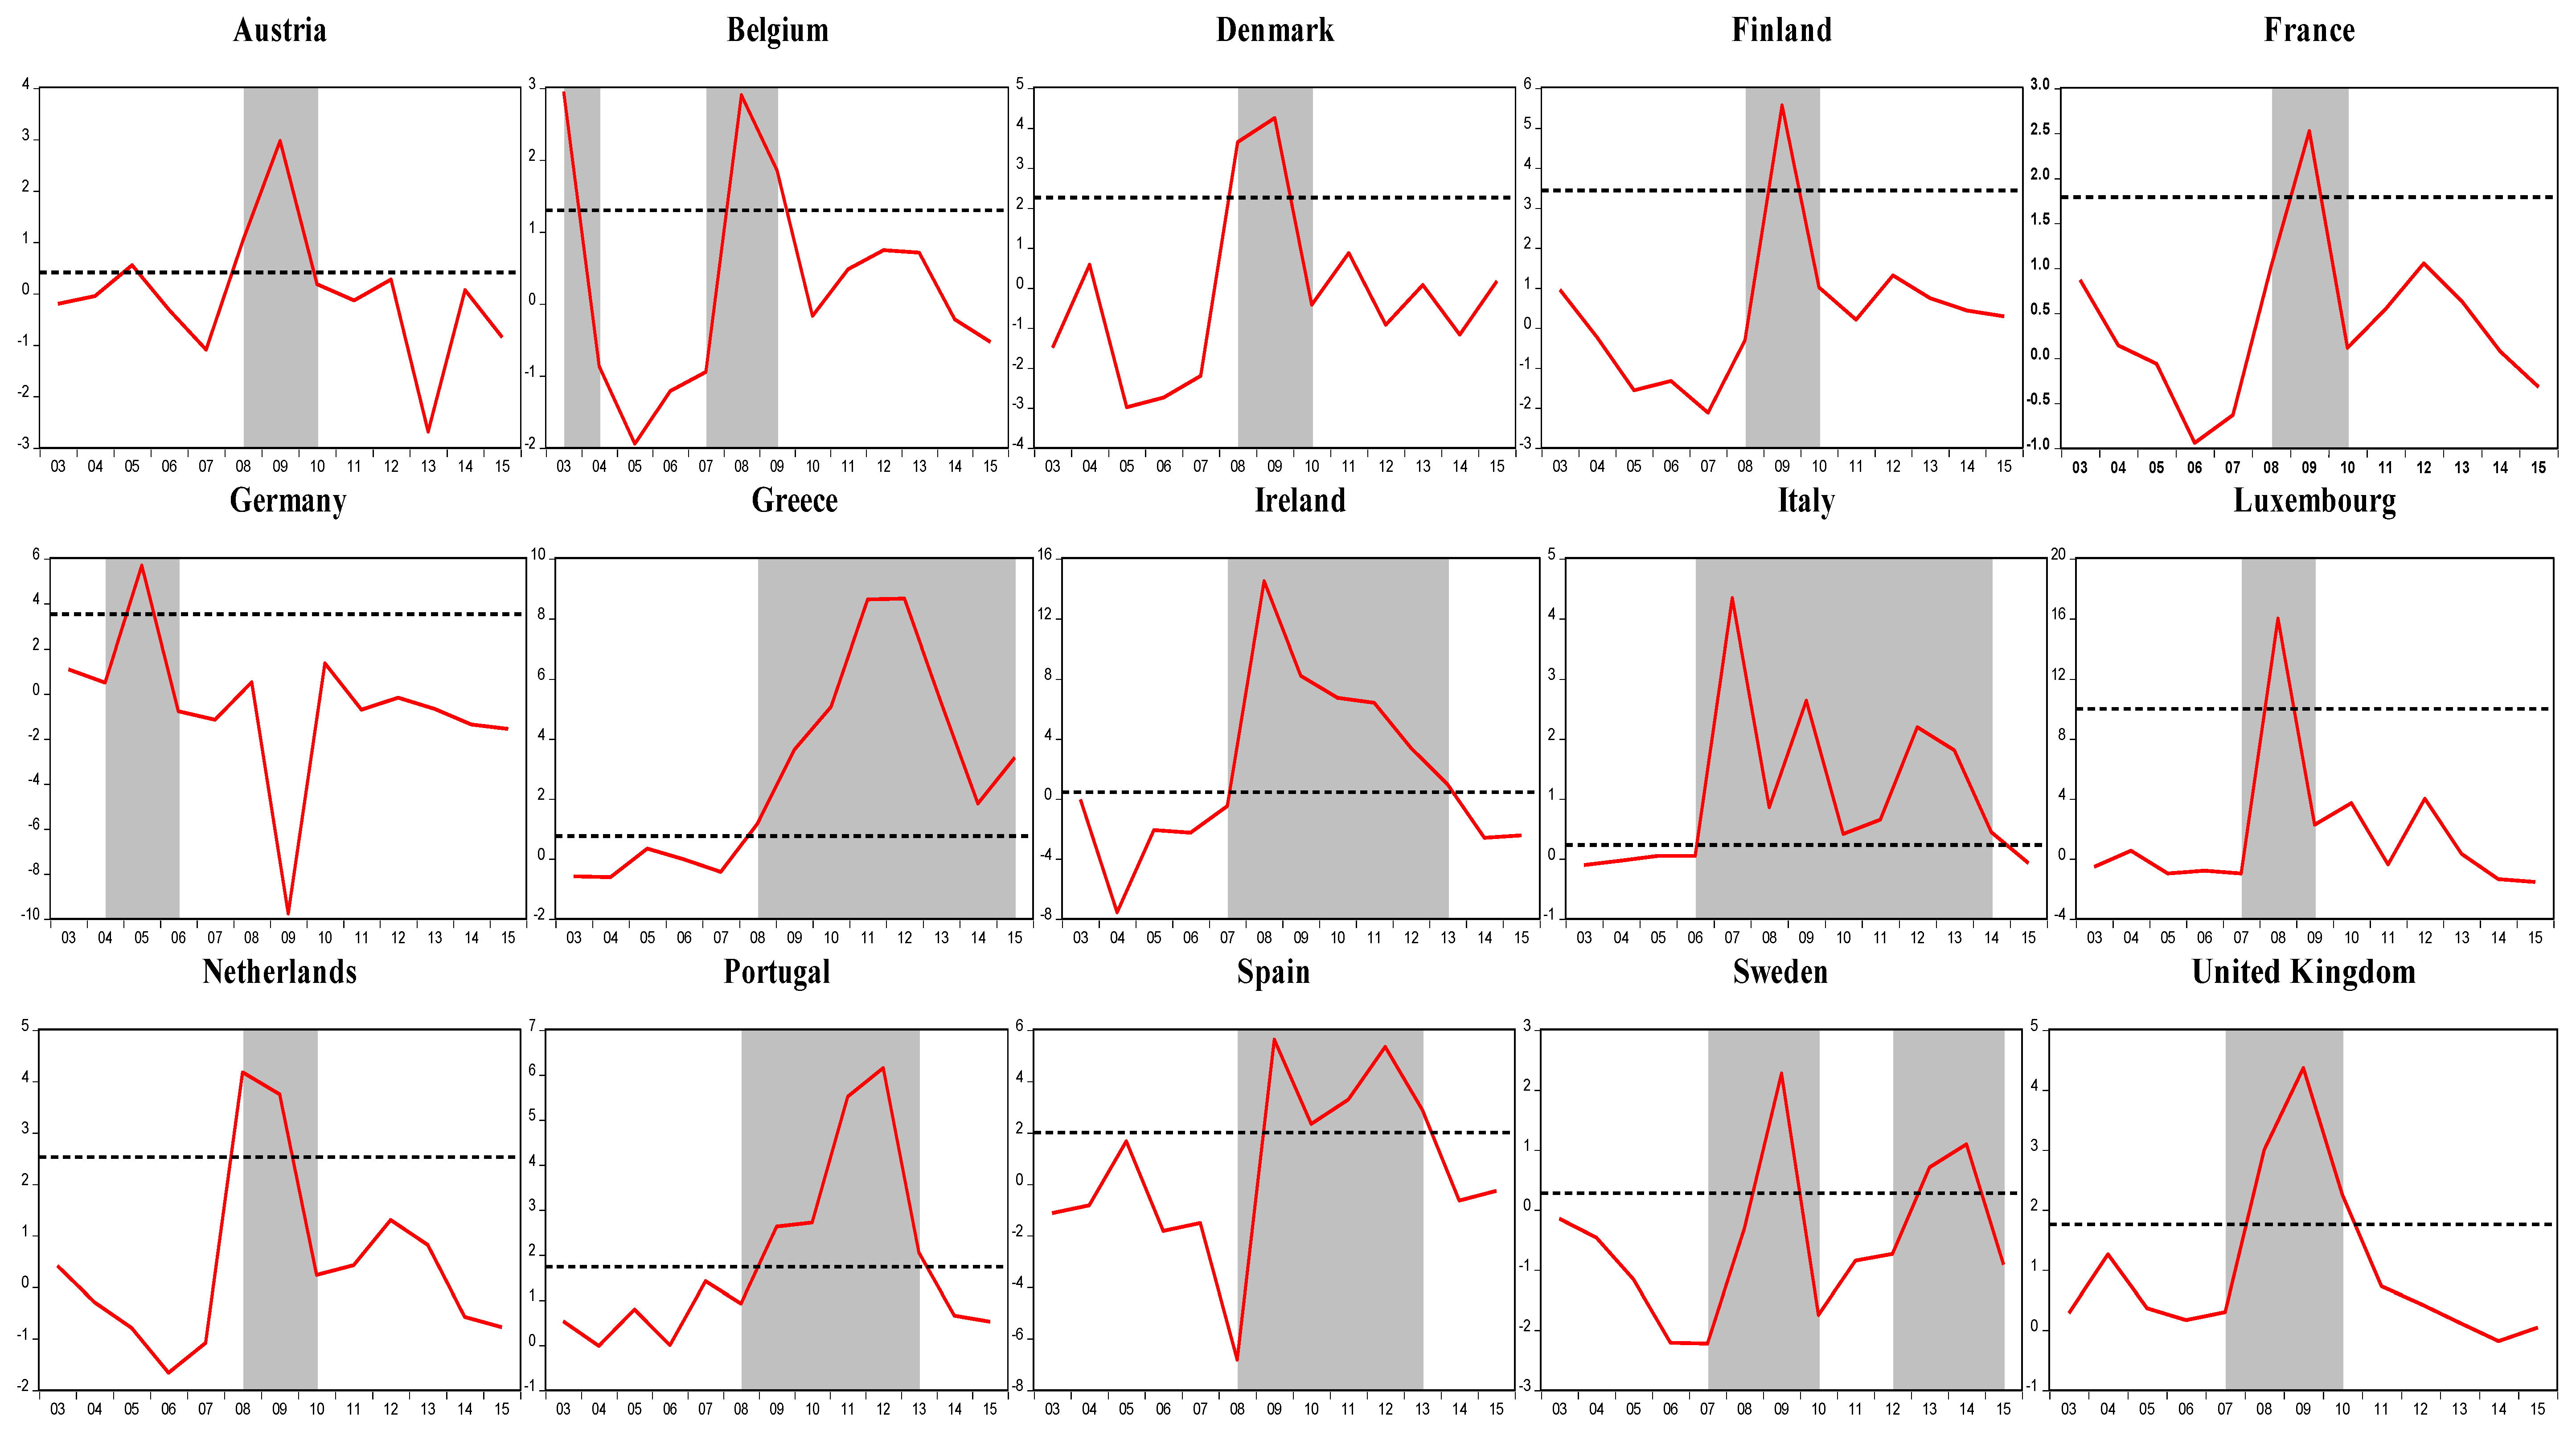
2.1. The Definition of Fiscal Stress Index
2.2. Leading Indicators
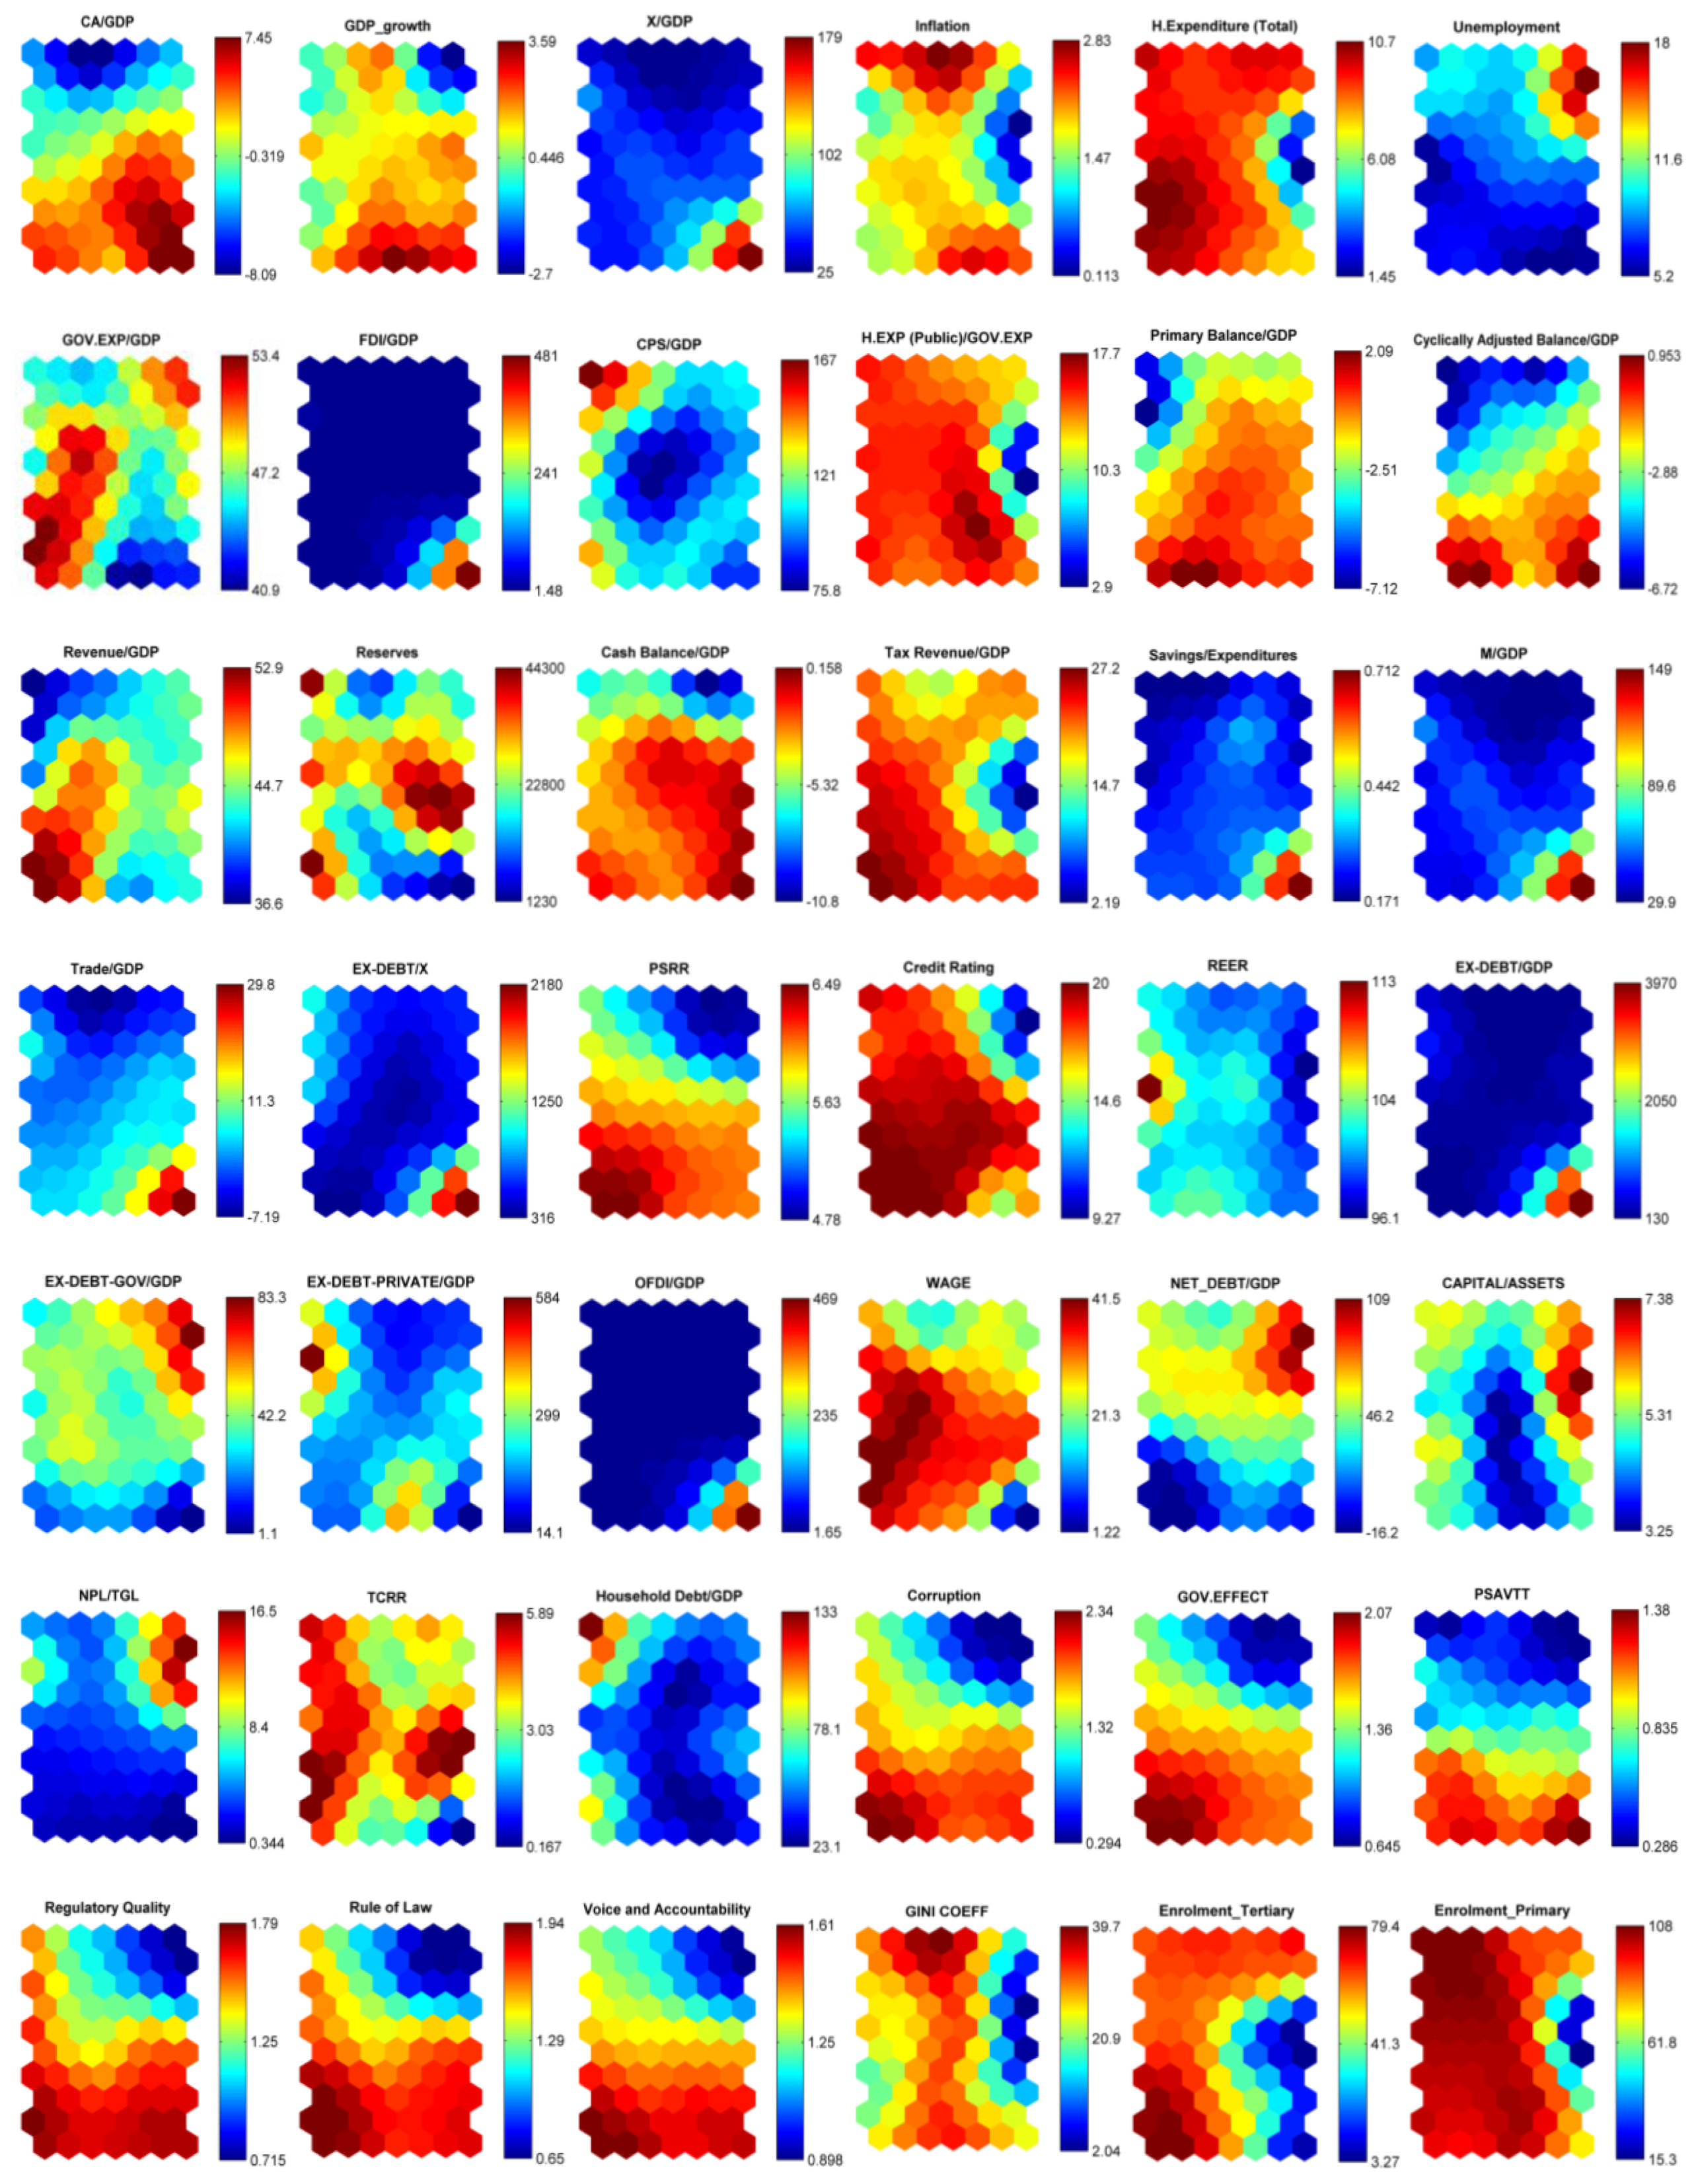
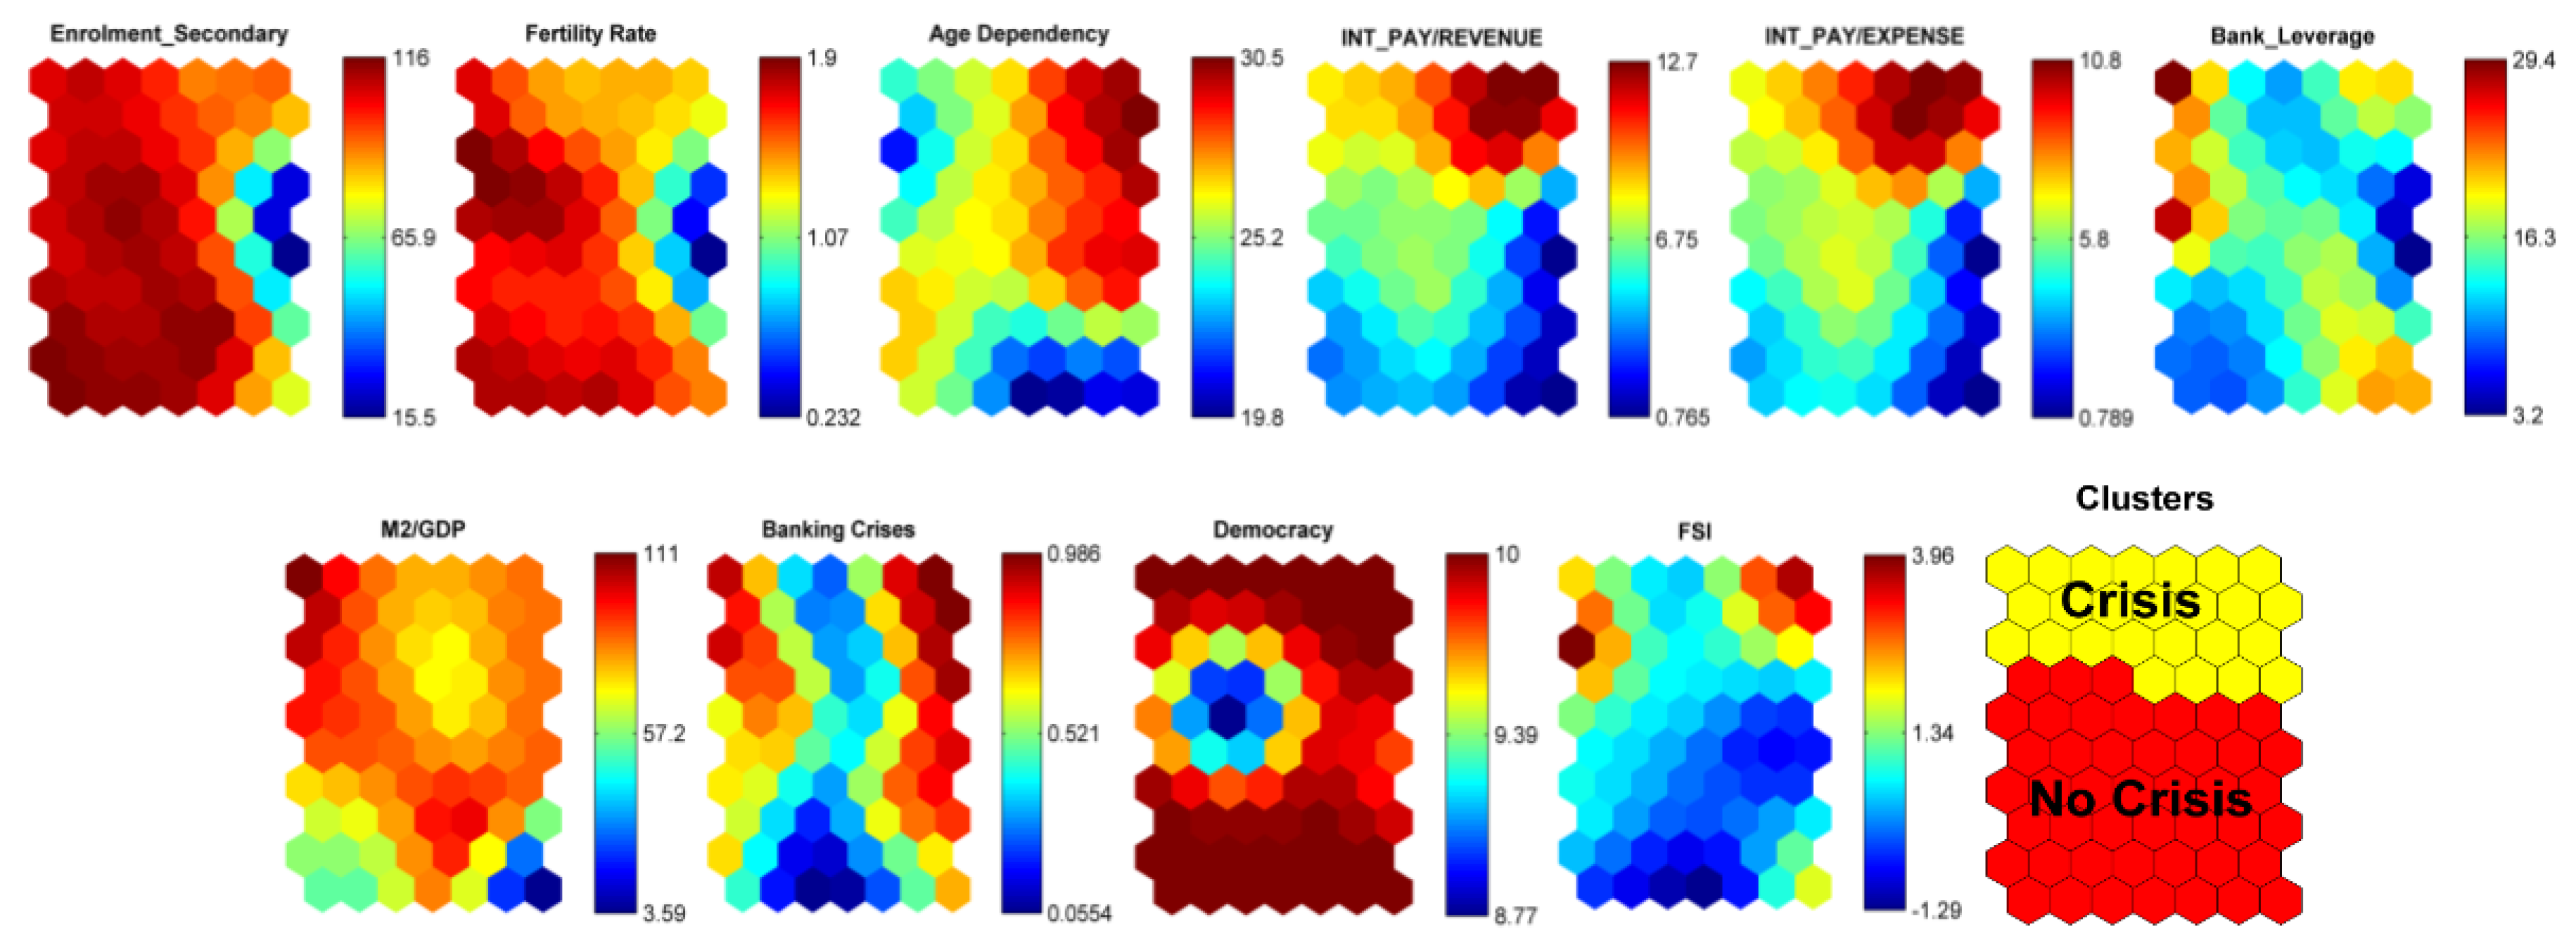
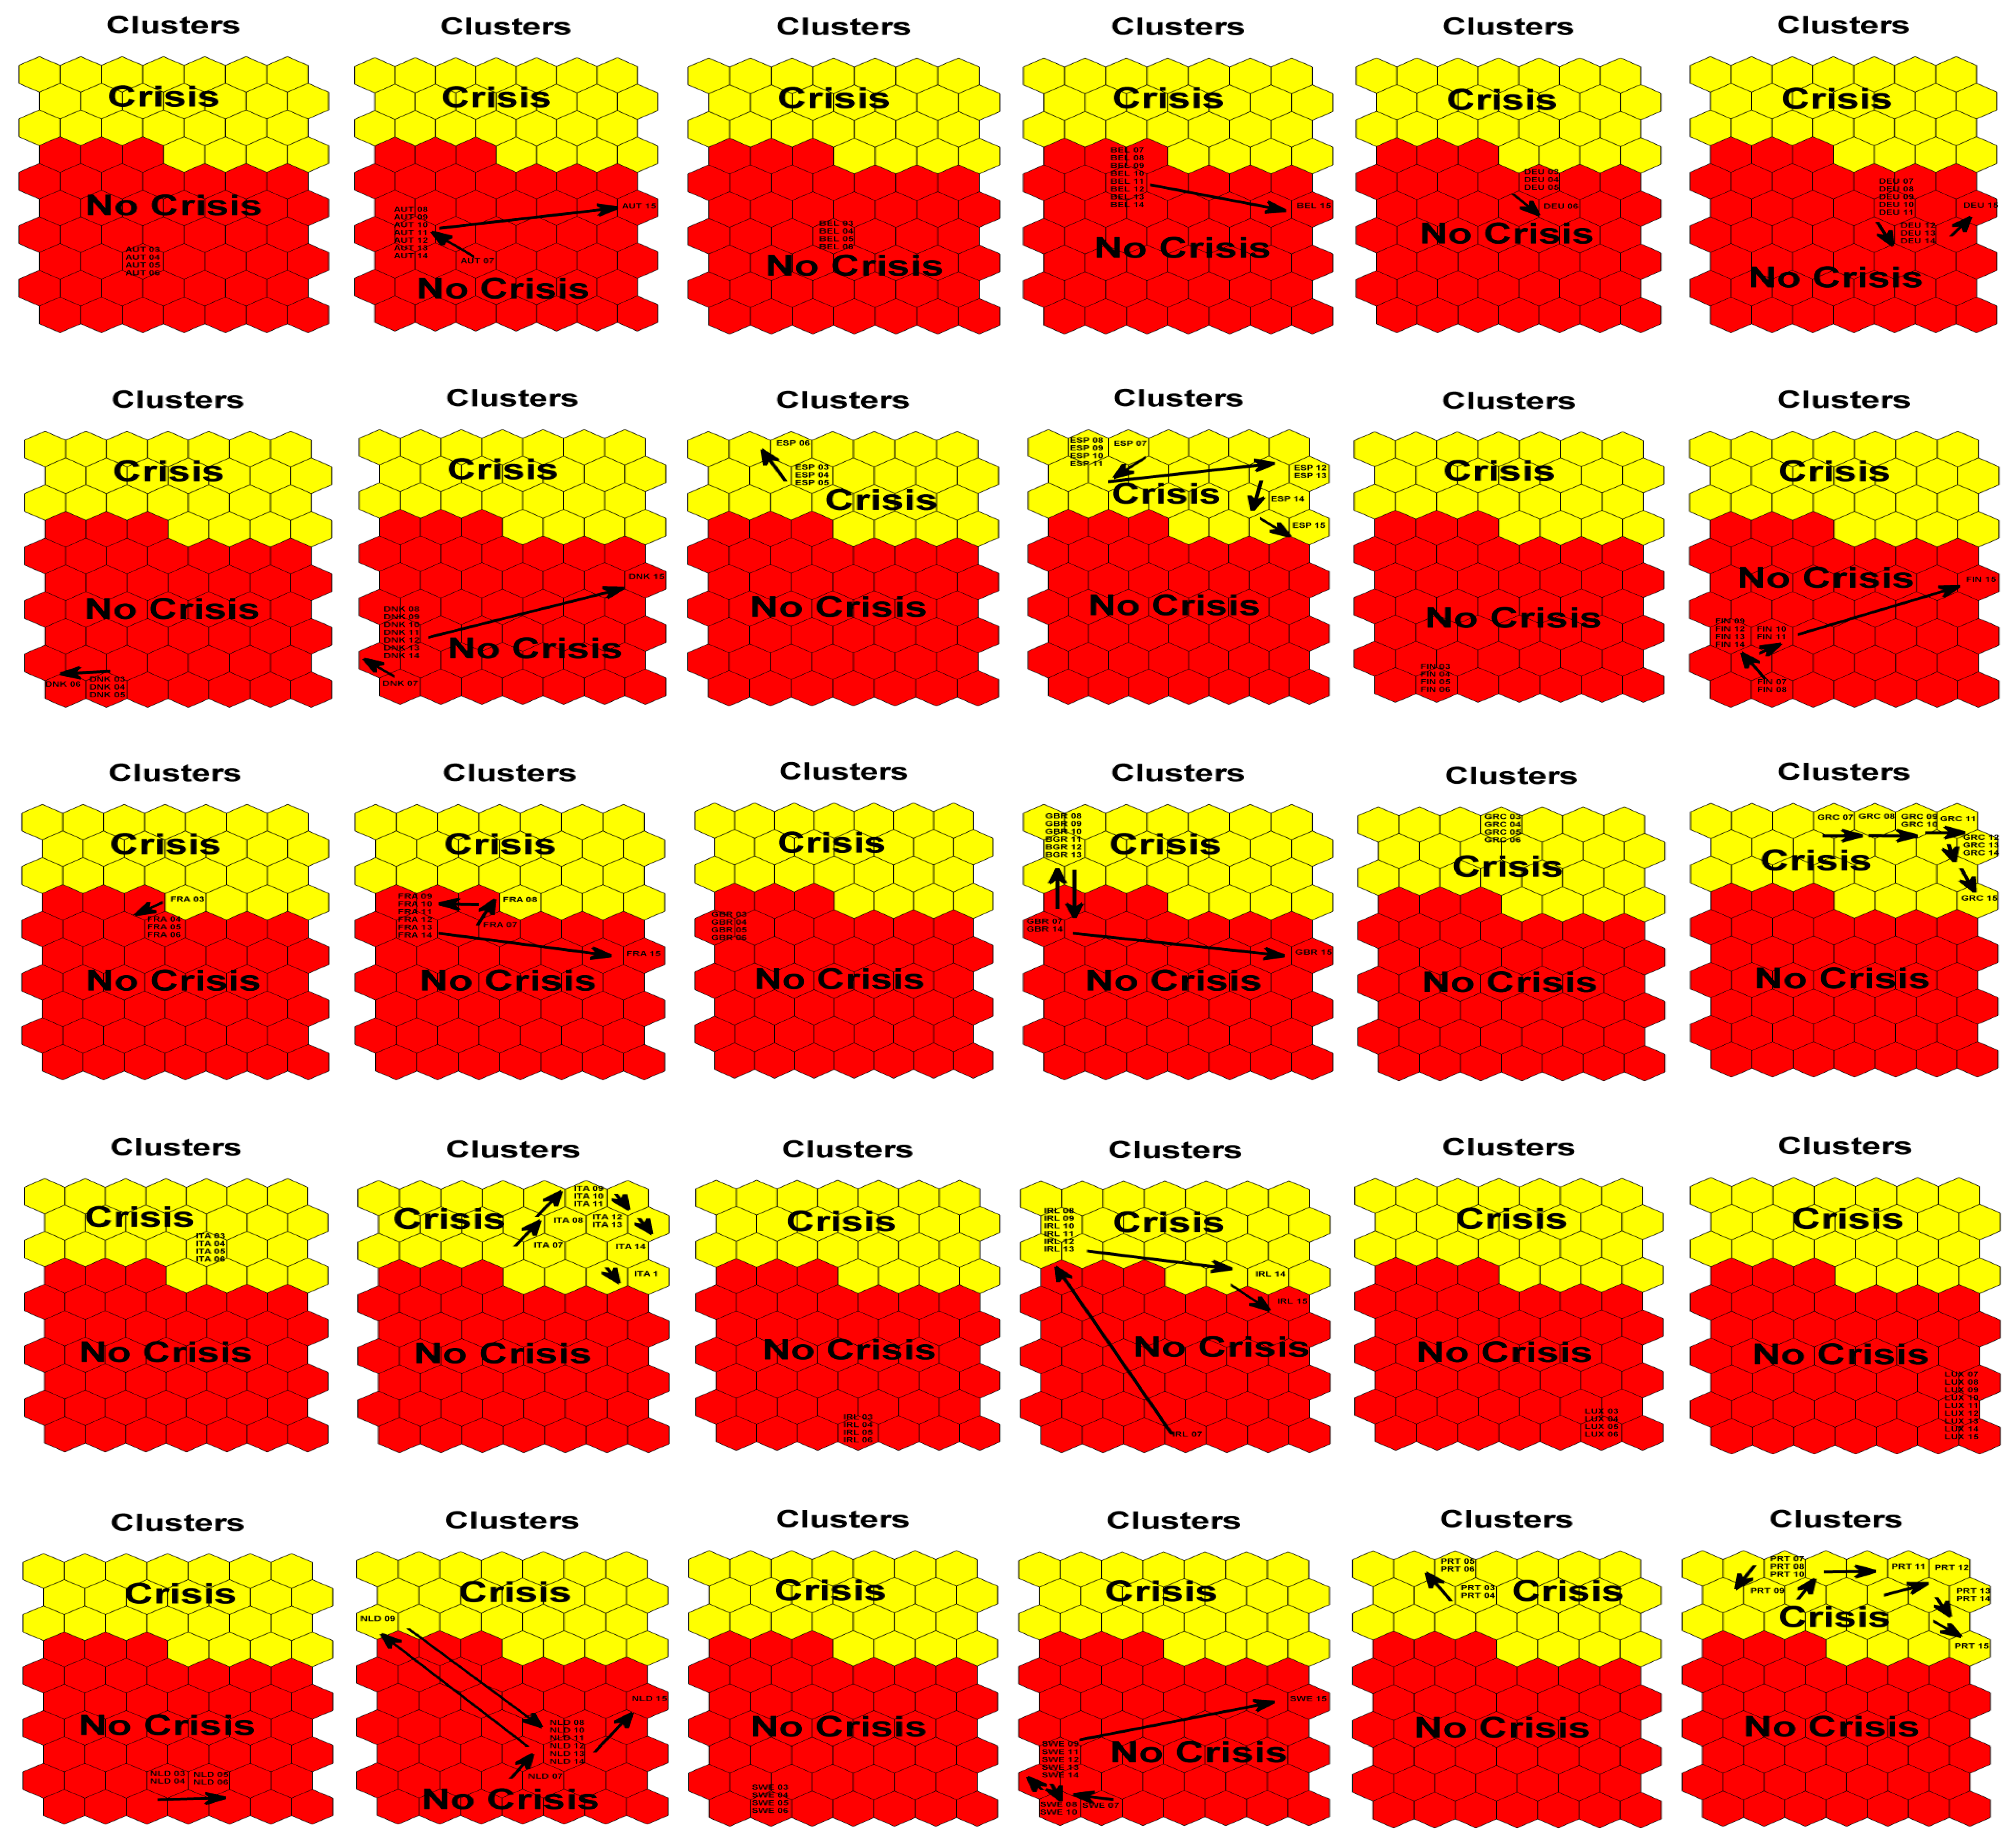
2.3. Methodology
3. Estimation Results
4. Conclusions
Author Contributions
Funding
Institutional Review Board Statement
Data Availability Statement
Conflicts of Interest
References
- Candelon, B.; Palm, F.C. Banking and debt crises in Europe: The dangerous Liaisons? Economist 2010, 158, 81–99. [Google Scholar] [CrossRef] [Green Version]
- Arghyrou, M.G.; Kontonikas, A. The EMU sovereign-debt crisis: Fundamentals, expectations and contagion. J. Int. Financ. Mark. Inst. Money 2012, 22, 658–677. [Google Scholar] [CrossRef] [Green Version]
- De Santis, R.A. The Euro Area Sovereign Debt Crisis: Safe Haven, Credit Rating Agencies and the Spread of the Fever; Working Paper Series 1419; ECB: Frankfurt am Main, Germany, 2012. [Google Scholar]
- Wolf, M. Why the Eurozone Crisis Is Not Over; Peterson Institute for International Economics: Washington, DC, USA, 2012. [Google Scholar]
- De Bruyckere, V.; Gerhardt, M.; Schepens, G.; Vander Vennet, R. Bank/sovereign risk spillovers in the European debt crisis. J. Bank. Financ. 2013, 37, 4793–4809. [Google Scholar] [CrossRef] [Green Version]
- Broto, C.; Perez-Quiros, G. Disentangling contagion among sovereign CDS spreads during the European debt crisis. J. Empir. Financ. 2015, 32, 165–179. [Google Scholar] [CrossRef] [Green Version]
- Calabrese, R.; Elkink, J.A.; Giudici, P.S. Measuring bank contagion in Europe using binary spatial regression models. J. Oper. Res. Soc. 2017, 68, 1503–1511. [Google Scholar] [CrossRef] [Green Version]
- Higgins, M.; Klitgaard, T. Saving imbalances and the euro area sovereign debt crisis. Curr. Issues Econ. Financ. 2011, 17, 52011. [Google Scholar] [CrossRef] [Green Version]
- Uxó, J.; Paúl, J.; Febrero, E. Current account imbalances in the Monetary Union and the Great Recession: Causes and policies. Panoeconomicus 2011, 58, 571–592. [Google Scholar] [CrossRef]
- Knedlik, T.; Von Schweinitz, G. Macroeconomic imbalances as indicators for debt crises in Europe. J. Common Mark. Stud. 2012, 50, 726–745. [Google Scholar] [CrossRef] [Green Version]
- Gros, D. Macroeconomic Imbalances in the Euro Area: Symptom or Cause of the Crisis? CEPS Policy Brief 266; Centre for European Policy Studies: Brussels, Belgium, 2012. [Google Scholar]
- Alessandrini, P.; Fratianni, M.; Hallett, A.H.; Presbitero, A.F. External imbalances and fiscal fragility in the euro area. Open Econ. Rev. 2014, 25, 3–34. [Google Scholar] [CrossRef]
- Brancaccio, E. Current Account Imbalances, the Eurozone Crisis, and a Proposal for a “European Wage Standard”. Int. J. Political Econ. 2012, 41, 47–65. [Google Scholar] [CrossRef] [Green Version]
- Hallett, A.H.; Oliva, J.C.M. The importance of trade and capital imbalances in the European debt crisis. J. Policy Model. 2015, 37, 229–252. [Google Scholar] [CrossRef] [Green Version]
- Mundell, R.A. A theory of optimum currency areas. Am. Econ. Rev. 1961, 51, 657–665. [Google Scholar]
- Ari, A. Introduction. In The European Debt Crisis: Causes, Consequences, Measures and Remedies; Ari, A., Ed.; Cambridge Scholars Publishing: Newcastle upon Tyne, UK, 2014; pp. 1–11. [Google Scholar]
- Berg, A.; Pattillo, C. Predicting currency crises:: The indicators approach and an alternative. J. Int. Money Financ. 1999, 18, 561–586. [Google Scholar] [CrossRef]
- Beckmann, D.; Menkhoff, L.; Sawischlewski, K. Robust lessons about practical early warning systems. J. Policy Model. 2006, 28, 163–193. [Google Scholar] [CrossRef] [Green Version]
- Comelli, F. Comparing parametric and non-parametric early warning systems for currency crises in emerging market economies. Rev. Int. Econ. 2014, 22, 700–721. [Google Scholar] [CrossRef]
- Ari, A.; Cergibozan, R. Currency crises in Turkey: An empirical assessment. Res. Int. Bus. Financ. 2018, 46, 281–293. [Google Scholar] [CrossRef]
- Baldacci, E.; Gabriela, D.; Iva, P.; Samah, M.; Nazim, B. Assessing Fiscal Stress. IMF Working Paper WP/11/100. 2011. Available online: https://www.elibrary.imf.org/doc/IMF001/11797-9781455254316/11797-9781455254316/Other_formats/Source_PDF/11797-9781455253289.pdf (accessed on 1 January 2023).
- Berti, K.; Salto, M.; Lequien, M. An Early-Detection Index of Fiscal Stress for EU Countries (No. 475); Directorate General Economic and Financial Affairs (DG ECFIN), European Commission: Brussels, Belgium, 2012. [Google Scholar]
- Hernández de Cos, P.; Koester, G.B.; Moral-Benito, E.; Nickel, C. Signalling Fiscal Stress in the Euro Area-A Country-Specific Early Warning System; ECB Working Paper, No. 1712; European Central Bank (ECB): Frankfurt, Germany, 2014; ISBN 978-92-899-1120-7. [Google Scholar]
- Sumner, S.P.; Berti, K. A Complementary Tool to Monitor Fiscal Stress in European Economies (No. 049); Directorate General Economic and Financial Affairs (DG ECFIN), European Commission: Brussels, Belgium, 2017. [Google Scholar]
- Detragiache, E.; Spilimbergo, A. Crises and liquidity: Evidence and interpretation. IMF Working Paper WP/1/2. 2001. Available online: https://www.imf.org/en/Publications/WP/Issues/2016/12/30/Crises-and-Liquidity-Evidence-and-Interpretation-3963 (accessed on 1 January 2023).
- McHugh, M.J.; Petrova, I.; Baldacci, M.E. Measuring Fiscal Vulnerability and Fiscal Stress: A Proposed Set of Indicators. IMF Working Paper WP/11/94. 2011. Available online: https://www.imf.org/en/Publications/WP/Issues/2016/12/31/Measuring-Fiscal-Vulnerability-and-Fiscal-Stress-A-Proposed-Set-of-Indicators-24815 (accessed on 1 January 2023).
- Eichengreen, B.; Rose, A.K.; Wyplosz, C. Contagious Currency Crises: First Tests. Scand. J. Econ. 1996, 98, 463–484. [Google Scholar] [CrossRef]
- Kaminsky, G.L.; Reinhart, C.M. The twin crises: The causes of banking and balance-of-payments problems. Am. Econ. Rev. 1999, 89, 473–500. [Google Scholar] [CrossRef] [Green Version]
- Kamin, S.B.; Schindler, J.W.; Samuel, S.L. The Contribution of Domestic and External Factors to Emerging Market Devaluation Crises: An Early Warning Systems Approach; FRB International Finance Discussion Paper, 711; Board of Governors of the Federal Reserve System: Washington, DC, USA, 2001.
- Edison, H.J. Do indicators of financial crises work? An evaluation of an early warning system. Int. J. Financ. Econ. 2003, 8, 11–53. [Google Scholar] [CrossRef] [Green Version]
- Lestano, L.; Jacobs, J.P. Dating currency crises with ad hoc and extreme value-based thresholds: East Asia 1970–2002. Int. J. Financ. Econ. 2007, 12, 371–388. [Google Scholar] [CrossRef]
- Candelon, B.; Dumitrescu, E.I.; Hurlin, C. How to evaluate an early-warning system: Toward a unified statistical framework for assessing financial crises forecasting methods. IMF Econ. Rev. 2012, 60, 75–113. [Google Scholar] [CrossRef]
- Kaminsky, G.; Lizondo, S.; Reinhart, C.M. Leading indicators of currency crises. IMF Staff Pap. 1998, 45, 1–48. [Google Scholar] [CrossRef] [Green Version]
- Manasse, P.; Roubini, N.; Schimmelpfennig, A. Predicting Sovereign Debt Crises. IMF Working Paper WP/03/221. 2003. Available online: https://www.imf.org/en/Publications/WP/Issues/2016/12/30/Predicting-Sovereign-Debt-Crises-16951 (accessed on 1 January 2023).
- Laeven, L.; Valencia, F. Systemic banking crises database. IMF Econ. Rev. 2013, 61, 225–270. [Google Scholar] [CrossRef] [Green Version]
- Laeven, L.; Valencia, F. Systemic Banking Crises Revisited; IMF Working Paper WP/18/206; International Monetary Fund: Washington, DC, USA, 2018. [Google Scholar]
- Guscina, A. Impact of Macroeconomic, Political, and Institutional Factors on the Structure of Government Debt in Emerging Market Countries. IMF Working Paper WP/08/xx. 2008. Available online: https://www.imf.org/en/Publications/WP/Issues/2016/12/31/Impact-of-Macroeconomic-Political-and-Institutional-Factors-on-the-Structure-of-Government-22307 (accessed on 1 January 2023).
- Kaufmann, D.; Kraay, A.; Mastruzzi, M. The worldwide governance indicators: Methodology and analytical issues. Hague J. Rule Law 2011, 3, 220–246. [Google Scholar] [CrossRef]
- Kohonen, T. Self-organized formation of topologically correct feature maps. Biol. Cybern. 1982, 43, 59–69. [Google Scholar] [CrossRef]
- Serrano-Cinca, C. Self organizing neural networks for financial diagnosis. Decis. Support Syst. 1996, 17, 227–238. [Google Scholar] [CrossRef]
- Kiviluoto, K. Predicting bankruptcies with the self-organizing map. Neurocomputing 1998, 21, 191–201. [Google Scholar] [CrossRef]
- Lee, K.; Booth, D.; Alam, P. A comparison of supervised and unsupervised neural networks in predicting bankruptcy of Korean firms. Expert Syst. Appl. 2005, 29, 1–16. [Google Scholar] [CrossRef]
- Shanmuganathan, S.; Sallis, P.; Buckeridge, J. Self-organising map methods in integrated modelling of environmental and economic systems. Environ. Model. Softw. 2006, 21, 1247–1256. [Google Scholar] [CrossRef]
- Giovanis, E. Application of logit model and self-organizing maps (SOMs) for the prediction of financial crisis periods in US economy. J. Financ. Econ. Policy 2010, 2, 98–125. [Google Scholar] [CrossRef]
- Sarlin, P. Exploiting the self-organizing financial stability map. Eng. Appl. Artif. Intell. 2013, 26, 1532–1539. [Google Scholar] [CrossRef]
- Sarlin, P.; Peltonen, T.A. Mapping the state of financial stability. J. Int. Financ. Mark. Inst. Money 2013, 26, 46–76. [Google Scholar] [CrossRef] [Green Version]
- Louis, P.; Seret, A.; Baesens, B. Financial efficiency and social impact of microfinance institutions using self-organizing maps. World Dev. 2013, 46, 197–210. [Google Scholar] [CrossRef]
- Claveria, O.; Monte, E.; Torra, S. A self-organizing map analysis of survey-based agents’ expectations before impending shocks for model selection: The case of the 2008 financial crisis. Int. Econ. 2016, 146, 40–58. [Google Scholar] [CrossRef] [Green Version]
- Deichmann, J.I.; Eshghi, A.; Haughton, D.; Li, M. Socioeconomic Convergence in Europe One Decade After the EU Enlargement of 2004: Application of Self-Organizing Maps. East. Eur. Econ. 2017, 55, 236–260. [Google Scholar] [CrossRef]
- Sarlin, P. Sovereign debt monitor: A visual self-organizing maps approach. In Proceedings of the 2011 IEEE Symposium on Computational Intelligence for Financial Engineering and Economics (CIFEr), Paris, France, 11–15 April 2011; pp. 1–8. [Google Scholar]
- Sarlin, P. Clustering the changing nature of currency crises in emerging markets: An exploration with self-organising maps. Int. J. Comput. Econ. Econom. 2011, 2, 24–46. [Google Scholar] [CrossRef]
- Sarlin, P.; Marghescu, D. Visual predictions of currency crises using self-organizing maps. Intell. Syst. Account. Financ. Manag. 2011, 18, 15–38. [Google Scholar] [CrossRef]
- Ki, S.J.; Lee, S.W.; Kim, J.H. Developing alternative regression models for describing water quality using a self-organizing map. Desalin. Water Treat. 2016, 57, 20146–20158. [Google Scholar] [CrossRef]
- Park, Y.S.; Gevrey, M.; Lek, S.; Giraudel, J.L. Evaluation of relevant species in communities: Development of structuring indices for the classification of communities using a self-organizing map. In Modelling Community Structure in Freshwater Ecosystems; Lek, S., Scardi, M., Verdonschot, P., Descy, J.P., Park, Y.-S., Eds.; Springer: Berlin/Heidelberg, Germany, 2005; pp. 369–380. [Google Scholar]
- Tison, J.; Giraudel, J.L.; Coste, M.; Park, Y.S.; Delmas, F. Use of unsupervised neural networks for ecoregional zoning of hydrosystems through diatom communities: Case study of Adour-Garonne watershed (France). Arch. Hydrobiol. 2004, 159, 409–422. [Google Scholar] [CrossRef]
- Tison, J.; Park, Y.S.; Coste, M.; Wasson, J.G.; Ector, L.; Rimet, F.; Delmas, F. Typology of diatom communities and the influence of hydro-ecoregions: A study on the French hydrosystem scale. Water Res. 2005, 39, 3177–3188. [Google Scholar] [CrossRef]
- Vesanto, J. Data Exploration Process Based on the Self Organizing Map; Acta Polytechnica Scandinavica, Mathematics and Computing Series No. 115; Finnish Academies of Technology: Espoo, Finland, 2002. [Google Scholar]
- Hemming, R.; Kell, M.; Schimmelpfennig, A. Fiscal Vulnerability and Financial Crises in Emerging Market Economies (Vol. 218); International Monetary Fund: Washington, DC, USA, 2003. [Google Scholar]
- Cerovic, M.S.; Gerling, M.K.; Hodge, A.; Medas, P. Predicting Fiscal Crises. IMF Working Paper WP/11/94. 2018. Available online: https://www.imf.org/en/Publications/WP/Issues/2018/08/03/Predicting-Fiscal-Crises-46098 (accessed on 1 January 2023).
- Martinez-Peria, S.M. A regime-switching approach to the study of speculative attacks: A focus on EMS crises. In Advances in Markov-Switching Models; Physica-Verlag HD: Heidelberg, Germany, 2002; pp. 159–194. [Google Scholar]
- Arias, G.; Erlandsson, U.G. Regime Switching as an Alternative Early Warning System of Currency Crises. An Application to South-East Asia; Working Paper; Lund University: Lund, Sweden, 2004. [Google Scholar]
- Alvarez-Plata, P.; Schrooten, M. The Argentinean currency crisis: A Markov-Switching model estimation. Dev. Econ. 2006, 44, 79–91. [Google Scholar] [CrossRef] [Green Version]
- Brunetti, C.; Scotti, C.; Mariano, R.S.; Tan, A.H. Markov switching GARCH models of currency turmoil in Southeast Asia. Emerg. Mark. Rev. 2008, 9, 104–128. [Google Scholar] [CrossRef] [Green Version]
- Abiad, A. Early Warning Systems for Currency Crises: A Regime-Switching Approach. In Hidden Markov Models in Finance. International Series in Operations Research & Management Science; Mamon, R.S., Elliott, R.J., Eds.; Springer: Boston, MA, USA, 2007; Volume 104. [Google Scholar]
- Lopes, J.M.; Nunes, L.C. A Markov regime switching model of crises and contagion: The case of the Iberian countries in the EMS. J. Macroecon. 2012, 34, 1141–1153. [Google Scholar] [CrossRef]
- Pellicer-Chenoll, M.; Garcia-Massó, X.; Morales, J.; Serra-Añó, P.; Solana-Tramunt, M.; González, L.M.; Toca-Herrera, J.L. Physical activity, physical fitness and academic achievement in adolescents: A self-organizing maps approach. Health Educ. Res. 2015, 30, 436–448. [Google Scholar] [CrossRef] [PubMed] [Green Version]
- Chea, R.; Grenouillet, G.; Lek, S. Evidence of water quality degradation in lower Mekong basin revealed by self-organizing map. PLoS ONE 2016, 11, e0145527. [Google Scholar] [CrossRef] [Green Version]
- Gerling, M.K.; Medas, M.P.A.; Poghosyan, M.T.; Farah-Yacoub, J.; Xu, Y. Fiscal Crises. IMF Working Paper WP/17/86. 2017. Available online: https://www.imf.org/en/Publications/WP/Issues/2017/04/03/Fiscal-Crises-44795 (accessed on 1 January 2023).
- Bruns, M.; Poghosyan, T. Leading indicators of fiscal distress: Evidence from extreme bounds analysis. Appl. Econ. 2018, 50, 1454–1478. [Google Scholar] [CrossRef] [Green Version]


| Accuracy Measures | Sensitivity-Specificity Graphic | KLR | ||||||
|---|---|---|---|---|---|---|---|---|
| Country | Cut-Off | Sensitivity | Specificity | Cut-Off | Sensitivity | Specificity | Cut-Off (S) | Cut-Off (G) |
| Austria | 0.410 | 100.0 | 90.90 | 0.410 | 100.0 | 90.90 | 2.535 | 6.381 |
| Belgium | 2.376 | 50.0 | 90.90 | 1.298 | 100.0 | 90.90 | 3.343 | 6.381 |
| Denmark | 0.371 | 100.0 | 81.80 | 2.254 | 100.0 | 100.0 | 4.211 | 6.381 |
| Finland | 1.157 | 100.0 | 91.70 | 3.433 | 100.0 | 100.0 | 4.137 | 6.381 |
| France | 1.035 | 100.0 | 91.70 | 1.788 | 100.0 | 100.0 | 2.161 | 6.381 |
| Germany | 1.218 | 100.0 | 91.70 | 3.516 | 100.0 | 100.0 | 6.157 | 6.381 |
| Greece | 0.154 | 100.0 | 80.0 | 0.752 | 100.0 | 100.0 | 9.407 | 6.381 |
| Ireland | −0.277 | 100.0 | 85.70 | 0.435 | 100.0 | 100.0 | 13.521 | 6.381 |
| Italy | 0.229 | 100.0 | 83.30 | 0.426 | 85.70 | 83.30 | 3.721 | 6.381 |
| Luxembourg | 3.855 | 100.0 | 91.70 | 9.994 | 100.0 | 100.0 | 10.985 | 6.381 |
| Netherlands | 1.058 | 100.0 | 90.90 | 2.523 | 100.0 | 100.0 | 3.972 | 6.381 |
| Portugal | 1.164 | 100.0 | 87.50 | 1.729 | 100.0 | 100.0 | 5.809 | 6.381 |
| Spain | 0.695 | 100.0 | 87.50 | 1.998 | 100.0 | 100.0 | 7.378 | 6.381 |
| Sweden | −0.231 | 100.0 | 90.0 | 0.275 | 100.0 | 100.0 | 2.071 | 6.381 |
| United Kingdom | 0.991 | 100.0 | 90.0 | 1.753 | 100.0 | 100.0 | 3.748 | 6.381 |
| Country | Our Results: Crisis Dates | Hernandez de Cos et al. [23]: Crisis Dates | Baldacci et al. [21]: Start of Crisis | Berti et al. [22] |
|---|---|---|---|---|
| Austria | 2009 | No crisis | No crisis | No crisis |
| Belgium | 2003, 2008–2009 | No crisis | No crisis | No crisis |
| Denmark | 2008–2009 | n.a. | No crisis | No crisis |
| Finland | 2009 | No crisis | No crisis | No crisis |
| France | 2009 | No crisis | No crisis | No crisis |
| Germany | 2005 | No crisis | No crisis | No crisis |
| Greece | 2008–2015 | 2008–2010 | 2008 | n.a. |
| Ireland | 2008–2013 | 2008–2010 | 2008 | n.a. |
| Italy | 2007–2014 | 2008–2010 | 2008 | No crisis |
| Luxembourg | 2008 | n.a. | n.a. | No crisis |
| Netherlands | 2008–2009 | No crisis | No crisis | No crisis |
| Portugal | 2009–2013 | 2008, 2010 | 2008, 2010 | 2009–2010 |
| Spain | 2009–2013 | n.a. | 2010 | 2009, 2012 |
| Sweden | 2009, 2013–2014 | n.a. | No crisis | No crisis |
| United Kingdom | 2008–2010 | n.a. | No crisis | 2009 |
| INDICATOR | ABBREVIATION | OBS | MIS.VAL. | MEAN | STD.DEV. | MIN | MAX |
|---|---|---|---|---|---|---|---|
| Current account of balance of payments (% of GDP) | CA/GDP 1 | 195 | 0(0%) | 0.94 | 5.48 | −14.43 | 11.93 |
| GDP, real, annual growth | GDP growth 1 | 195 | 0(0%) | 1.17 | 2.82 | −9.17 | 8.40 |
| Exports, goods & services (% of GDP) | X/GDP 1 | 195 | 0(0%) | 54.52 | 39.96 | 18.54 | 213.85 |
| Inflation, consumer prices index (annual %) | Inflation 1 | 195 | 0(0%) | 1.79 | 1.36 | −4.46 | 4.93 |
| Health expenditure, total (% of GDP) | H. Expenditure (Total)/GDP 1 | 180 | 15(7.69%) | 9.52 | 1.20 | 6.80 | 11.97 |
| Unemployment rate (%) | Unemployment 1 | 195 | 0(0%) | 8.46 | 4.65 | 2.33 | 27.51 |
| Government expenditure as % of GDP | GOV.EXP/GDP 1 | 195 | 0(0%) | 48.11 | 5.90 | 32.96 | 65.65 |
| Foreign direct investment, inward, share of GDP | FDI/GDP 1 | 193 | 2(1.02%) | 37.58 | 138.23 | −6.75 | 1144.76 |
| Domestic credit to private sector (% of GDP) | CPS/GDP 1 | 195 | 0(0%) | 110.77 | 35.83 | 54.56 | 202.19 |
| Health expenditure, public (% of government expenditure) | H.EXP (Public)/GOV.EXP 1 | 180 | 15(7.69%) | 15.11 | 2.14 | 9.29 | 20.86 |
| Primary net lending/borrowing (also referred as primary balance) (% of GDP) | Primary Balance/GDP 2 | 195 | 0(0%) | −0.94 | 3.71 | −29.73 | 6.04 |
| Cyclically adjusted balance (% of potential GDP) | Cyclically Adjusted Balance/GDP 2 | 195 | 0(0%) | −2.53 | 3.39 | −18.61 | 4.01 |
| Revenue (% of GDP) | Revenue/GDP 2 | 195 | 0(0%) | 45.03 | 6.18 | 32.79 | 57.44 |
| Reserves, foreign exchange, excluding gold, USD | Reserves 1 | 195 | 0(0%) | 25,169.38 | 24,607.29 | 143.55 | 119,026 |
| Cash surplus/deficit (% of GDP) | Cash Balance/GDP 2 | 179 | 16(8.20%) | −3.51 | 4.23 | −32.37 | 4.11 |
| Tax revenue (% of GDP) | Tax Revenue/GDP 1 | 179 | 16(8.20%) | 22.22 | 5.85 | 0.31 | 35.08 |
| Savings/Expenditures | Savings/Expenditures 1 | 194 | 1(0.51%) | 0.28 | 0.14 | 0.08 | 0.85 |
| Imports, goods & services (% of GDP) | M/GDP 1 | 195 | 0(0%) | 50.45 | 31.81 | 22.92 | 177.65 |
| Trade balance/GDP | Trade/GDP 1 | 195 | 0(0%) | 4.08 | 9.10 | −12.55 | 36.20 |
| External debt, total, share of exports | EX-DEBT/X 1 | 190 | 5(2.56%) | 673.46 | 498.41 | 258.78 | 2807.26 |
| Political stability risk rating (7 = lowest risk) | PSRR 3 | 195 | 0(0%) | 5.81 | 0.62 | 4.26 | 6.83 |
| Credit rating, average | Credit Rating 3 | 195 | 0(0%) | 17.88 | 4.15 | 0.00 | 20.00 |
| Exchange rate, effective real | REER 3 | 195 | 0(0%) | 101.52 | 5.46 | 88.99 | 127.40 |
| External debt, total, share of GDP | EX-DEBT/GDP 1 | 190 | 5(2.56%) | 511.16 | 983.55 | 82.98 | 5490.03 |
| External debt government/GDP | EX-DEBT-GOV/GDP 1 | 179 | 16(8.20%) | 41.96 | 25.61 | 1.65 | 152.47 |
| External debt private/GDP | EX-DEBT-PRIVATE/GDP 1 | 177 | 18 (9.23%) | 214.75 | 195.45 | 33.51 | 1067.07 |
| Foreign direct investment, outward, share of GDP | OFDI/GDP 1 | 182 | 13(6.67%) | 39.26 | 128.79 | −3.95 | 833.68 |
| Wages, hourly, USD | WAGE 3 | 182 | 13(6.67%) | 32.44 | 10.10 | 8.19 | 51.67 |
| Net debt (% of GDP) | NET_DEBT/GDP 2 | 164 | 21(10.77%) | 42.88 | 47.10 | −69.74 | 176.57 |
| Bank capital to assets ratio (%) | CAPITAL/ASSETS 1 | 170 | 25(12.82%) | 5.77 | 1.51 | 3.00 | 13.97 |
| Bank nonperforming loans to total gross loans (%) | NPL/TGL 1 | 187 | 8(4.10%) | 4.58 | 5.93 | 0.08 | 34.67 |
| Trade credit risk rating (7 = lowest risk) | TCRR 3 | 152 | 23(11.79%) | 5.32 | 1.99 | 0.00 | 7.00 |
| Household Debt/GDP | Household Debt/GDP 3 | 125 | 70(35.90%) | 84.16 | 36.15 | 46.78 | 217.51 |
| Control of Corruption | Corruption 1 | 195 | 0(0%) | 1.54 | 0.71 | −0.25 | 2.55 |
| Government Effectiveness | GOV.EFFECT 1 | 195 | 0(0%) | 1.51 | 0.51 | 0.21 | 2.36 |
| Political Stability and Absence of Violence/Terrorism | PSAVTT 1 | 195 | 0(0%) | 0.81 | 0.46 | −0.47 | 1.66 |
| Regulatory Quality | Regulatory Quality 1 | 195 | 0(0%) | 1.43 | 0.38 | 0.34 | 1.92 |
| Rule of Law | Rule of Law 1 | 195 | 0(0%) | 1.49 | 0.48 | 0.24 | 2.12 |
| Voice and Accountability | Voice and Accountability 1 | 195 | 0(0%) | 1.35 | 0.24 | 0.56 | 1.83 |
| Gini coefficient | GINI COEFF 4,5 | 135 | 60(30.77%) | 36.66 | 3.09 | 28.51 | 44.56 |
| Gross enrolment ratio, tertiary, both sexes (%) | Enrolment Tertiary 1 | 156 | 39(20%) | 67.44 | 16.33 | 10.33 | 110.26 |
| Gross enrollment ratio, primary, both sexes (%) | Enrolment Primary 1 | 172 | 23(11.79%) | 103.98 | 4.86 | 95.71 | 120.90 |
| Gross enrolment ratio, secondary, both sexes (%) | Enrolment Secondary 1 | 172 | 23(11.79%) | 110.46 | 13.14 | 91.39 | 164.81 |
| Fertility rate, total (births per woman) | Fertility Rate 1 | 180 | 15(7.69%) | 1.64 | 0.24 | 1.21 | 2.06 |
| Age dependency ratio, old (% of working-age population) | Age Dependency 1 | 195 | 0(0%) | 25.90 | 3.99 | 15.25 | 35.08 |
| Interest payments (% of revenue) | INT_PAY/REVENUE 1 | 195 | 16(8.20%) | 6.77 | 3.79 | 0.27 | 17.29 |
| Interest payments (% of expense) | INT_PAY/EXPENSE 1 | 179 | 16(8.20%) | 6.16 | 3.13 | 0.28 | 14.20 |
| Banking sector leverage | Bank Leverage 1 | 180 | 15(7.69%) | 16.03 | 9.52 | 3.89 | 51.56 |
| M2/GDP | M2/GDP 3 | 182 | 13(6.67%) | 81.31 | 22.09 | 41.62 | 133.32 |
| Fiscal Stress Index | FSI 6 | 195 | 0(0%) | 0.72 | 2.83 | −9.78 | 15.99 |
| Democracy | Democracy 7 | 195 | 0 (0%) | 9.84 | 0.48 | 8.00 | 10.00 |
| Index of Banking Crises (Laeven and Valencia, 2013) | Banking Crises | 195 | 0(0%) | 0.58 | 0.49 | 0.00 | 1.00 |
| VARIABLES | NO CRISIS (M) | CRISIS (M) | NO CRISIS (SD) | CRISIS (SD) |
|---|---|---|---|---|
| Frequency (%) | 64.290 | 35.710 | 64.290 | 35.710 |
| CA/GDP | 3.566 | −3.874 | 3.852 | 4.569 |
| GDP Growth | 1.754 | 0.066 | 2.527 | 3.017 |
| X/GDP | 64.514 | 35.858 | 43.348 | 23.399 |
| Inflation | 1.725 | 1.918 | 1.125 | 1.711 |
| H. Expenditure (Total)/GDP | 9.547 | 9.475 | 1.109 | 1.345 |
| Unemployment | 6.705 | 11.762 | 2.009 | 6.175 |
| GOV.EXP/GDP | 48.450 | 47.522 | 6.285 | 5.095 |
| FDI/GDP | 55.846 | 3.998 | 169.145 | 6.140 |
| CPS/GDP | 104.953 | 121.710 | 34.557 | 35.854 |
| H.EXP (Public)/GOV.EXP | 15.651 | 14.096 | 2.0931 | 1.941 |
| Primary Balance/GDP | 0.115 | −2.949 | 2.264 | 4.919 |
| Cyclically Adjusted Balance/GDP | −1.184 | −5.046 | 2.289 | 3.683 |
| Revenue/GDP | 47.309 | 40.774 | 5.796 | 4.403 |
| Reserves | 27,640.150 | 20,564.050 | 24,962.110 | 23,407.870 |
| Cash Balance/GDP | −1.956 | −6.317 | 2.271 | 5.378 |
| Tax Revenue/GDP | 23.469 | 19.660 | 5.451 | 6.406 |
| Savings/Expenditures | 0.308 | 0.218 | 0.147 | 0.117 |
| M/GDP | 57.648 | 36.955 | 35.300 | 17.497 |
| Trade/GDP | 6.866 | −1.097 | 8.773 | 7.232 |
| EX-DEBT/X | 674.356 | 670.413 | 588.113 | 269.289 |
| PSRR | 6.154 | 5.171 | 0.303 | 0.530 |
| Credit Rating | 19.254 | 15.310 | 3.091 | 4.645 |
| REER | 102.214 | 100.212 | 6.097 | 3.733 |
| EX-DEBT/GDP | 644.485 | 266.116 | 1188.315 | 257.153 |
| EX-DEBT-GOV/GDP | 34.552 | 54.269 | 19.030 | 30.138 |
| EX-DEBT-PRIVATE/GDP | 216.908 | 211.008 | 149.895 | 254.582 |
| OFDI/GDP | 60.280 | 4.005 | 159.224 | 6.483 |
| WAGE | 37.241 | 24.375 | 6.667 | 9.795 |
| NET_DEBT/GDP | 23.572 | 77.249 | 40.604 | 37.454 |
| CAPITAL/ASSETS | 5.532 | 6.149 | 1.567 | 1.330 |
| NPL/TGL | 2.177 | 8.817 | 1.874 | 7.942 |
| TCRR | 5.945 | 4.367 | 1.708 | 2.025 |
| Household Debt/GDP | 71.747 | 108.856 | 27.480 | 39.372 |
| Corruption | 1.922 | 0.817 | 0.367 | 0.631 |
| GOV.EFFECT | 1.790 | 0.981 | 0.246 | 0.445 |
| PSAVTT | 1.011 | 0.421 | 0.333 | 0.423 |
| Regulatory Quality | 1.615 | 1.082 | 0.218 | 0.378 |
| Rule of Law | 1.752 | 1.014 | 0.213 | 0.476 |
| Voice and Accountability | 1.483 | 1.109 | 0.138 | 0.205 |
| GINI COEFF | 35.677 | 38.523 | 2.752 | 2.888 |
| Enrollment Tertiary | 66.145 | 69.360 | 17.513 | 13.812 |
| Enrollment Primary | 103.028 | 105.829 | 4.228 | 5.458 |
| Enrollment Secondary | 111.447 | 108.453 | 14.072 | 11.030 |
| Fertility Rate | 1.714 | 1.508 | 0.197 | 0.266 |
| Age Dependency | 25.413 | 26.806 | 3.725 | 4.334 |
| INT_PAY/REVENUE | 4.695 | 10.524 | 2.241 | 3.072 |
| INT_PAY/EXPENSE | 4.571 | 9.026 | 2.100 | 2.607 |
| Bank Leverage | 15.474 | 17.058 | 8.312 | 11.362 |
| M2/GDP | 77.711 | 87.144 | 23.254 | 18.801 |
| FSI | 0.038 | 1.981 | 2.394 | 3.154 |
| Democracy | 9.772 | 9.971 | 0.566 | 0.170 |
| Banking Crises | 0.520 | 0.691 | 0.502 | 0.465 |
| Rank | SI | Values | RI | Values | CD | Values | SRC | Values |
|---|---|---|---|---|---|---|---|---|
| 1 | GOV.EFFECT | 1328.206 | Primary Balance/GDP | 2.487 | NPL/TGL | 4.238 | GDP growth | −0.639 *** |
| 2 | PSRR | 1320.574 | EX-DEBT-GOV/GDP | 2.370 | Unemployment | 3.074 | Primary Balance/GDP | −0.527 *** |
| 3 | Voice and Accountability | 1313.764 | PSRR | 2.347 | Cash Balance/GDP | 2.368 | Cash Balance/GDP | −0.428 *** |
| 4 | Rule of Law | 1313.293 | Corruption | 2.329 | Rule of Law | 2.235 | Cyclically Adjusted Balance/GDP | −0.398 *** |
| 5 | Corruption | 1310.869 | NET_DEBT/GDP | 2.283 | Primary Balance/GDP | 2.173 | NPL/TGL | 0.386 *** |
| 6 | Regulatory Quality | 1282.465 | Unemployment | 2.231 | GOV.EFFECT | 1.805 | Banking Crises | 0.373 *** |
| 7 | CA/GDP | 1241.308 | Regulatory Quality | 2.194 | PSRR | 1.746 | EX-DEBT/X | 0.341 *** |
| 8 | INT_PAY/REVENUE | 1215.579 | M2/GDP | 2.194 | Regulatory Quality | 1.736 | CA/GDP | −0.324 *** |
| 9 | PSAVTT | 1192.348 | CAPITAL/ASSET | 2.182 | Corruption | 1.722 | Bank Leverage | 0.323 *** |
| 10 | INT_PAY/EXPENSE | 1176.359 | INT_PAY/EXPENSE | 2.181 | EX-DEBT-PRIVATE/GDP | 1.698 | GOV.EFFECT | −0.313 *** |
| 11 | NET_DEBT/GDP | 1097.219 | Cash Balance/GDP | 2.168 | Cyclically Adjusted Balance/GDP | 1.609 | PSRR | −0.306 *** |
| 12 | Trade/GDP | 1048.616 | GINI COEFF | 2.136 | EX-DEBT-GOV/GDP | 1.584 | Voice and Accountability | −0.302 *** |
| 13 | Age Dependency | 1023.416 | Reserves | 2.132 | Inflation | 1.522 | NET_DEBT/GDP | 0.302 *** |
| 14 | Cyclically Adjusted Balance/GDP | 992.023 | Enrollment Tertiary | 2.131 | Credit Rating | 1.503 | Savings/Expenditures | −0.295 *** |
| 15 | WAGE | 983.387 | CPS/GDP | 2.127 | Voice and Accountability | 1.491 | EX-DEBT-GOV/GDP | 0.280 *** |
| 16 | Revenue/GDP | 927.769 | Bank Leverage | 2.120 | WAGE | 1.469 | INT_PAY/REVENUE | 0.269 *** |
| 17 | Enrollment Tertiary | 927.575 | Banking Crises | 2.114 | Household Debt/GDP | 1.433 | Rule of Law | −0.268 *** |
| 18 | NPL/TGL | 926.662 | Voice and Accountability | 2.097 | INT_PAY/REVENUE | 1.371 | TCRR | −0.267 *** |
| 19 | Unemployment | 908.386 | GDP growth | 2.085 | Bank Leverage | 1.367 | Trade/GDP | −0.262 *** |
| 20 | X/GDP | 907.778 | EX-DEBT/GDP | 2.078 | Fertility Rate | 1.350 | OFDI/GDP | −0.260 *** |
| 21 | Tax Revenue/GDP | 904.0651 | Trade/GDP | 2.057 | FSI | 1.317 | Corruption | −0.255 *** |
| 22 | Fertility Rate | 892.051 | Enrollment Secondary | 2.046 | Enrollment Primary | 1.291 | Credit Rating | −0.255 *** |
| 23 | M/GDP | 868.569 | NPL/TGL | 2.016 | PSAVTT | 1.270 | M2/GDP | 0.249 *** |
| 24 | Cash Balance/GDP | 865.003 | FDI/GDP | 1.98 | INT_PAY/EXPENSE | 1.242 | PSAVTT | −0.247 *** |
| 25 | Democracy | 853.076 | TCRR | 1.977 | H. Expenditure (Total)/GDP | 1.213 | Household Debt/GDP | 0.231 *** |
| 26 | EX-DEBT-GOV/GDP | 852.431 | H.EXP (Public)/GOV.EXP | 1.917 | GDP growth | 1.194 | Unemployment | 0.229 *** |
| 27 | GOV.EXP/GDP | 833.429 | H. Expenditure (Total)/GDP | 1.908 | CA/GDP | 1.186 | GOV.EXP/GDP | 0.223 *** |
| 28 | EX-DEBT/X | 822.099 | Inflation | 1.903 | TCRR | 1.185 | Regulatory Quality | −0.211 *** |
| 29 | M2/GDP | 813.392 | OFDI/GDP | 1.881 | Tax Revenue/GDP | 1.175 | X/GDP | −0.192 *** |
| 30 | Credit Rating | 810.121 | Enrollment Primary | 1.873 | Age Dependency | 1.163 | Enrolment Primary | 0.186 ** |
| 31 | Banking Crises | 787.017 | Age Dependency | 1.854 | GINI COEFF | 1.045 | M/GDP | −0.173 ** |
| 32 | H. Expenditure (Total)/GDP | 774.519 | Tax Revenue/GDP | 1.849 | CPS/GDP | 1.038 | INT_PAY/EXPENSE | 0.171 ** |
| 33 | Savings/Expenditures | 761.388 | Cyclically Adjusted Balance/GDP | 1.847 | Reserves | 0.938 | GINI COEFF | 0.166 * |
| 34 | Bank Leverage | 756.183 | Revenue/GDP | 1.835 | Banking Crises | 0.928 | EX-DEBT/GDP | 0.153 ** |
| 35 | EX-DEBT-PRIVATE/GDP | 756.152 | REER | 1.829 | H.EXP (Public)/GOV.EXP | 0.927 | Revenue/GDP | −0.152 ** |
| 36 | CPS/GDP | 738.579 | CA/GDP | 1.801 | NET_DEBT/GDP | 0.922 | H.EXP (Public)/GOV.EXP | −0.140 * |
| 37 | GINI COEFF | 712.864 | Household Debt/GDP | 1.791 | CAPITAL/ASSETS | 0.849 | Age Dependency | 0.105 |
| 38 | Reserves | 707.545 | Credit Rating | 1.759 | Trade/GDP | 0.824 | Tax Revenue/GDP | −0.103 |
| 39 | H.EXP (Public)/GOV.EXP | 700.329 | Fertility Rate | 1.755 | GOV.EXP/GDP | 0.811 | FDI/GDP | −0.101 |
| 40 | Enrollment Secondary | 683.320 | GOV.EXP/GDP | 1.745 | M2/GDP | 0.809 | CPS/GDP | 0.090 |
| 41 | Primary Balance/GDP | 682.901 | Rule of Law | 1.735 | Savings/Expenditures | 0.793 | H. Expenditure (Total)/GDP | 0.087 |
| 42 | Enrollment Primary | 667.923 | X/GDP | 1.730 | Enrollment Tertiary | 0.789 | Reserves | −0.071 |
| 43 | EX-DEBT/GDP | 647.172 | PSAVTT | 1.691 | Enrollment Secondary | 0.784 | Enrollment Secondary | 0.061 |
| 44 | GDP growth | 642.788 | GOV.EFFECT | 1.672 | Revenue/GDP | 0.760 | CAPITAL/ASSET | −0.059 |
| 45 | CAPITAL/ASSETS | 638.174 | EX-DEBT/X | 1.551 | REER | 0.612 | WAGE | −0.058 |
| 46 | FSI | 615.079 | FSI | 1.541 | X/GDP | 0.540 | Fertility Rate | −0.058 |
| 47 | TCRR | 611.866 | INT_PAY/REVENUE | 1.497 | M/GDP | 0.496 | EX-DEBT-PRIVATE/GDP | 0.034 |
| 48 | Inflation | 608.657 | Savings/Expenditures | 1.488 | EX-DEBT/X | 0.458 | REER | 0.024 |
| 49 | Household Debt/GDP | 567.960 | M/GDP | 1.477 | Democracy | 0.301 | Democracy | −0.026 |
| 50 | REER | 564.612 | Democracy | 1.473 | EX-DEBT/GDP | 0.216 | Enrollment Tertiary | −0.020 |
| 51 | OFDI/GDP | 531.554 | WAGE | 1.341 | OFDI/GDP | 0.041 | Inflation | 0.012 |
| 52 | FDI/GDP | 484.981 | EX-DEBT-PRIVATE/GDP | 1.193 | FDI/GDP | 0.036 |
| Rank | SRC (Crisis) | Values | SRC (No Crisis) | Values | Overall Index (1) | Values | Overall Index (2) | Values |
|---|---|---|---|---|---|---|---|---|
| 1 | GDP growth | −0.752 *** | Primary Balance/GDP | −0.543 *** | NPL/TGL | 14.112 | NPL/TGL | 5.992 |
| 2 | Banking Crises | 0.547 *** | GDP growth | −0.510 *** | Primary Balance/GDP | 12.135 | Primary Balance/GDP | 4.780 |
| 3 | Household Debt/GDP | 0.516 *** | Cyclically Adjusted Balance/GDP | −0.315 ** | Cash Balance/GDP | 11.617 | PSRR | 4.769 |
| 4 | EXDEBT/GDP | 0.512 *** | Cash Balance/GDP | −0.284 *** | GDP growth | 11.148 | Corruption | 4.257 |
| 5 | EXDEBT/X | 0.490 *** | Bank Leverage | 0.263 *** | Unemployment | 11.059 | Cash Balance/GDP | 3.969 |
| 6 | Primary Balance/GDP | −0.476 *** | Trade/GDP | −0.259 *** | PSRR | 10.725 | Unemployment | 3.902 |
| 7 | GOV.EXP/GDP | 0.471 *** | WAGE | 0.251 *** | Rule of Law | 10.508 | Voice and Accountability | 3.472 |
| 8 | Bank Leverage | 0.459 *** | Banking Crises | 0.251 *** | GOV.EFFECT | 10.221 | Regulatory Quality | 3.357 |
| 9 | EXDEBTPRIVATE/GDP | 0.401 *** | EXDEBT/X | 0.239 *** | Corruption | 10.185 | Rule of Law | 2.978 |
| 10 | M2/GDP | 0.393 *** | GOV.EXP/GDP | 0.238 *** | Cyclically Adjusted Balance/GDP | 10.128 | GDP growth | 2.645 |
| 11 | Cash Balance/GDP | −0.333 *** | GINI COEFF | 0.215 ** | Voice and Accountability | 10.029 | GOV.EFFECT | 2.548 |
| 12 | NPL/TGL | 0.320 *** | Savings/Expenditures | −0.194 ** | Regulatory Quality | 9.609 | EX-DEBT-GOV/GDP | 2.453 |
| 13 | Savings/Expenditures | −0.314 *** | CA/GDP | −0.192 ** | CA/GDP | 9.302 | NET_DEBT/GDP | 2.420 |
| 14 | Enrollment Secondary | 0.305 ** | NPL/TGL | 0.192 ** | EX-DEBT-GOV/GDP | 9.234 | Cyclically Adjusted Balance/GDP | 2.094 |
| 15 | X/GDP | 0.302 ** | EXDEBTGOV/GDP | 0.172 * | NET_DEBT/GDP | 8.860 | INT_PAY/EXPENSE | 1.880 |
| 16 | Cyclically Adjusted Balance/GDP | −0.264 * | CAPITAL/ASSETS | −0.161 * | Bank Leverage | 8.828 | CA/GDP | 1.855 |
| 17 | GINI COEFF | −0.262 ** | FSI | 1 | INT_PAY/REVENUE | 8.728 | Bank Leverage | 1.174 |
| 18 | Unemployment | 0.260 ** | Democracy | −0.156 | Banking Crises | 8.665 | Banking Crises | 1.038 |
| 19 | Credit Rating | −0.240 ** | X/GDP | −0.145 | PSAVTT | 8.515 | Trade/GDP | 0.985 |
| 20 | EXDEBTGOV/GDP | 0.239 ** | OFDI/GDP | −0.145 | INT_PAY/EXPENSE | 8.236 | PSAVTT | 0.811 |
| 21 | Fertility Rate | 0.226 * | EXDEBT/GDP | 0.139 | Credit Rating | 8.178 | INT_PAY/REVENUE | 0.526 |
| 22 | CAPITAL/ASSETS | −0.220 * | M2/GDP | 0.117 | Trade/GDP | 8.012 | M2/GDP | 0.358 |
| 23 | M/GDP | 0.211 * | TCRR | −0.100 | TCRR | 7.578 | Credit Rating | −0.182 |
| 24 | INT_PAY/EXPENSE | −0.210 * | Tax Revenue/GDP | −0.099 | M2/GDP | 7.492 | Age Dependency | −0.517 |
| 25 | FSI | 1 | H. Expenditure (Total)/GDP | 0.097 | Household Debt/GDP | 7.352 | GINI COEFF | −0.551 |
| 26 | Inflation | −0.188 | M/GDP | −0.094 | EX-DEBT/X | 7.161 | TCRR | −0.606 |
| 27 | Trade/GDP | 0.173 | Enrollment Primary | −0.093 | Savings/Expenditures | 7.065 | Tax Revenue/GDP | −1.037 |
| 28 | WAGE | 0.171 | PSAVTT | −0.085 | Enrollment Primary | 7.025 | CPS/GDP | −1.041 |
| 29 | OFDI/GDP | −0.168 | Enrollment Tertiary | 0.085 | GOV.EXP/GDP | 6.854 | Enrollment Tertiary | −1.087 |
| 30 | H.EXP (Public)/GOV.EXP | −0.162 | Rule of Law | −0.068 | Age Dependency | 6.852 | Enrollment Primary | −1.182 |
| 31 | H. Expenditure (Total)/GDP | 0.157 | Unemployment | 0.065 | GINI COEFF | 6.824 | Revenue/GDP | −1.206 |
| 32 | Reserves | −0.152 | Reserves | 0.062 | Tax Revenue/GDP | 6.585 | GOV.EXP/GDP | −1.332 |
| 33 | Tax Revenue/GDP | 0.142 | NET_DEBT/GDP | 0.062 | Revenue/GDP | 6.427 | Household Debt/GDP | −1.367 |
| 34 | REER | 0.140 | INT_PAY/REVENUE | 0.057 | Fertility Rate | 6.327 | Reserves | −1.433 |
| 35 | CPS/GDP | 0.135 | FDI/GDP | −0.057 | X/GDP | 6.301 | H. Expenditure (Total)/GDP | −1.441 |
| 36 | NET_DEBT/GDP | 0.119 | Voice and Accountability | −0.056 | WAGE | 6.297 | Fertility Rate | −1.506 |
| 37 | Enrollment Primary | 0.117 | REER | 0.053 | H. Expenditure (Total)/GDP | 6.274 | X/GDP | −1.676 |
| 38 | Regulatory Quality | −0.109 | Age Dependency | 0.052 | CPS/GDP | 6.170 | EX-DEBT/X | −1.694 |
| 39 | Enrollment Tertiary | 0.084 | Household Debt/GDP | −0.051 | H.EXP (Public)/GOV.EXP | 6.159 | H.EXP (Public)/GOV.EXP | −1.734 |
| 40 | Rule of Law | 0.078 | GOV.EFFECT | −0.049 | EX-DEBT-PRIVATE/GDP | 5.787 | CAPITAL/ASSET | −1.762 |
| 41 | Voice and Accountability | −0.07 | Enrollment Secondary | 0.048 | Reserves | 5.780 | Savings/Expenditures | −2.043 |
| 42 | FDI/GDP | 0.052 | EXDEBTPRIVATE/GDP | 0.048 | M/GDP | 5.721 | Enrollment Secondary | −2.128 |
| 43 | CA/GDP | 0.049 | H.EXP (Public)/GOV.EXP | 0.041 | Inflation | 5.701 | Inflation | −2.279 |
| 44 | INT_PAY/REVENUE | 0.032 | CPS/GDP | −0.040 | Enrollment Tertiary | 5.568 | EX-DEBT/GDP | −2.285 |
| 45 | TCRR | −0.031 | PSRR | −0.036 | OFDI/GDP | 5.473 | WAGE | −2.418 |
| 46 | Revenue/GDP | −0.027 | Inflation | 0.034 | CAPITAL/ASSET | 5.431 | OFDI/GDP | −2.931 |
| 47 | Age Dependency | 0.021 | Regulatory Quality | 0.033 | Enrollment Secondary | 5.312 | M/GDP | −2.937 |
| 48 | Corruption | 0.013 | Fertility Rate | −0.027 | EX-DEBT/GDP | 5.222 | EX-DEBT-PRIVATE/GDP | −3.759 |
| 49 | GOV.EFFECT | −0.012 | Revenue/GDP | 0.024 | FSI | 4.927 | FSI | −3.906 |
| 50 | PSRR | 0.005 | Corruption | −0.016 | REER | 4.232 | REER | −3.908 |
| 51 | PSAVTT | 0.005 | INT_PAY/EXPENSE | −0.012 | Democracy | 4.046 | FDI/GDP | −3.950 |
| 52 | Democracy | 0.004 | Credit Rating | 0.010 | FDI/GDP | 4.017 | Democracy | −4.365 |
| Criteria | Model (EU-15) | Model (PIIGS) |
|---|---|---|
| % and number of correctly predicted non-crises | 79.31% (115/145) | 18.18% (6/33) |
| % and number of correctly predicted crises | 74.00% (37/50) | 100% (32/32) |
| Dependent Variable: FSI | ||||||||||
|---|---|---|---|---|---|---|---|---|---|---|
| Variables | Model 1 | Model 2 | Model 3 | Model 4 | Model 5 | Model 6 | Model 7 | Model 8 | Model 9 | Model 10 |
| NPL/TGL | 0.150 *** (0.038) | 0.063 ** (0.028) | 0.167 *** (0.052) | 0.164 *** (0.052) | 0.131 *** (0.036) | 0.108 *** (0.033) | 0.096 *** (0.031) | 0.168 *** (0.050) | 0.093 *** (0.030) | 0.175 *** (0.042) |
| Primary Balance/GDP | −0.280 *** (0.071) | −0.251 *** (0.1348) | −0.153 * (0.081) | −0.277 *** (0.073) | −0.265 *** (0.069) | −0.266 *** (0.069) | −0.285 *** (0.071) | −0.162 ** (0.083) | −0.259 *** (0.070) | −0.249 ** (0.103) |
| PSRR | −0.375 *** (0.052) | |||||||||
| Corruption | −1.094 *** (0.153) | |||||||||
| Cash Balance/GDP | −0.173 ** (0.076) | |||||||||
| Unemployment | 0.024 *** (0.004) | |||||||||
| Voice and Accountability | −1.537 *** (0.211) | |||||||||
| Regulatory Quality | −1.361 *** (0.187) | |||||||||
| Rule of Law | −1.296 *** (0.178) | |||||||||
| GDP growth | −0.612 *** (0.123) | |||||||||
| GOV.EFFECT | −1.260 *** (0.174) | |||||||||
| Cyclically Adjusted Balance/GDP | −0.165 *** (0.039) | |||||||||
| CONSTANT | 1.323 (2.335) | −1.541 ** (0.697) | −2.605 *** (0.374) | −2.390 *** (0.428) | −0.047 (1.613) | −1.240 (0.999) | −0.913 (0.814) | −1.713 *** (0.366) | −0.985 (0.829) | −2.333 *** (0.351) |
| Observations | 195 | 195 | 195 | 195 | 195 | 195 | 195 | 195 | 195 | 195 |
| Pseudo R2 | 0.27 | 0.26 | 0.30 | 0.26 | 0.27 | 0.26 | 0.27 | 0.45 | 0.27 | 0.26 |
| LR Stat | 59.4 *** | 58.4 *** | 63.7 *** | 57.4 *** | 59.0 *** | 58.2 *** | 60.0 *** | 99.7 *** | 59.6 *** | 57.4 *** |
| Akaike Info | 0.91 | 0.91 | 0.89 | 0.92 | 0.91 | 0.91 | 0.90 | 0.69 | 0.91 | 0.92 |
| Cut-Off Level | Model 1 | Model 2 | Model 3 | Model 4 | Model 5 | Model 6 | Model 7 | Model 8 | Model 9 | Model 10 |
|---|---|---|---|---|---|---|---|---|---|---|
| C = 0.5 | ||||||||||
| % and number of correctly predicted non-crises | 95.10% (136/143) | 93.71% (134/143) | 95.10% (136/143) | 83.22% (119/143) | 95.10% (136/143) | 95.10% (136/143) | 95.10% (136/143) | 97.20% (139/143) | 93.71% (134/143) | 66.43% (95/143) |
| % and number of correctly predicted crises | 50% (26/52) | 55.77% (29/52) | 57.69% (30/52) | 51.92% (27/52) | 50% (26/52) | 55.77% (29/52) | 55.77% (29/52) | 67.31% (35/52) | 55.77% (29/52) | 53.85% (28/52) |
| C = 0.25 | ||||||||||
| % and number of correctly predicted non-crises | 76.22% (109/143) | 74.83% (107/143) | 85.52% (118/143) | 40.56% (58/143) | 75.52% (108/143) | 72.03% (103/143) | 76.22% (109/143) | 85.31% (122/143) | 75.52% (108/143) | 21.68% (31/143) |
| % and number of correctly predicted crises | 69.23% (36/52) | 73.08% (38/52) | 75% (39/52) | 76.92% (40/52) | 69.23% (36/52) | 69.23% (36/52) | 73.08% (38/52) | 78.85% (41/52) | 73.08% (38/52) | 88.46% (46/52) |
| C = 0.2 | ||||||||||
| % and number of correctly predicted non-crises | 68.53% (98/143) | 66.43% (95/143) | 72.72% (104/143) | 34.27% (49/143) | 67.83% (97/143) | 69.93% (100/143) | 65.73% (94/143) | 78.32% (112/143) | 69.93% (100/143) | 13.94% (20/143) |
| % and number of correctly predicted crises | 76.92% (40/52) | 75% (39/52) | 76.92% (40/52) | 88.46% (46/52) | 75% (39/52) | 73.08% (38/52) | 75% (39/52) | 78.85% (41/52) | 76.92% (40/52) | 90.38% (47/52) |
| Variables | Model 1 | Model 2 | Model 3 | Model 4 | Model 5 | Model 6 | Model 7 | Model 8 | Model 9 | Model 10 |
|---|---|---|---|---|---|---|---|---|---|---|
| NPL/TGL (Regime 1) | 0.0852 *** (4.6928) | 0.0860 *** (4.6168) | 0.0840 *** (5.6005) | 0.0691 ** (2.5123) | 0.0799 *** (4.3170) | 0.0824 *** (4.4995) | 0.0740 *** (4.4310) | 0.0429 *** (2.9431) | 0.0850 *** (4.6662) | 0.0840 *** (5.6520) |
| NPL/TGL (Regime 2) | 0.0020 (0.0193) | 0.0081 (0.0748) | 0.0223 (0.2283) | 0.0170 (0.1403) | 0.0064 (0.0550) | 0.0120 (0.1178) | 0.0057 (0.0551) | 0.0364 (0.3093) | 0.0005 (0.0049) | 0.0398 (0.4684) |
| Primary Balance/GDP (Regime 1) | −0.3012 *** (−4.2105) | −0.0316 *** (−9.8841) | −0.2882 *** (−7.0861) | −0.3030 *** (−10.6341) | −0.2977 *** (−9.6040) | −0.2997 *** (−10.0140) | −0.2967 *** (−9.7860) | −0.2192 *** (−11.2549) | −0.3010 *** (−9.6911) | −0.3076 *** (−7.4115) |
| Primary Balance/GDP (Regime 2) | −0.2277 ** (−2.0433) | −0.2347 ** (−2.0862) | −0.2100 * (−1.7335) | −0.2210 * (−1.9493) | −0.2290 ** (−2.0338) | −0.2362 ** (−2.0885) | −0.2399 ** (−2.0749) | −0.1864 (−0.9240) | −0.2273 ** (−2.0389) | −0.1602 (−1.0865) |
| PSRR (Regime 1) | −0.5258 ** (−2.3573) | |||||||||
| PSRR (Regime 2) | −1.6070 * (−1.6448) | |||||||||
| Corruption (Regime 1) | −0.5181 *** (−2.8380) | |||||||||
| Corruption (Regime 2) | −0.8653 (−0.9782) | |||||||||
| Cash Balance/GDP (Regime 1) | −0.1913 *** (−6.4542) | |||||||||
| Cash Balance/GDP (Regime 2) | −0.0698 (−0.75690) | |||||||||
| Unemployment (Regime 1) | 0.0893 ** (2.1616) | |||||||||
| Unemployment (Regime 2) | 0.1897 * (1.8022) | |||||||||
| Voice and Accountability (Regime 1) | −1.8370 *** (−3.6224) | |||||||||
| Voice and Accountability (Regime 2) | −3.2583 (−1.2709) | |||||||||
| Regulatory Quality (Regime 1) | −1.0375 *** (−2.8681) | |||||||||
| Regulatory Quality (Regime 2) | −1.5038 (−0.9755) | |||||||||
| Rule of Law (Regime 1) | −0.8168 *** (−3.0846) | |||||||||
| Rule of Law (Regime 2) | −1.3201 (−0.9453) | |||||||||
| GDP growth (Regime 1) | −0.4262 *** (−11.7979) | |||||||||
| GDP growth (Regime 2) | −0.5844 *** (−3.4714) | |||||||||
| GOV.EFFECT (Regime 1) | −0.6890 ** (−2.4132) | |||||||||
| GOV.EFFECT (Regime 2) | −1.9062 (−1.5911) | |||||||||
| Cyclically Adjusted Balance/GDP (Regime 1) | −0.2166 *** (−6.4593) | |||||||||
| Cyclically Adjusted Balance/GDP (Regime 2) | −0.2517 (−1.5493) | |||||||||
| CONSTANT (Regime 1) | 3.0353 ** (2.3498) | 0.7753 ** (2.4738) | −0.6157 *** (−4.8374) | −0.7358 ** (−2.2208) | 2.4941 *** (3.5863) | 1.4636 *** (2.7435) | 1.2027 *** (2.8605) | 0.7648 *** (7.2357) | 1.0208 ** (2.2128) | −0.5427 *** (−4.6762) |
| CONSTANT (Regime 2) | 11.6515 ** (2.1514) | 3.9409 *** (2.9538) | 2.3620 ** (2.5289) | 0.7188 (0.5726) | 6.9388 ** (2.1365) | 4.9064 ** (2.3032) | 4.6355 ** (2.3107) | 2.4270 *** (4.1550) | 5.2348 *** (3.0322) | 1.7041 ** (2.0224) |
| Cut-Off Level | Model 1 | Model 2 | Model 3 | Model 4 | Model 5 | Model 6 | Model 7 | Model 8 | Model 9 | Model 10 |
|---|---|---|---|---|---|---|---|---|---|---|
| C = 0.5 | ||||||||||
| % and number of correctly predicted non-crises | 100% | 100% | 100% | 100% | 100% | 100% | 100% | 100% | 100% | 100% |
| % and number of correctly predicted crises | 100% | 100% | 100% | 100% | 100% | 100% | 100% | 0% | 100% | 100% |
| C = 0.25 | ||||||||||
| % and number of correctly predicted non-crises | 72.72% | 54.54% | 63.63% | 63.63% | 63.63% | 63.63% | 63.63% | 90.90% | 63.63% | 72.72% |
| % and number of correctly predicted crises | 100% | 100% | 100% | 100% | 100% | 100% | 100% | 100% | 100% | 100% |
| C = 0.2 | ||||||||||
| % and number of correctly predicted non-crises | 54.54% | 45.45% | 45.45% | 27.27% | 45.45% | 45.45% | 36.36% | 81.81% | 45.45% | 54.54% |
| % and number of correctly predicted crises | 100% | 100% | 100% | 100% | 100% | 100% | 100% | 100% | 100% | 100% |
| Cut-Off Level | Model 1 | Model 2 | Model 3 | Model 4 | Model 5 | Model 6 | Model 7 | Model 8 | Model 9 | Model 10 |
|---|---|---|---|---|---|---|---|---|---|---|
| C = 0.5 | ||||||||||
| % and number of correctly predicted non-crises | 100% | 100% | 100% | 100% | 100% | 100% | 100% | 100% | 100% | 100% |
| % and number of correctly predicted crises | 66.66% | 66.66% | 83.33% | 66.66% | 83.33% | 83.33% | 50.00% | 33.33% | 83.33% | 83.33% |
| C = 0.25 | ||||||||||
| % and number of correctly predicted non-crises | 42.86% | 28.57% | 28.57% | 28.57% | 28.57% | 28.57% | 28.57% | 85.71% | 28.57% | 28.57% |
| % and number of correctly predicted crises | 100% | 100% | 100% | 100% | 100% | 100% | 100% | 83.33% | 100% | 100% |
| C = 0.2 | ||||||||||
| % and number of correctly predicted non-crises | 42.86% | 28.57% | 28.57% | 28.57% | 28.57% | 28.57% | 28.57% | 57.14% | 28.57% | 28.57% |
| % and number of correctly predicted crises | 100% | 100% | 100% | 100% | 100% | 100% | 100% | 83.33% | 100% | 100% |
| Models | Model 1 | Model 2 | Model 3 | Model 4 | Model 5 | Model 6 | Model 7 | Model 8 | Model 9 | Model 10 |
|---|---|---|---|---|---|---|---|---|---|---|
| Sigma 0 | −0.3609 | −0.3618 | −0.3417 | −0.3967 | −0.3563 | −0.3652 | −0.3619 | −0.3880 | −0.3605 | −0.3658 |
| Sigma 1 | 1.4222 | 1.4276 | 1.6380 | 1.4162 | 1.4281 | 1.4235 | 1.4327 | 1.5241 | 1.4219 | 1.4227 |
| P00 | 0. 7944 | 0. 7942 | 0.8001 | 0.7859 | 0.7953 | 0.7937 | 0.7959 | 0.8327 | 0.7944 | 0.7940 |
| P11 | 0.4819 | 0.4800 | 0.4790 | 0.4826 | 0.4746 | 0.4800 | 0.4705 | 0.3092 | 0.4816 | 0.4843 |
| Log-Likelihood | −365.36 | −365.51 | −365.54 | −364.98 | −365.04 | −365.17 | −363.92 | −327.11 | −365.35 | −365.50 |
| Linearity Test (7) | 168.13 *** | 168.60 *** | 168.32 *** | 168.17 *** | 168.84 *** | 168.79 *** | 170.34 *** | 204.02 *** | 168.15 *** | 168.59 *** |
| Portmanteau Serial correlation (6) | 19.66 [0.10] | 21.30 [0.07] | 19.45 [0.11] | 21.41 [0.07] | 21.26 [0.07] | 20.68 [0.08] | 24.23 [0.03] | 9.46 [0.73] | 19.33 [0.11] | 19.63 [0.10] |
| Doornik and Hansen Normality (2) | 4.27 [0.12] | 4.51 [0.10] | 5.47 [0.06] | 7.16 [0.03] | 3.89 [0.14] | 4.97 [0.08] | 3.88 [0.14] | 3.24 [0.20] | 4.33 [0.11] | 5.03 [0.08] |
| Davies p-value | [0.000] | [0.000] | [0.000] | [0.000] | [0.000] | [0.000] | [0.000] | [0.000] | [0.000] | [0.000] |
Disclaimer/Publisher’s Note: The statements, opinions and data contained in all publications are solely those of the individual author(s) and contributor(s) and not of MDPI and/or the editor(s). MDPI and/or the editor(s) disclaim responsibility for any injury to people or property resulting from any ideas, methods, instructions or products referred to in the content. |
© 2023 by the authors. Licensee MDPI, Basel, Switzerland. This article is an open access article distributed under the terms and conditions of the Creative Commons Attribution (CC BY) license (https://creativecommons.org/licenses/by/4.0/).
Share and Cite
Allegret, J.-P.; Cergibozan, R. Determinants of the European Sovereign Debt Crisis: Application of Logit, Panel Markov Regime Switching Model and Self Organizing Maps. Entropy 2023, 25, 1032. https://doi.org/10.3390/e25071032
Allegret J-P, Cergibozan R. Determinants of the European Sovereign Debt Crisis: Application of Logit, Panel Markov Regime Switching Model and Self Organizing Maps. Entropy. 2023; 25(7):1032. https://doi.org/10.3390/e25071032
Chicago/Turabian StyleAllegret, Jean-Pierre, and Raif Cergibozan. 2023. "Determinants of the European Sovereign Debt Crisis: Application of Logit, Panel Markov Regime Switching Model and Self Organizing Maps" Entropy 25, no. 7: 1032. https://doi.org/10.3390/e25071032
APA StyleAllegret, J.-P., & Cergibozan, R. (2023). Determinants of the European Sovereign Debt Crisis: Application of Logit, Panel Markov Regime Switching Model and Self Organizing Maps. Entropy, 25(7), 1032. https://doi.org/10.3390/e25071032