1. Introduction
As an emerging distributed ledger technology, blockchain has been abused by a great deal of illicit activity due to its decentralized, pseudonymous, and convenience [
1]. According to the report by Chainalysis [
2], cybercriminals’ money laundering activities through cryptocurrencies reached USD 23.8 billion in 2022, a 68.0% increase compared to 2021. Money laundering involves transferring illicit funds through licit means and often includes criminal activities such as gambling, fraud, and human trafficking [
3]. Considering the adverse impact of money laundering on society and the economy, international organizations and governments are closely monitoring the issue of cryptocurrency money laundering, aiming to strengthen regulations to curb money laundering crimes. For instance, the Financial Action Task Force updated its report on the implementation of standards for virtual assets and virtual asset service providers in 2021, urging countries to enhance the regulation of virtual assets [
4]. Additionally, in 2022, the European Union passed the “Markets in Crypto-assets” cryptocurrency regulatory protocol, standardizing participants in the crypto market [
5]. However, as blockchain acts as the “bank” for cryptocurrencies, with its peer-to-peer and decentralized features [
6], it presents various challenges for regulation. Unlike transactions in regular banks, transactions in Bitcoin occur between addresses, which are digitally signed and verified in a public ledger on the blockchain without any intermediaries. The user is hidden behind a pseudonym in Bitcoin, rendering centralized regulatory approaches ineffective, which rely on rigorous compliance investigations and user monitoring [
7]. In view of this, it is imperative to study the detection of money laundering in cryptocurrency.
Cryptocurrency anti-money laundering has garnered widespread attention in the academic community, with methods primarily falling into three categories: rule-based methods, unsupervised anomaly detection methods, and supervised machine learning methods. Rule-based algorithms typically detect illicit activities by constructing expert systems [
8] or using heuristic algorithms [
9,
10,
11,
12], but these algorithms are limited by the pseudonymous and ever-changing rules of cryptocurrencies. Unsupervised AML methods achieve detection through clustering, such as trimmed
k-means [
13] and community clustering [
14], classifying transactions with similar patterns as a group to help detect anomalous transactions. However, research indicates that the effectiveness of those algorithms is not comparable with supervised AML algorithms. Therefore, more and more researchers are focusing on supervised learning methods to address these challenges, using training data with known labels to train models that learn the features of normal and suspicious transactions to help regulatory authorities detect potential money laundering activities. Among these, graph-related algorithms perform exceptionally well, including a node2vec-based classifier [
15], graph convolutional neural networks (GCNs) [
16], and their variations [
17,
18,
19]. Since the release of the largest supervised Bitcoin dataset by Elliptic [
20], which represents transactions as nodes and flows between transactions as edges, the detection of illicit money laundering can be viewed as a node classification task.
However, detecting cryptocurrency money laundering using graph structures is highly challenging due to the organized, heterogeneous, and noisy nature of the illicit behavior.
Organized. Money laundering is usually an organized behavior while current algorithms in Bitcoin mainly focus on node-level detection. Therefore, it is a challenge to come up with an algorithm that detects money laundering groups directly. A large number of disclosed large-scale cryptocurrency money laundering cases (e.g., 1MDB [
21] and Danske Bank scandal [
22]) show that money laundering activities typically exhibit scale and organizational characteristics. As shown in
Figure 1, node-level detection methods can identify individual nodes as potential illicit transactions. However, they ignore the relationships and interactions between nodes. In contrast, subgraph-level detection methods consider the topology between nodes and attempt to identify subgraphs with similar transaction patterns, such as frequent fund transfers and lengthy transaction chains.
Heterogeneous. Although GNN-based illicit transaction detection techniques have achieved significant success, most of them are focused on homogeneous graphs, i.e., transaction record graph [
20] or wallet address graph [
23] in the upper-left corner of
Figure 2. In reality, heterogeneity is an inherent characteristic of cryptocurrency transaction networks [
24]. Specifically, the wallet address and transaction records together form the graph, as depicted in the top-left corner of
Figure 2. Heterogeneity increases the complexity of data mining, leading to a more intricate risk identification process.
Noisy. Despite the significant differences in behavioral patterns between licit and illicit transactions, real-world transactions often exhibit a notable amount of noise, including erroneous transactions and intentionally disruptive transactions initiated by money launderers to obfuscate their activities [
25]. As a result, these noises can lead to an unclear distinction in the transaction topology.
Figure 1.
Organized behavior of an illicit group. The node-level detection methods identify the individual illicit transaction, while the subgraph-level detection methods identify the illicit group.
Figure 1.
Organized behavior of an illicit group. The node-level detection methods identify the individual illicit transaction, while the subgraph-level detection methods identify the illicit group.
Figure 2.
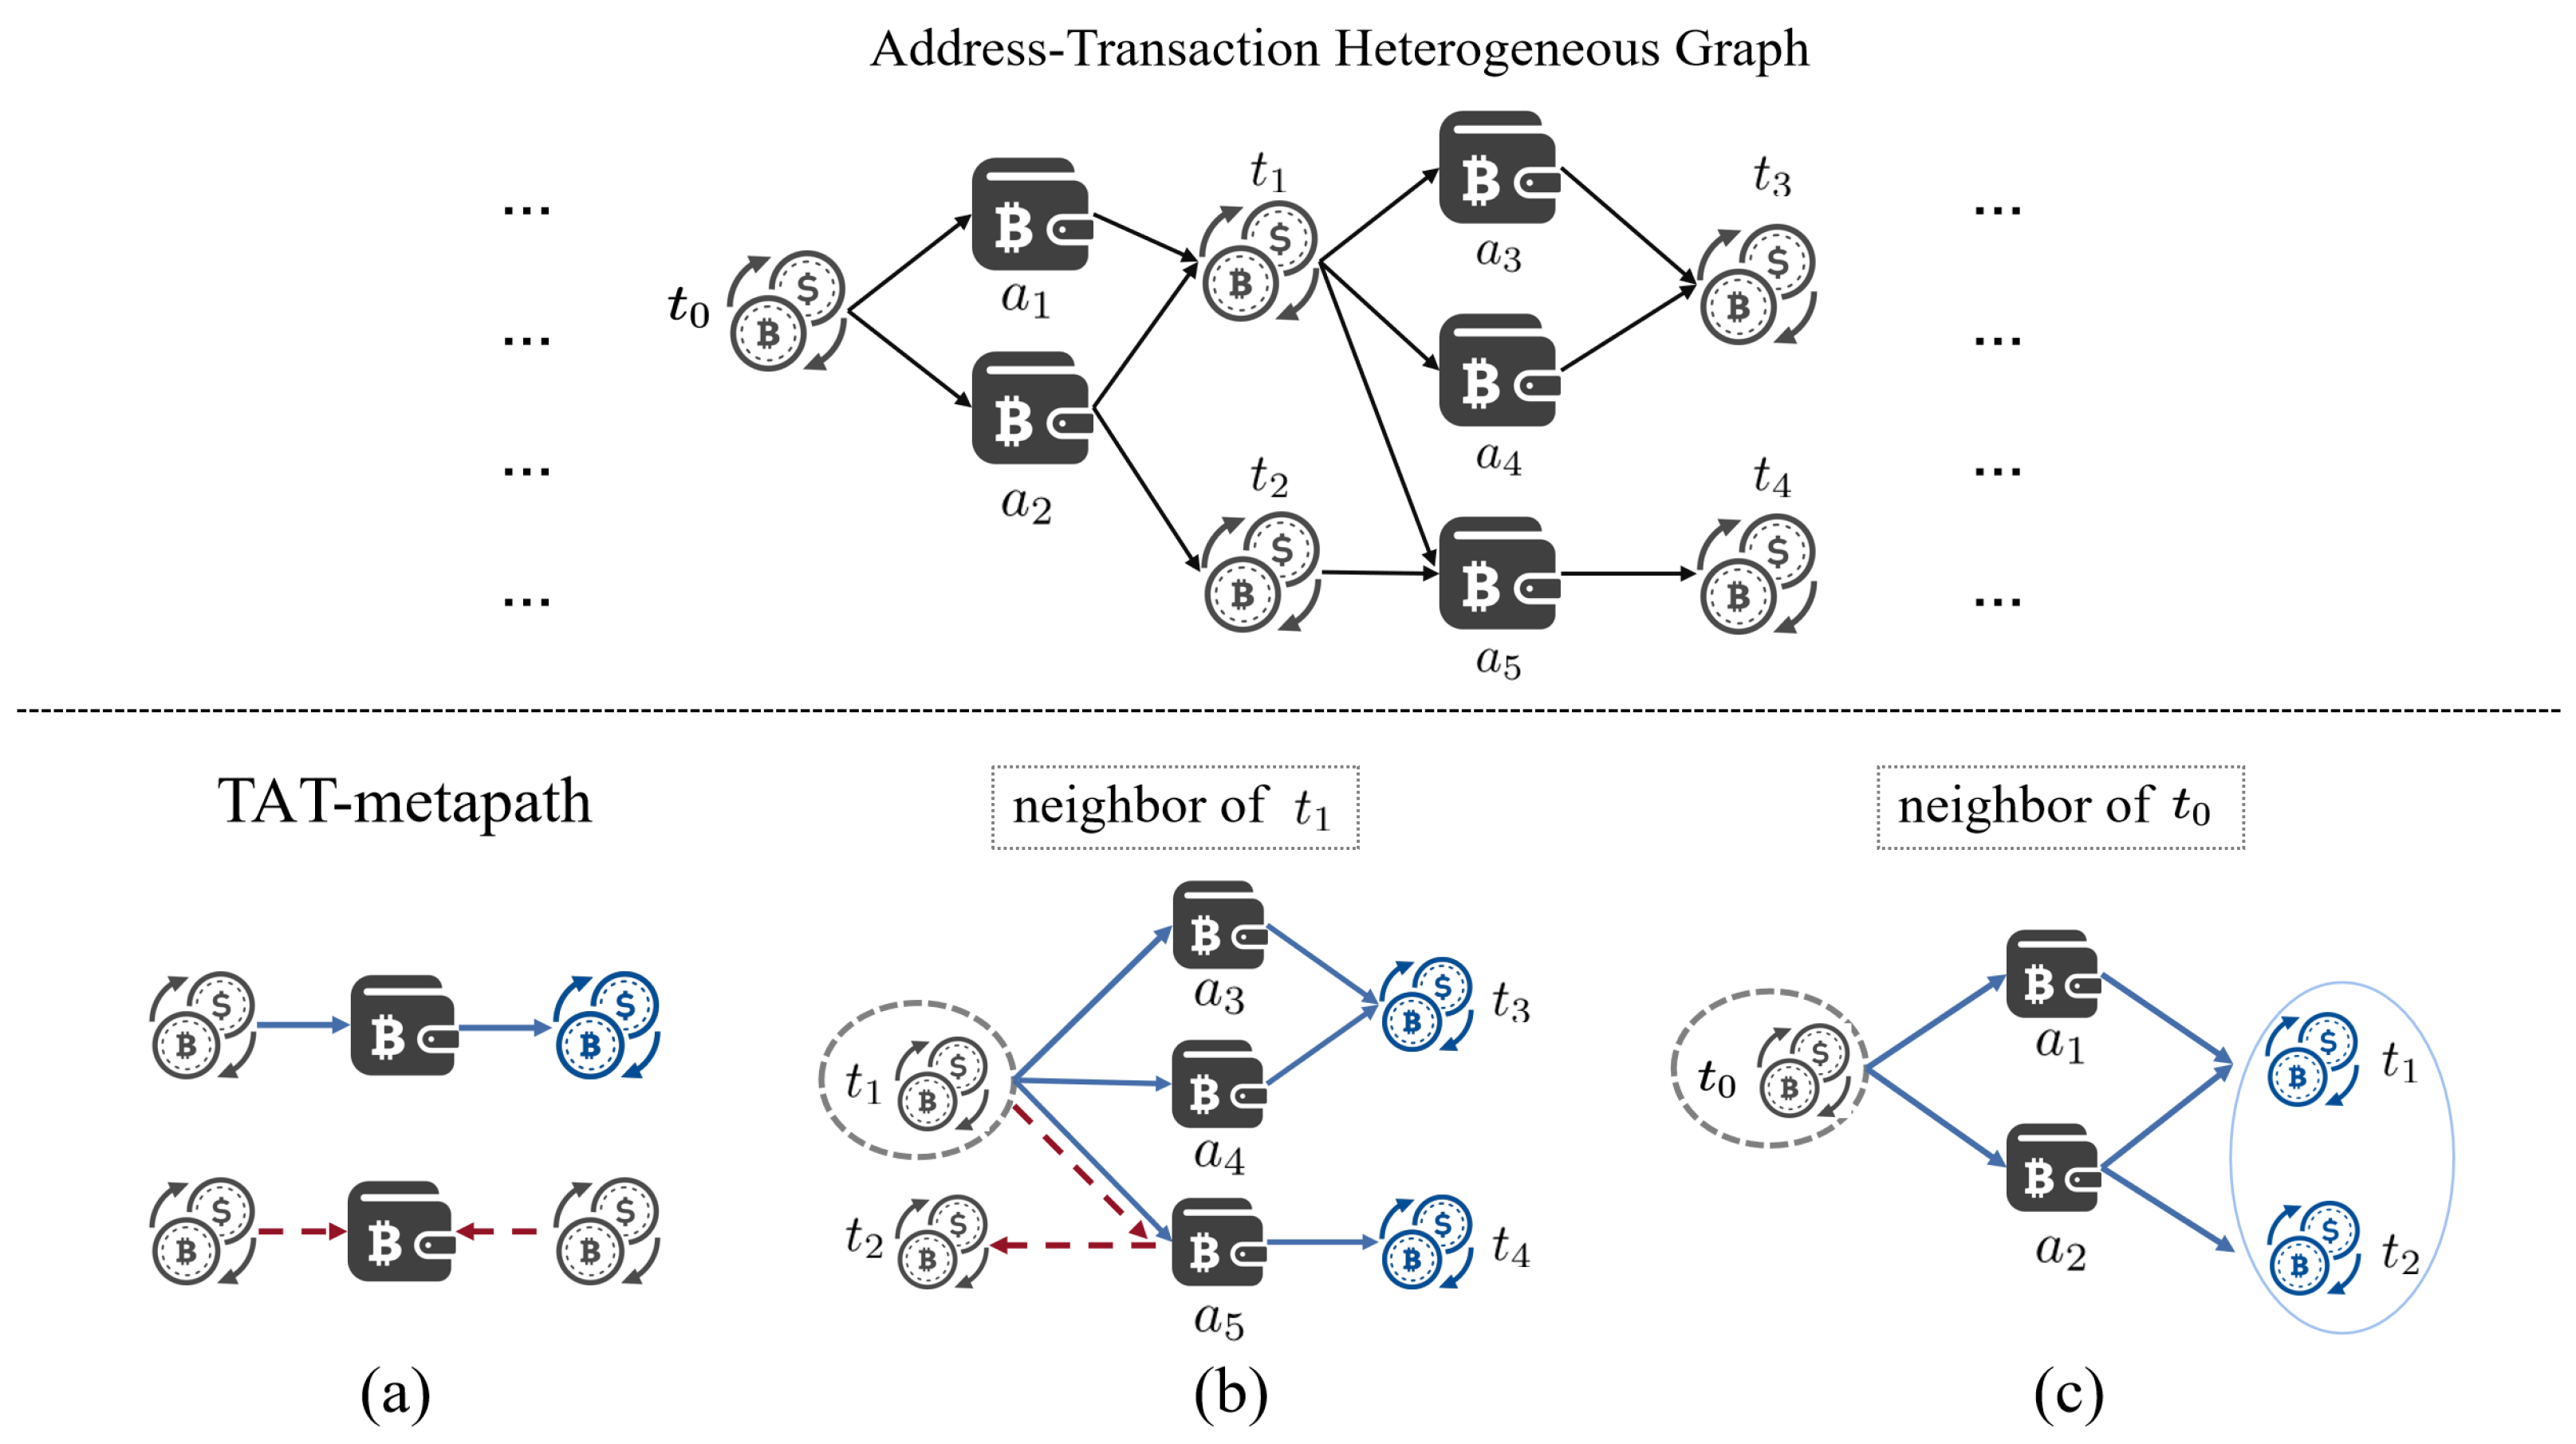
Address–transaction heterogeneous graph. The (top-left) is the wallet address graph and transaction record graph. The (bottom-left) is the address–transaction heterogeneous graph. The (top-right) is the neighbor of under the TAT-metapath, and the (bottom-right) is the neighbor of under ATA-metapath, where the dashed round box indicates the target node, the blue and red lines distinguish different path directions, and the blue and red nodes are the neighbors of the target node under the corresponding path.
Figure 2.
Address–transaction heterogeneous graph. The (top-left) is the wallet address graph and transaction record graph. The (bottom-left) is the address–transaction heterogeneous graph. The (top-right) is the neighbor of under the TAT-metapath, and the (bottom-right) is the neighbor of under ATA-metapath, where the dashed round box indicates the target node, the blue and red lines distinguish different path directions, and the blue and red nodes are the neighbors of the target node under the corresponding path.
Considering the above characteristics of cryptocurrency money-laundering behavior, we design a subgraph-level graph contrastive learning algorithm based on the heterogeneous information of the Bitcoin network, namely contrastive heterogeneous graph neural network (Bit-CHetG). The Bit-CHetG consists of four main components: transaction subgraph embedding (TSE), address feature aggregation (AFA), feature fusion (FF), and contrastive learning (CL). Firstly, for the heterogeneity of the network, we propose an address–transaction heterogeneous graph, as shown in the bottom-left corner of
Figure 2, to establish the connection between consecutive transaction records and related wallet addresses. Thus, the TSE component and AFA component extract features under different metapaths and merge them through the FF component. Secondly, for the organizational characteristics of money-laundering behavior, the TSE component constructs downstream transaction subgraphs, and the AFA component constructs the associated address subgraphs. Specifically, we recommend the tree-structure to be the representative structure of the transaction subgraph since the flow of money laundering funds tends to be dispersed from upstream to downstream [
26], which is confirmed to be effective in the experiments of
Section 5.2. Thirdly, for the noise during trading, we employ graph data augmentation strategies, such as edge perturbation and node reconnection, to simulate the scenarios with inherent noise, so as to provide the model with input data filled with rich noise features. Subsequently, we introduce supervised graph contrastive learning [
27] to explicitly identify differences in the augmented data and obtain a robust representation.
The contributions of this paper can be summarized as follows.
This work focuses on mining transaction patterns in subgraphs. We have discovered that the tree structure, as typical transaction patterns, can serve as a representative structure for distinguishing money laundering from non-money laundering activities.
To the best of our knowledge, we are the first to propose a subgraph detection model based on graph contrastive learning methods in the field of cryptocurrency money laundering detection.
Experimental results demonstrate the effectiveness of the Bit-CHetG models by integrating various money laundering detection models such as random forest [
28], GCN [
16], inspection-L [
29], SubGNN [
30], Tsgn [
31], HAN [
32], and MAGNN [
33]. The comparison algorithms cover the latest graph-based money laundering detection algorithms in Bitcoin, subgraph classification algorithms, and heterogeneous graph classification algorithms. In particular, the Micro F1 Score of our proposed Bit_CHetG is improved by at least 5%.
The rest of the paper is organized as follows.
Section 2 presents related work in cryptocurrency about money laundering detection and subgraph representation algorithms.
Section 3 introduces the Bitcoin address–transaction heterogeneous graph, defining two types of metapaths, and clarifies the subgraph classification problem. In
Section 4, the four modules of the proposed algorithm are presented in detail.
Section 5 describes the data sources and the experimental results. In
Section 6, we discuss the social and economic implications of the algorithms proposed in the paper. In
Section 7, the paper is summarized, and we analyze the limitations of this research and propose future research directions.
3. Problem
Our research is dedicated to the detection of money laundering groups in cryptocurrency. Therefore, in this section, we formulate the Bitcoin address–transaction heterogeneous graph based on the smallest transaction unit of Bitcoin, including the input and output. Subsequently, we define two types of metapaths on the heterogeneous graph, which serve as the foundation to sample the subgraphs. Finally, we define the illicit subgraph detection problem. The symbols are defined in
Table 1.
Definition 1. Address–transaction heterogeneous graph. The heterogeneous graph is denoted by , including the node sets and edge sets. The address–transaction heterogeneous graph is illustrated in the bottom-left corner of Figure 2. The transaction node-set and address node-set are denoted as and , respectively. Each is a transaction record that consists of a set of attributes, such as in-amount, out-amount, fee, and so on. Similarly, there are some features associated with a wallet address such as the total amount, number of transactions, and so on. Then, the input feature matrix is denoted by and , where and are the dimensions of the feature vector, is the total number of transactions, and is the total number of addresses. Moreover, there exist two types of edges from the source node to the target node, represents an edge where a wallet address initiates a transaction and represents an edge where a transaction outputs a certain wallet address. Note that the subscript A indicates that the node type is an address and T indicates the transaction node type. Therefore, the address–transaction heterogeneous graph not only contains the initiating and receiving addresses of a particular transaction but also demonstrates the connections between transactions and addresses during successive trading. Definition 2. TAT-metapath. The transaction–address–transaction metapath, denoted by , consists of one type of metapath , which is indicated by the blue line in the top-right corner of Figure 2. The TAT-metapath represents a way where two transaction records are connected through the same wallet address. The neighborhood set, denoted as
, contains the homogeneous neighborhood adjacent to the transaction node
t via the TAT-metapath. Therefore, the transaction neighborhood contains the set of downstream transactions associated with transaction
t. In the top-right corner of
Figure 2, the node set
, which is pictured in blue, includes the downstream adjacent transactions of the transaction node
based on the 1-hop TAT-metapath. Thus, we can sample the transaction subgraph connected by TAT-metapath, with the set denoted as
, where
m is the index of the transaction subgraph and
M is the total number of transaction subgraphs. There,
, which is a connected subgraph, represents the
m-th transaction subgraph.
It is important to note the edge direction when defining the TAT-metapath. When detecting illicit transactions, we continuously monitor the downstream transactions related to suspicious transactions through
, thus disregarding the reverse metapath. Meanwhile, we exclude the same-level neighbors under
because the downstream neighbors under
will cover the related nodes. As shown in
Figure 3, where
is indicated by the red dotted line in
Figure 3a, and
is considered as the same-level neighbor of
under that path in
Figure 3b, then both
and
will also be included in the downstream neighbors of
in
Figure 3c (perhaps after multiple hops). In this case, even if both
and
are illicit, excluding
does not lead to the disappearance of
, since they will appear in the transaction subgraph of the source illicit node. The experimental results about sampling by polytree in
Section 5.3 also demonstrate the rationality of that design.
Definition 3. ATA-metapath. The address–transaction–address metapath, denoted by in the bottom-right corner of Figure 2, is defined as a combination of two types of metapaths in blue line and in red line. The ATA-metapath represents a way for wallet addresses to be connected by jointly participating in a transaction. The neighborhood set, denoted by
, contains the homogeneous neighborhood adjacent to the address node
a via the ATA-metapath. Therefore, the address neighborhood contains the set of initiating wallet addresses and receiving wallet addresses associated with the target transaction
t. In the bottom-right corner of
Figure 2, for example, address
has 1-hop neighborhood set
, which is pictured in blue, based on the metapath
and
, which is pictured in red, based on
, which represents the associated wallet addresses for transaction
. Thus, based on the ATA-metapath, we sample the addresses associated with the transaction node
t into an associated address subgraph, denoted by
. And, the set of address subgraphs is denoted by
, where the index represents the target transaction node
t. Note that the total number of associated address subgraphs is
because each transaction node can generate an associated address subgraph.
Our objective is to find a suitable sampling method to obtain the subgraphs and from the global heterogeneous graph that facilitates distinguishing the patterns of money laundering and non-money laundering, and then learn a function to predict the probability that each subgraph is illicit. Given the transaction subgraph , each transaction subgraph is associated with a label , indicating the percentage of illicit nodes in each subgraph. Note that, while this paper focuses on the transaction subgraph classification task, the methods we propose entail learning a subgraph classifier , while N is the size of the subgraph.
4. Proposed Method
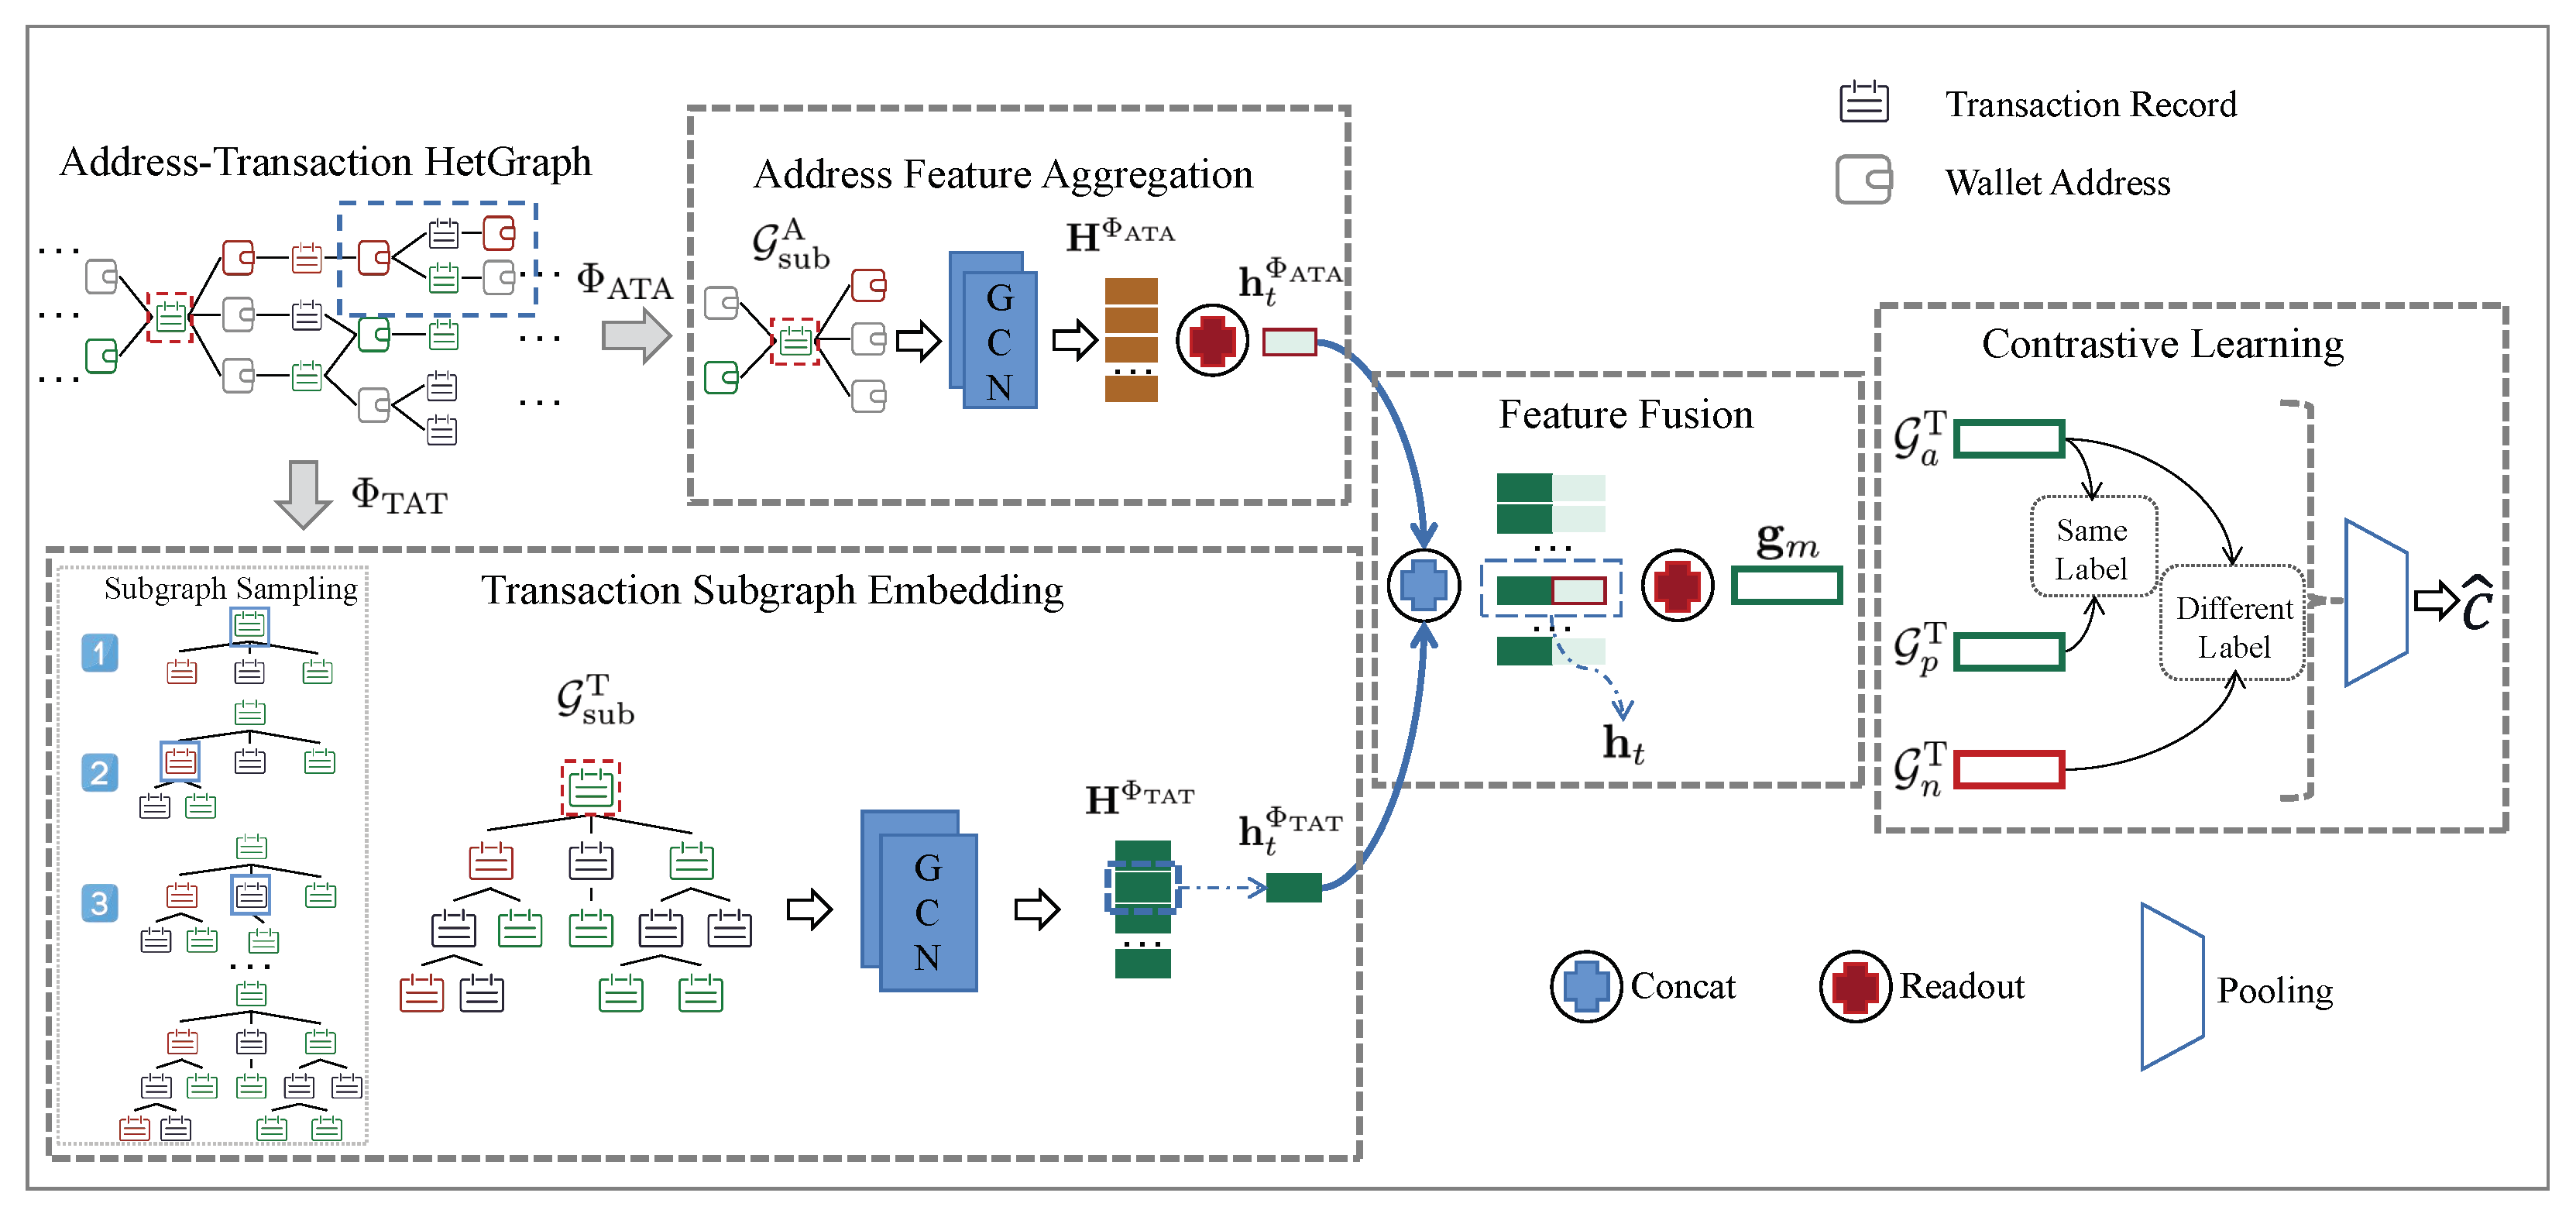
In the following section, we will provide a detailed explanation of our proposed model for Bitcoin money laundering group detection, named Bit-CHetG. As shown in
Figure 4, the model comprises four main components: transaction subgraph embedding, address feature aggregation, feature fusion, and contrastive learning. Leveraging the predefined address–transaction heterogeneous graph and metapaths, we first extract topology features for the transaction node and aggregated features for the address node from different metapaths. Specifically, for the TAT-metapath
, the TSE component conducts multi-step sampling on the transaction neighborhood set
to obtain tree-structured transaction subgraphs and then utilizes graph neural networks to derive the topological embedding representation. On the other hand, for the ATA-metapath
, the AFA component, which obtains the associated address representation, employs the graph neural networks to embed the associated address subgraphs of the target transaction node based on the neighbors
. Subsequently, the FF component aggregates these associated address representations into the topological embedding representation and obtains the fused features. Finally, to enhance the classification accuracy of the model, we introduce the CL component, a supervised contrastive learning approach, to learn and classify the fused features of transaction subgraphs from both the same and different classes.
4.1. Transaction Subgraph Embedding
In the Bitcoin network, there are evident topological differences between money laundering transaction subgraphs and non-money laundering transaction subgraphs, as extensively described in
Figure 5. To address this, we focus on the TAT-metapath in the Bitcoin address–transaction heterogeneous graph. Thus, we perform transaction subgraph sampling and then utilize GCN [
16] to obtain the topological embedding matrix of the transaction subgraph, denoted by
.
4.1.1. Transaction Subgraph Sampling
In order to summarize the structural commonalities of transaction subgraphs with different sizes, we adopt an n-hop sampling method, where n is the number of hops, to generate the licit and illicit subgraphs, respectively.
When generating the illicit subgraph, we start with an illicit transaction node and expand it by n hops. If all terminal nodes are licit, the process stops; otherwise, continue expanding by n hops.
When generating a licit subgraph, we initiate the process from a licit transaction node and stop the extension after n hops. However, if the generated subgraph contains any illicit nodes, it is considered to be illicit. This condition ensures that the generated licit subgraph maintains its legality.
The above
n-hop sampling method yields a tree structure that is similar to the flow of money during cryptocurrency trading. And, the typical topology of the subgraphs is displayed in
Figure 6. The relevant conclusions show that the sampling method with a tree structure helps distinguish the transaction patterns of money laundering groups.
For the subgraph sampling process of the Bit-CHetG algorithm, we fix the size of each transaction subgraph as
N, while the optimal value of
N is determined through parametric experiments in
Section 5.4. In Bit-CHetG, we adopt a breadth-first random walk approach to sample transaction nodes from the address–transaction heterogeneous graph, generating a series of transaction subgraphs
. The generated subgraph only contains transaction nodes and is tree-structured.
Step 1: Given a target transaction node
t as the parent node
p, add the 1-hop neighborhood set
of node
t based on the TAT-metapath into the node set
of the subgraph
. The edges between node
t and the nodes in the neighborhood set
are added to the edge set
of the subgraph. As shown by the subgraph sampling process framed by the dashed line in the bottom-left corner of
Figure 4, the first generated subgraph contains the parent node framed in blue, as well as 1-hop neighbor nodes.
Step 2: Randomly select a node from the 1-hop neighborhood set
with a certain probability and extend the subgraph according to Step 1 with this node as the new parent node. This process generates the second subgraph and third subgraph shown in the subgraph sampling dashed line of
Figure 4. If all the neighbor nodes have been traversed, continue to extend to the next level until the number of nodes in the node-set
reaches a fixed number
N.
During the subgraph sampling process, we use the breadth-first algorithm to sample downstream nodes from the parent node to ensure that the transaction subgraphs sampled by the TAT-metapath exhibit a tree-like structure. Through this sampling process, we can generate highly correlated subgraphs to better capture the relationships between transaction nodes.
Figure 4 in the bottom-left corner shows the sampling process of a transaction subgraph.
4.1.2. Topology Feature Embedding
Based on the transaction subgraph
, which has an adjacency matrix
and a feature matrix
, we proceed with GCN to extract high-order subgraph representation. The forward propagation process is as follows:
where
is the activation function,
is the normalized adjacency matrix,
is the adjacency matrix with added self-connections,
represents the degree of the
i-th node,
is the weight matrix of the (
l − 1)-th layer,
is the hidden layer representation matrix of the (
l − 1)-th layer, and the initial feature matrix
.
Finally, we consider the feature matrix of the last layer as the final graph embedding representation of the transaction subgraph:
where
,
L is the number of layers of the graph neural network, and
is the feature dimension of the last layer.
Note that is the topological embedding the representation of the transaction node t, which is the node feature vector obtained from the final layer of the graph neural network.
4.2. Address Feature Aggregation
In the Bitcoin network, each transaction may involve multiple input and output addresses. To capture the relationships between the target transaction and its associated addresses, we focus on the ATA-metapath predefined in the Bitcoin heterogeneous graph. The purpose of this section is to learn the associated address representation, denoted by , of the target transaction nodes.
As illustrated by the blue box in the address–transaction heterogeneous graph in
Figure 4, one wallet may connect to multiple transactions. Thus, the set of one-hop neighbors generated through the ATA-metapath, denoted by
, may include wallet addresses associated with multiple transaction records. When constructing the associated address subgraph
, we are only interested in the neighbor set relevant to the target transaction node
t, which is a subset of
. The process of constructing the associated transaction subgraph can be simplified as follows:
Step1: Identify the target node. Firstly, designate
as the target transaction node for the AFA module, and add
to the node set
, highlighted by the red dashed box in
Figure 4.
Step2: Determine the edge set and node set. Traverse the node and edge sets in the address–transaction heterogeneous graph. Add all one-hop neighbor address nodes of the target node to the node set . These address nodes are connected through the ATA-metapath. The edge set consists of edges connecting the target node and the address nodes, without distinguishing the direction of edges.
After obtaining the associated address subgraph
, we use a GCN model similar to
Section 4.1.2 for feature mapping. The layer update formula for heterogeneous graph convolutional networks can be expressed as follows, where
is the node representation matrix of node type
i in layer
:
where
is the node representation matrix of node type
i in layer
l,
is the set of neighbor node types of node type
i,
is the adjacency matrix from node type
j to node type
i,
is the degree matrix of node type
i,
and
are learnable weight matrices for information transfer from node type
j to node type
i,
is the feature matrix of node type
i, and
is the activation function.
Thus, the embedding matrix of the associated address subgraph, denoted by
, is represented by the feature matrix of the last layer:
where
L is the number of layers of the graph neural network.
Since our goal is to obtain the associated address representation of the target transaction node
t, denoted by
in
Figure 4, we use average pooling [
60] as the readout function to generate the subgraph-level representations. It is formulated as follows:
where
K is the size of the address subgraph,
, and
is the dimension of the associated address representation.
4.3. Feature Fusion
For each transaction subgraph
, we obtained the topological embedding representation
of the individual transaction node
t encoded by GCN, as well as the associated addresses representation
for the target transaction node
t. We then concatenate these two representations to obtain a fused feature representation for the individual transaction node
t:
where
is the weight matrix, to align the two represented dimensions.
Next, we use a readout function such as average pooling to obtain the graph-level fused feature vector for each transaction subgraph, denoted by
, where the subscript
m indicates the
m-th subgraph:
Finally, we use a fully connected (FC) layer followed by a softmax layer to obtain the predicted scores for the illicit rate of each transaction subgraph:
For the
m-th transaction subgraph
represents the ground truth label for its illicit rate. The prediction loss function is then defined as:
4.4. Contrastive Learning
In the last section, we introduce contrastive learning and construct a new loss function as the optimization objective for illicit transaction subgraph detection. The goal is to maximize the consistency among positive samples while minimizing the similarity with negative samples, given the provided labels. Specifically, for a given subgraph
considered as an anchor, we treat subgraphs with the same label as positive trees
, and those with different labels as negative trees
. Let
be an illicit transaction subgraph, and we aim to increase the similarity between its feature representation vector and those of other illicit transaction subgraphs in high-dimensional space while decreasing the similarity with the feature representations of licit transaction subgraphs. This helps the model learn time-invariant representations. This is a form of supervised contrastive learning, where we bring similar instances closer and push dissimilar instances apart, as shown in
Figure 7. The final loss function consists of two components, the prediction loss, and the contrastive loss:
where
is the hyperparameter and the contrastive loss
is calculated as follows:
During the traversal process of the contrastive loss, the index
m represents the anchor. Index
p corresponds to positive samples with the same label as the anchor, which forms the positive index set
. Index
n corresponds to negative samples with different labels from the anchor
m, which forms the negative index set
. The function
represents the exponential function, and
is a scalar temperature parameter. The function
represents the cosine similarity function:
In addition, data augmentation techniques are applied to simulate noise during the transaction process, such as edge perturbation and node reconnection, as shown by the dotted line of the anchor in
Figure 7. For example, we introduce erroneous transactions or intentional interference transactions initiated by money launderers to hide their activities. This data augmentation process helps the model be more robust and better generalizes to real-world scenarios where noise and anomalies are present.
5. Experiment
In this section, to validate the effectiveness of the algorithm, we first introduce the selected dataset and comparison models. We then evaluate the proposed Bit-CHetG method by comparing it with the comparison models. The results demonstrate that there is a significant improvement in the micro F1-score by more than 5%.
Additionally, in order to explore the reasons for the effectiveness of the algorithm, we first elucidate that the choice of tree structure as a subgraph can effectively distinguish the topological patterns of cryptocurrency illicit groups. Then, we verify the enhancement of the results by the AFA module and the CL module, i.e., the introduction of contrastive learning and wallet address information.
Simultaneously, we conduct experiments to determine the optimal parameters, such as the layers of GCN and the size of the sampling subgraph.
5.1. Experimental Setup
5.1.1. Datasets
Two datasets were selected for this paper, the Elliptic dataset [
20] (a publicly available benchmark) and the BlockSec dataset (a heterogeneous dataset we collected). The statistics of the datasets are shown in
Table 2. The main difference between these two datasets is that the BlockSec dataset contains transaction record information and wallet address information, while the Elliptic dataset contains only transaction record information.
Elliptic dataset: Provided by Elliptic [
47], this is the largest labeled Bitcoin transaction dataset. The Elliptic dataset [
20] comprises 203,769 transaction nodes and 234,355 transaction payment edges (i.e., transaction inputs and outputs). Within the Elliptic dataset, 21% of nodes are labeled as licit, while only 2% are marked as illicit. These nodes include 166 features, with the initial 94 features encompassing local transaction information, including
time steps, transaction fees, and input or output amounts. The remaining 72 features are aggregated features, consisting of transaction information aggregated from neighboring nodes in a 1-hop graph, such as
standard deviation, minimum, maximum, and correlation coefficients.
BlockSec dataset: Provided by BlockSec [
61]. This dataset includes wallet address information and the transaction record information of Bitcoin for April 2023. The raw data include 16,674,890 transaction records involving 100,061 wallet addresses, with 1442 addresses labeled as illicit. The transaction record features include fees, input amounts, and output amounts. The wallet address features include
the total number of input and output transactions, the amount of the transactions, and
more information related to the given address.
Next, we conducted subgraph sampling on both datasets, using the subgraph illicit rates as the label, which represents the proportion of illicit nodes in each sampling subgraph. The processing procedure for the two datasets is as follows: Since the BlockSec dataset is a heterogeneous graph, it undergoes the transaction subgraph sampling steps in
Section 4.1.1 and the associated address subgraph sampling steps in
Section 4.2. In contrast, the Elliptic dataset is a homogeneous graph, and we omit the sampling of the associated address subgraph. And, the transaction subgraph sampling of the Elliptic dataset employs a similar breadth-first algorithm for downstream expansion. However, the generation of the 1-hop neighborhood set is based on
instead of the TAT-metapath. As shown in
Table 2, the size of the transaction subgraph is fixed at 10 for the Elliptic dataset and 5 for the BlockSec dataset based on the experiments in
Section 5.2 and
Section 5.4. An example of the typical subgraphs of both datasets can be found in
Figure 5. During the training of these two datasets, the BlockSec dataset follows the four steps in
Figure 4, while the Elliptic dataset only undergoes topology feature embedding and contrastive learning.
5.1.2. Comparison Algorithms
We utilize the following widely used graph-based methods, including heterogeneous and homogeneous graphs, as comparative methods for Bitcoin money laundering detection to emphasize the effectiveness of our proposed method. It is worth noting that some node-level classification algorithms are extended to become graph-level classification methods through a unified readout function [
62].
For the Elliptic dataset, which only contains transaction record features and does not include wallet address features, we choose the homogeneous algorithm as the comparison method.
Random forest [
28]: A supervised learning method used for ensemble learning enhances the predictive ability by combining results from multiple decision trees. In previous experiments focused on identifying illicit nodes in the Elliptic dataset, random forest demonstrated an outstanding performance when compared to the graph neural network algorithm.
GCN [
16]: The fundamental graph neural network, which can extract topological features among transaction nodes. Here, we utilize GCN to obtain node representations before proceeding with subgraph classification.
Inspection-L [
29]: The first application of a self-supervised GNN to the Bitcoin money laundering detection problem, which has a self-supervised Deep Graph Infomax framework combined with a supervised learning algorithm, random forest.
SubGNN [
30]: It is a subgraph-based neural network that proposes three property-aware channels that capture position, neighborhood, and structural information to propagate the information at the subgraph layer.
Tsgn [
31]: It introduces a network mapping strategy from node to edge to fully capture the potential topological information of the subgraph which cannot be easily obtained from raw transaction networks, benefiting the subsequent fraud detection algorithms in cryptocurrency.
For the BlockSec dataset, which includes both transaction record features and wallet address features, we selected the heterogeneous network algorithm for the comparative experiment.
HAN [
32]: It is designed for heterogeneous graphs, which proposes the usage of a graph neural network with hierarchical attention to evaluating node weights and metapaths. Additionally, HAN is a semi-supervised heterogeneous method.
MAGNN [
33]: It is a heterogeneous graph embedding model that utilizes metapath-guided aggregation to acquire meaningful node representations by considering both structural relationships and attribute information.
Our experimental environment is as follows: the operating system is Ubuntu 18.04, the programming language is Python 3.8.13, the framework is PyTorch 1.4.0, the CPU is Intel Core i7-6800K, and the GPU is GeForce GTX 1080, which is designed by NVIDIA, Santa Clara, CA, USA.
The experimental parameters are set as follows: The epoch is set to 200, iterations are set to 100, and early stopping [
63] is applied when loss stops decreasing for 10 epochs. The number of layers in GCN is set to 2, and the feature dimensions of the hidden and output layers are both set to 64. The length of the metapath is set to 1 to ensure the generation of one-hop neighbors. Stochastic gradient descent is used to update the parameters of Bit-CHetG, and our model is optimized using the Adam optimizer [
64]. We explore learning rates ranging from 1 × 10
−4 to 5 × 10
−3. For the dropout rate, we experiment with values from 0.1 to 0.5 in increments of 0.05, while hyperparameters are tuned between 0.1 and 0.9 in increments of 0.05.
Following the configuration of [
20], the initial 35 graphs of the Elliptic dataset are designated as the training set, and the remaining graphs are reserved for testing. The BlockSec dataset is randomly divided into training and testing sets in a ratio of 7:3. In our dataset, the distribution of labels (i.e., subgraph illicit rates) is unbalanced, so we choose micro precision (Micro-Prec.), micro-recall (Micro-Rec.), and micro F1-score (Micro-F1) as the evaluation metrics for subgraph multiclassification problems. To ensure a fair comparison, we use the base implementation for all models and hyperparameter sweeps as in our Bit-CHetG approach. Additionally, to achieve graph-level classification, we use average pooling as a readout function [
62] for methods [
16,
28,
29,
32,
33]. In order to extend the homogeneous benchmarking approach to heterogeneous graphs, we fuse the original transaction features and the associated address features to obtain aggregated features, which are used as input features for the method [
16,
28,
29,
30,
31].
5.2. Mining Tree-Structured Subgraphs
In this part, we show that the results observed from the tree-structure subgraphs and find that the topological patterns can be effectively distinguished between money laundering and non-money laundering.
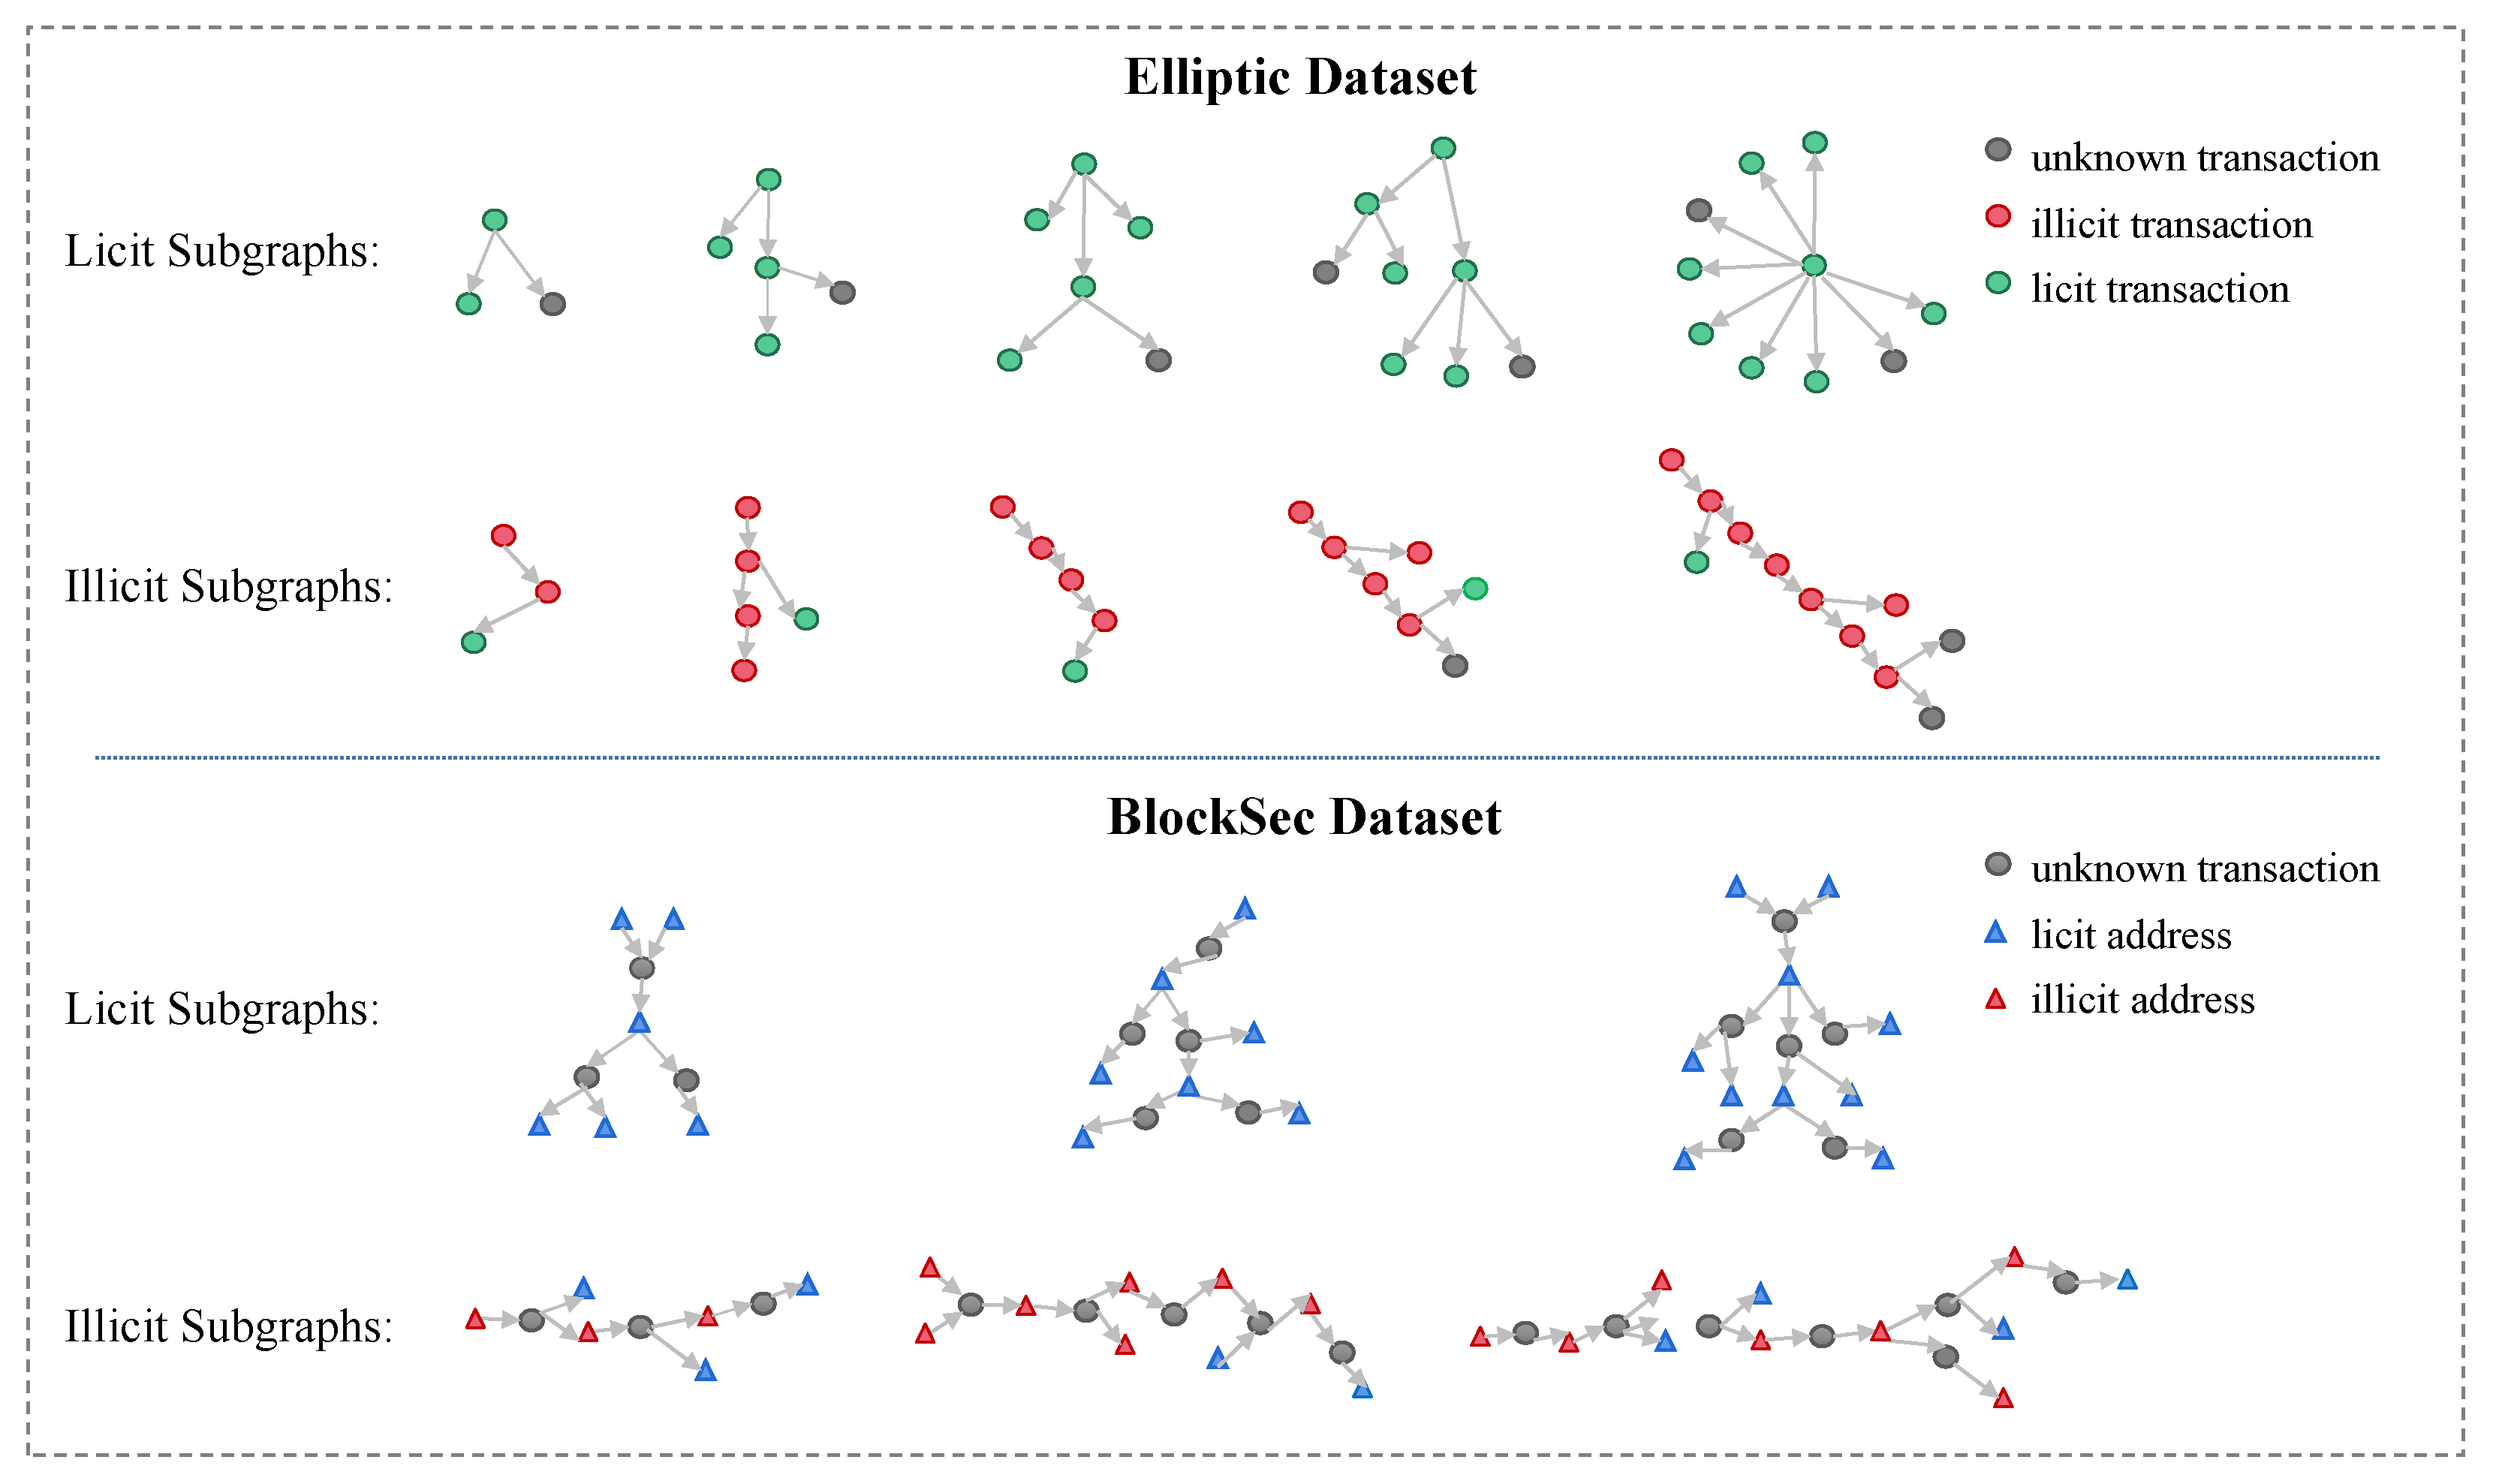
According to the
n-hop sampling method proposed in
Section 4.1.1,
Figure 5 illustrates the typical topology of the tree-structure subgraphs of illicit and licit transactions, respectively, where the size of the subgraph increases from left to right. Thus, we observed that:
There is a significant difference between the illicit and licit subgraphs. The distribution of licit transaction trees is more centralized, similar to a network-like structure, while the distribution of illicit transaction trees is more dispersed, similar to a chain-like structure. This suggests that illicit and licit transactions exhibit different topologies and that the tree-like subgraph generation method can effectively distinguish between money laundering and non-money laundering transaction patterns.
In the set of illicit subgraphs, there are continuous money laundering chains in the transaction network. Therefore, identifying individual illicit nodes can be of great help in the subsequent tracking of illicit groups.
Based on this observation, our algorithm focuses on the pattern differences between the subgraphs and chooses a tree-like structure as a typical subgraph structure.
Furthermore, we counted the changes in the size of the transaction subgraphs
N when the number of sampling hops
n is varied. As shown in
Figure 6, the average size of transaction subgraphs in the BlockSec dataset (only transaction nodes are counted) is less than that in the Elliptic dataset for the same number of sampling hops. While the collection time is not the same for the two datasets, this phenomenon may be related to the rapid growth of mixing services [
65] in recent years, and some users may use Bitcoin mixing services to enhance the privacy of their transactions. These services mix multiple transactions, making the transaction path on the chain more complex. Another possible reason is that, out of a sense of security, some users may periodically change the address they use to receive Bitcoin. This behavior can lead to truncated transaction paths in the graph because the new address is no longer associated with the previous address. This indicates that the optimal subgraph sampling size may change as the cryptocurrency ecosystem evolves. Combined with the parametric analysis of
N performed in
Section 5.4, we finally fix
n to 5. For the following experiments in
Section 5.3,
N is fixed to 5 for the BlockSec dataset and 10 for the Elliptic dataset.
5.3. Experimental Results
In this part, we give THE experimental results and explain why our Bit-CHetG outperforms the comparison algorithm for four reasons.
For the elliptical dataset, we constructed 24,533 tree-structured subgraphs, starting with the labeled nodes in the original dataset. The illicit rate was then used as the label for each subgraph. For the BlockSec dataset, 16,583 subgraphs were constructed.
Table 3 and
Table 4 present the Micro-Prec., Micro-Rec., and Micro-F1 of the compared methods on both datasets. The bolded parts represent the best results. The results show that the proposed Bit-CHetG model outperforms all comparison methods, highlighting the advantages of introducing heterogeneous networks and contrastive learning in the task of Bitcoin money laundering group detection.
As expected, the random forest approach based on primitive features yields the worst results, mainly because it ignores the topology of the transaction network since there are intricate feature interactions. The GNN-based approach improves on this aspect. The results confirm that money laundering group detection using GCN is effective, which emphasizes the reason why we chose GCN as the base encoder for the Bit-CHetG model. Inspection-L follows the framework of DGI [
66] and is the first algorithm to apply a self-supervised GNN to the Bitcoin money laundering detection problem. SubGNN is a well-known subgraph detection algorithm and is a state-of-the-art benchmark to validate the superiority of the proposed Bit-CHetG model. It reasons about the topological properties of a given subgraph but lacks a specially designed subgraph sampling algorithm. Tsgn focuses on the subgraph pattern recognition of cryptocurrencies, but the designed Transaction SubGraph Network only collects the 1-hop neighborhood information, which works well in cryptocurrency phishing account identification. However, when applied to cryptocurrency money laundering detection, it is not as effective as our Bit-CHetG algorithm. Based on the results of
Table 3, the proposed Bit-CHetG outperforms all the comparison methods, improving the Micro-F1 on the Elliptic dataset by 12%, 7%, 6%, and 5% compared to GCN, Inspection-L, SubGNN, and Tsgn, respectively.
The BlockSec dataset employs two commonly used heterogeneous network models as comparison algorithms, i.e., HAN and MAGNN. In addition to this, by fusing address and transaction features, we apply the homogeneous subgraph algorithms SubGNN and Tsgn to the BlockSec dataset as well. Compared with the basic GCN method, HAN and MAGNN have improved the performance on the BlockSec dataset considering the heterogeneity of the address–transaction graph. In particular, the performance improvement is more significant for MAGNN by employing self-supervised tasks. However, compared to our Bit-CHetG algorithm, HAN and MAGNN do not design specialized metapaths for our Bitcoin money laundering group detection task. As the result in
Table 4, the Micro-F1 of Bit-CHetG proposed in this paper improves 10% and 7% compared to HAN as well as MAGNN, and 9% and 7% compared to SubGNN as well as Tsgn, respectively.
Meanwhile, the bottom of
Table 3 and
Table 4 shows additional experiments to verify the performance of Bit-CHetG, where Bit-CHetG (Reg + Cl + Aug) is the complete algorithm including regression loss, contrastive loss, and graph augmentation, Bit-CHetG (Reg + Cl) removes data augmentation, and Bit-CHetG (Reg) removes data augmentation and contrastive loss. Bit-CHetG (polytree) replaces tree structure sampling with polytree sampling, which may contain multiple parent nodes. The Bit-CHetG model proposed in this paper performs well in both homogeneous graphs containing only transaction information and heterogeneous graphs containing both transaction and address information. The advantages of Bit-CHetG can be attributed to four main reasons:
Bit-CHetG selects the appropriate subgraph sampling structure. As shown in
Section 5.2, we have chosen the tree structure as the detection unit. The results of Bit-CHetG (polytree) in
Table 3 and
Table 4 show that the polytree structure as subgraph is inferior to the tree structure. This is because the polytree contains more interaction information which leads to interference in recognizing illicit and licit patterns.
Bit-CHetG introduces a contrastive loss in addition to the original regression loss. As shown in the results of Bit-CHetG (Reg) as well as Bit-CHetG (Reg + Cl + Aug) in
Table 3 and
Table 4, contrastive learning and graph augmentation help the model better learn the commonalities between the same samples and the differences between different samples and thus generates high-quality feature representations.
Bit-CHetG employs a flexible data augmentation strategy. By randomly adding or removing edges, we can simulate erroneous transactions or transactions deliberately interfered with by money launderers to conceal their activities. By simulating the noise during transactions through data augmentation, the results of Bit-CHetG (Reg + Cl + Aug) in
Table 3 and
Table 4 are more robust than those of Bit-CHetG (Reg + Cl).
Bit-CHetG purposefully designed Metapaths. For UTXO, the smallest trading unit of Bitcoin, we design ATA-Metapath and TAT-Metapath to directly detect money laundering groups. Compared with the above comparison algorithms that acquire node characterization before applying it to downstream tasks, our approach significantly improves the effectiveness.
5.4. Ablation Study
In this part, we first validate the effectiveness of the AFA module and the CL module, and then conduct experiments to select the optimal parameters, one is the optimal number of layers of the graph neural network, and the other is the optimal sample size of the subgraph.
To validate the effectiveness of various modules within Bit-CHetG, we conducted comparisons with the following variants:
Bit-CHetG_NA: This variant only employs the transaction record information and disregards the account address information. The AFA component is subjected to masking, resulting in the degradation of the heterogeneous graph to a homogeneous graph.
Bit-CHetG_NC: In this variant, the contrastive learning module is removed, rendering the model unable to capture distinctions between instances of different classes and diminishing the quality of representations.
Experimental results are presented in
Table 5. The observations are as follows:
The introduction of contrastive learning in the Bit-CHetG model yields significant improvements over Bit-CHetG_NC. Specifically, Micro-Prec., Micro-Rec., and Micro-F1 increased by 5.8%, 2.5%, and 4.3%, respectively, highlighting the beneficial impact of contrastive learning.
In comparison to Bit-CHetG, the Micro-Prec., Micro-Rec., and Micro-F1 of Bit-CHetG_NA decreased by 3.2%, 1.4%, and 2.3%, respectively. When contrastive learning is directly applied to the transaction graph without auxiliary account information, the model achieves only moderate predictive accuracy.
Table 5.
Result of the ablation study.
Table 5.
Result of the ablation study.
| Methods | Micro-Prec. | Micro-Rec. | Micro-F1 |
|---|
| Bit-CHetG | 0.825 1 | 0.760 1 | 0.815 1 |
| Bit-CHetG_NC | 0.767 | 0.735 | 0.772 |
| Bit-CHetG_NA | 0.793 | 0.746 | 0.792 |
These results highlight the importance of introducing different modules into the Bit-CHetG model to improve the prediction performance. Meanwhile,
Figure 8 shows the confusion matrix about predicted and true labels from the baseline GNN model and the Bit-CHetG model in three different settings. Bit-CHetG shows more concentration along the main diagonal compared to Bit-CHetG_NA and Bit-CHetG_NC. This concentration indicates higher accuracy. In the money laundering group detection task, more attention should be paid to the detection of subgraphs with high illicit rates. It is worth noting that our Bit-CHetG has a darker heatmap color in the lower right corner of the confusion matrix compared to the simple GNN model, which indicates a more accurate identification of subgraphs with high illicit rates.
Next, we performed some optimal parameter experiments. Firstly, The effect of different GCN layers on the Micro-Prec. was first evaluated.
Table 6 summarizes the accuracy results on the BlockSec dataset, where
denotes the number of GCN layers in the TSE component and
denotes the number of GCN layers in the AFA component. Thus, the optimal setting for displaying the number of GCN layers for both components is 2.
Furthermore, we consider the optimal size of the transaction subgraph for sampling.
Figure 9 depicts the variation of weighted accuracy with the size of the transaction subgraph (
N) for both the BlockSec dataset and the Elliptic dataset. It can be seen that when
N is set to 5 for the BlockSec dataset and 10 for the Elliptic dataset, both precision and stability are at their best.
6. Discussion
As of 9 August 2022, the size of the entire transaction record of Bitcoin, i.e., the blockchain, is 420 GB, with an average growth rate of 129% [
29]. The rule-based manual money laundering detection methods used in the industry are time-consuming and resource-intensive, and there is an urgent need for more efficient methods to detect Bitcoin money laundering. Our algorithm aims to predict the illicit rate of subgraphs, significantly reducing computational costs. Our algorithm will play a crucial role in screening the vast data flow of cryptocurrencies, and subgraphs predicted to have higher illicit rates will be added to a watchlist.
Our proposed algorithm performs exceptionally well in experiments. As illustrated in
Section 5.2, the patterns discovered can effectively distinguish money laundering groups from non-money laundering groups. The transparency of the blockchain and the generalization ability of neural networks ensure the practical application of our algorithm. Firstly, cryptocurrency transaction information is recorded in real-time on the blockchain, with public transparency. We can obtain the initiating wallet address ID, receiving wallet address ID, and transaction record ID for a transaction on public platforms (e.g., Blockchain.com [
67]). This forms the basis for further mining the original features of IDs and constructing the address–transaction heterogeneous graph, as detailed in
Section 3. Secondly, in the paper, we utilized two labeled datasets to train the proposed deep learning network model, Bit-CHetG. The extensive time span covered by these datasets ensures that the model learns optimal parameters with high generalization ability. In practical applications, when dealing with unlabeled transaction graphs, after the subgraphs are sampled, we can directly calculate the illicit rate of the transaction subgraph using those retained model parameters.
The money laundering group detection paradigm based on subgraphs, once applied in reality, will significantly reduce the complexity of cryptocurrency AML. This regulation of cryptocurrency money laundering will further maintain the stability of the global financial system, resist criminal activities, and enhance international security.


