Article

Information Theory Quantifiers in Cryptocurrency Time Series Analysis

by
Micaela Suriano
1,2,*,
Leonidas Facundo Caram
2,
Cesar Caiafa
3,
Hernán Daniel Merlino
4 and
Osvaldo Anibal Rosso
5,6
1
Departamento de Hidráulica, Facultad de Ingeniería, Universidad de Buenos Aires, Av. Las Heras 2214, Buenos Aires C1127AAR, Argentina
2
Laboratorio de Redes y Sistemas Móviles, Departamento de Electrónica, Facultad de Ingeniería, Universidad de Buenos Aires, Buenos Aires C1063ACV, Argentina
3
Instituto Argentino de Radioastronomía-CCT La Plata, CONICET/CIC-PBA/UNLP, Camino Gral. Belgrano Km 40, Berazategui B1894XAB, Argentina
4
Grupo IngenIA, Facultad de Ingeniería, Universidad de Buenos Aires, Buenos Aires C1063ACV, Argentina
5
Instituto de Física (IFLP), Universidad Nacional de La Plata, CONICET, La Plata B1900AJJ, Argentina
6
Instituto de Física, Universidade Federal de Alagoas (UFAL), Maceió 57072-970, Brazil
*
Author to whom correspondence should be addressed.
Entropy 2025, 27(4), 450; https://doi.org/10.3390/e27040450
Submission received: 16 March 2025 / Revised: 19 April 2025 / Accepted: 19 April 2025 / Published: 21 April 2025

Abstract

:
This paper investigates the temporal evolution of cryptocurrency time series using information measures such as complexity, entropy, and Fisher information. The main objective is to differentiate between various levels of randomness and chaos. The methodology was applied to 176 daily closing price time series of different cryptocurrencies, from October 2015 to October 2024, with more than 30 days of data and not completely null. Complexity–entropy causality plane (CECP) analysis reveals that daily cryptocurrency series with lengths of two years or less exhibit chaotic behavior, while those longer than two years display stochastic behavior. Most longer series resemble colored noise, with the parameter k varying between 0 and 2. Additionally, Natural Language Processing (NLP) analysis identified the most relevant terms in each white paper, facilitating a clustering method that resulted in four distinct clusters. However, no significant characteristics were found across these clusters in terms of the dynamics of the time series. This finding challenges the assumption that project narratives dictate market behavior. For this reason, investment recommendations should prioritize real-time informational metrics over whitepaper content.

1. Introduction

The relationship between complex systems and cryptocurrencies has been a topic that has captured the interest of the scientific community specializing in cryptocurrencies in recent years. This interest was further amplified by the COVID-19 pandemic, as [1] found an increase in volatility during this period. This is hypothetically due to the time that more people were dedicated to trading cryptocurrencies, especially Bitcoin, as more individuals engaged in trading during lockdowns.
This issue was addressed through the analysis of entropy by [2], concluding that the pandemic altered the volatility inherent in cryptocurrency markets. A study by [3] analyzed the increase in entropy in periods of turbulence, such as during the COVID-19 pandemic when the entire market showed increased volatility, rather than isolated cryptocurrencies. Paradoxically [4] observed volatility consolidation in mature cryptocurrencies, suggesting market maturation phases where entropy metrics require multi-scale approaches.
In [5], the authors employed the Fisher information measure alongside permutation entropy to assess the evolving informational efficiency and price disorder dynamics of five major cryptocurrencies across pre- and intra-pandemic periods, offering critical insights into their maturity and predictability for liquidity risk diversification strategies.
Studies have identified persistent chaos patterns in these markets, proposing alternative methods for volatility analysis [6]. Incorporating sentiment analysis improves volatility analysis in chaotic markets [7]. The unpredictability of cryptocurrency markets reflects a chaotic system with high entropy [8].
The authors in [9] examined how entropy, as a variable in the analysis of network decentralization, contributes to market volatility. The intrinsic volatility of cryptocurrency markets renders traditional volatility evaluation methods inadequate [10]. Research on market risk using high-frequency entropy concluded that this method is a good predictor of Bitcoin’s value risk [11]. Entropy is also applied as a measure of uncertainty in portfolio management [12], showing that portfolio diversification is a reasonable practice for reducing return uncertainty. The complexity–entropy causality plane (CEPC) analysis method has been used to distinguish stages of stock market development [13] and to analyze algorithmic behavior in cryptocurrencies [14], serving as a precedent for complexity-based approaches in this field.
Previous studies have highlighted the utility of clustering in cryptocurrency analysis, such as the work of [15], which identified temporal efficiency patterns using permutation entropy and statistical complexity. Our approach extends this paradigm by applying clustering techniques to whitepaper analysis, offering a complementary perspective focused on project fundamentals rather than market metrics.
This paper analyzes the temporal evolution of different cryptocurrency time series, utilizing information quantifiers to map the complexity–entropy causality plane (CECP) and describe system dynamics. By combining global statistical complexity and local Fisher information measures, we classify clusters based on whitepaper attributes, which group projects according to their declared rules and governance structures. These clusters are then evaluated using information theoretic metrics to identify links between project frameworks and statistical market behavior.
This paper is structured as follows:
Materials and Methods: description of applied methods, equations, data sources, and time series characteristics;
Results and Discussion: interpretation of outcomes and analysis;
Conclusions: summary of key findings.

2. Materials and Methods

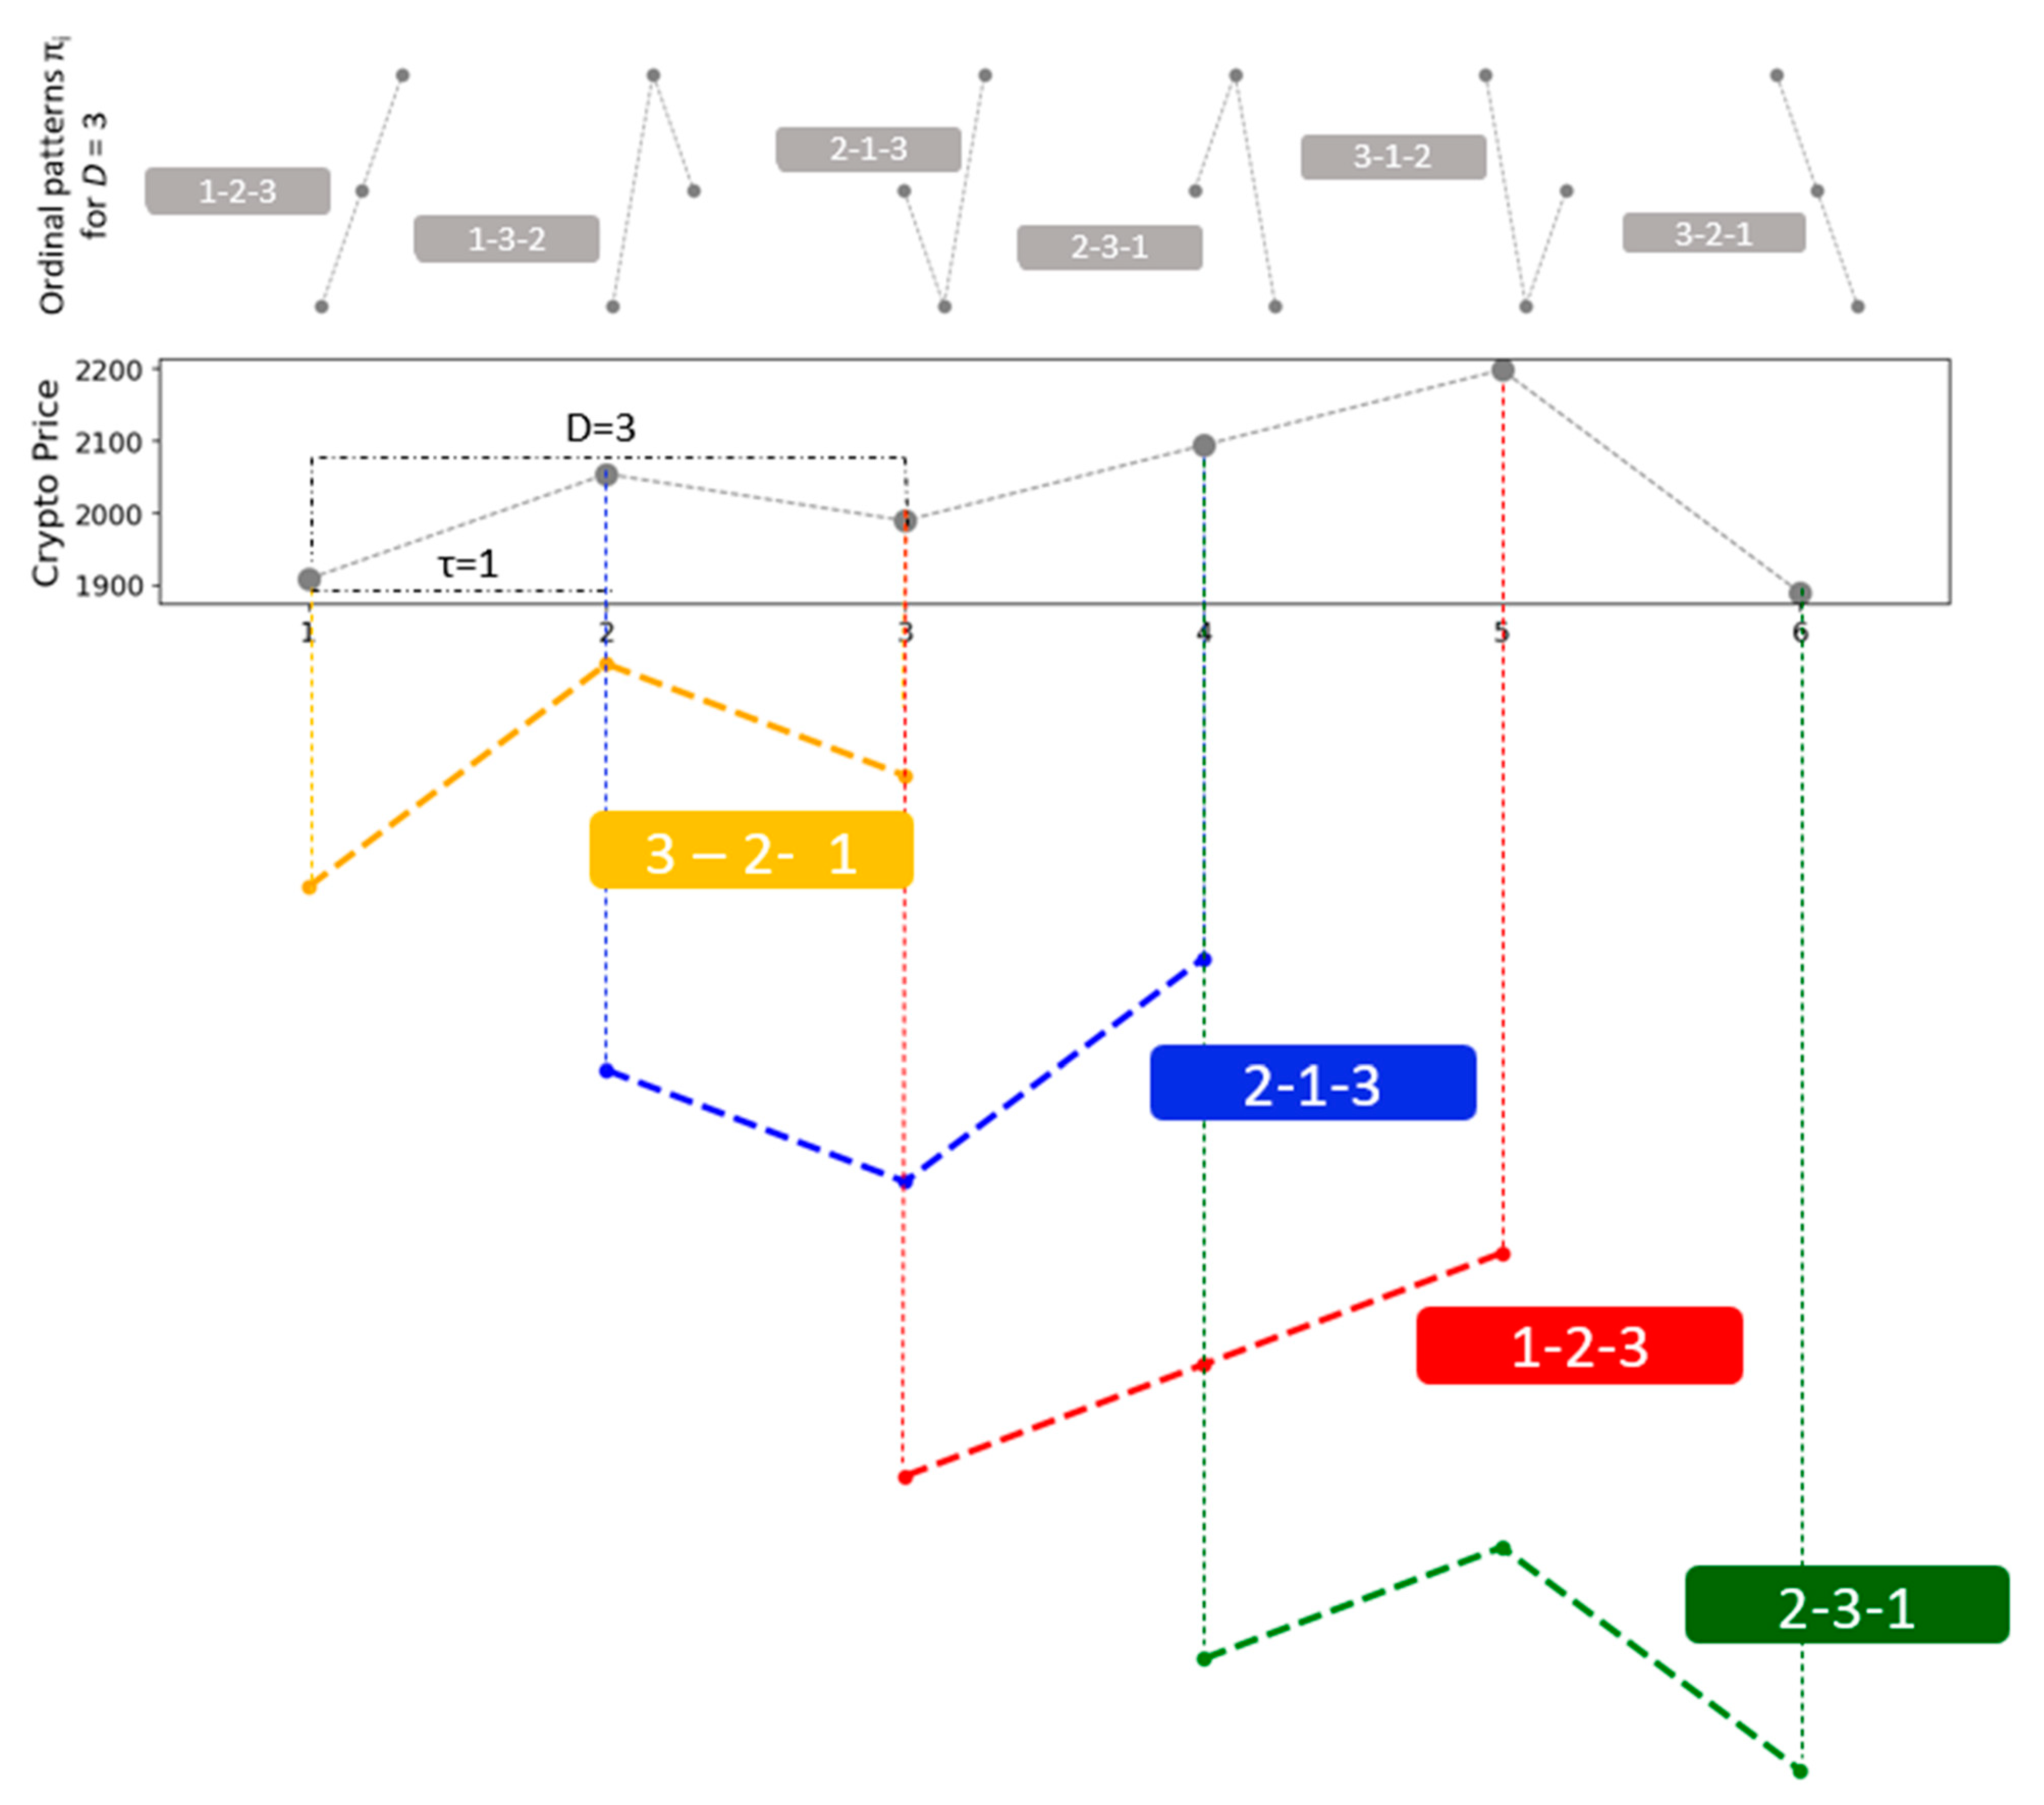
2.1. Ordinal Patterns

Cryptocurrencies, like many other economic phenomena, produce time series observations. To describe the nature of the processes, it is necessary to determine the appropriate probability density function associated with the analyzed time series. For this analysis, the probability distribution function P can be determined using the method of ordinal patterns developed by Bandt and Pompe (2002) [16]. This method replaces the values that appear in the time series with their corresponding range sequence. This procedure considers the temporal causality within the dynamics of the process.
For a given time series {xt: t = 1, …, N}, the delay time τ (τ ϵ ℕ), an embedding dimension D ≥ 2 (D ϵ ℕ), and the D-ordinal pattern are defined by
s X s D 1 τ , X s D 2 τ , , X s τ , X s
A D-dimensional vector is assigned for every time instant s, and it is determined from the evaluation of the time series in the s − (D − 1) τ, , s − τ, s instants. The D-ordinal patterns related to the instant s are referred to as the permutation π = {r0, r1, …, rD−1} of {0, 1, …, D − 1} described by
x s r 0 τ x s r 1 τ x s r D 2 τ x s r D 1 τ .
To find a unique result, r i < r i 1   if   x s r i τ < x s r i 1 τ is considered and equal consecutive values are not usual. The vector defined by Equation (2) becomes the unique symbol π.
Figure 1 illustrates the determination of the permutations πi for D = 3 with a time lag τ = 1. At the top of the figure the possible ordinal patterns πi for D = 3 are presented, while the analysis of a cryptocurrency time series with τ = 1 is displayed at the bottom. For each possible permutation πi derived from the order D!, the associated relative frequencies can be calculated by counting how many times each sequence appears in the series and dividing that number by the total number of sequences. This process yields the probability distribution of the ordinal patterns for the given time series.
The selection of the value of D should correspond to the minimum sampling frequency needed to capture all the information about the signal’s time structure [19]. To differentiate between deterministic and stochastic dynamics, it is recommended that ND!, where N denotes the length of the time series [20]. Bandt and Pompe [16] proposed 3 ≤ D ≤ 7 and τ = 1. The embedding delay τ = 1 captured the daily temporal structure of the cryptocurrency time series.

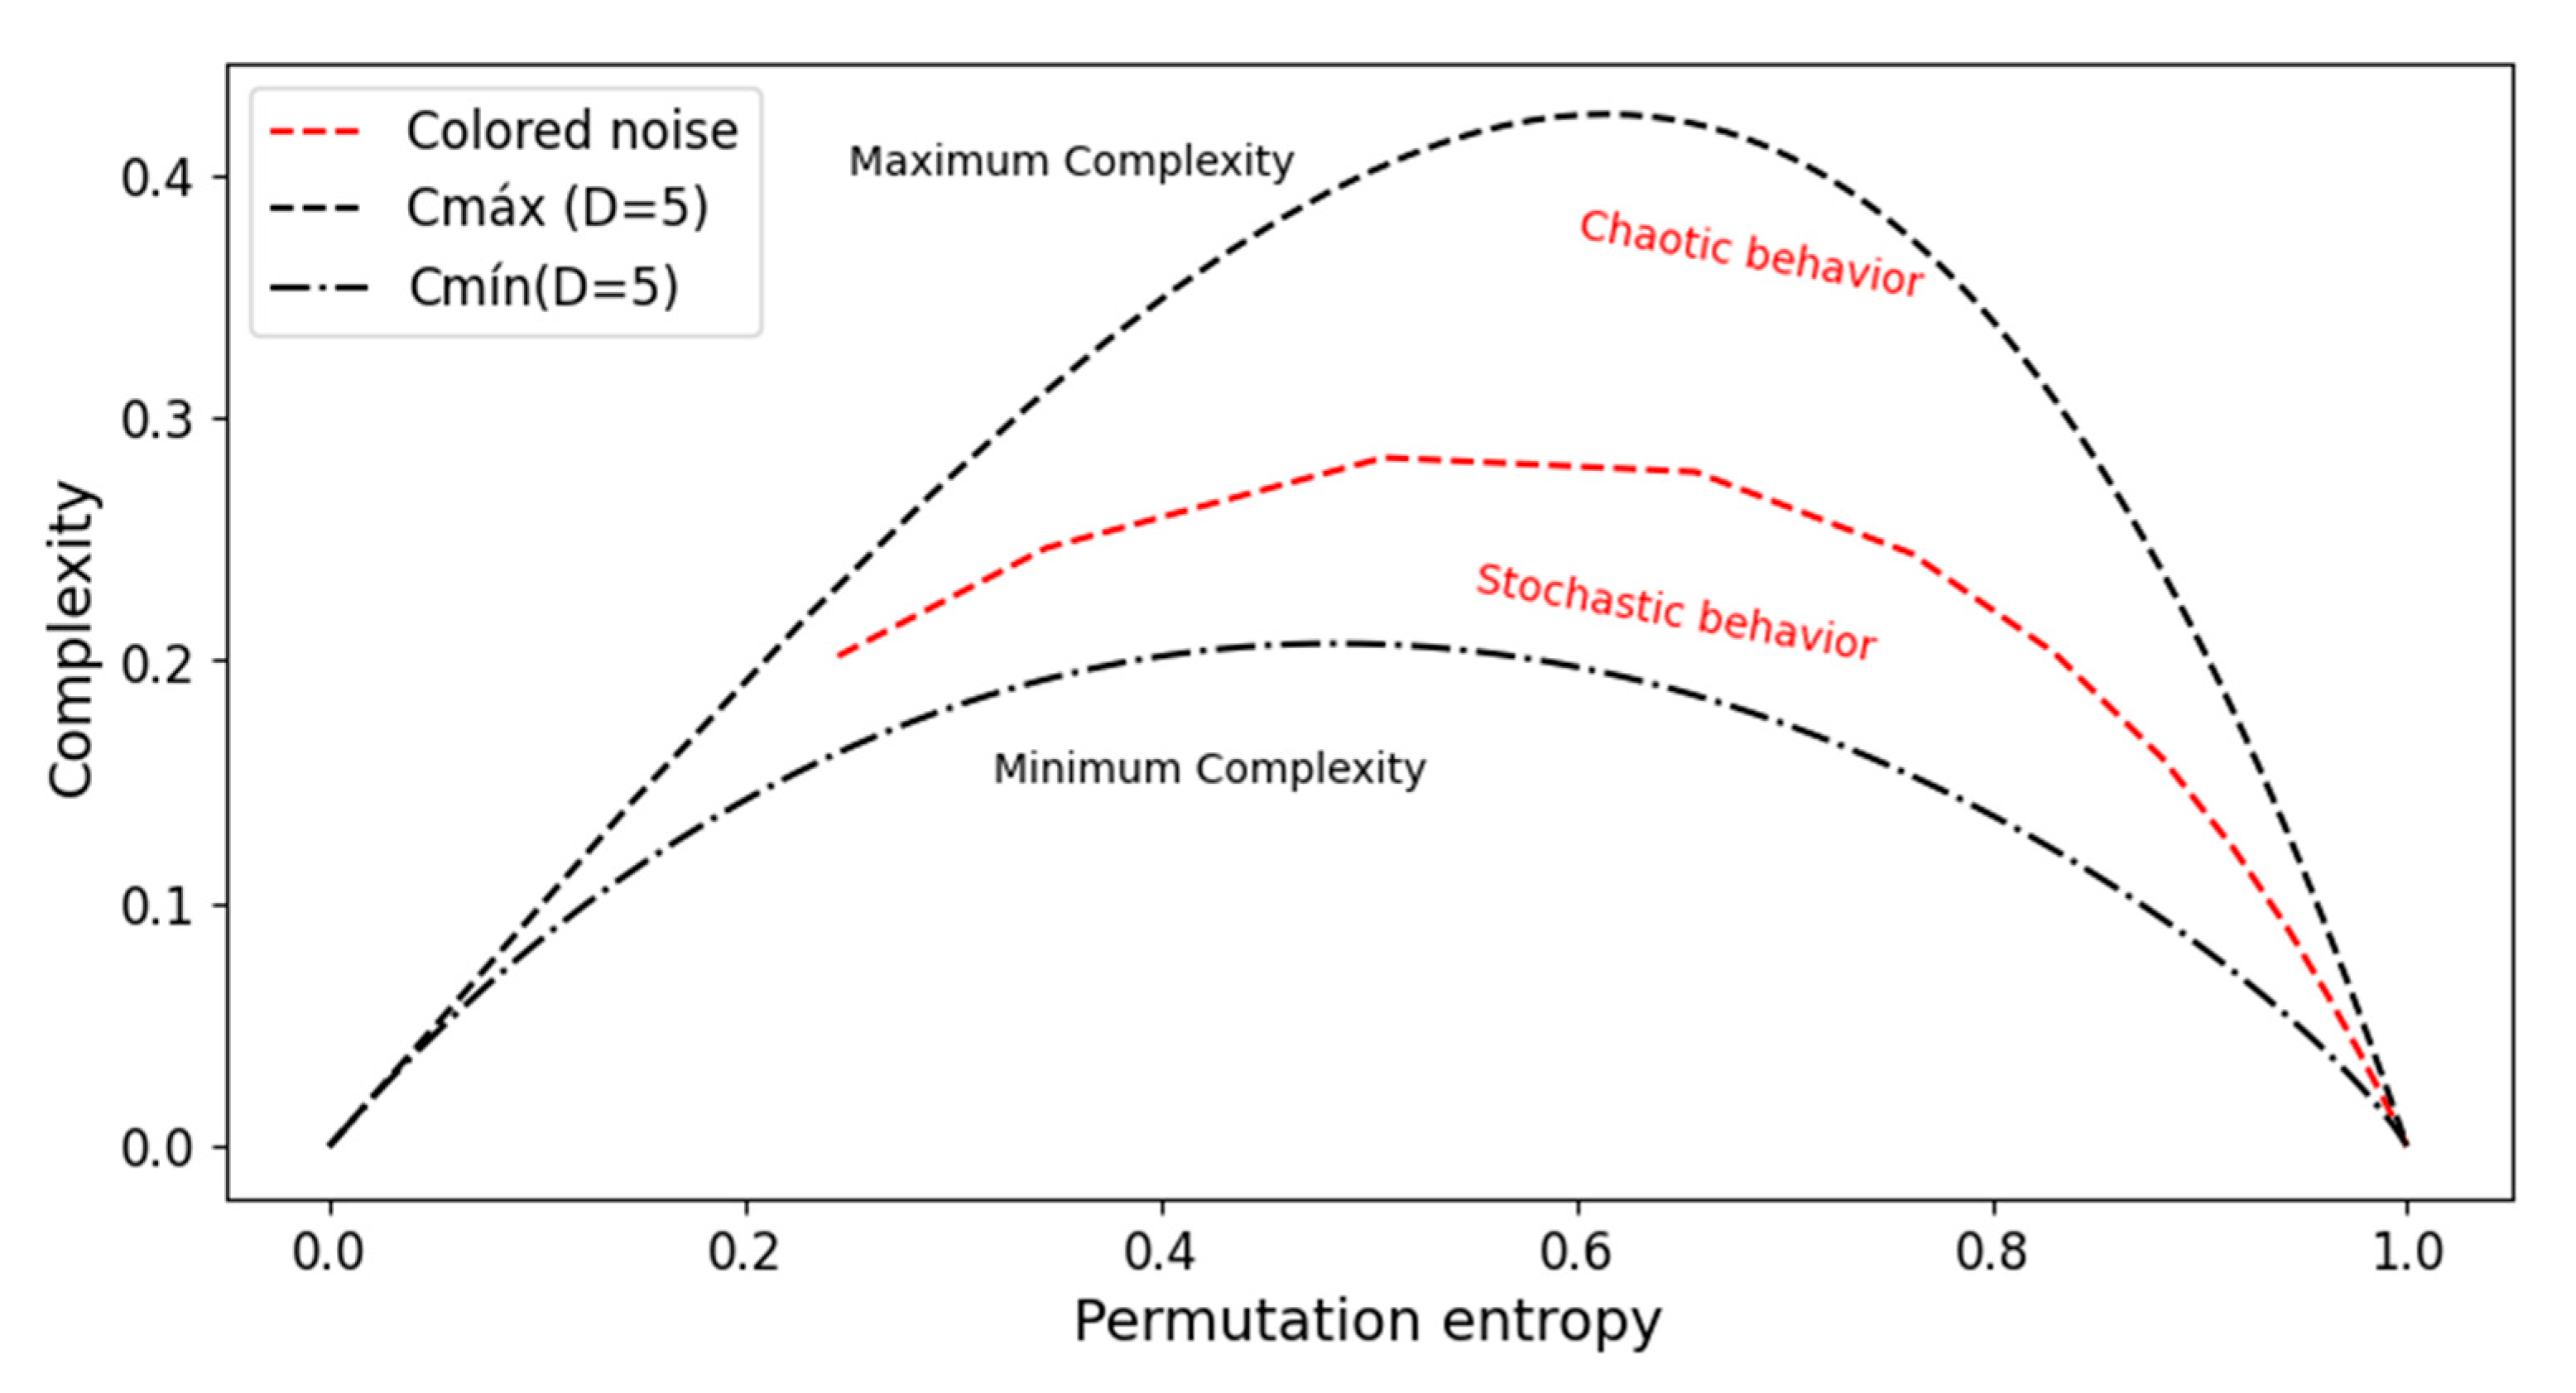
2.2. Complexity–Entropy Causality Plane (CECP)

The Shannon logarithmic information measure S[P] is considered a measure of the uncertainty associated with a phenomenon described by P, with P being a given arbitrary probability distribution P = {pi: i = 1, …, N}, and determined by
S P = i = 1 N p i ln p i
On the one hand, when S P  = 0, it is possible to predict with certainty which of the possible scenarios i, associated with probabilities pi, will occur. On the other hand, when P is the uniform distribution, our ignorance is maximum. A measure of statistical complexity [21] capable of detecting key details of the dynamics is defined through the product
C J S P = Q J P , P e · H S P
and the generalized Shannon entropy [22] is
H S = S P S m á x
with Smáx = S[Pe] = ln(N), 0 ≤ Hs ≤ 1 and Pe = 1/N, , 1/N the uniform distribution.
The disequilibrium is defined in terms of the Jensen–Shannon divergence:
Q j P , P e = Q 0 J P , P e
with Q0 being a normalization constant equal to the inverse of the maximum possible value of J[P,Pe] and the Jensen–Shannon divergence:
J P , P e = S P + P e 2 S P 2 S P e 2
The complexity–entropy causality plane (CECP) represents the plot of the permutation statistical complexity CJS versus the generalized Shannon entropy HS, including the bounds that determine the admissible region which depends solely on the embedding dimension D. The maximum and minimum envelope complexity can be calculated as a function of the entropy [23]. Figure 2 provides a schematic illustration of the CECP. The maximum and minimum boundaries are calculated for D = 5 (denoted Cmáx and Cmín, respectively) along with an approximate classification of chaotic and stochastic zones.

2.3. Fisher’s Information Measure (FIM)

The Fisher–Shannon plane is another graphic representation used to identify the characteristics of the time series dynamics based on the probability distribution P. This approach can reveal the informational characteristics of the planar position [24]. The Fisher’s information measure (FIM) [25] represents a measure of the ability to estimate the amount of information that can be extracted from a set of measurements [26] and F serves as a measure of the gradient content of the distribution f(x), calculated by
F f = 1 f x d f x d x 2 d x = 4 d Ψ x d x 2
For a discrete environment, the best-behaved expression to use [27] is the discrete normalized FIM, as obtained by
F P = F 0 i = 1 N 1 ( p i + 1 ) 1 2 ( p i ) 1 2 2
and the normalization constant F0 is obtained by
F 0 = 1   i f   p i * = 1   f o r   i * = 1   o r   i * = N   a n d   p i = 0   i i * 0   o t h e r w i s e  
Then, the Fischer–Shannon causality plane Hs x F can be calculated, where Hs is the generalized Shannon entropy in Equation (3).

2.4. Clustering

Cryptocurrencies can be described based on their white papers, which are technical documents that outline the project, its value proposition, the underlying technology, and other relevant details. A white paper is similar to a business plan and informs investors and users about the project.
By applying Natural Language Processing (NLP) analysis, it is possible to identify the most relevant terms in each whitepaper, allowing us to apply a clustering method that results in four clusters. Consequently, each token is assigned four membership coefficients indicating the degree of similarity with each cluster.
To identify clusters, the Latent Dirichlet Allocation (LDA) model was used. LDA is a probabilistic model that attempts to generate clusters based on the similarities between documents [28]. The basic concept behind this clustering is that similar documents are grouped into the same cluster, implying that cryptocurrencies with comparable characteristics should exhibit similar behavior.

2.5. Cryptocurrency Time Series

This paper applied the methods described to 176 daily closing price time series of different cryptocurrencies. The data were obtained from CoinMarketCap (coinmarketcap.com) (accessed on 15 October 2024). The data selection was based on the length of the series, spanning from October 2015 to October 2024, requiring series of more than 30 days in length and not completely null. A second classification was conducted to compare the behavior of series with a length of two years or less to those of greater size, as detailed in Table A1 and Table A2, respectively. In [29], the authors suggest exercising caution when applying permutation-based entropies to short high-frequency variability series characterized by a low signal-to-noise ratios. However, daily closing price time series are analyzed in this study, which smooths out intraday fluctuations and, therefore, is not considered to be significantly affected by high-frequency noise.
The algorithms used for analysis were obtained from the Python3.11.12 library ordpy 1.2.0 [30] to apply the methodology to the data. The color noise series was generated with the library colorednoise 2.2.0 (by Felix Patzel), which generates Gaussian distributed noise with a power law spectrum based on the algorithm [31]. Plots are created using the Matplotlib 3.10.0 [32], seaborn 0.13.2 [33], and GeoPandas 1.0.1 [34] Python libraries.

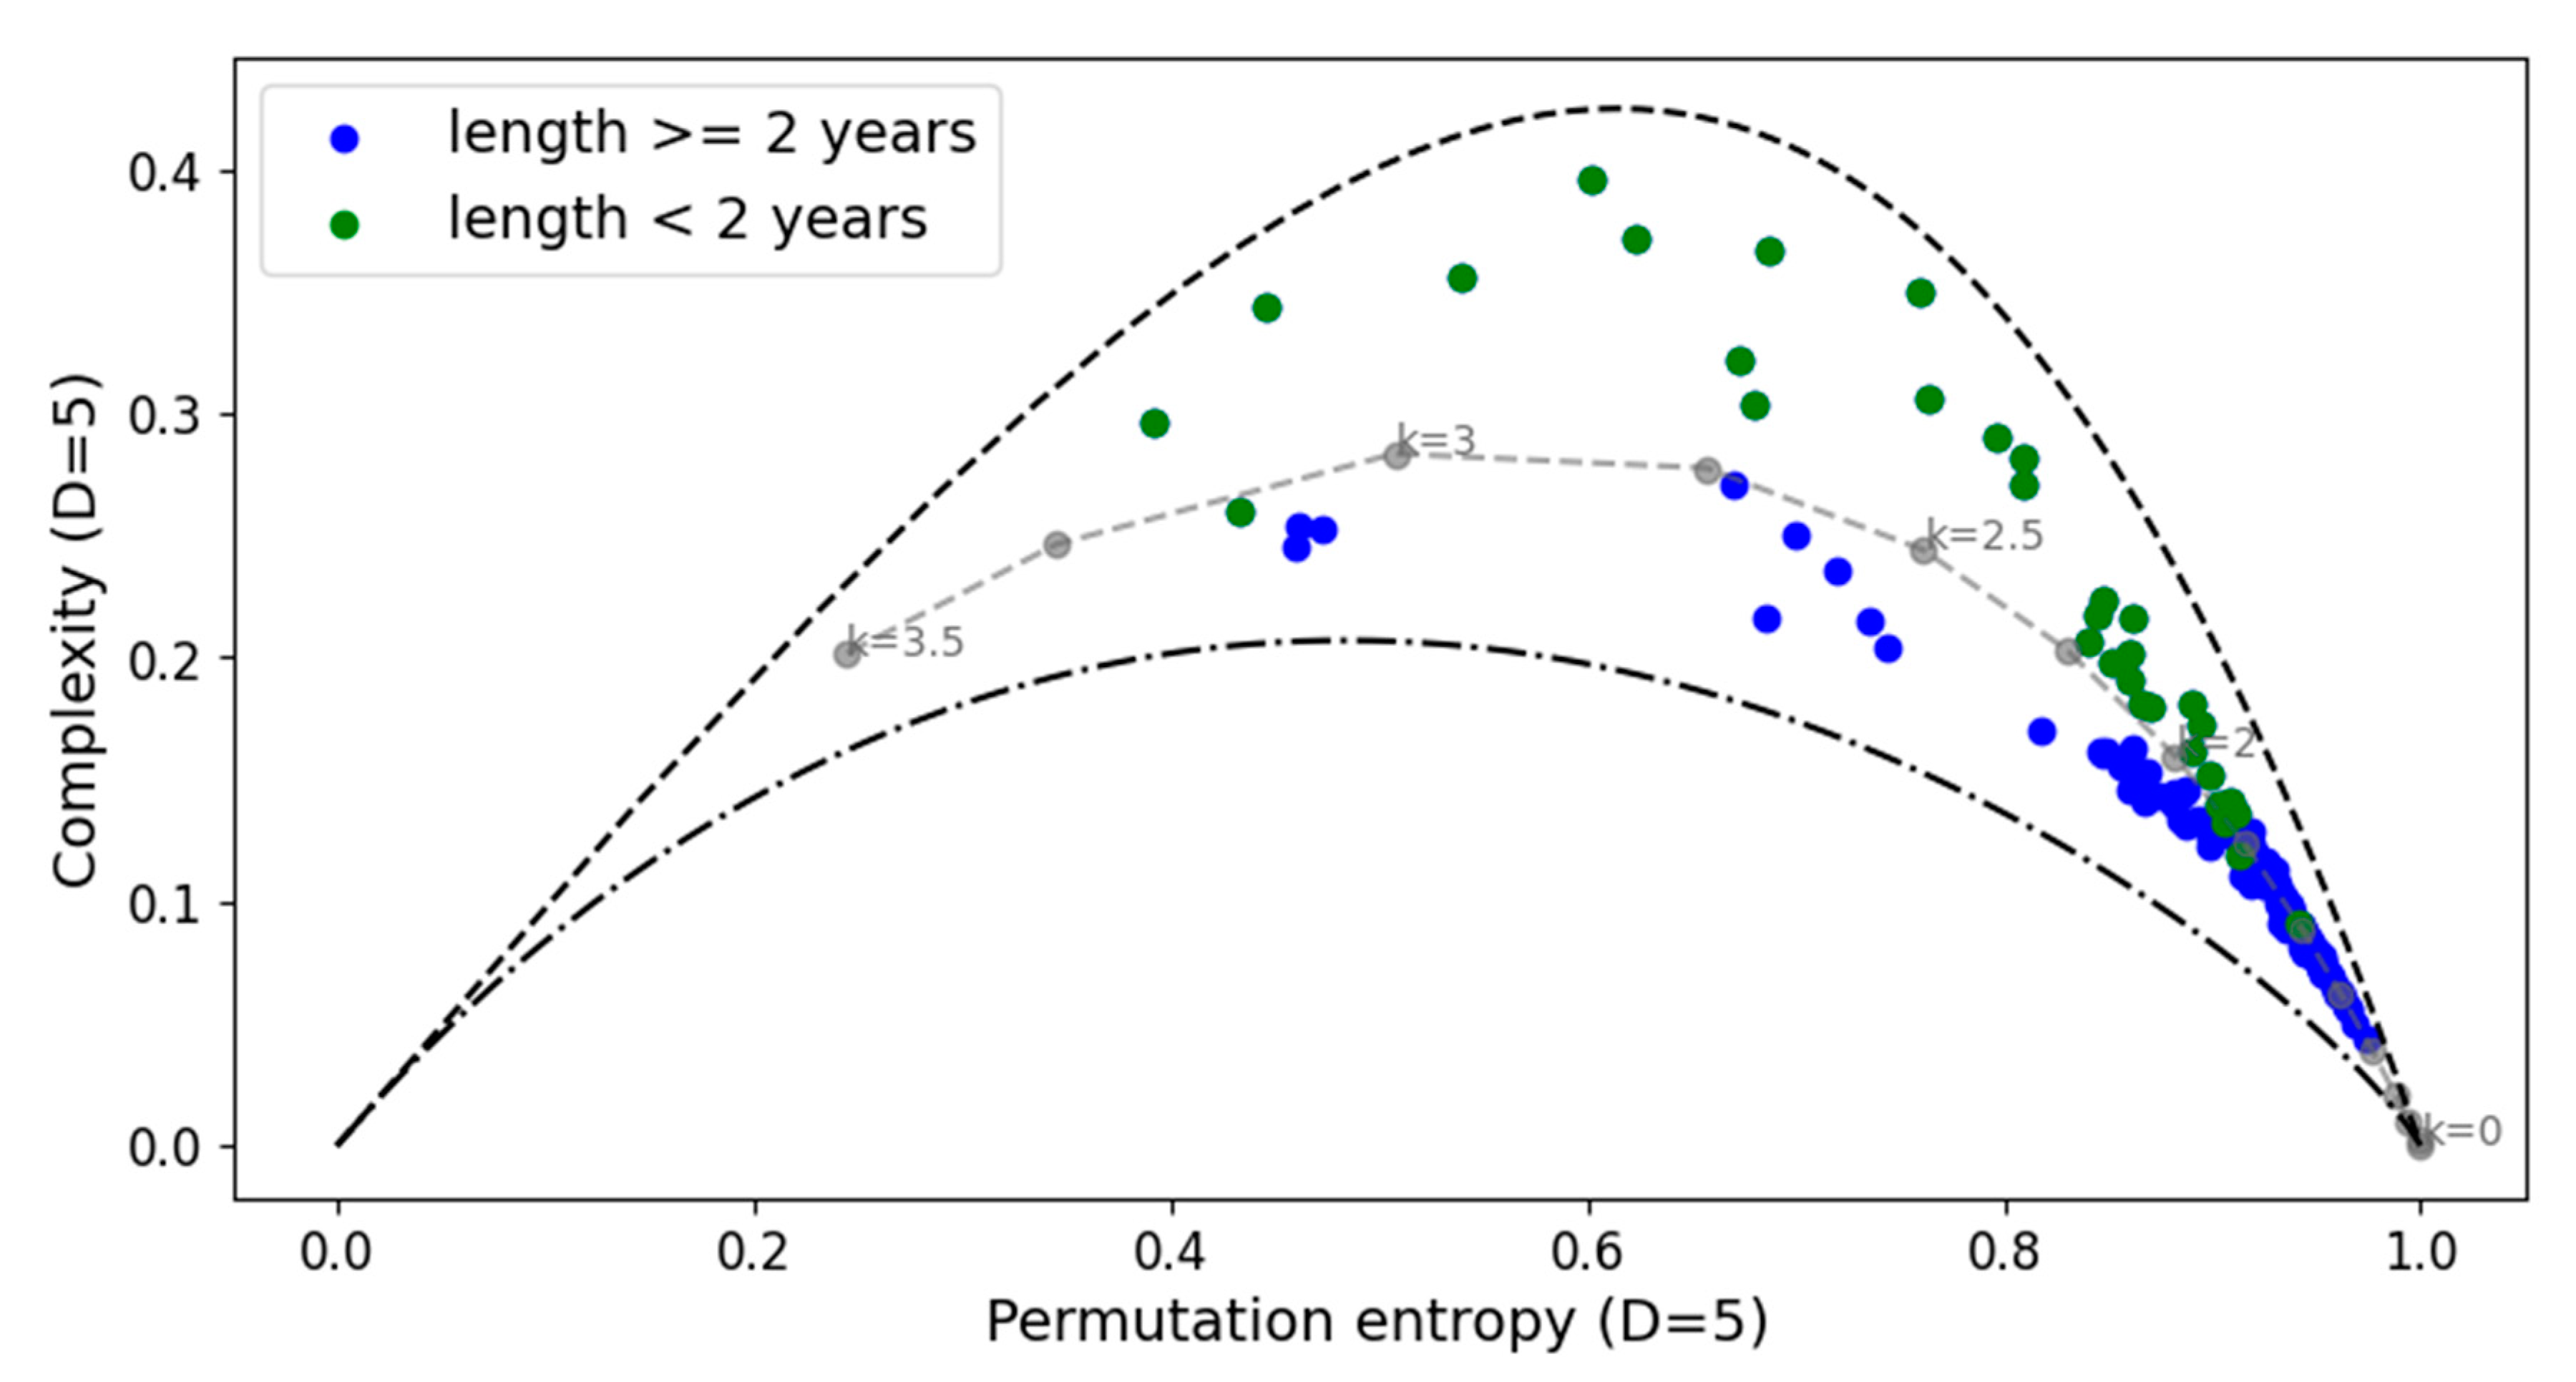
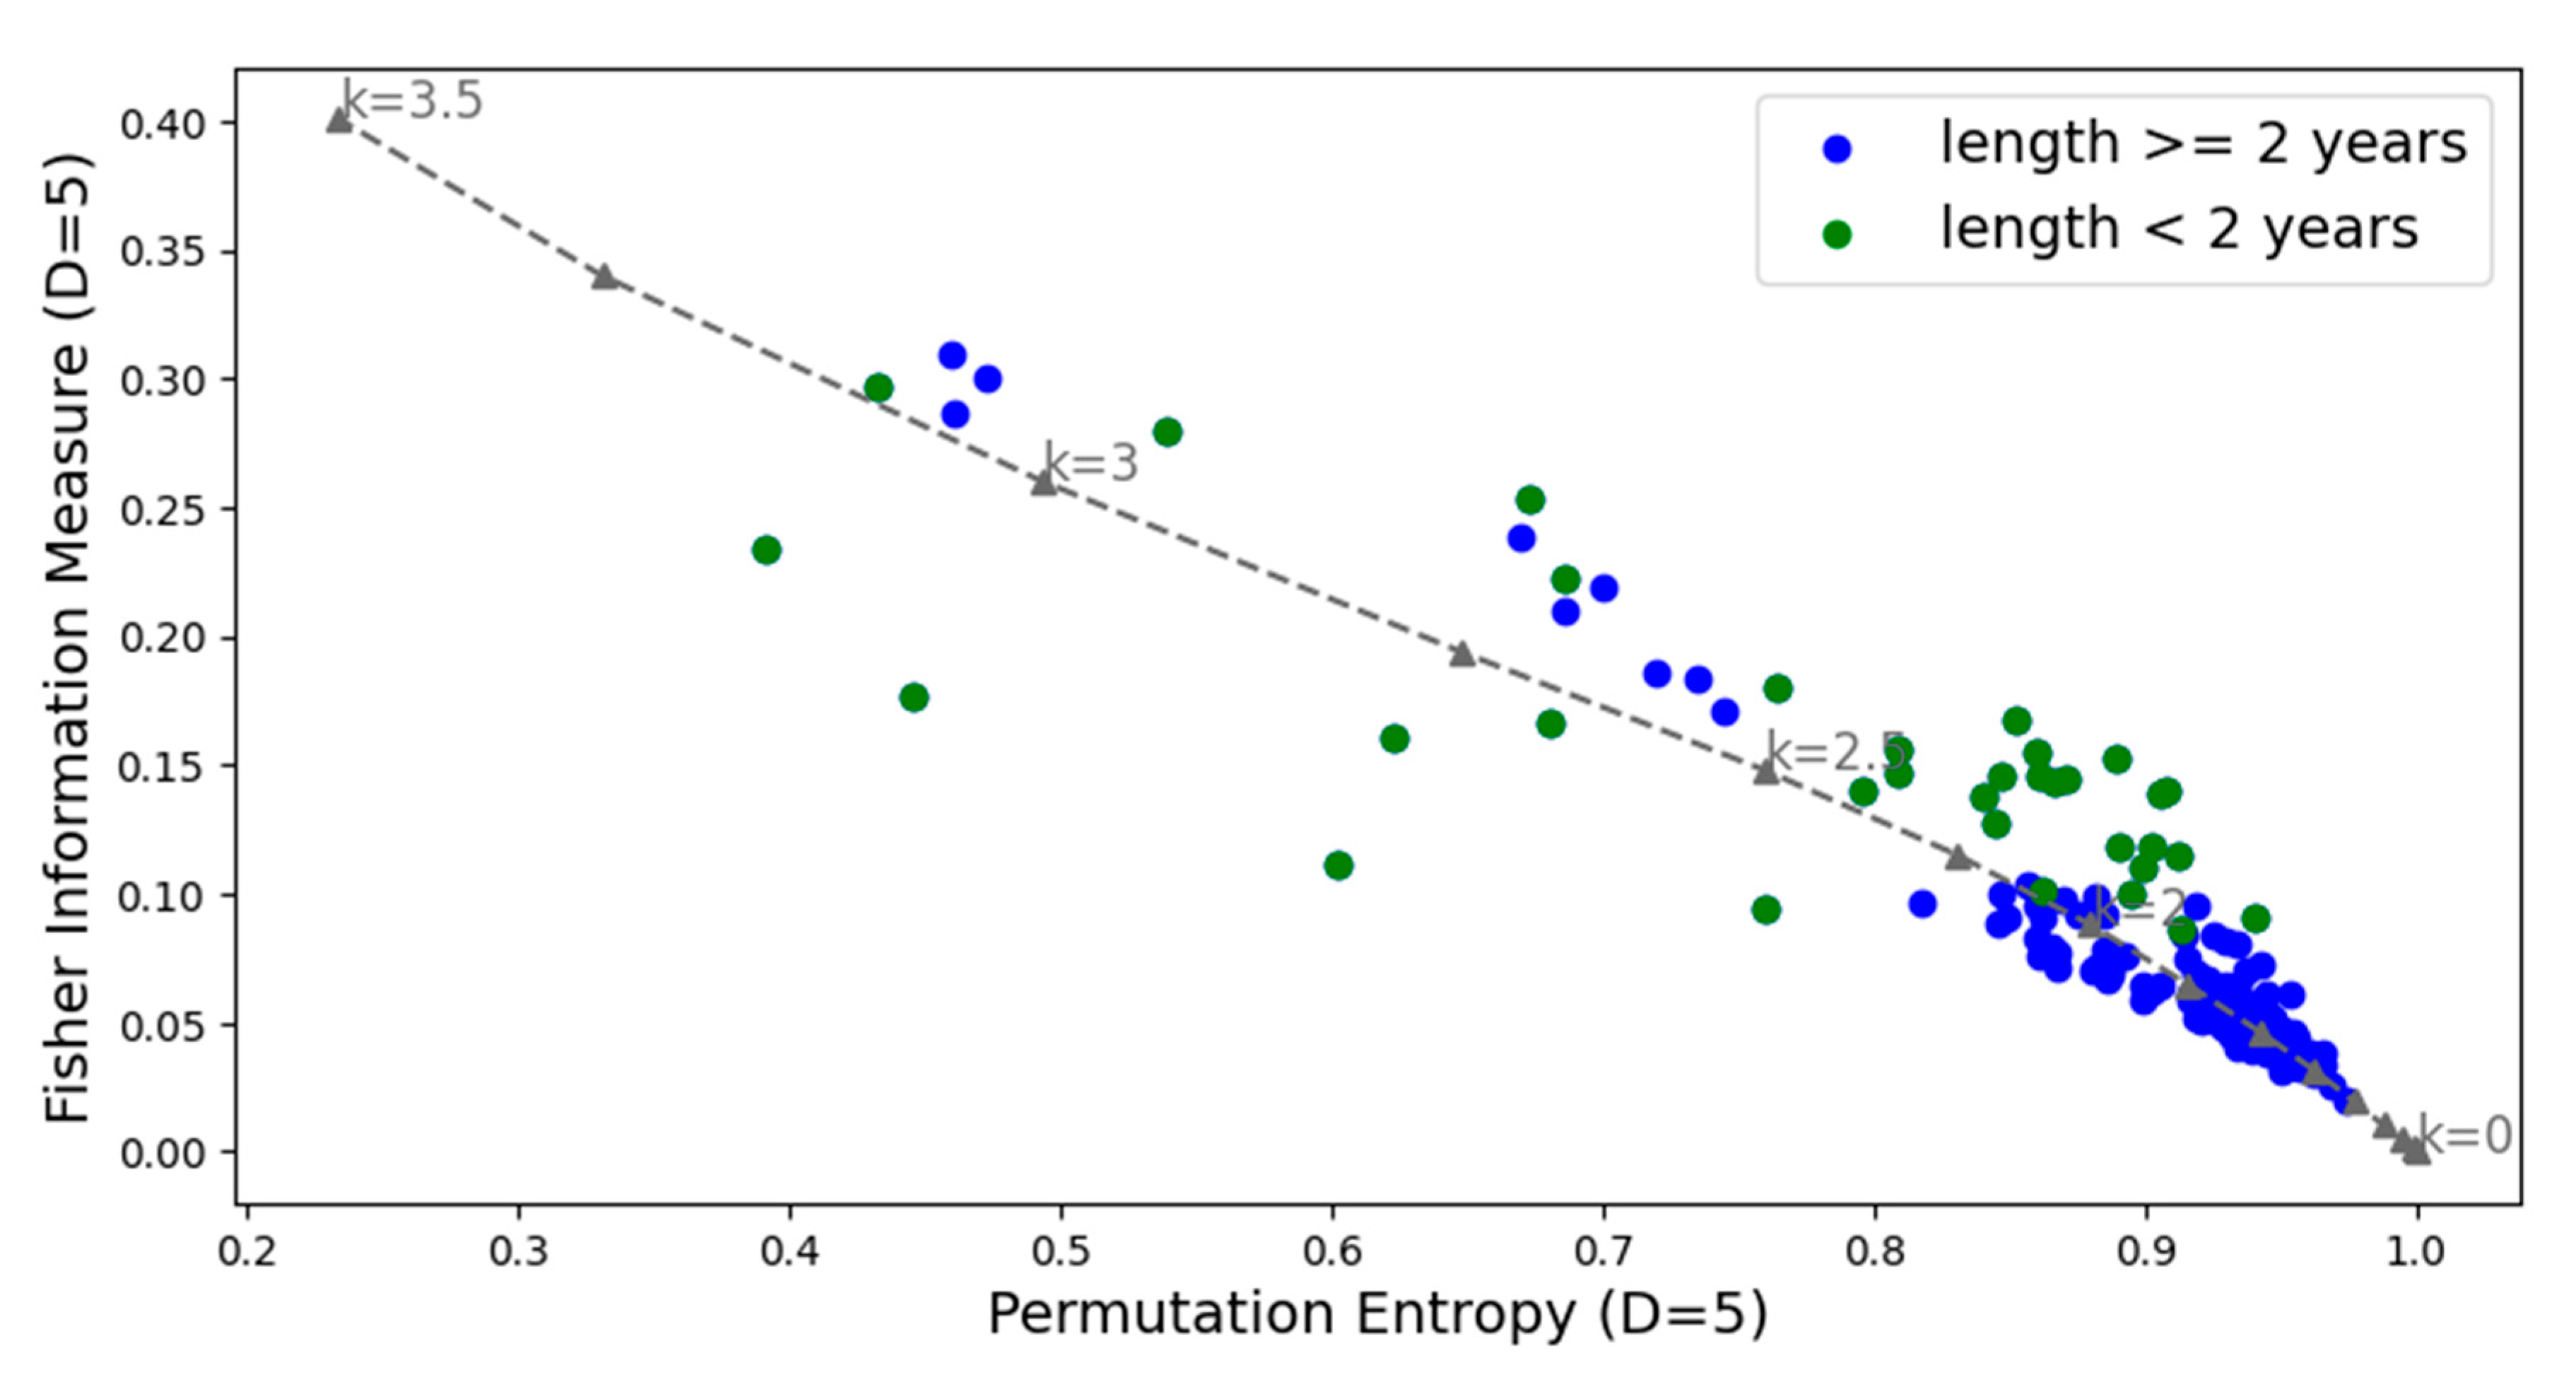
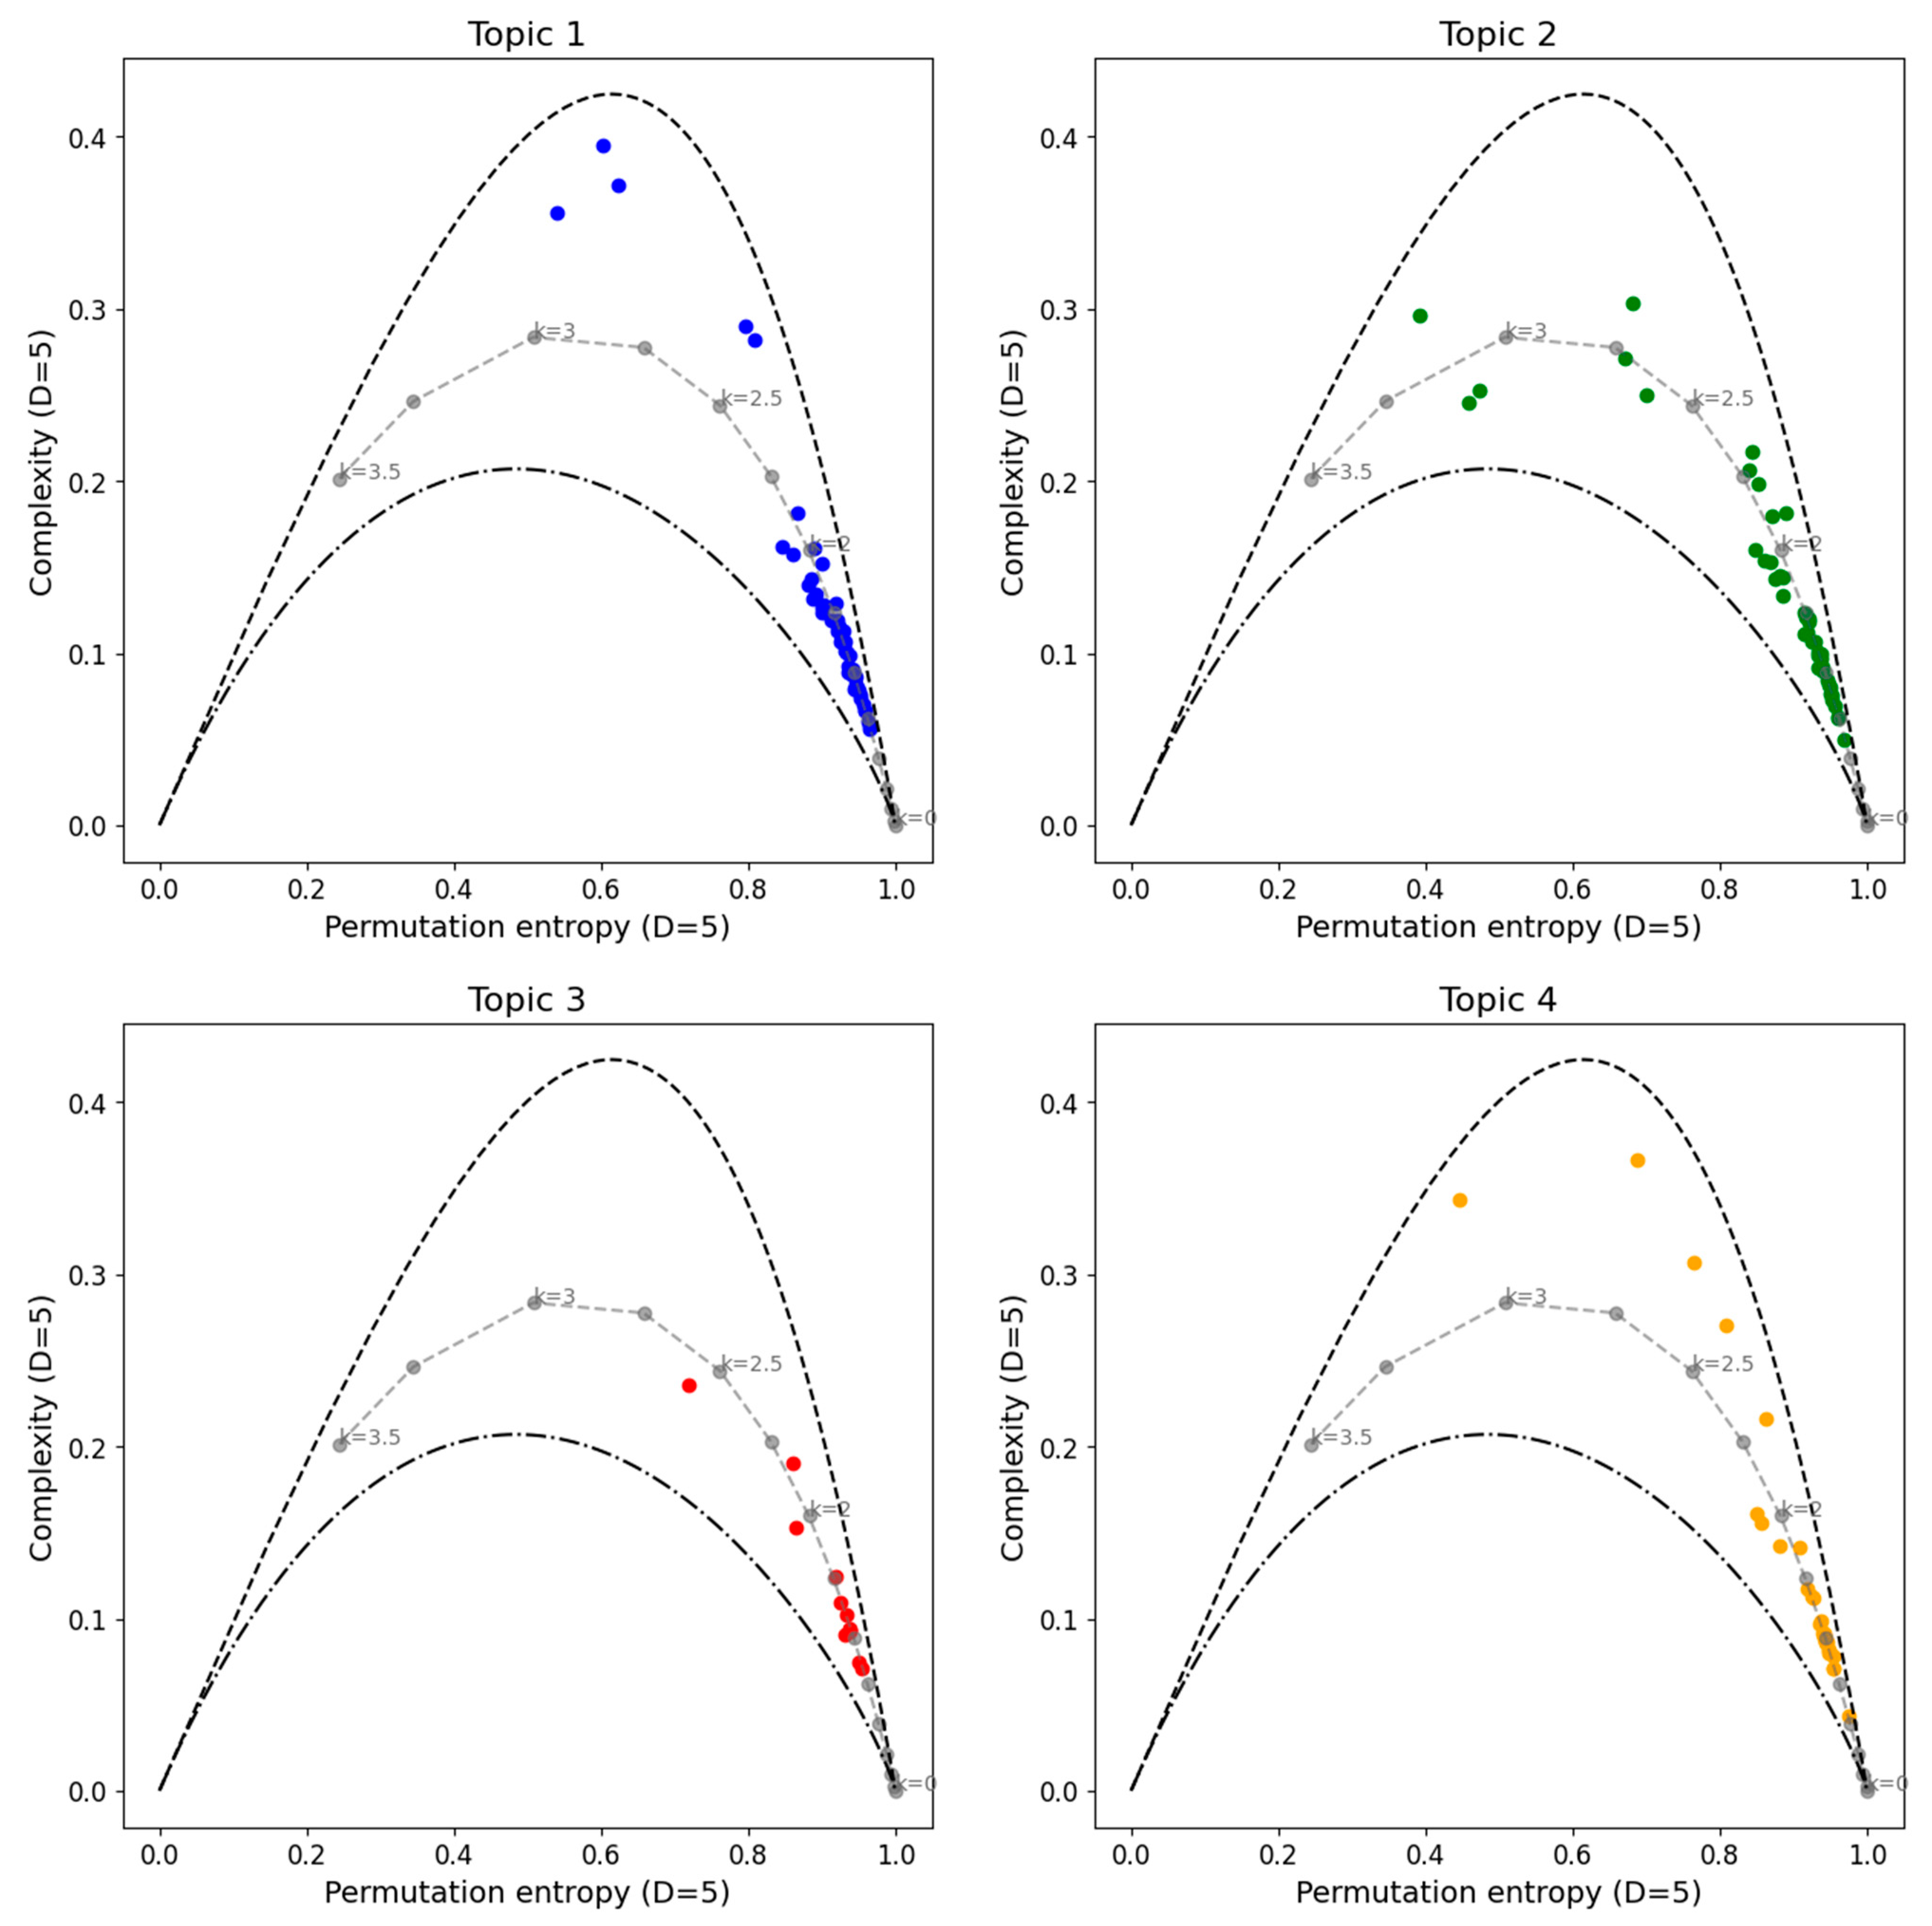
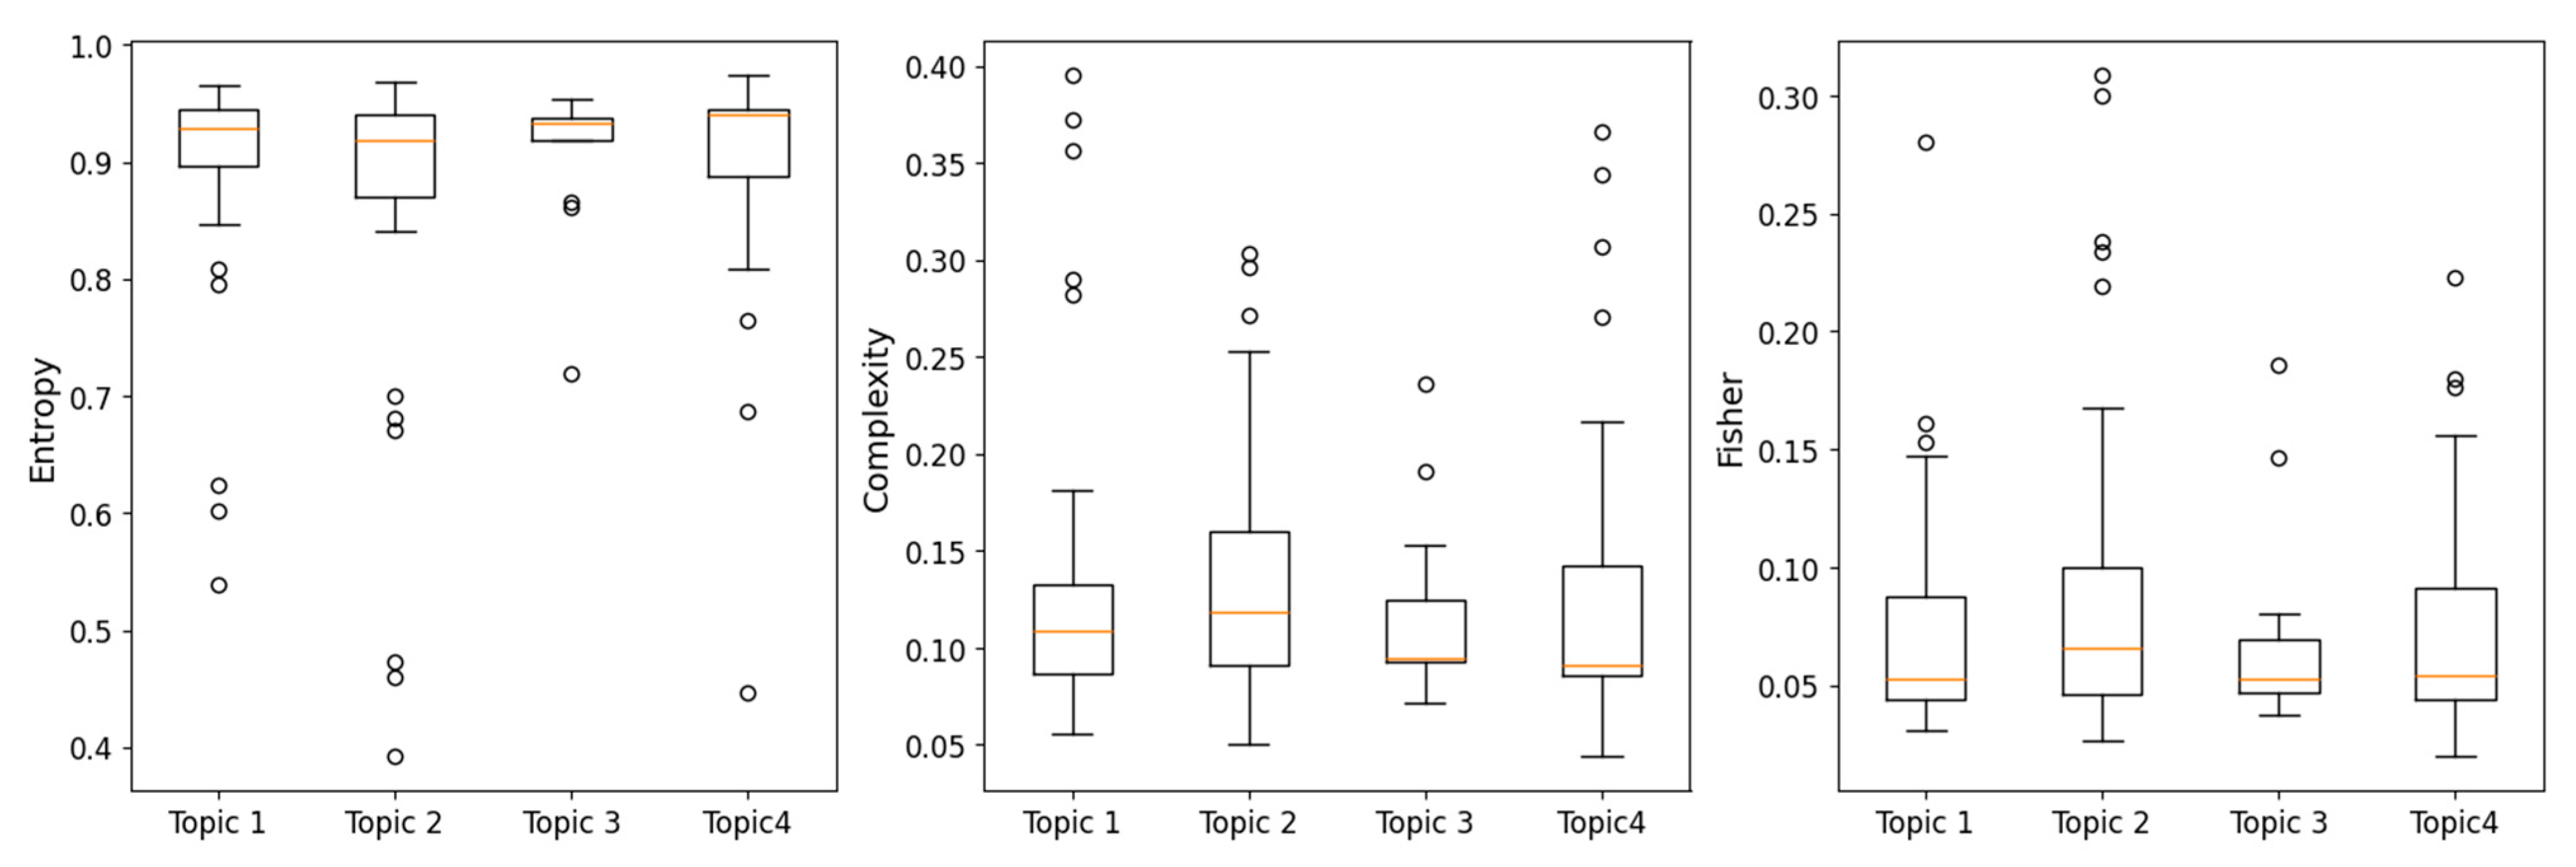
3. Results and Discussion

The results were obtained by applying the methodology to the daily closing price time series of different cryptocurrencies, as detailed in Appendix A. The data sets were divided into two groups: those with lengths of two years or less and those with lengths longer than two years. Bandt and Pompe [16] proposed 3 ≤ D ≤ 7 and τ = 1. In [35] it was found that an embedding dimension 3 ≤ D ≤ 5, as well as a window length of about 103 sampling points, is favorable. Moreover, increasing the value of D results in a greater incorporation of temporal causality into the embedding vectors [14]. In this case, the embedding delay is considered to be τ = 1 in order to capture the daily temporal structure of the cryptocurrency time series. The embedding dimension is set to D = 5 to effectively capture the variability observed within a typical working week in cryptocurrency markets. This choice enables the construction of embedding vectors that represent five consecutive daily observations, aligning with the standard trading cycle and enabling the model to incorporate temporal dependencies and weekly behavioral patterns specific to cryptocurrencies. Since the lengths of the series are variable, considering an average length Na = 1950, D = 5 satisfied the requirement that NaD! [20].
The methodology was applied to dynamic stochastic series of k-noises (noise with a power spectrum frequency dependence characterized by f ( k ) ), where k ranged from 0.00 to 3.50 in increments of 0.25, with 10 random simulations conducted for each k value.
The complexity–entropy causality planes (CECPs) using Shannon entropy and the Fischer–Shannon plane for the daily cryptocurrency time series are illustrated in Figure 3 and Figure 4, respectively.
The CECP analyses showed that, in most cases, daily cryptocurrency time series with lengths of two years or less exhibit chaotic behavior, while those longer than two years display stochastic behavior. For longer duration series, it can be observed that colored noise represents an upper bound on the CECP.
As shown in Figure 5, in all instances, the complexity, entropy, and Fisher parameters exhibit significantly greater variability in the short series compared to the long series. The long series demonstrate more stable parameter values, with a higher median entropy, lower complexity, and lower Fisher values when compared to the short series.
Subsequently, a clustering analysis was conducted for the subgroup of cryptocurrencies identified based on the characteristics outlined in the white papers across four topics. After applying the Latent Dirichlet Allocation (LDA) algorithm, the resulting clusters are as follows:
Topic 1 has 51 cryptocurrency time series: ‘ADC’, ‘ANC’, ‘ARG’, ‘BITS’, ‘BLOCK’, ‘BSD’, ‘BTB’, ‘CANN’, ‘CLAM’,’CSC’, ‘CURE’, ‘DEM’, ‘EMD’, ‘ETH’, ‘FLT’, ‘FRC’, ‘GRC’, ‘IFC’, ‘IXC’, ‘LOG’, ‘NAV’, ‘NET’, ‘NOBL’, ‘NTRN’, ‘NVC’, ‘OMNI’, ‘ORB’, ‘PINK’, ‘POP’, ‘PTC’, ‘RBT’, ‘RDD’, ‘RED’, ‘SLG’, ‘SMLY’, ‘THC’, ‘TRK’, ‘TRUST’, ‘TTC’, ‘USNBT’, ‘UTC’, ‘VIA’, ‘XCN’, ‘XDN’, ‘XLM’, ‘XMR’, ‘XPD’, ‘XPM’, ‘XQN’, ‘XST’, and ‘XVG’.
Topic 2 has 45 cryptocurrency time series: ‘ARI’, ‘BBR’, ‘BLU’, ‘BTC’, ‘BTS’, ‘CLOAK’, ‘CRW’, ‘CRYPT’, ‘DIME’, ‘DMD’, ‘DP’, ‘DTC’, ‘EFL’, ‘EMC2’, ‘FJC’, ‘FTC’, ‘GLD’, ‘GRS’, ‘HBN’, ‘LDOGE’, ‘LOG’, ‘MAX’, ‘MEC’, ‘NOTE’, ‘NYC’, ‘POT’, ‘PPC’, ‘PXC’, ‘RBY’, ‘SKC’, ‘SLR’, ‘SOON’, ‘STV’, ‘SXC’, ‘TGC’, ‘TIPS’, ‘UBQ’, ‘UNIT’, ‘UNO’, ‘VTC’, ‘XBC’, ‘XCO’, ‘XMY’, ‘XPY’, and ‘XWC’.
Topic 3 has 13 cryptocurrency time series: ‘AC’, ‘BSTY’, ‘DGB’, ‘DGC’, ‘GAME’, ‘GRN’, ‘PHO’, ‘PLNC’, ‘TES’, ‘TROLL’, ‘VRC’, ‘WDC’, and ‘XCP’.
Topic 4 has 30 cryptocurrency time series: ‘42’, ‘ACOIN’, ‘AIB’, ‘ANC’, ‘AUR’, ‘BAY’, ‘BCN’, ‘BLC’, ‘BTA’, ‘BTCD’, ‘CASH’, ‘DON’, ‘DOPE’, ‘EMC’, ‘ENRG’, ‘FAIR’, ‘FLO’, ‘GP’, ‘IOC’, ‘KOBO’, ‘MINT’, ‘MONA’, ‘NXS’, ‘NXT’, ‘OK’, ‘PND’, ‘SAK’, ‘SUPER’, ‘SYS’, and ‘VIA’.
Figure 6 presents the CECP analyses for clustering classification. It can be observed that Topics 1 and 2 exhibit similar behaviors. Most series are concentrated near the noise curve between k = 0 and k = 2, displaying chaotic behavior for lower entropy values. For Topic 2, the majority of the series are close to the noise zone region between k = 0 and k = 2.5, with some values bordering the curve for lower entropy values. Finally, for Topic 3, the values appear near the noise curve between k = 0 and k = 2.5, but it should be noted that the sample size is smaller than in the other cases, with only 13 cases analyzed.
The Fisher information measure vs. permutation entropy plane is shown in Figure 7, comparing the different topics identified in this study. No significant differences in behavior are observed between topics. In all cases, most series are concentrated near the noise curve between k = 0 and k = 2.5, with greater dispersion for higher k values.
In Figure 8, the box plots compare the different topics in terms of parameters such as entropy, complexity, and Fisher information. The graphs show that no significant differences exist in the mean values.
The clustering technique successfully identified four distinct groups based on the main characteristics in their white papers. However, these differences were not significant when evaluated using information measures such as entropy, complexity, and Fisher information. Despite the variations in the white papers, the time series dynamics remained similar. This result reveals the limited predictive power of white papers, suggesting that declared project rules do not directly govern observed market efficiency or complexity.

4. Conclusions

The temporal evolution of cryptocurrency time series was analyzed using information measures. The dynamics of these series were described in terms of complexity, entropy, and Fisher information. The main objective was to distinguish between different levels of randomness and chaos.
The representation in the complexity-entropy causality plane (CECP) indicates that daily cryptocurrency series with a length of two years or less exhibit chaotic behavior, while series longer than two years are associated with stochastic behavior. Most of the longer series display characteristics similar to colored noise, with the parameter k varying between 0 and 2. The CECP framework could help investors distinguish between speculative assets (chaotic phases) and mature markets (stochastic phases), informing portfolio diversification strategies.
By applying Natural Language Processing (NLP) analysis, the most relevant terms in each whitepaper were identified, enabling the use of a clustering method that resulted in four distinct clusters. However, no significant characteristics were found in terms of information measures, challenging the assumption that project narratives dictate market behavior. For this reason, an investment recommendation should prioritize real-time informational metrics over white paper content.
Future research should investigate other variables, including technological innovations, investor sentiment metrics, and macro-financial drivers (regulatory shifts and cross-asset correlations), that may be influencing the behavior of time series in cryptocurrencies.
Understanding these dynamics is critical for constructing diversified portfolios that mitigate risks associated with chaotic market phases while capitalizing on efficiency regimes. For instance, identifying assets transitioning from chaos to stochasticity—via complexity-entropy metrics—can inform strategic asset allocation, balancing high-volatility cryptocurrencies with stable, entropy-resilient ones.

Author Contributions

All the authors made significant contributions to this work. Conceptualization, M.S., H.D.M. and L.F.C.; methodology, M.S., H.D.M., L.F.C., C.C. and O.A.R.; supervision, L.F.C. and O.A.R.; validation, C.C. and O.A.R.; visualization, M.S.; writing—original draft, M.S.; writing—review and editing, H.D.M., C.C., L.F.C. and O.A.R. All authors have read and agreed to the published version of the manuscript.

Funding

We acknowledge the financial support by the Universidad de Buenos Aires (UBACYT-20020220400162BA).

Institutional Review Board Statement

Not applicable.

Data Availability Statement

The data used to support the findings from this study are included within the article. The processed data are available from the corresponding author upon request.

Acknowledgments

We would like to thank the Academic Editor and the two anonymous reviewers for their constructive criticism and comments, which greatly contributed to enhancing the quality of the manuscript.

Conflicts of Interest

The authors declare no conflicts of interest.

Appendix A

In this appendix, the information from the cryptocurrency time series is shown. Table A1 shows the series with lengths of two years or less and Table A2 shows those of greater length.
Table A1. Information from the cryptocurrency time series with two years or less length.
CryptoLengthStartEnd
ARI92720/12/20213/7/2024
BAY2501/11/20218/7/2022
BCF29825/5/202218/3/2023
BTCD22719/11/20232/7/2024
BTCS30119/12/202314/10/2024
CBX10755/11/202114/10/2024
CRYPT56310/10/202125/4/2023
DON99228/8/202028/5/2023
DP34222/11/202131/10/2022
FCN887/10/20213/1/2022
FLO31710/3/202120/1/2022
FLT20425/3/202414/10/2024
GLD57314/12/20219/7/2023
GP451/12/202114/1/2022
HYPER48727/4/202111/9/2022
NET588/3/20234/5/2023
NOBL18216/4/202414/10/2024
PND13628/3/202210/8/2022
PTC9512/7/202414/10/2024
RPC45024/1/202230/8/2023
SAK3738/9/202215/9/2023
SLG72019/7/20227/7/2024
SLR43418/11/202129/1/2023
SOON50514/10/20221/3/2024
SRC715/8/202414/10/2024
TES4309/8/202314/10/2024
TGC994/1/202212/4/2022
TIT35323/6/20239/6/2024
TRI37615/12/202027/12/2021
TRK5730/11/20212/2/2022
TRUST75531/7/202024/8/2022
TTC71229/7/20229/7/2024
UNB103614/12/202114/10/2024
UTC40822/3/20225/6/2023
Table A2. Information from the cryptocurrency time series with lengths of more than two years.
CryptoLengthStartEnd
4225329/11/201714/10/2024
AC141013/10/202025/8/2024
ACOIN25279/11/201714/10/2024
ADC25329/11/201714/10/2024
AIB19989/11/201713/6/2023
ANC25329/11/201714/10/2024
ARG116210/8/202114/10/2024
AUR25329/11/201714/10/2024
BBR165627/11/20179/6/2022
BCN25319/11/201714/10/2024
BITB25329/11/201714/10/2024
BITS25189/11/201714/10/2024
BLC15379/11/201723/1/2022
BLK25329/11/201714/10/2024
BLOCK25329/11/201714/10/2024
BLU25329/11/201714/10/2024
BSD22849/11/20179/2/2024
BSTY25329/11/201714/10/2024
BTA25329/11/201714/10/2024
BTB210510/1/201914/10/2024
BTC328518/10/201514/10/2024
BTS25329/11/201714/10/2024
C225269/11/201714/10/2024
CANN25329/11/201714/10/2024
CASH163722/4/202014/10/2024
CCN20551/3/201914/10/2024
CLAM25329/11/201714/10/2024
CLOAK25329/11/201714/10/2024
CRW25329/11/201714/10/2024
CSC25009/11/201714/10/2024
CURE25329/11/201714/10/2024
DASH25329/11/201714/10/2024
DEM24619/11/201714/10/2024
DGB25329/11/201714/10/2024
DGC328518/10/201514/10/2024
DIME25329/11/201714/10/2024
DMD25329/11/201714/10/2024
DOGE25329/11/201714/10/2024
DOPE25329/11/201714/10/2024
DTC223721/2/201814/4/2024
ECC17629/11/20175/9/2022
EFL21209/11/201714/10/2024
EMC25329/11/201714/10/2024
EMC222229/11/201712/12/2023
EMD15739/11/201710/3/2022
ENRG16019/11/201730/6/2022
ETH25329/11/201714/10/2024
EXCL18719/11/201723/12/2022
FAIR11549/11/201710/5/2022
FJC16899/11/20178/7/2022
FRC318118/10/201514/10/2024
FST17758/4/201915/2/2024
FTC328518/10/201514/10/2024
GAME25329/11/201714/10/2024
GCN21049/11/201716/1/2024
GRC22849/11/20179/2/2024
GRN192221/5/201824/8/2023
GRS25329/11/201714/10/2024
HBN18219/11/201714/10/2024
IFC20129/11/201714/10/2024
IOC16739/11/20178/6/2022
IXC320818/10/201514/10/2024
KOBO25249/11/201714/10/2024
LDOGE99617/4/202014/10/2024
LOG17959/11/201714/10/2024
LTC328518/10/201514/10/2024
MAX25319/11/201714/10/2024
MEC253318/10/20152/11/2023
MINT22849/11/20179/2/2024
MNC130121/2/201913/9/2022
MONA25329/11/201714/10/2024
MUE16749/11/20179/6/2022
NAV25329/11/201714/10/2024
NLG18399/11/201721/11/2022
NMC328518/10/201514/10/2024
NOTE23129/11/20173/5/2024
NTRN25329/11/201714/10/2024
NVC300218/10/201514/10/2024
NXS23339/11/201714/10/2024
NXT25329/11/201714/10/2024
NYAN12061/9/201814/2/2023
NYC25229/11/201714/10/2024
OK25329/11/201714/10/2024
OMNI25329/11/201714/10/2024
ORB20519/11/201724/6/2023
PHO15169/11/201723/1/2022
PIGGY109714/10/202114/10/2024
PINK22849/11/20179/2/2024
PLNC24969/11/201714/10/2024
POP146610/10/202014/10/2024
POT25299/11/201714/10/2024
PPC328518/10/201514/10/2024
PXC307118/10/201514/10/2024
PXI25329/11/201714/10/2024
QRK25309/11/201714/10/2024
RBT25329/11/201714/10/2024
RBY25329/11/201714/10/2024
RDD25329/11/201714/10/2024
RED233723/5/201814/10/2024
SKC13564/5/202019/1/2024
SMC16679/11/20172/6/2022
SMLY22759/11/20179/2/2024
SONG25329/11/201714/10/2024
SPHR16739/11/20179/6/2022
SPR25329/11/201714/10/2024
START25329/11/201714/10/2024
STV130619/3/202114/10/2024
SUPER17659/11/201712/9/2022
SXC11994/7/202114/10/2024
SYS25329/11/201714/10/2024
TAG25209/11/201714/10/2024
THC25329/11/201714/10/2024
TIPS25329/11/201714/10/2024
TRC303718/10/20159/2/2024
TROLL24919/11/201714/10/2024
UBQ22259/11/201712/12/2023
UFO21889/11/201714/10/2024
UNIT25329/11/201714/10/2024
UNO25329/11/201714/10/2024
USNBT16509/11/201716/5/2022
VIA25329/11/201714/10/2024
VRC16699/11/20174/6/2022
VTC25329/11/201714/10/2024
WBB25219/11/201714/10/2024
WDC275918/10/201514/10/2024
XBC25329/11/201714/10/2024
XCN25329/11/201714/10/2024
XCO23939/11/201728/5/2024
XCP25329/11/201714/10/2024
XDN25329/11/201714/10/2024
XEM25329/11/201714/10/2024
XLM25329/11/201714/10/2024
XMR25329/11/201714/10/2024
XMY22259/11/201712/12/2023
XPD25329/11/201714/10/2024
XPM25329/11/201714/10/2024
XPY25179/11/201714/10/2024
XQN25269/11/201714/10/2024
XRP25329/11/201714/10/2024
XST23499/11/201714/10/2024
XVG25329/11/201714/10/2024
XWC25329/11/201714/10/2024
ZET25329/11/201714/10/2024

References

  1. Drożdż, S.; Kwapień, J.; Oświęcimka, P.; Stanisz, T.; Wątorek, M. Complexity in Economic and Social Systems: Cryptocurrency Market at around COVID-19. Entropy 2020, 22, 1043. [Google Scholar] [CrossRef]
  2. Kim, K.; Lee, M. The Impact of the COVID-19 Pandemic on the Unpredictable Dynamics of the Cryptocurrency Market. Entropy 2021, 23, 1234. [Google Scholar] [CrossRef] [PubMed]
  3. García-Medina, A.; Hernández, C.J.B. Network Analysis of Multivariate Transfer Entropy of Cryptocurrencies in Times of Turbulence. Entropy 2020, 22, 760. [Google Scholar] [CrossRef]
  4. Kwapień, J.; Wątorek, M.; Drożdż, S. Cryptocurrency Market Consolidation in 2020–2021. Entropy 2021, 23, 1674. [Google Scholar] [CrossRef] [PubMed]
  5. Fernandes, L.H.S.; Bouri, E.; Silva, J.W.L.; Bejan, L.; de Araujo, F.H.A. The resilience of cryptocurrency market efficiency to COVID-19 shock. Physica A 2022, 607, 128218. [Google Scholar] [CrossRef] [PubMed]
  6. Dehouche, N. Revisiting the volatility of bitcoin with approximate entropy. Cogent Econ. Financ. 2022, 10, 2013588. [Google Scholar] [CrossRef]
  7. Valencia, F.; Gómez-Espinosa, A.; Valdés-Aguirre, B. Price Movement Prediction of Cryptocurrencies Using Sentiment Analysis and Machine Learning. Entropy 2019, 21, 589. [Google Scholar] [CrossRef]
  8. Stosic, D.; Stosic, D.; Ludermir, T.B.; Stosic, T. Exploring disorder and complexity in the cryptocurrency space. Phys. A Stat. Mech. Its Appl. 2019, 525, 548–556. [Google Scholar] [CrossRef]
  9. Liu, F.; Fan, H.-Y.; Qi, J.-Y. Blockchain Technology, Cryptocurrency: Entropy-Based Perspective. Entropy 2022, 24, 557. [Google Scholar] [CrossRef]
  10. Puoti, F.; Pittorino, F.; Roveri, M. Quantifying Cryptocurrency Unpredictability: A Comprehensive Study of Complexity and Forecasting. arXiv 2025, arXiv:2502.09079. [Google Scholar]
  11. Pele, D.T.; Mazurencu-Marinescu-Pele, M. Using High-Frequency Entropy to Forecast Bitcoin’s Daily Value at Risk. Entropy 2019, 21, 102. [Google Scholar] [CrossRef] [PubMed]
  12. Rodriguez-Rodriguez, N.; Miramontes, O. Shannon Entropy: An Econophysical Approach to Cryptocurrency Portfolios. Entropy 2022, 24, 1583. [Google Scholar] [CrossRef]
  13. Zunino, L.; Zanin, M.; Tabak, B.M.; Pérez, D.G.; Rosso, O.A. Complexity-entropy causality plane: A useful approach to quantify the stock market inefficiency. Phys. A Stat. Mech. Its Appl. 2010, 389, 1891–1901. [Google Scholar] [CrossRef]
  14. Bariviera, A.F.; Zunino, L.; Rosso, O.A. An analysis of high-frequency cryptocurrencies prices dynamics using permutation-information-theory quantifiers. Chaos 2018, 28, 075511. [Google Scholar] [CrossRef] [PubMed]
  15. Sigaki, H.Y.D.; Perc, M.; Ribeiro, H.V. Clustering patterns in efficiency and the coming-of-age of the cryptocurrency market. Sci. Rep. 2019, 9, 1440. [Google Scholar] [CrossRef]
  16. Bandt, C.; Pompe, B. Permutation Entropy: A Natural Complexity Measure for Time Series. Phys. Rev. Lett. 2002, 88, 174102. [Google Scholar] [CrossRef]
  17. Zanin, M.; Olivares, F. Ordinal patterns-based methodologies for distinguishing chaos from noise in discrete time series. Commun. Phys. 2021, 4, 190. [Google Scholar] [CrossRef]
  18. Suriano, M.; Caram, L.F.; Rosso, O.A. Daily streamflow of Argentine Rivers Analysis Using Information Theory Quantifiers. Entropy 2024, 26, 56. [Google Scholar] [CrossRef]
  19. Serinaldi, F.; Zunino, L.; Rosso, O.A. Complexity–entropy analysis of daily stream flow time series in the continental United States. Stoch. Environ. Res. Risk Assess. 2014, 28, 1685–1708. [Google Scholar] [CrossRef]
  20. Rosso, O.A.; Larrondo, H.A.; Martín, M.T.; Plastino, A.; Fuentes, M.A. Distinguishing Noise from Chaos. Phys. Rev. Lett. 2007, 99, 154102. [Google Scholar] [CrossRef]
  21. Stosic, T.; Telesca, L.; Vicente de Souza Ferreira, D.; Stosic, B. Investigating anthropically induced effects in streamflow dynamics by using permutation entropy and statistical complexity analysis: A case study. J. Hydrol. 2016, 540, 1136–1145. [Google Scholar] [CrossRef]
  22. Shannon, C.E. A Mathematical Theory of Communication. Bell System Technol. 1948, 27, 379–423. [Google Scholar] [CrossRef]
  23. Calbet, X.; López-Ruiz, R. Tendency towards maximum complexity in a nonequilibrium isolated system. Phys. Rev. E Stat. Nonlinear Soft Matter Phys. 2001, 63, 066116. [Google Scholar] [CrossRef]
  24. Rosso, O.A.; Olivares, F.; Plastino, A. Noise versus chaos in a causal Fisher-Shannon plane. Pap. Phys. 2015, 7, 1852–4249. [Google Scholar] [CrossRef]
  25. Fisher, R.A. On the mathematical foundations of theoretical statistics. Philos. Trans. R. Soc. Lond. Ser. A 1922, 222, 309–368. [Google Scholar] [CrossRef]
  26. Frieden, B. Science from Fisher Information: A Unification; Cambridge University Press: Cambridge, UK, 2004. [Google Scholar] [CrossRef]
  27. Sánchez-Moreno, P.; Yanez, R.; Dehesa, J. Discrete densities and Fisher information. In Proceedings of the 14th International Conference on Difference Equations and Applications, Instanbul, Turkey, 21–25 July 2008; Bohner, M., Ed.; Difference Equations and, Applications. Ugur–Bahçeşehir University Publishing Company: Istanbul, Turkey, 2009; pp. 291–298. [Google Scholar]
  28. Hasan, M.; Rahman, A.; Karim, M.R.; Khan, M.S.I.; Islam, M.J. Normalized approach to find optimal number of topics in Latent Dirichlet Allocation (LDA). In International Conference on Trends in Computational and Cognitive Engineering: Proceedings of TCCE 2020; Springer: Singapore, 2021; pp. 341–354. [Google Scholar] [CrossRef]
  29. Porta, A.; Bari, V.; Marchi, A.; De Maria, B.; Castiglioni, P.; di Rienzo, M.; Guzzetti, S.; Cividjian, A.; Quintin, L. Limits of permutation-based entropies in assessing complexity of short heart period variability. Physiol. Meas. 2015, 36, 755–765. [Google Scholar] [CrossRef]
  30. Pessa, A.A.; Ribeiro, H.V. Ordpy: A Python package for data analysis with permutation entropy and ordinal network methods. Chaos 2021, 31, 063110. [Google Scholar] [CrossRef] [PubMed]
  31. Timmer, J.; Koenig, M. On generating power law noise. Astron. Astrophys. 1995, 300, 707–710. [Google Scholar]
  32. Hunter, J.D. Matplotlib: A 2D Graphics Environment. Comput. Sci. Eng. 2007, 9, 90–95. [Google Scholar] [CrossRef]
  33. Waskom, M.L. Seaborn: Statistical data visualization. J. Open Source Softw. 2021, 6, 3021. [Google Scholar] [CrossRef]
  34. Jordahl, K.; Van den Bossche, J.; Fleischmann, M.; Wasserman, J.; McBride, J.; Gerard, J.; Fleischmann, M.; Tratner, J.; Perry, M.; Farmer, C.; et al. Geopandas/Geopandas: v0.8.1 (Version v0.8.1); Zenodo: Geneva, Switzerland, 2020. [Google Scholar] [CrossRef]
  35. Staniek, M.; Lehnertz, K. Parameter selection for Permutation Entropy Measurements. Int. J. Bifurc. Chaos 2007, 17, 3729–3733. [Google Scholar] [CrossRef]
Figure 1. An illustration of identifying ordinal patterns to a cryptocurrency time series (dimension D = 3 and an embedding delay τ = 1). At the top, the resultant ordinal patterns πi for D = 3 are presented. At the bottom, the methodology applied to a cryptocurrency time series with τ = 1 is found. The pattern is obtained by replacing the original values with their corresponding rankings, (adapted from [17,18]).
Entropy 27 00450 g001
Figure 2. Illustrative representation of the complexity–entropy causality plane (CECP) [13]. In the dashed line are represented the maximum and minimum boundaries for D = 5, as well in red the colored noise with the approximate identification of chaotic and stochastic zones [18].
Entropy 27 00450 g002
Figure 3. Complexity–entropy causality plane analyses for all the cryptocurrency series and noise with power spectrum frequency-varying parameter k (gray dashed line). In color blue the time series with lengths of more than two years and in green those with equal two years or less. The parameters used are D = 5 and τ = 1.
Entropy 27 00450 g003
Figure 4. Fisher information measures and permutation entropy planes for all the cryptocurrency series analyzed and noise with power spectrum frequency-varying parameter k (gray dashed line). In color blue the time series with a length of more than two years and in green those with equal two years or less. The parameters used are D = 5 and τ = 1.
Entropy 27 00450 g004
Figure 5. Box plots to compare short (equal or less than two years) and long (more than two years) cryptocurrency time series in terms of entropy, complexity and Fisher parameters. The parameters used are D = 5 and τ = 1.
Entropy 27 00450 g005
Figure 6. Complexity–entropy causality plane analyses for the cryptocurrency series divided in clusters and noise with power spectrum frequency-varying parameter k (gray dashed line). Topic 1 in color blue, Topic 2 in color green, Topic 3 in color red and Topic 4 in color orange. The parameters used are D = 5 and τ = 1.
Entropy 27 00450 g006
Figure 7. Fisher information measures and permutation entropy planes for all the cryptocurrency series analyzed and noise with power spectrum frequency-varying parameter k (gray dashed line). Topic 1 in color blue, Topic 2 in color green, Topic 3 in color red, and Topic 4 in color orange. The parameters used are D = 5 and τ = 1.
Entropy 27 00450 g007
Figure 8. Boxplots to compare the different topics clustering of the cryptocurrency time series in terms of entropy, complexity and Fisher parameters. The parameters used are D = 5 and τ = 1.
Entropy 27 00450 g008
Disclaimer/Publisher’s Note: The statements, opinions and data contained in all publications are solely those of the individual author(s) and contributor(s) and not of MDPI and/or the editor(s). MDPI and/or the editor(s) disclaim responsibility for any injury to people or property resulting from any ideas, methods, instructions or products referred to in the content.

