
Purity Assessment of Aryltetralin Lactone Lignans by Quantitative 1H Nuclear Magnetic Resonance

Abstract
: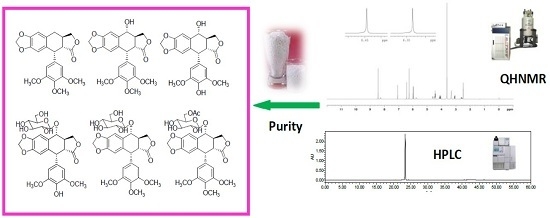
1. Introduction
2. Results and Discussion

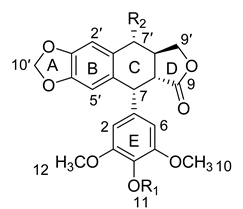
| No. | Name | Abbreviation | R1 | R2 | Formula |
|---|---|---|---|---|---|
| 1 | deoxypodophyllotoxin | DPD | CH3 | H | C22H22O7 |
| 2 | podophyllotoxin | PD | CH3 | OH | C22H22O8 |
| 3 | 4-demethylpodophyllotoxin | DMPD | H | OH | C21H20O8 |
| 4 | podophyllotoxin-7′-O-β-d-glucopyranoside | PDG | CH3 | β-d-glc | C28H32O13 |
| 5 | 4-demethylpodophyllotoxin-7′-O-β-d-glucopyranoside | DMPDG | H | β-d-glc | C27H30O13 |
| 6 | 6′′-acetyl-podophyllotoxin-7′-O-β-d-glucopyranoside | PDAG | CH3 | 6-acetyl-β-d-glc | C30H34O14 |
2.1. Method Validation
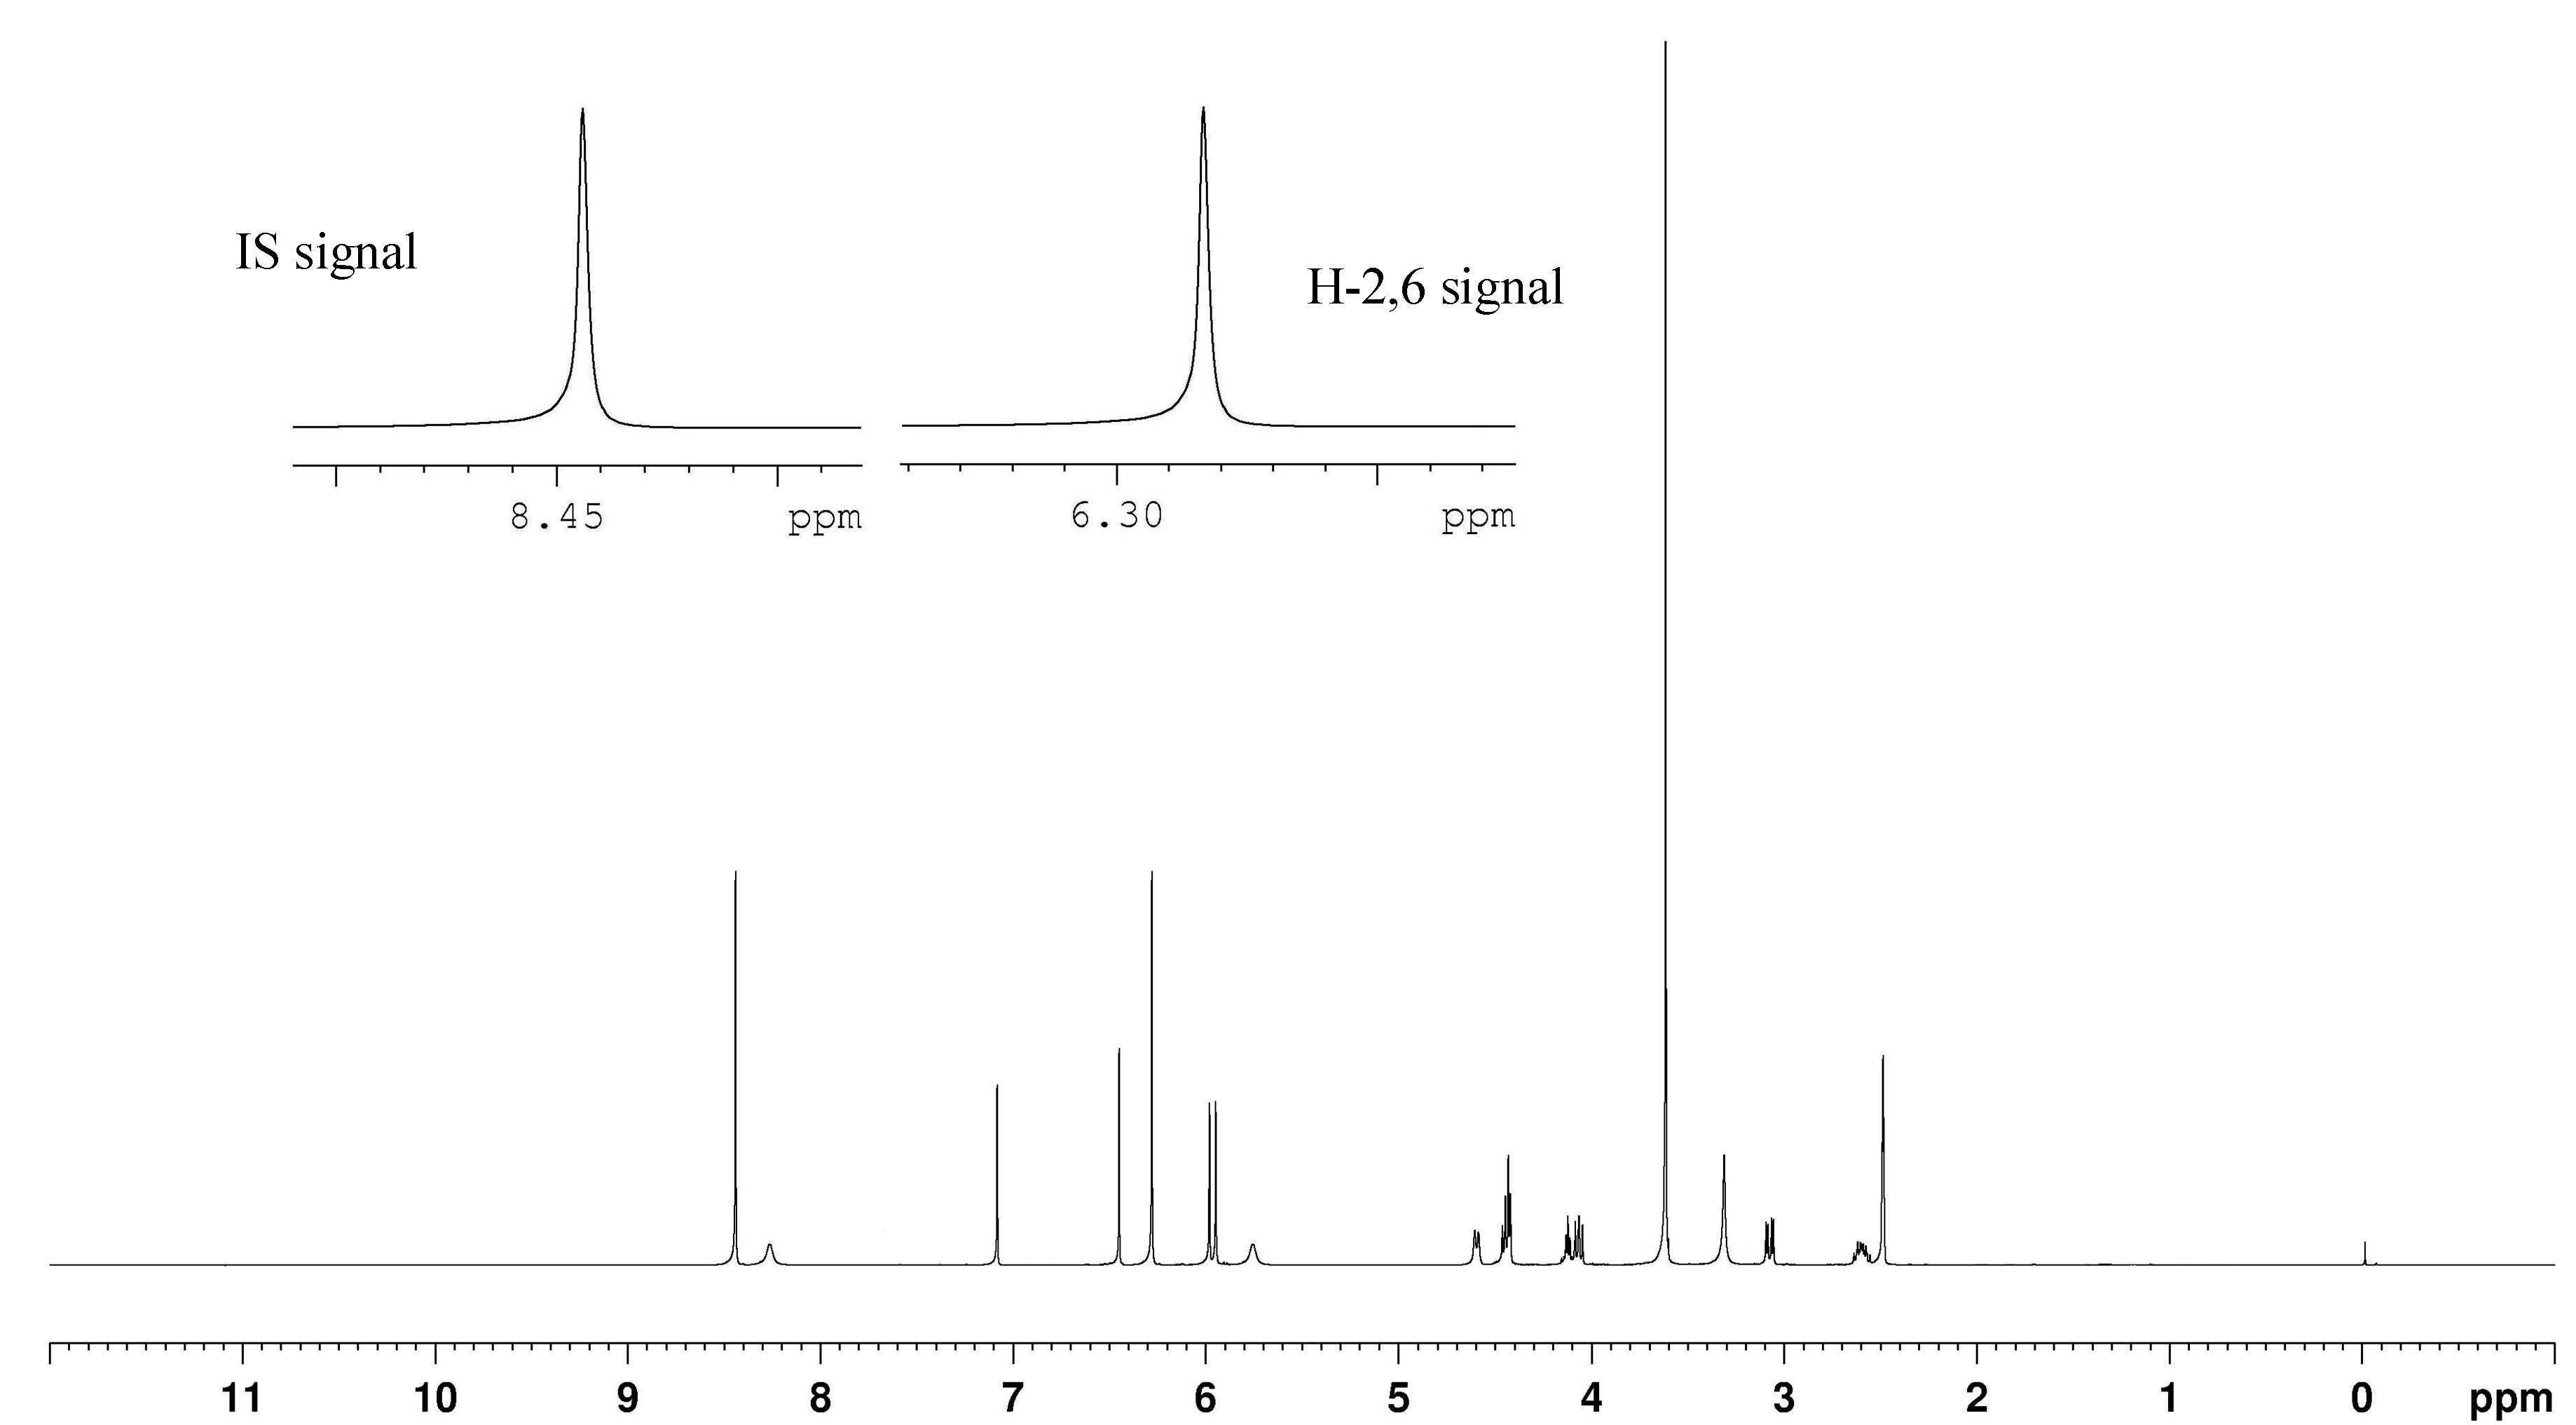
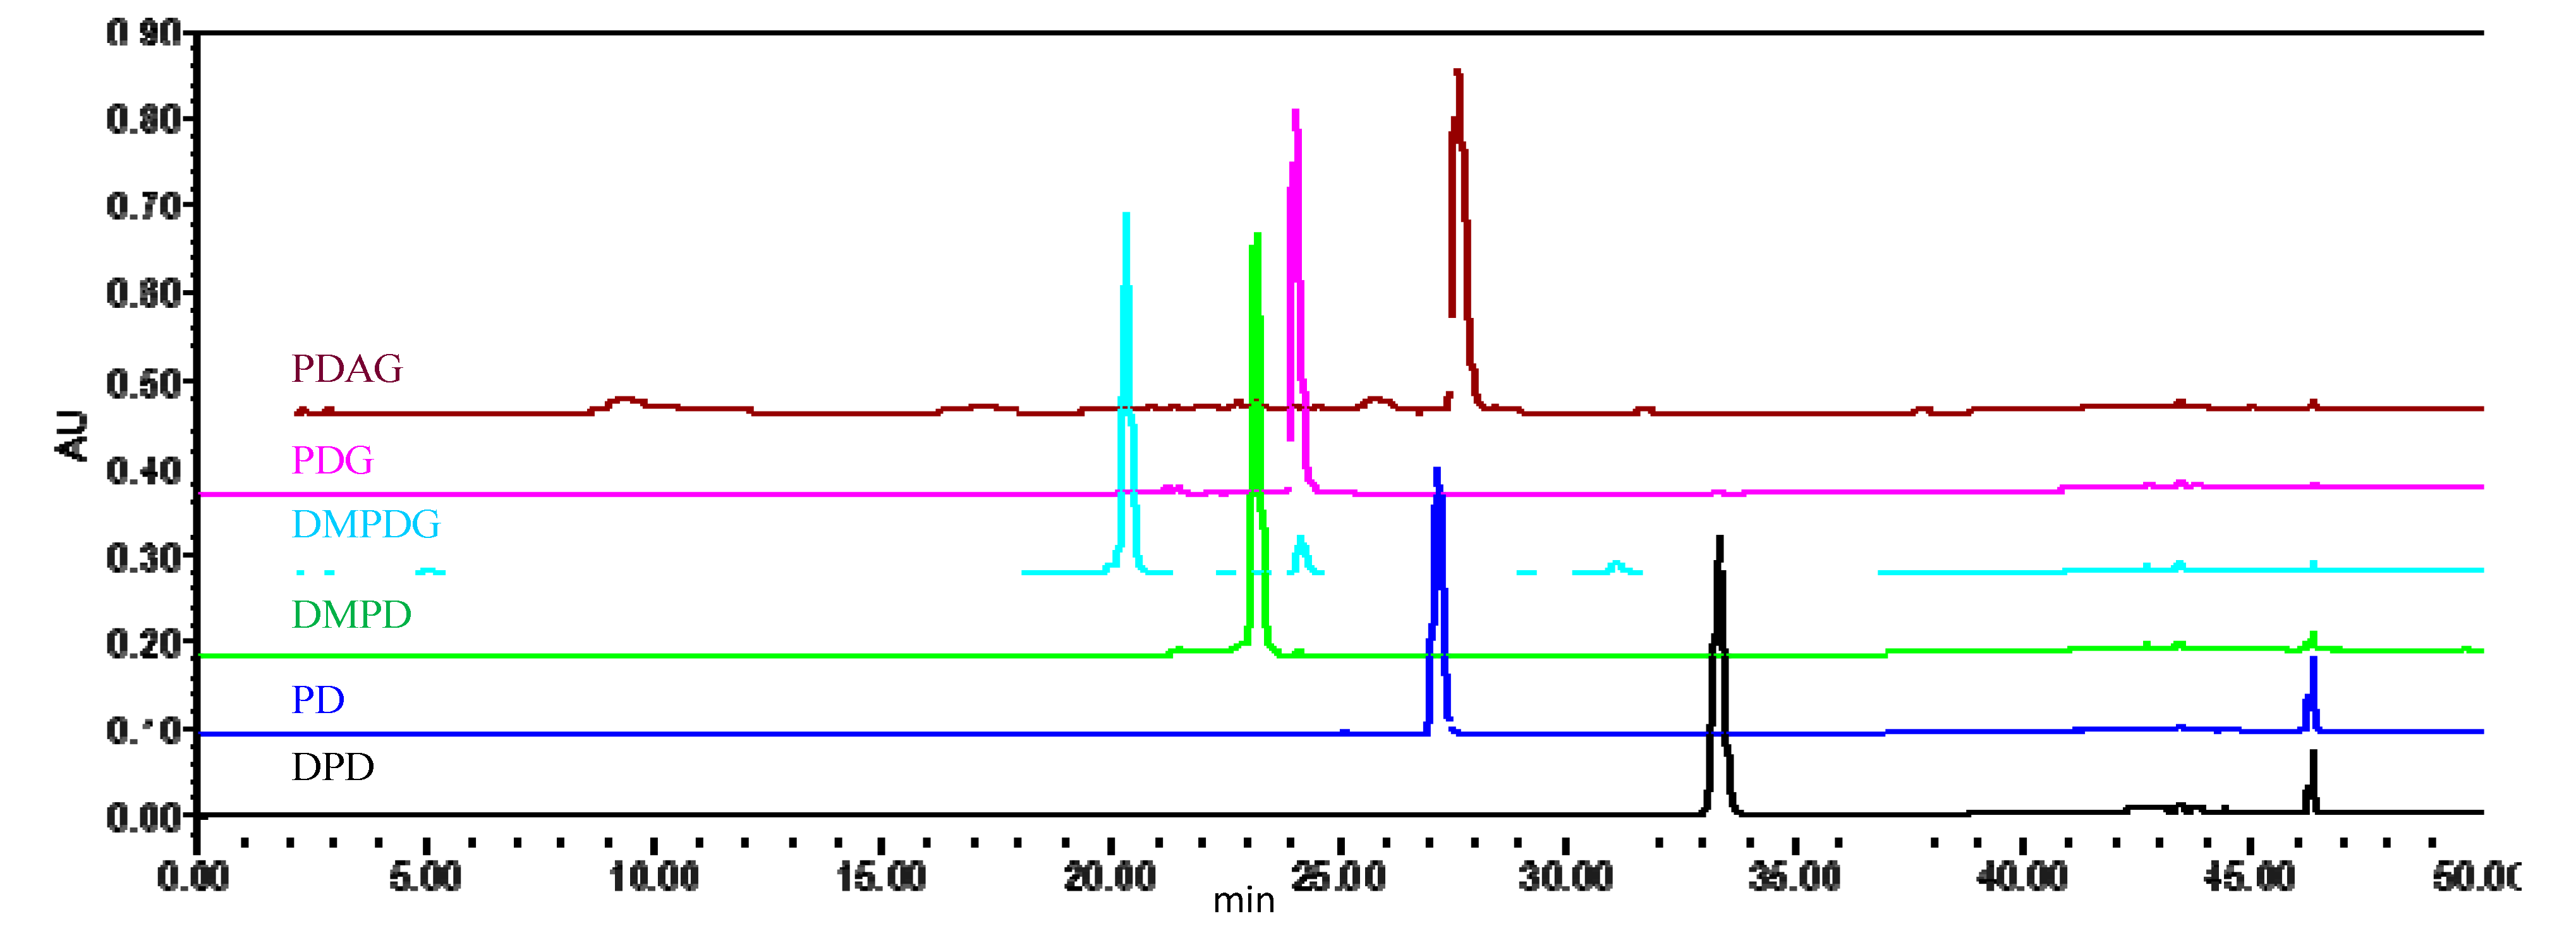
2.1.1. Specificity and Selectivity

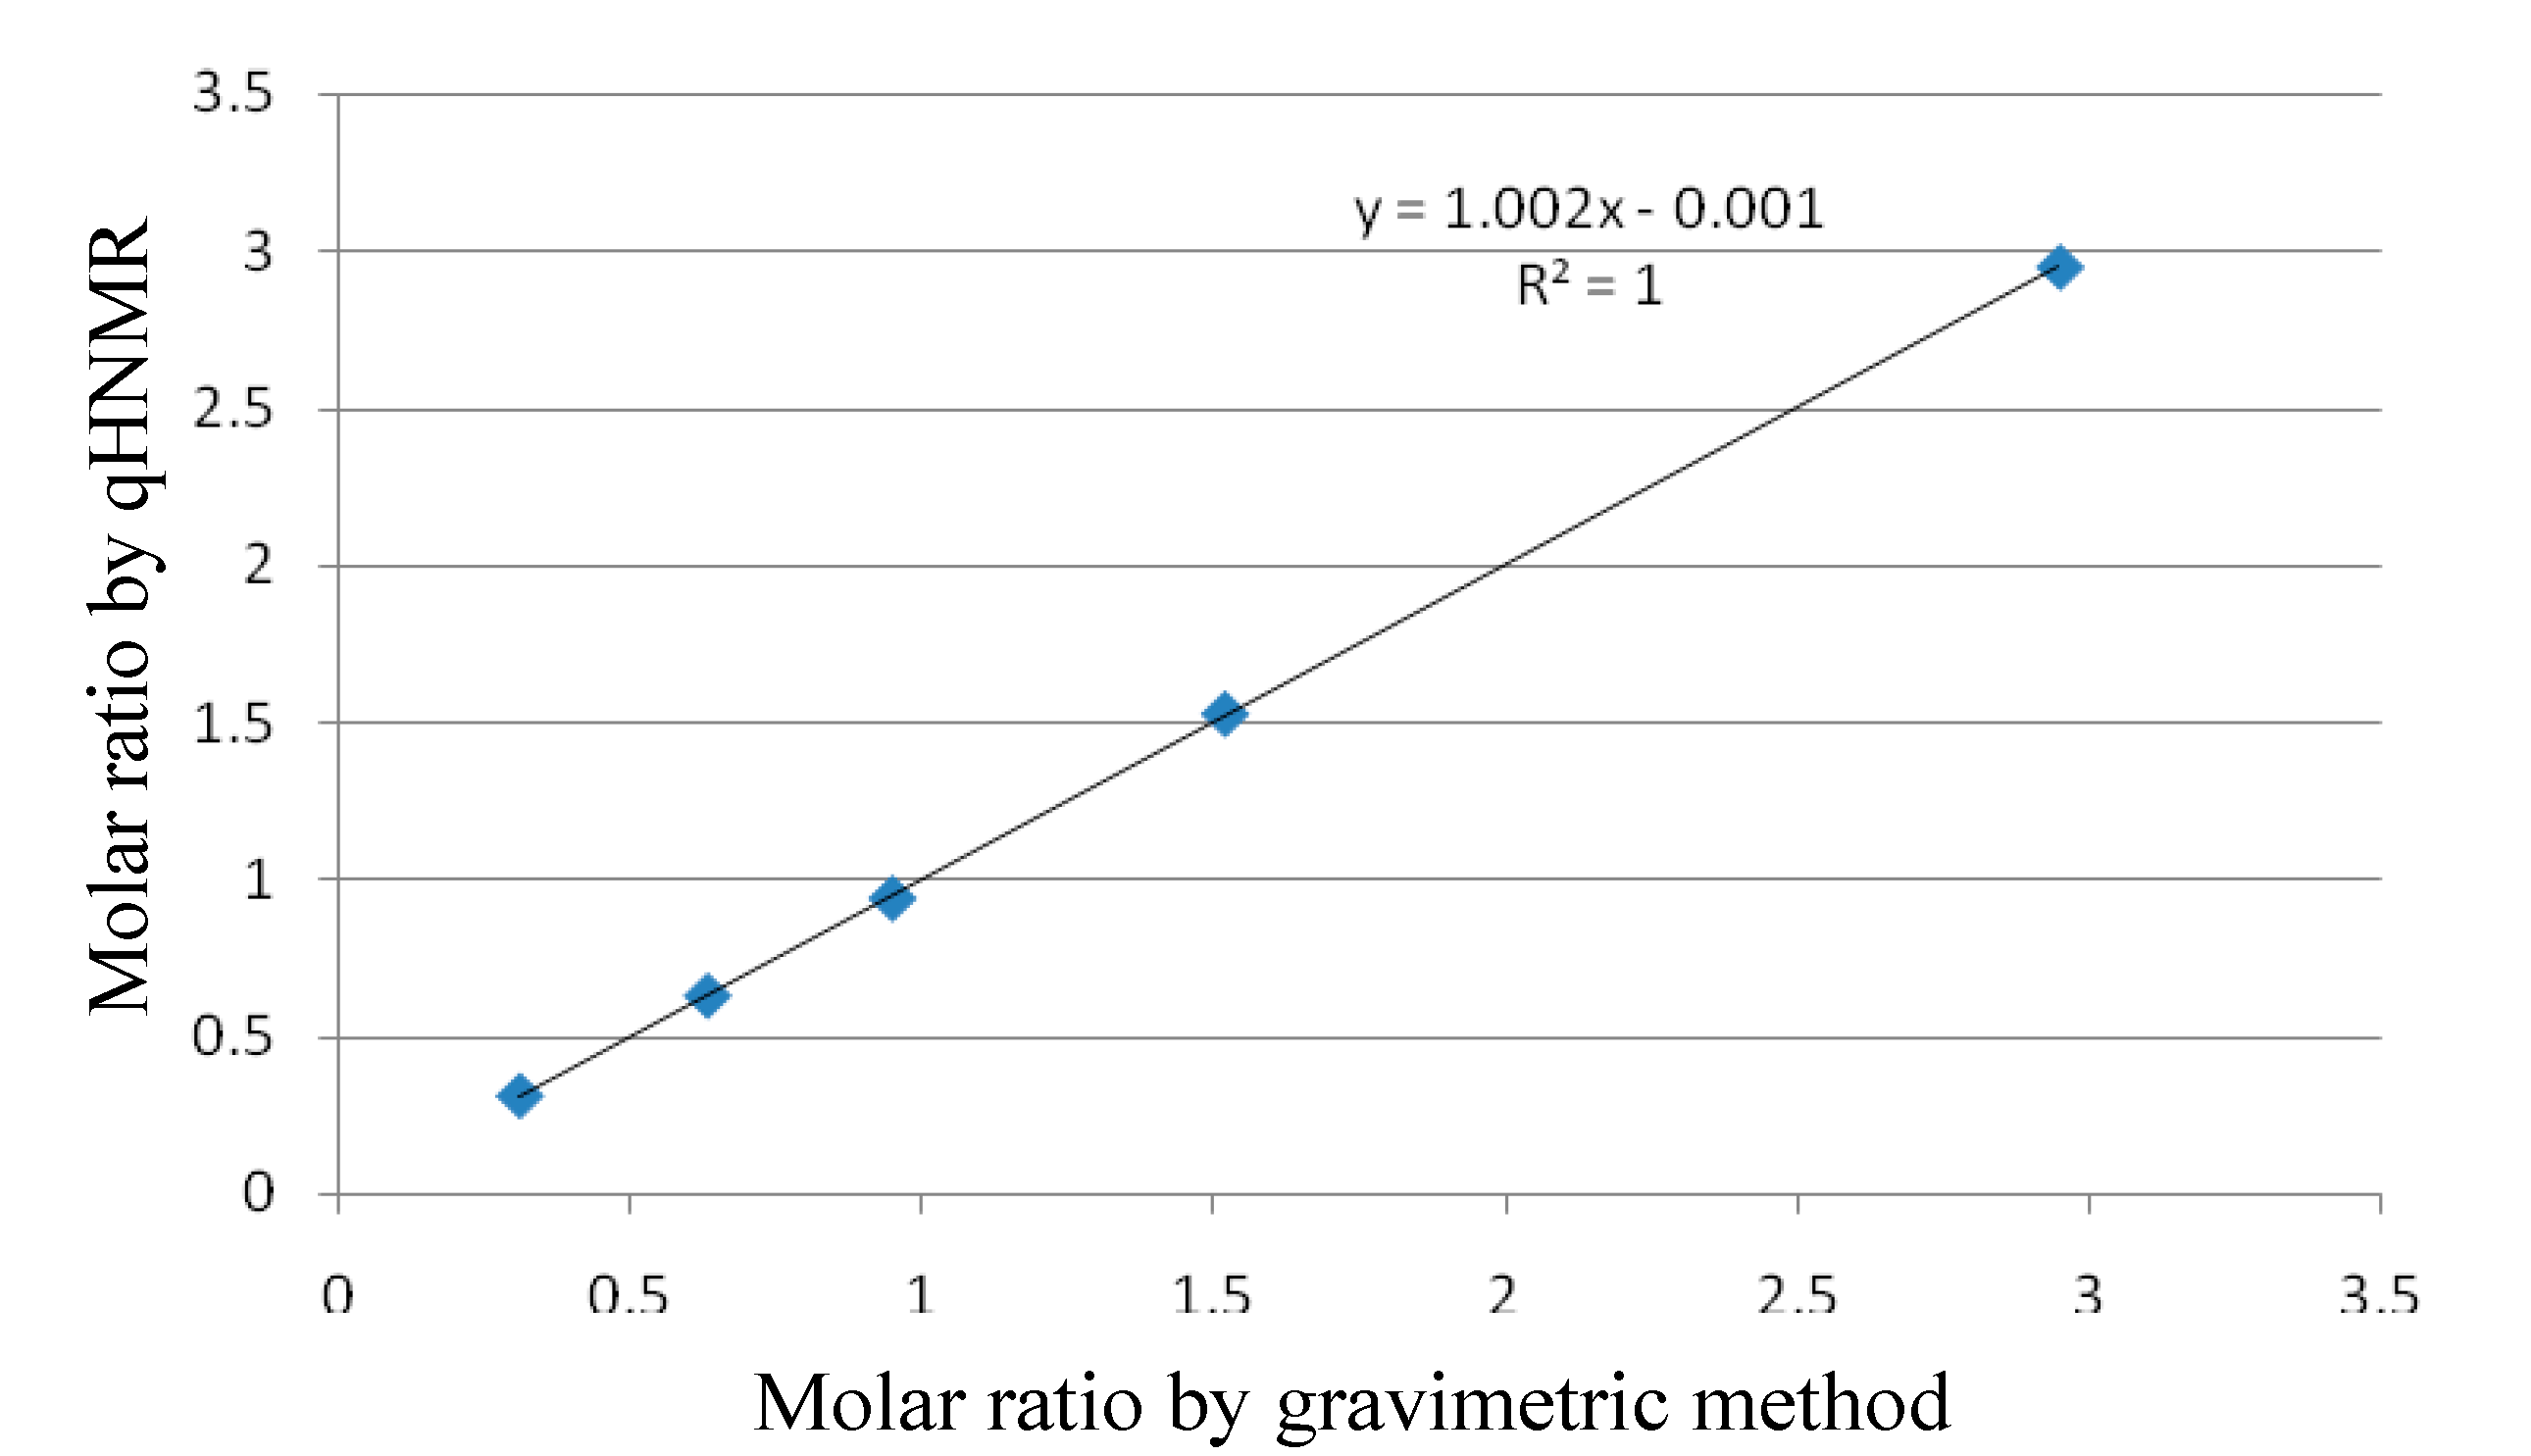
2.1.2. Linearity

| Weight of DMPD (mg) | Weight of IS (mg) | Gravimetric Molar Ratio | Molar Ratio by qHNMR |
|---|---|---|---|
| 5.87 | 1.29 | 0.946 | 0.939 |
| 3.48 | 1.15 | 0.6291 | 0.6281 |
| 1.54 | 1.04 | 0.3078 | 0.3092 |
| 8.53 | 1.17 | 1.516 | 1.527 |
| 15.45 | 1.09 | 2.947 | 2.952 |
2.1.3. Accuracy and Precision
2.1.4. Stability
2.1.5. Robustness
| Acquisition Parameters | Variation |
|---|---|
| Number of scans (NS) | 8, 16, 32, 64,128 |
| Spectral width (SW, ppm) | 10,15, 20, 25, 30 |
| Transmitter frequency offset (O1P, ppm) | 4.5, 7.39, 10.0 |
| Relaxation delay (D1, s) | 1, 2, 5, 10, 12, 14, 16, 18, 20, 30, 50 |
| Temperature (TE, K) | 293, 298, 313 |
| Pulse length for excitation (P1, μs) | 11.5, 11.78, 12.5 |
| Acquisition time (AQ, s) | 1.0, 1.4, 1.8, 2.2, 2.8, 3.2, 3.6, 4.0 |
2.2. Selection of Deuterated Solvent
2.3. Selection of Internal Standard
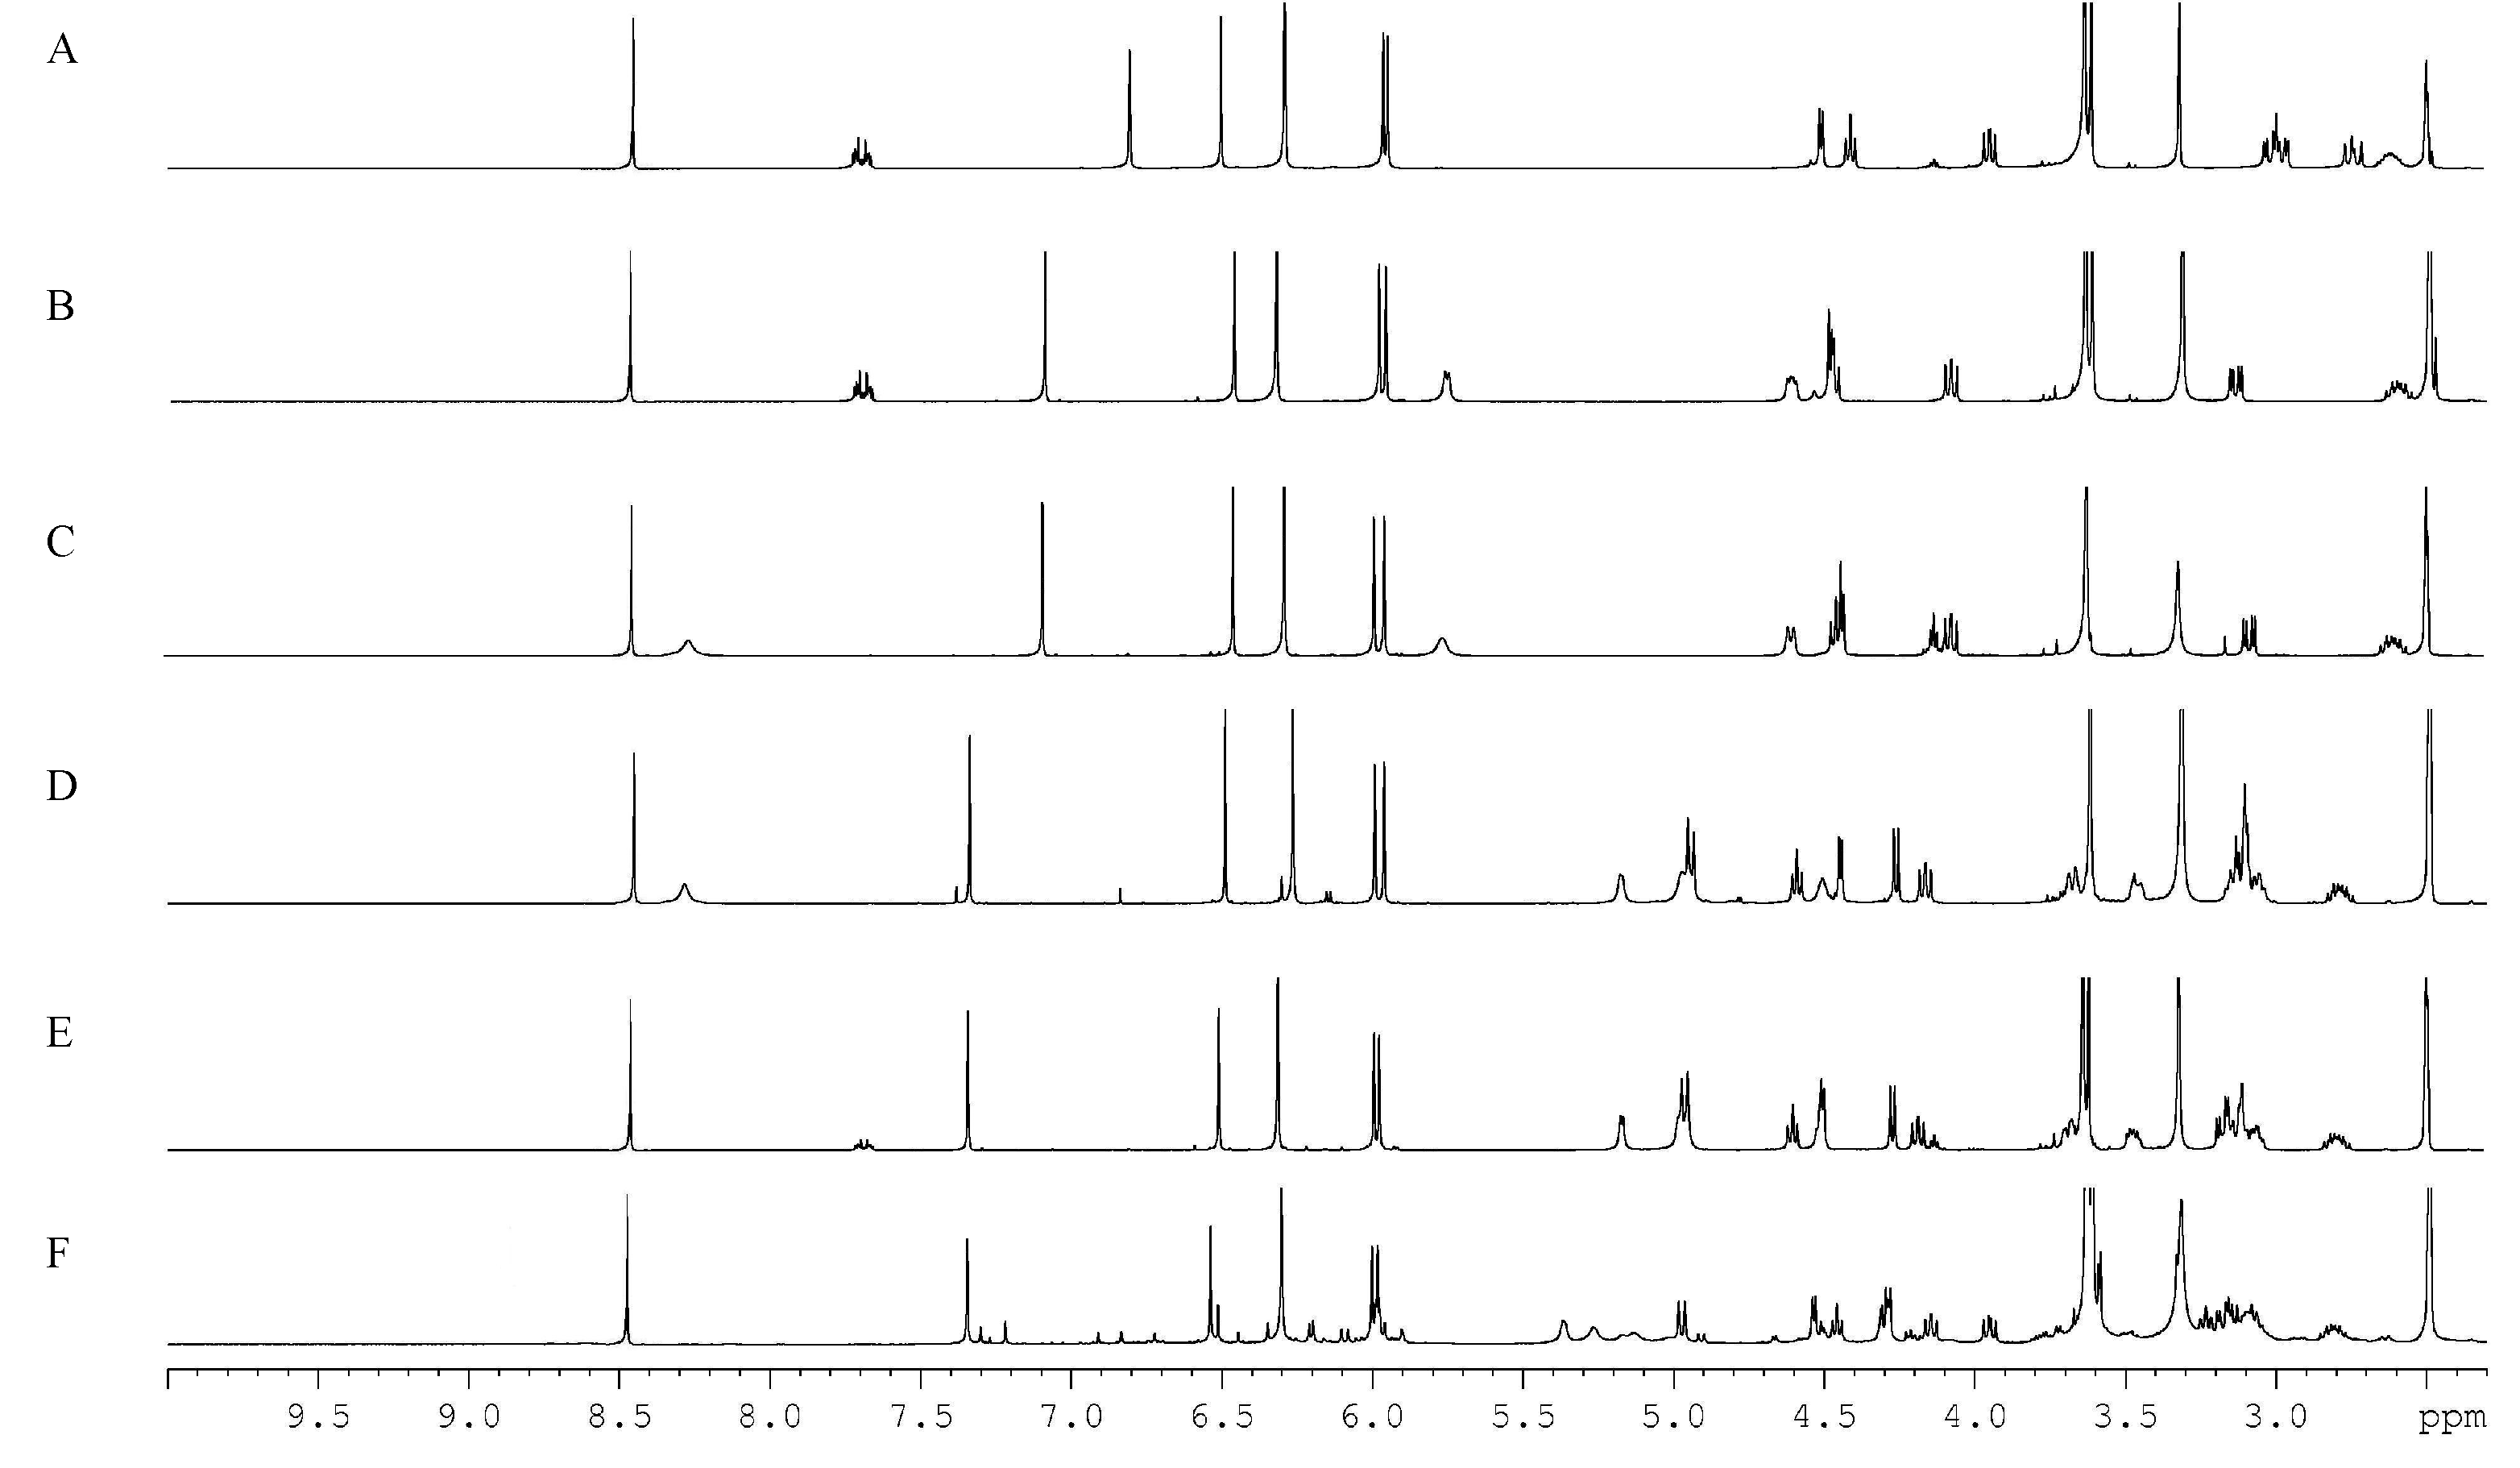
2.4. Selection of the Quantification Signals from the Target Analytes

| No. | DPD | PD | DMPD | DMPDG | PDG | PDAG |
|---|---|---|---|---|---|---|
| H-2 | 6.30, s | 6.32, s | 6.28, s | 6.26, s | 6.31, s | 6.30, s |
| H-6 | 6.30, s | 6.32, s | 6.28, s | 6.26, s | 6.31, s | 6.30, s |
| H-7 | 4.52, d, 5.0 | 4.48, d, 4.9 | 4.43, d, 5.2 | 4.45, d, 4.8 | 4.50, d, 4.8 | 4.53, d, 4.8 |
| H-8 | 2.97, dd, 5.0, 13.9 | 3.14, dd, 5.1, 14.2 | 3.08, dd, 5.1, 14.2 | 3.12, m | 3.18, dd, 4.8, 14.6 | 3.18, dd, 4.8, 14.5 |
| H-10 | 3.63, s | 3.63, s | 3.62, s | 3.62, s | 3.63, s | 3.62, s |
| H-11 | 3.60, s | 3.61, s | 3.61, s | 3.61, s | ||
| H-12 | 3.63, s | 3.63, s | 3.62, s | 3.62, s | 3.63, s | 3.62, s |
| H-2′ | 6.80 , s | 7.09 , s | 7.09 , s | 7.34 , s | 7.34 , s | 7.35, s |
| H-5′ | 6.50, s | 6.46, s | 6.45, s | 6.49, s | 6.51, s | 6.54, s |
| H-7′ | 3.01, dd, 5.2, 15.8; 2.73, dd, 11.7, 15.8 | 4.61, dd, 6.0, 9.1 | 4.60, d, 9.6 | 4.94, d, 9.7 | 4.96, d, 9.8 | 4.96, d, 10.2 |
| H-8′ | 2.61, m | 2.59, m | 2.60, m | 2.80, m | 2.79, m | 2.81, m |
| H-9′ | 4.41, t, 7.6; 3.94, dd, 8.3, 10.5 | 4.47, dd, 8.0, 8.6; 4.08, dd, 8.6, 10.5 | 4.45, dd, 7.8, 8.6; 4.07, dd, 8.6, 10.5 | 4.59, dd, 7.6, 8.6; 4.17, dd, 8.6, 10.4 | 4.60, dd, 7.7, 8.7; 4.18, dd, 8.7, 10.3 | 4.46, dd, 7.6, 8.6; 4.18, dd, 8.6, 10.2 |
| H-10′ | 5.96, s; 5.94, s | 5.98, s; 5.96, s | 5.98, d, 0.8; 5.95, d, 0.8 | 5.99, s; 5.96, s | 5.99, s; 5.97, s | 6.00, s; 5.98, s |
| H-1′′ | 4.26, d,7.7 | 4.27, d,7.7 | 4.28, d,7.5 | |||
| H-2′′ | 3.04–3.17, m | 3.04–3.18, m | 3.05–3.25, m | |||
| H-3′′ | 3.04–3.17, m | 3.04–3.18, m | 3.05–3.25, m | |||
| H-4′′ | 3.04–3.17, m | 3.04–3.18, m | 3.05–3.25, m | |||
| H-5′′ | 3.04–3.17, m | 3.04–3.18, m | 3.05–3.25, m | |||
| H-6′′ | 3.68, m; 3.47, m | 3.68, m; 3.46, m | 3.95, dd, 8.4, 11.8; 4.31, dd, 1.7, 11.8 | |||
| COCH3 | 1.63, s |
2.5. Optimization of Experiment Parameters
2.5.1. Pulse Angle and Relaxation Delay
2.5.2. Sensitivity, Scan Number and Signal-to-Noise Ratio
2.5.3. Phase Correction, Baseline Correction and Integration
2.5.4. Analysis Results by qHNMR and HPLC
| Sample | qHNMR | HPLC-UV | Difference (%) |
|---|---|---|---|
| Purity (%) | Purity (%) | ||
| DPD | 90.15 ± 0.27 | 90.78 ± 0.16 | 0.63 |
| PD | 89.53 ± 0.31 | 90.14 ± 0.29 | 0.61 |
| DMPD | 97.36 ± 0.42 | 96.51 ± 0.36 | 0.85 |
| DMPDG | 93.56 ± 0.37 | 94.61 ± 0.44 | 1.05 |
| PDG | 95.84 ± 0.26 | 96.72 ± 0.35 | 0.88 |
| PDAG | 90.38 ± 0.41 | 91.64 ± 0.52 | 1.26 |
3. Experimental Section
3.1. Reagents and Standards
3.1.1. Testing Compounds
3.1.2. Validation Standard and Internal Standard
3.1.3. Reagents
3.2. Instrument
3.3. Sample Preparations
3.3.1. Standard qHNMR Samples for Method Validation
3.3.2. Testing qHNMR Sample
3.4. Methods
3.4.1. qHNMR Method
3.4.2. HPLC-UV Method
4. Conclusions
Supplementary Materials
Acknowledgments
Author Contributions
Conflicts of Interest
References
- Jungnickel, J.L.; Forbes, J.W. Quantitative measurement of hydrogen types by integrated nuclear magnetic resonance intensities. Anal. Chem. 1963, 35, 938–942. [Google Scholar]
- Santosh, K.B.; Raja, R. Quantitative 1H-NMR spectroscopy. Trends Anal. Chem. 2012, 35, 5–26. [Google Scholar]
- Simmler, C.; Napolitano, J.G.; McAlpine, J.B.; Chen, S.N.; Pauli, G.F. Universal quantitative NMR analysis of complex natural samples. Curr. Opin. Biotechnol. 2014, 25, 51–59. [Google Scholar] [CrossRef] [PubMed]
- Ohtsuki, T.; Sato, K.; Furusho, N.; Kubota, H.; Sugimoto, N.; Akiyama, H. Absolute quantification of dehydroacetic acid in processed foods using quantitative 1H-NMR. Food Chem. 2013, 141, 1322–1327. [Google Scholar] [CrossRef] [PubMed]
- Li, C.Y.; Lin, C.H.; Wu, T.S. Quantitative analysis of camptothecin derivatives in Nothapodytes foetida using 1H-NMR Method. Chem. Pharm. Bull. 2005, 53, 347–349. [Google Scholar] [CrossRef] [PubMed]
- Li, C.Y.; Lu, H.J.; Lin, C.H.; Wu, T.S. A rapid and simple determination of protoberberine alkaloids in cortex phellodendri by 1H-NMR and its application for quality control of commercial traditional Chinese medicine prescriptions. J. Pharm. Biomed. Anal. 2006, 40, 173–178. [Google Scholar] [CrossRef] [PubMed]
- López-Rituerto, E.; Cabredo, S.; López, M.; Avenoza, A.; Busto, J.H.; Peregrina, J.M. A thorough study on the use of quantitative 1H-NMR in Rioja red wine fermentation processes. J. Agric. Food. Chem. 2009, 57, 2112–2118. [Google Scholar] [CrossRef] [PubMed]
- Pauli, G.F. QHNMR—A versatile concept for the validation of natural product reference compounds. Phytochem. Anal. 2001, 12, 28–42. [Google Scholar] [CrossRef]
- Li, Z.Y.; Welbeck, E.; Yang, L.; He, C.Y.; Hu, H.J.; Song, M.; Bi, K.S.; Wang, Z.T. A quantitative 1H nuclear magnetic resonance (qHNMR) method for assessing the purity of iridoids and secoiridoids. Fitoterapia 2015, 100, 187–194. [Google Scholar] [CrossRef] [PubMed]
- Liu, N.Q.; Choi, Y.H.; Verpoorte, R.; van der Kooy, F. Comparative quantitative analysis of artemisinin by chromatography and qNMR. Phytochem. Anal. 2010, 12, 451–456. [Google Scholar] [CrossRef] [PubMed]
- Tada, A.; Takahashi, K.; Ishizuki, K.; Sugimoto, N.; Suematsu, T.; Arifuku, K.; Tahara, M.; Akiyama, T.; Ito, Y.; Yamazaki, T.; et al. Absolute quantitation of stevioside and rebaudioside A in commercial standards by quantitative NMR. Chem. Pharm. Bull. 2013, 61, 33–38. [Google Scholar] [CrossRef] [PubMed]
- Sun, Y.J.; Li, Z.L.; Chen, H.; Liu, X.Q.; Zhou, W.; Hua, H.M. Three new cytotoxic aryltetralin lignans from Sinopodophyllum emodi. Bioorg. Med. Chem. Lett. 2011, 21, 3794–3797. [Google Scholar] [CrossRef] [PubMed]
- Zhao, C.; Cao, W.; Nagatsu, A.; Ogihara, Y. Three new glycosides from Sinopodophyllum emodi (Wall.) Ying. Chem. Pharm. Bull. 2001, 49, 1474–1476. [Google Scholar] [CrossRef] [PubMed]
- Sun, Y.J.; Li, Z.L.; Chen, H.; Zhou, W.; Hua, H.M. Advances in studies on chemical constituents of podophyllum taxa and their bioactivities. Chin. Tradit. Herb. Drug 2012, 43, 1626–1634. [Google Scholar]
- Lim, C.K. Analysis of aryltetrahydronaphthalene lignans and their glucoside conjugates in podophyllin resin by high-performance liquid chromatography. J. Chromatogr. A 1996, 722, 267–271. [Google Scholar] [CrossRef]
- Liu, S.; Tian, X.; Chen, X.; Hu, Z. Separation and determination of podophyllum lignans by micellar electrokinetic chromatography. J. Chromatogr. A 2001, 928, 109–115. [Google Scholar] [CrossRef]
- Holzgrabe, U.; Malet-Martino, M. Analytical challenges in drug counterfeiting and falsification-The NMR approach. J. Pharm. Biomed. Anal. 2011, 55, 679–687. [Google Scholar] [CrossRef] [PubMed]
- Liang, X.; Du, L.; Su, F.; Parekh, H.S.; Su, W. The application of quantitative NMR for the facile, rapid and reliable determination of clindamycin phosphate in a conventional tablet formulation. Magn. Reson. Chem. 2014, 52, 178–182. [Google Scholar] [CrossRef] [PubMed]
- Li, Z.Y.; Welbeck, E.; Wang, R.F.; Liu, Q.; Yang, Y.B.; Chou, G.X.; Bi, K.S.; Wang, Z.T. A universal quantitative 1H nuclear magnetic resonance (qHNMR) method for assessing the purity of dammarane-type ginsenosides. Phytochem. Anal. 2015, 26, 8–14. [Google Scholar] [CrossRef] [PubMed]
- Rundlöf, T.; Mathiasson, M.; Bekirogu, S.; Hakkarainen, B.; Bowden, T.; Arvidsson, T. Survey and qualification of internal standards for quantification by 1H-NMR spectroscopy. J. Pharm. Biomed. Anal. 2010, 52, 645–651. [Google Scholar] [CrossRef] [PubMed]
- Wu, Y.; He, Y.; He, W.; Zhang, Y.; Lu, J.; Dai, Z.; Ma, S.; Lin, R. Application of quantitative 1H-NMR for the calibration of protoberberine alkaloid reference standards. J. Pharm. Biomed. Anal. 2014, 90, 92–97. [Google Scholar] [CrossRef] [PubMed]
- Holzgrabe, U. Quantitative NMR spectroscopy in pharmaceutical applications. Prog. Nucl. Magn. Reson. Spectrosc. 2010, 57, 229–240. [Google Scholar] [CrossRef] [PubMed]
- Pauli, G.F.; Chen, S.N.; Simmler, C.; Lankin, D.C.; Gödecke, T.; Jaki, B.U.; Friesen, J.B.; McAlpine, J.B.; Napolitano, J.G. Importance of purity evaluation and the potential of quantitative 1H-NMR as a purity assay. J. Med. Chem. 2014, 57, 9220–9231. [Google Scholar] [CrossRef] [PubMed]
- Samples Availability: Samples of the compounds are available from the authors.
© 2015 by the authors. Licensee MDPI, Basel, Switzerland. This article is an open access article distributed under the terms and conditions of the Creative Commons Attribution license ( http://creativecommons.org/licenses/by/4.0/).
Share and Cite
Sun, Y.-J.; Zhang, Y.-L.; Wang, Y.; Wang, J.-M.; Zhao, X.; Gong, J.-H.; Gao, W.; Guan, Y.-B. Purity Assessment of Aryltetralin Lactone Lignans by Quantitative 1H Nuclear Magnetic Resonance. Molecules 2015, 20, 9671-9685. https://doi.org/10.3390/molecules20069671
Sun Y-J, Zhang Y-L, Wang Y, Wang J-M, Zhao X, Gong J-H, Gao W, Guan Y-B. Purity Assessment of Aryltetralin Lactone Lignans by Quantitative 1H Nuclear Magnetic Resonance. Molecules. 2015; 20(6):9671-9685. https://doi.org/10.3390/molecules20069671
Chicago/Turabian StyleSun, Yan-Jun, Yan-Li Zhang, Yu Wang, Jun-Min Wang, Xuan Zhao, Jian-Hong Gong, Wei Gao, and Yan-Bin Guan. 2015. "Purity Assessment of Aryltetralin Lactone Lignans by Quantitative 1H Nuclear Magnetic Resonance" Molecules 20, no. 6: 9671-9685. https://doi.org/10.3390/molecules20069671