1. Introduction
Recently, nanoparticles have attracted the interest of scientists in various areas of biomedical research because of their unique properties. Nanoparticles of iron oxide, such as Fe
3O
4 and γ-Fe
2O
3, have been reported to be applicable as a material for use in drug delivery systems, magnetic resonance imaging [
1], cancer therapy, and other fields. A potentially promising member of the family of iron oxides, maghemite (Fe(II)-deficient magnetite), allows the manufacture of nanoparticles that are biocompatible and non-toxic to living organisms. Maghemite nanoparticles can be introduced to living cells and their magnetic properties allow remote manipulation with external magnetic fields [
2,
3]; specific separation of cells from blood or mixed cell culture; inducing hyperthermia for selective destruction of cancer cells [
4]; and delivery of pharmacoactive compounds or genes, and their selective activation by external stimuli [
5]. Recently, cell labelling by superparamagnetic iron oxygen (SPIO) nanoparticles has also been used for cell tracking in vitro or in vivo. Multimodal probes based on SPIO nanoparticles may serve for cell detection and cell tracking via complementary contrast in light absorption or fluorescence. SPIO nanoparticles have also attracted much consideration for the possibility of replacing cytosolic or membrane probes, which are used in fluorescent confocal microscopy and microscopic time-lapse experiments due to their long-term chemical stability and photostability [
6].
Rhodamine-derived superparamagnetic maghemite nanoparticles (SAMN-R) display relatively high uptake by mammalian cells, very good stability in intracellular spaces, and long-term stability of their rhodamine fluorescence shell in intracellular space with a specific pH. SAMN-R have been previously tested on rat, rabbit and human stem cells, and are presented as a robust cell marker, a long-term stable probe for deposition in lysosomes, a probe that does not affect nuclei, and a probe with theranostic potential [
7,
8].
The main aim of this article is to expand on cell labelling experiments and refocus from the basic tests of acute toxicity and contrast properties to advanced evaluation of their interactions with mesenchymal stromal cells (MSCs) and fibroblasts, as well as evaluating their influence on the migration potential of cells. Fibroblasts and MSCs play a key role in regenerative medicine, especially in the regeneration of the dermis, chondral intercostal muscles, and other tissues for their motility and migration ability [
9,
10,
11]. Thus, further investigation of SAMN-R properties will potentially bring new insight into the possibility of future biomedical applications.
3. Discussion
Fibroblasts and mesenchymal stem cells have prominent status in the hierarchy of mammal cells. Fibroblasts are one of the most populous and important cells of connective tissue, and play the crucial role in normal pre- and postnatal organ development. They represent key components for wound healing and the occurrence of tumors. MSCs are relatively more latent cells in normal development; however, their effective migration, proliferation, and interaction with other cell types are essential in the critical time after tissue scarring or ischemic events, when wound healing and correction of abnormal immune reactions begins. Unfortunately, fibroblasts and MSCs could be negatively affected by modern cell markers, cell labels, or labelling nanoparticles [
22,
23].
The negative effect of markers and nanoparticles may occur a short time after their application. Such markers and nanoparticles with acute toxicity cause visible rapid morphological changes and cells rapidly die. Markers and nanoparticles, that can be seemingly non-toxic, may have a hidden long-term negative effect that can manifest after several days. Moreover, the effect need not necessarily lead to apoptosis of the cell, but rather to the abnormal production of certain factors in the cell (e.g., reactive oxygen) or to altered metabolism or cell motility.
We have focused on the evaluation of the abovementioned hidden long-term effects after the application of SAMN-R to cells. Acute toxicity and critical concentration/dose for immediate effective marking of cells were described in our previous studies [
7,
8].
In the majority of publications dealing with the toxicity of nanoparticles, the authors take as a standard measure the absolute concentration of the nanoparticles in a given cultivation medium presuming colloidal stability of nanoparticle suspension. However, there is a certain agglomeration rate and sedimentation rate dependent on particles’ concentration even in case of almost ideally colloidal particle suspensions [
24]. With regard to increasing concerns about the health risks of nanoparticles, we propose to define concentrations of each used solution in µg·mL
−1 with a value of a dose in µg·cm
−2 per area of the dish with medium, although an increase of particles’ concentration in the microenvironment of cells does not exceed 10% (data not shown).
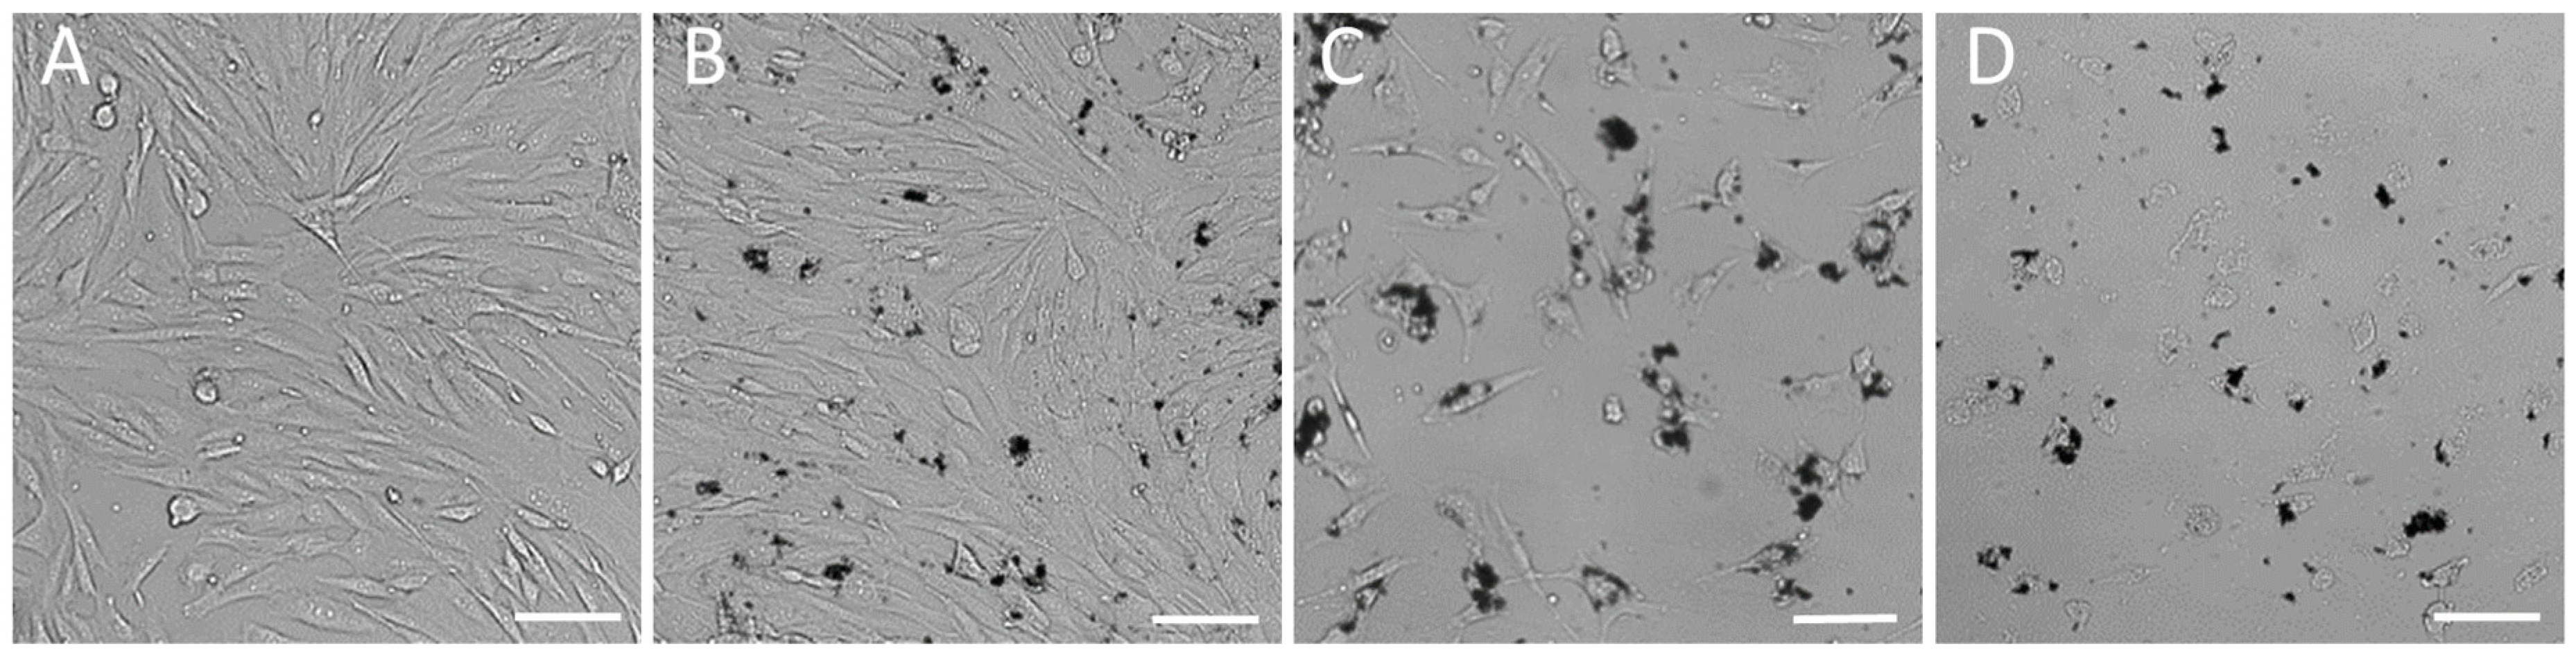
The first set of experiments included cultivation of fibroblasts at the bottom of standard in vitro dishes treated with SAMN-R. The used SAMN-R treatment solutions were prepared in a gradient series. Nanoparticles were diluted in a cultivation medium, and a colloid profile of solution was prepared by 20 min of ultrasound exposure immediately before cell incubation. The used absolute concentrations were 0, 10, 20, 30, 40, 50, 60, and 70 µg·mL
−1, which corresponded to doses of 0, 5, 10, 15, 20, 25, 30, and 35 µg·cm
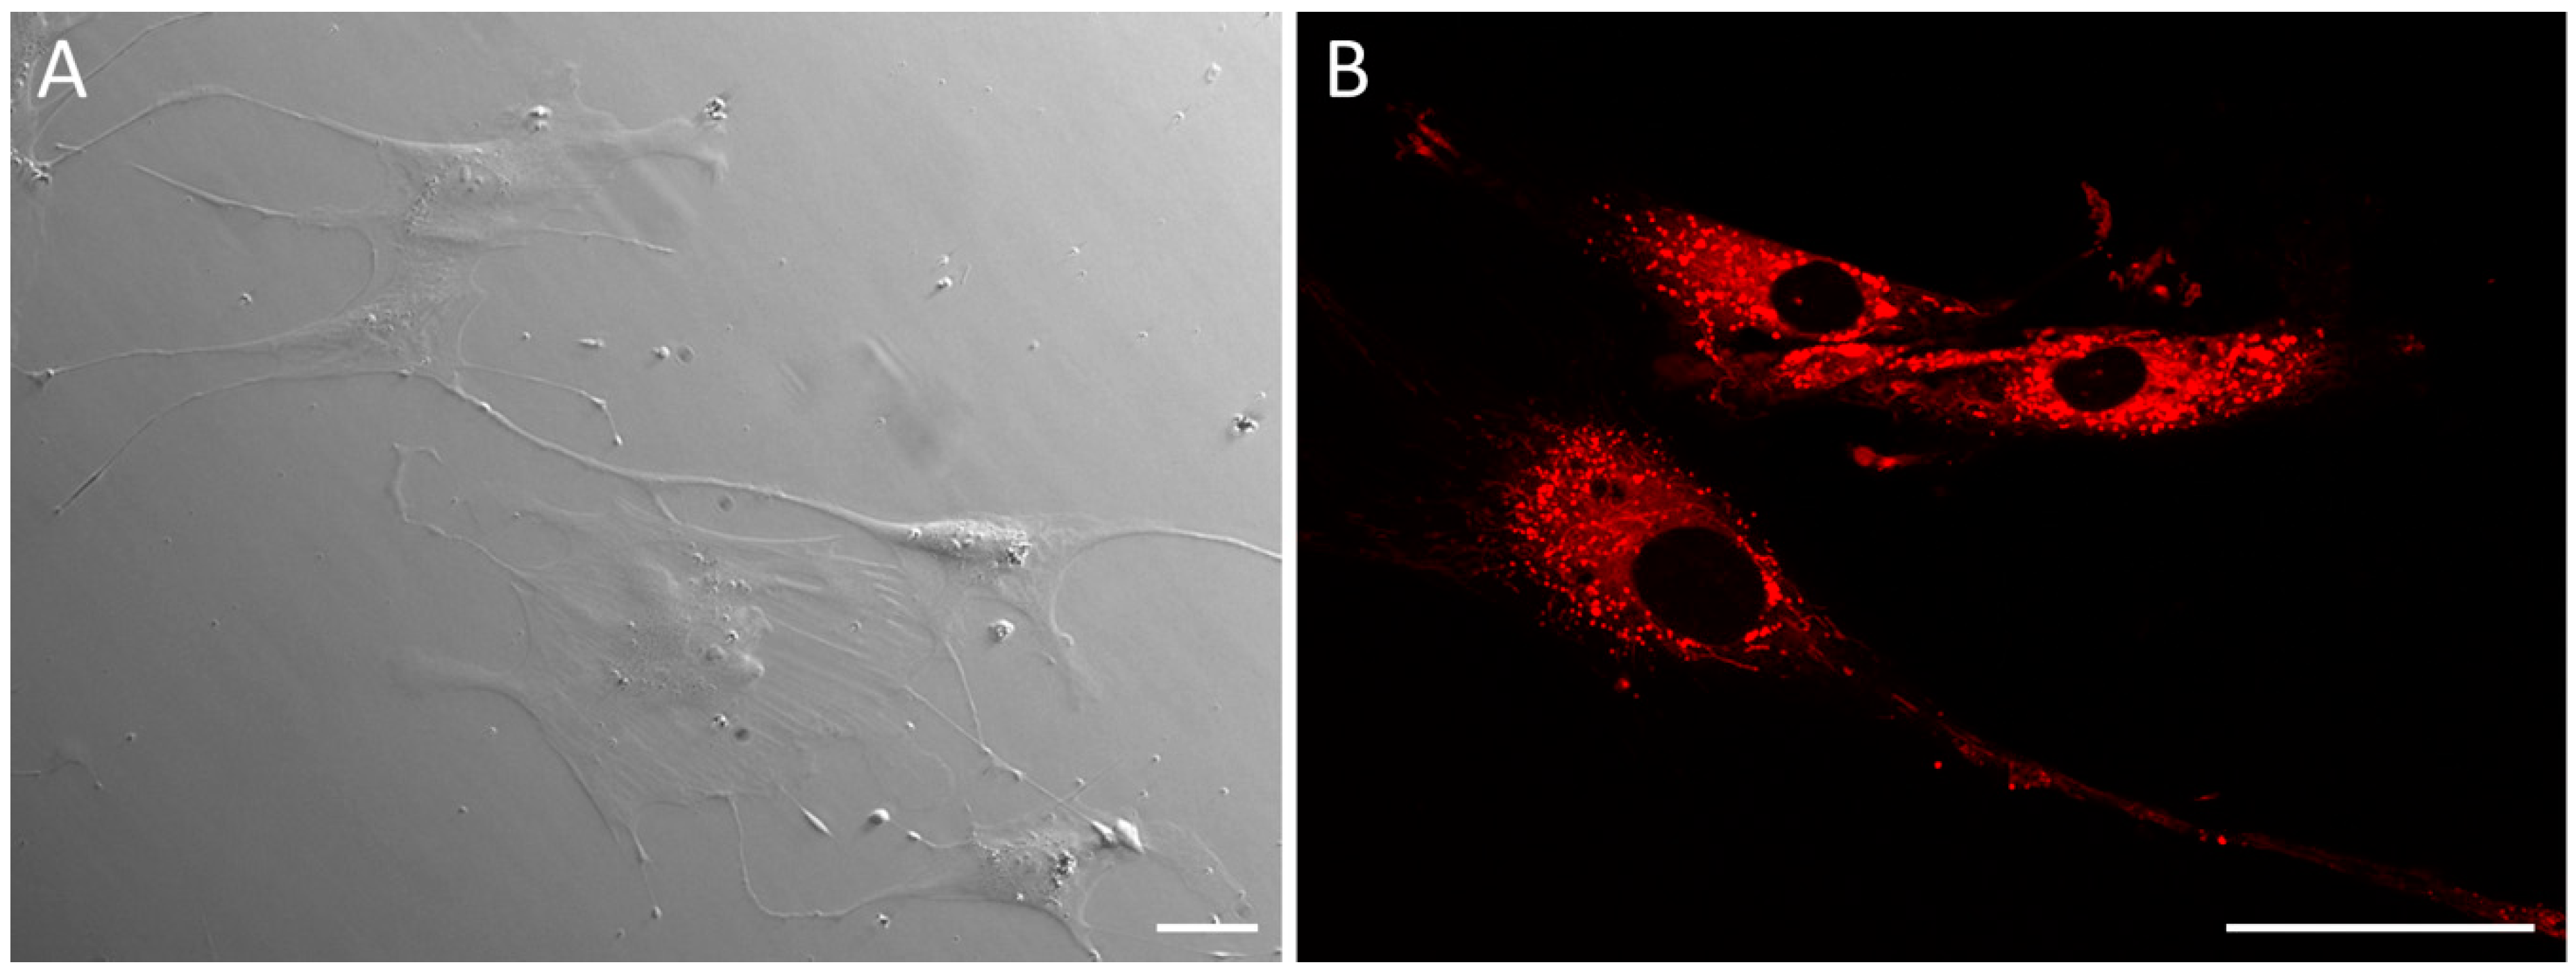
−2 per area of the dish. The effects of different doses of SAMN-R were evaluated after 24 h of incubation. Cell cultures with a dose of SAMN-R up to 20 µg·cm
−2 did not display a difference in comparison to control cells. These doses of SAMN-R under 20 µg·cm
−2 did not induce visible changes in cell shape and membrane integrity (see
Figure 2A,B). With increasing doses above 20 µg·cm
−2, we noticed a decline of cell proliferation ability and the appearance of necrotic and detached cells (see
Figure 2C,D). Flow cytometry analysis showed that cell morphology and cell size were not changed for this SAMN-R concentration range. Another cell culture up to 20 µg·cm
−2 SAMN-R dose displayed cell detachment or inhibited cell growth. The value 20 μg·cm
−2 was also detected as being critical for 3T3 and MSCs; the ratio of events of cell detachment and inhibition of cell growth was similar.
Cells utilize two main migration modes in mammals: single-cell migration and collective migration. The single-cell migration is characteristic for immune cells or MSCs after some injuries. Collective migration is particularly important in tissue shaping and wound healing, such as epithelial regeneration or fibroblast closure of wounds. Both modes can be affected by present nanoparticles, and several previously published articles warn of some types of nanoparticles which could potentially induce negative affecting of these processes [
25,
26,
27,
28].
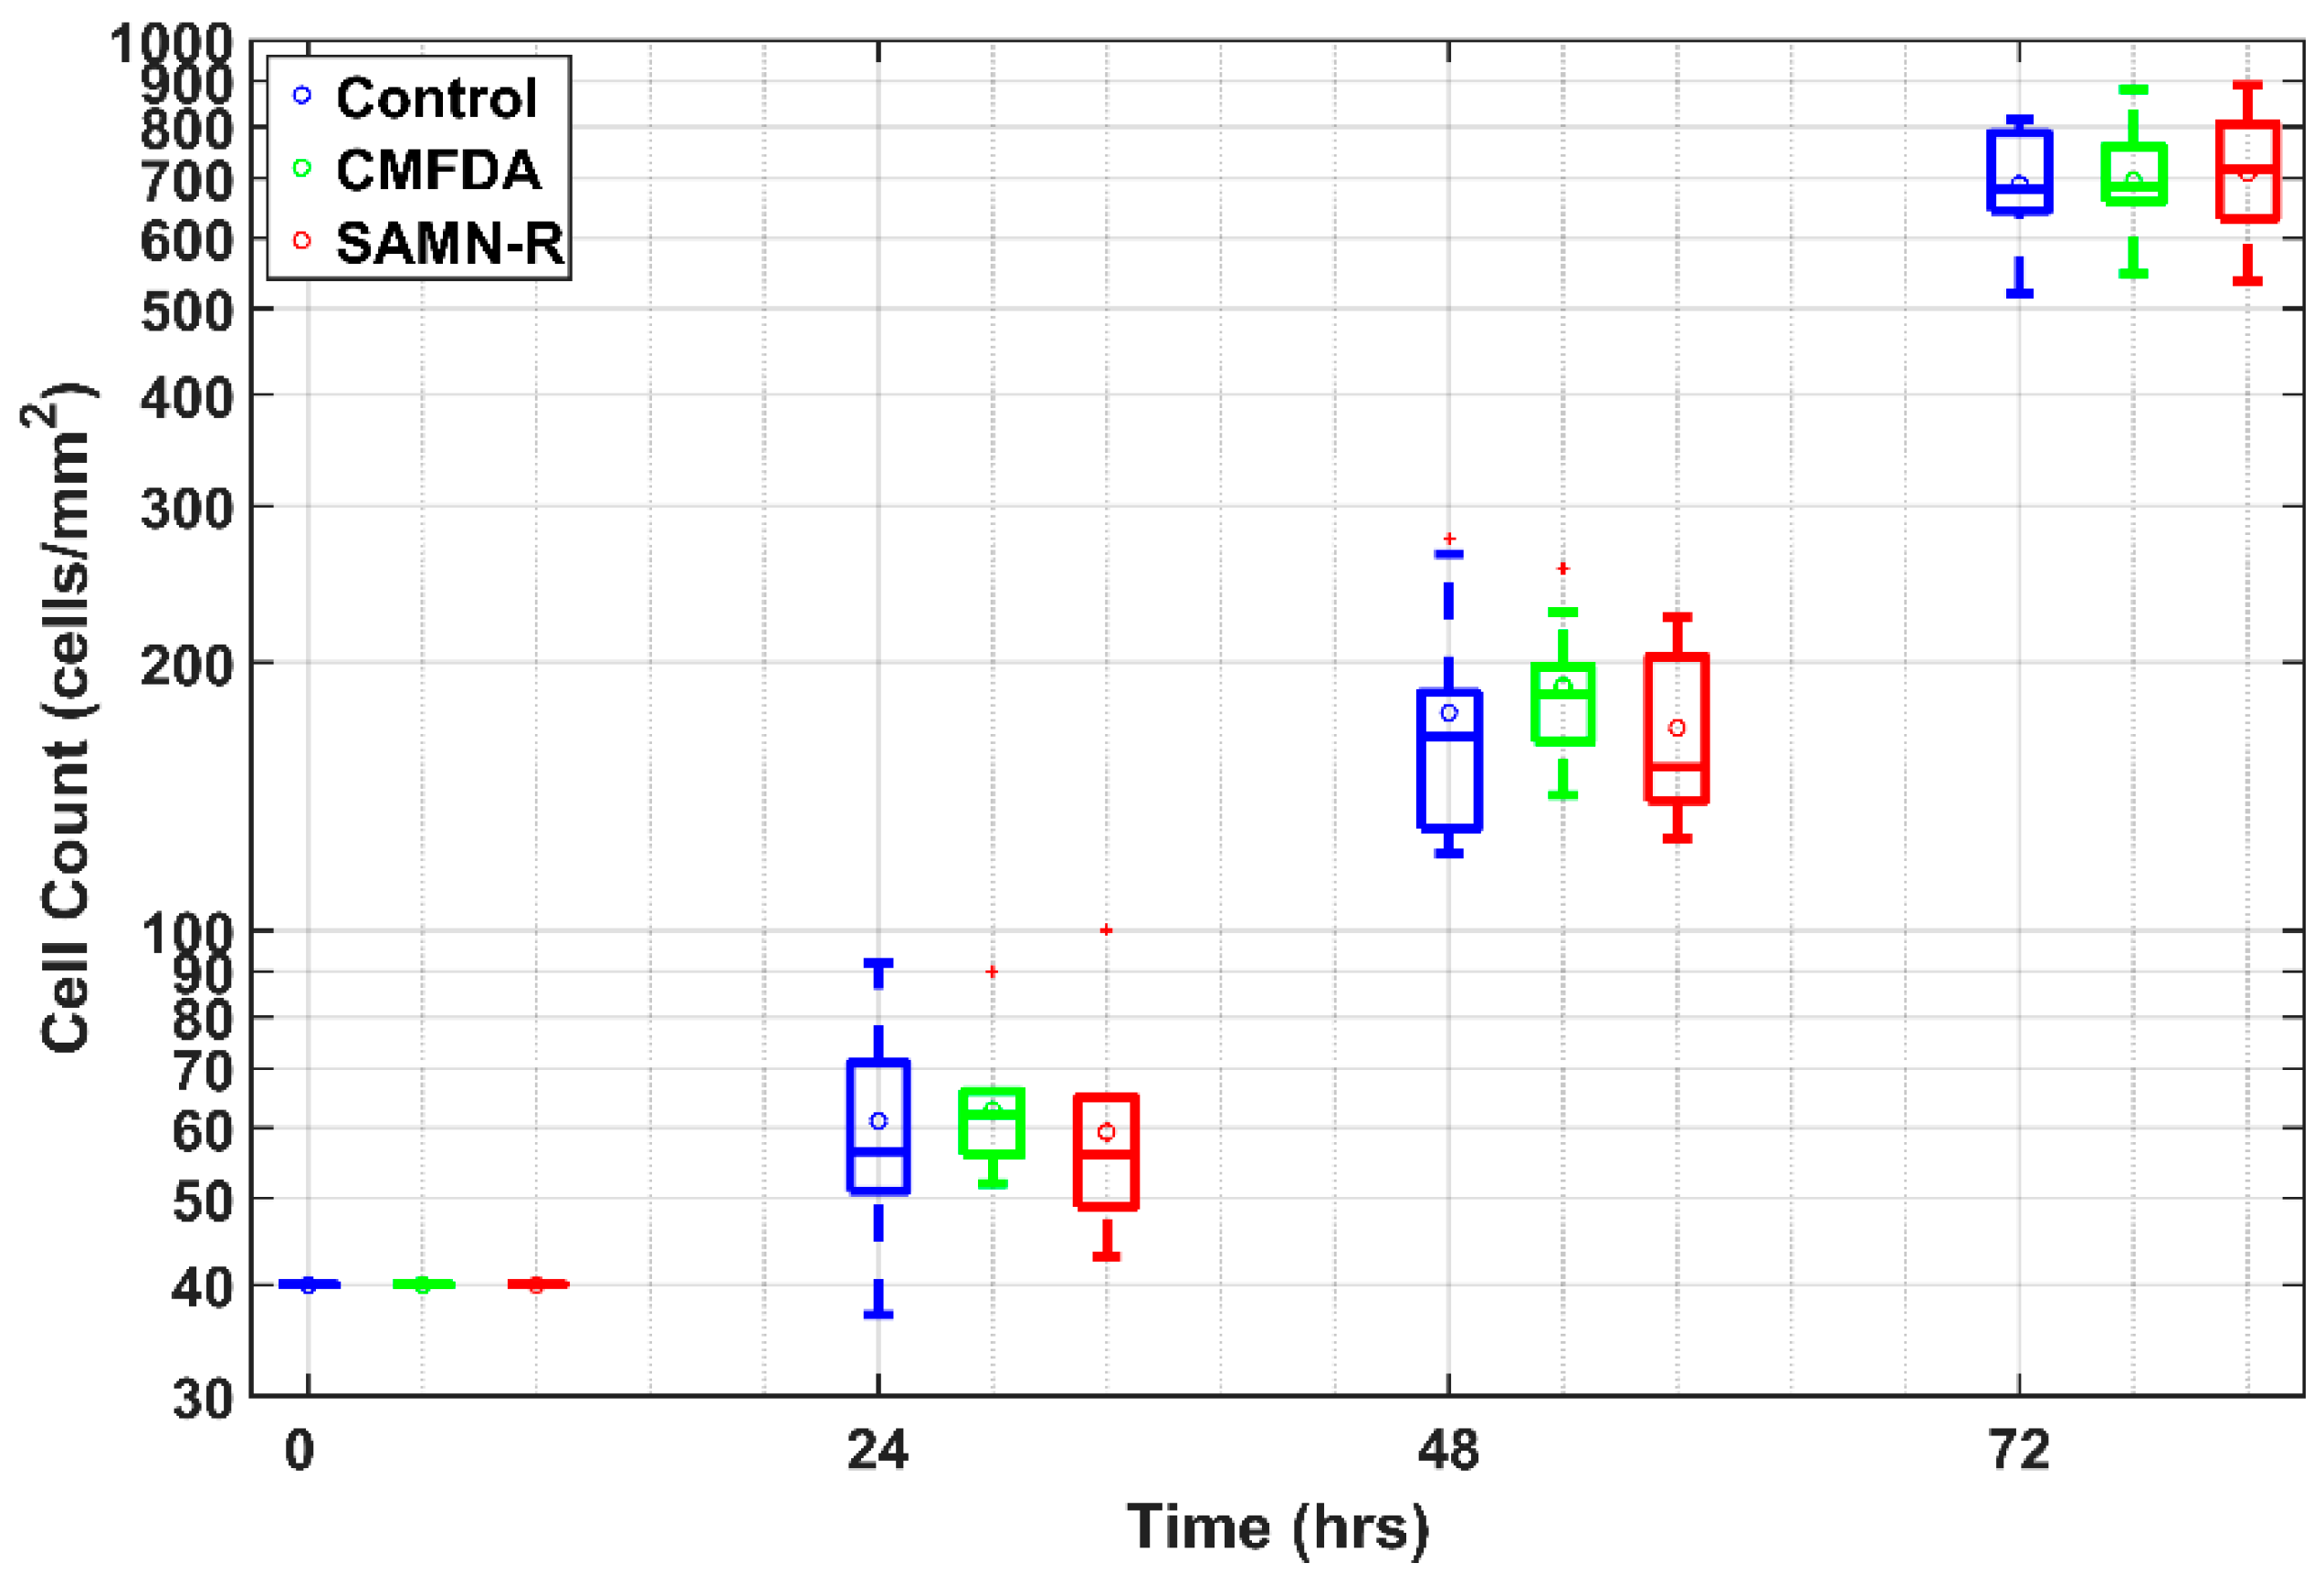
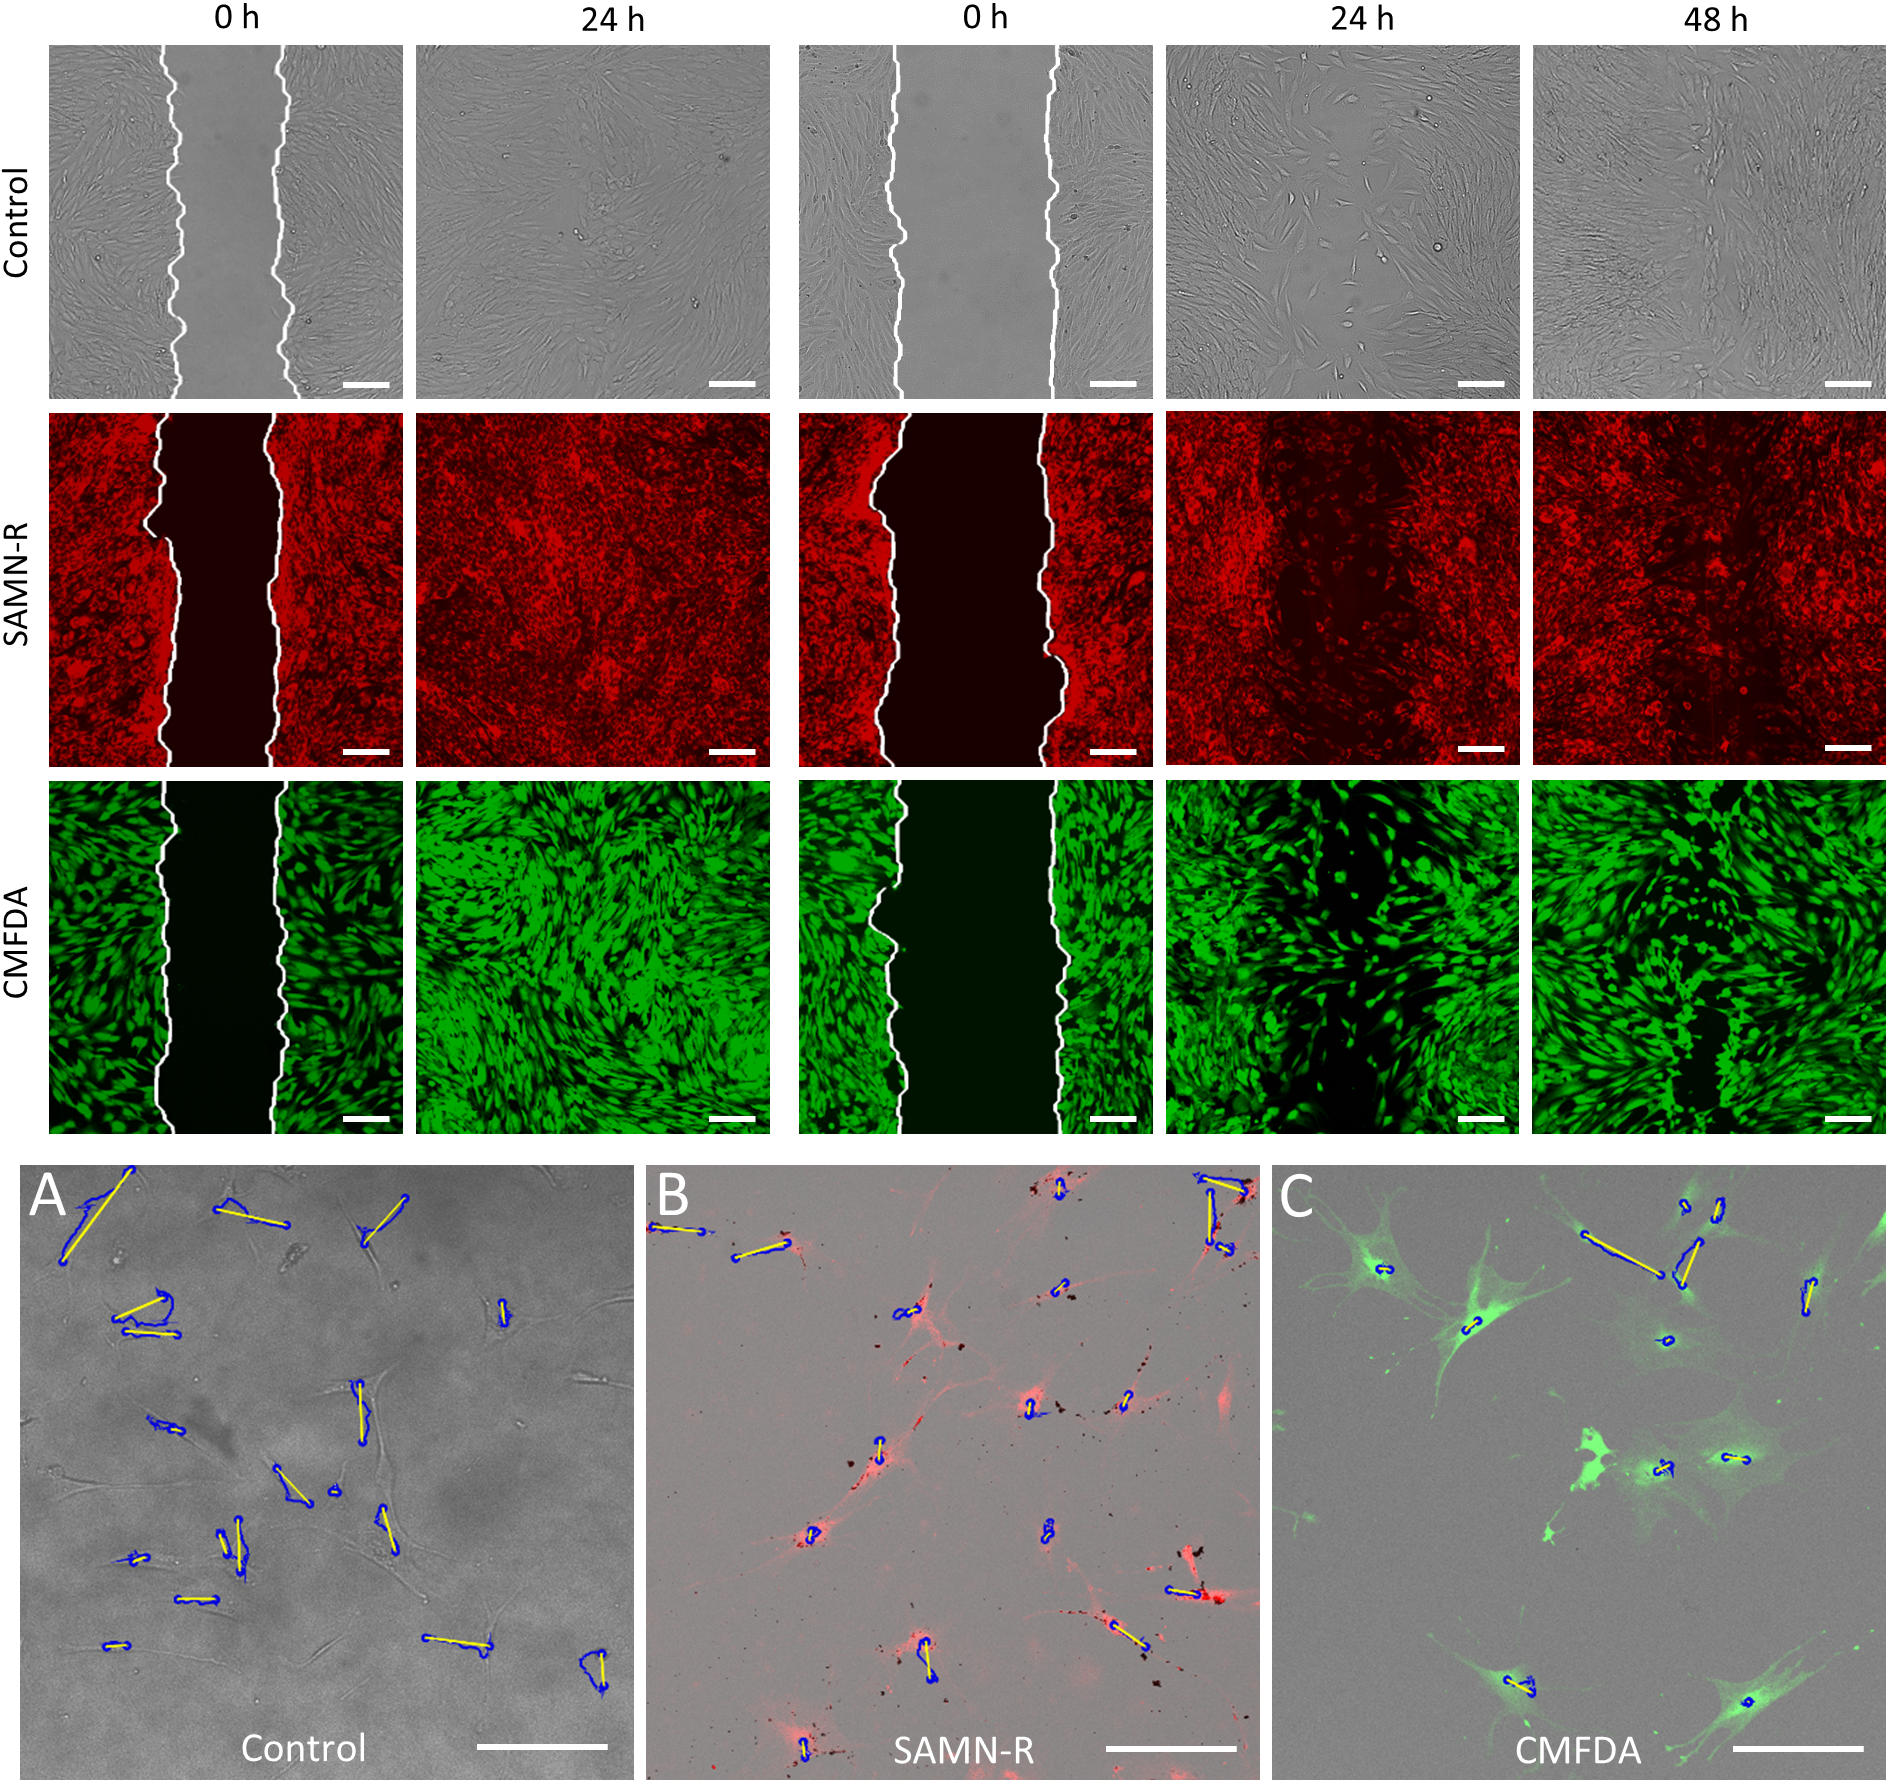
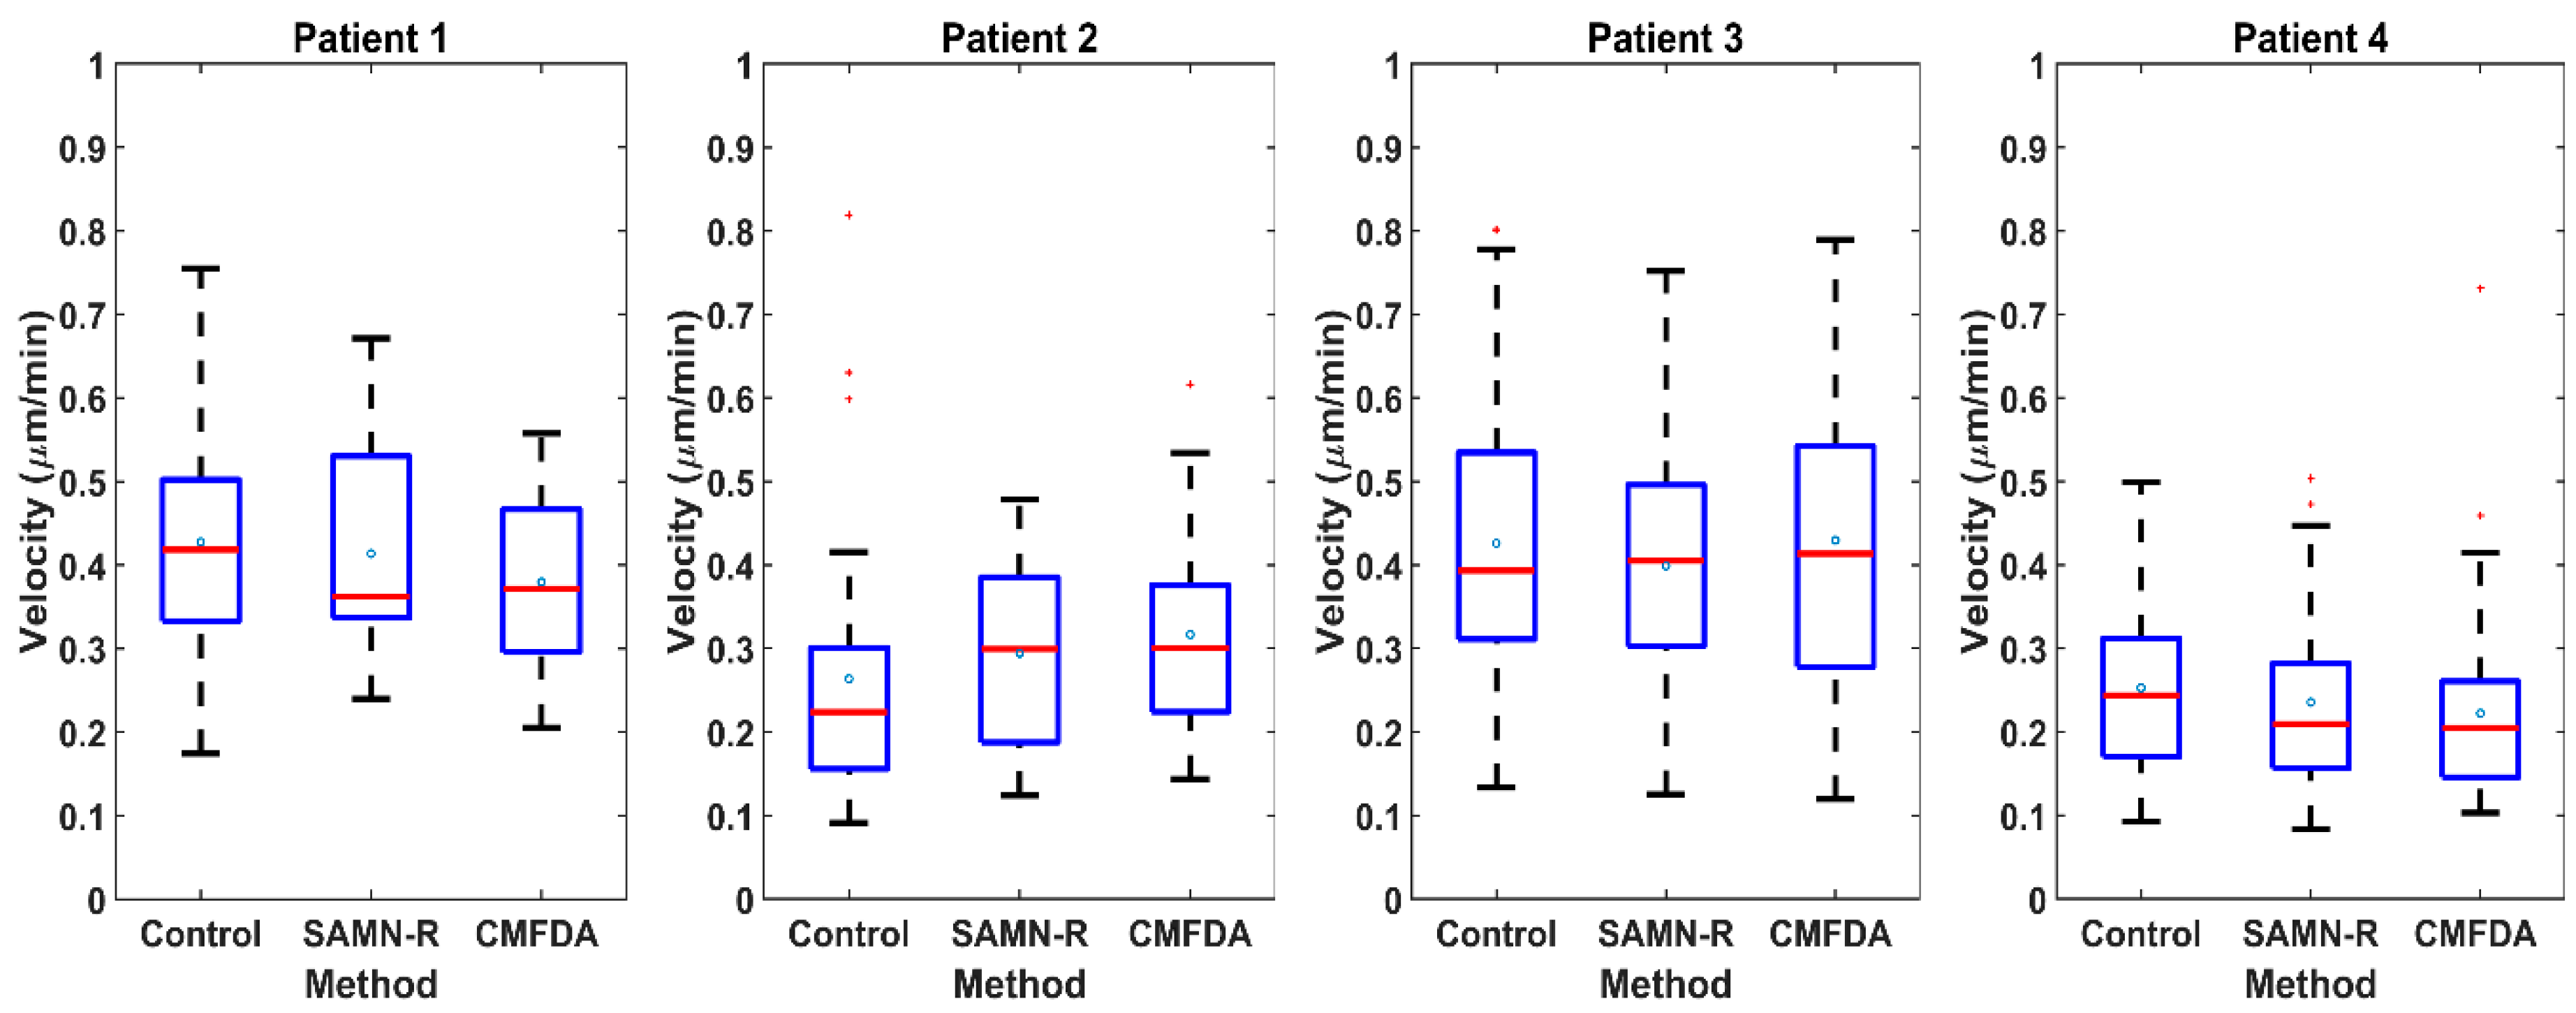
Our time-lapse microscopical visualization of MSCs’; motility and its statistical summary in MATLAB give clear conclusions: SAMN-R does not affect typical hMSCs’ ameboid motility, nor does it affect the average velocity of the cells. The used dose of SAMN-R of 20 µg·cm
−2 displayed high biocompatibility and no effect on cell motility, which is comparable with the CMFDA commercial cell tracker marker (see
Figure 8 and
Table 3,
Table 4,
Table 5 and
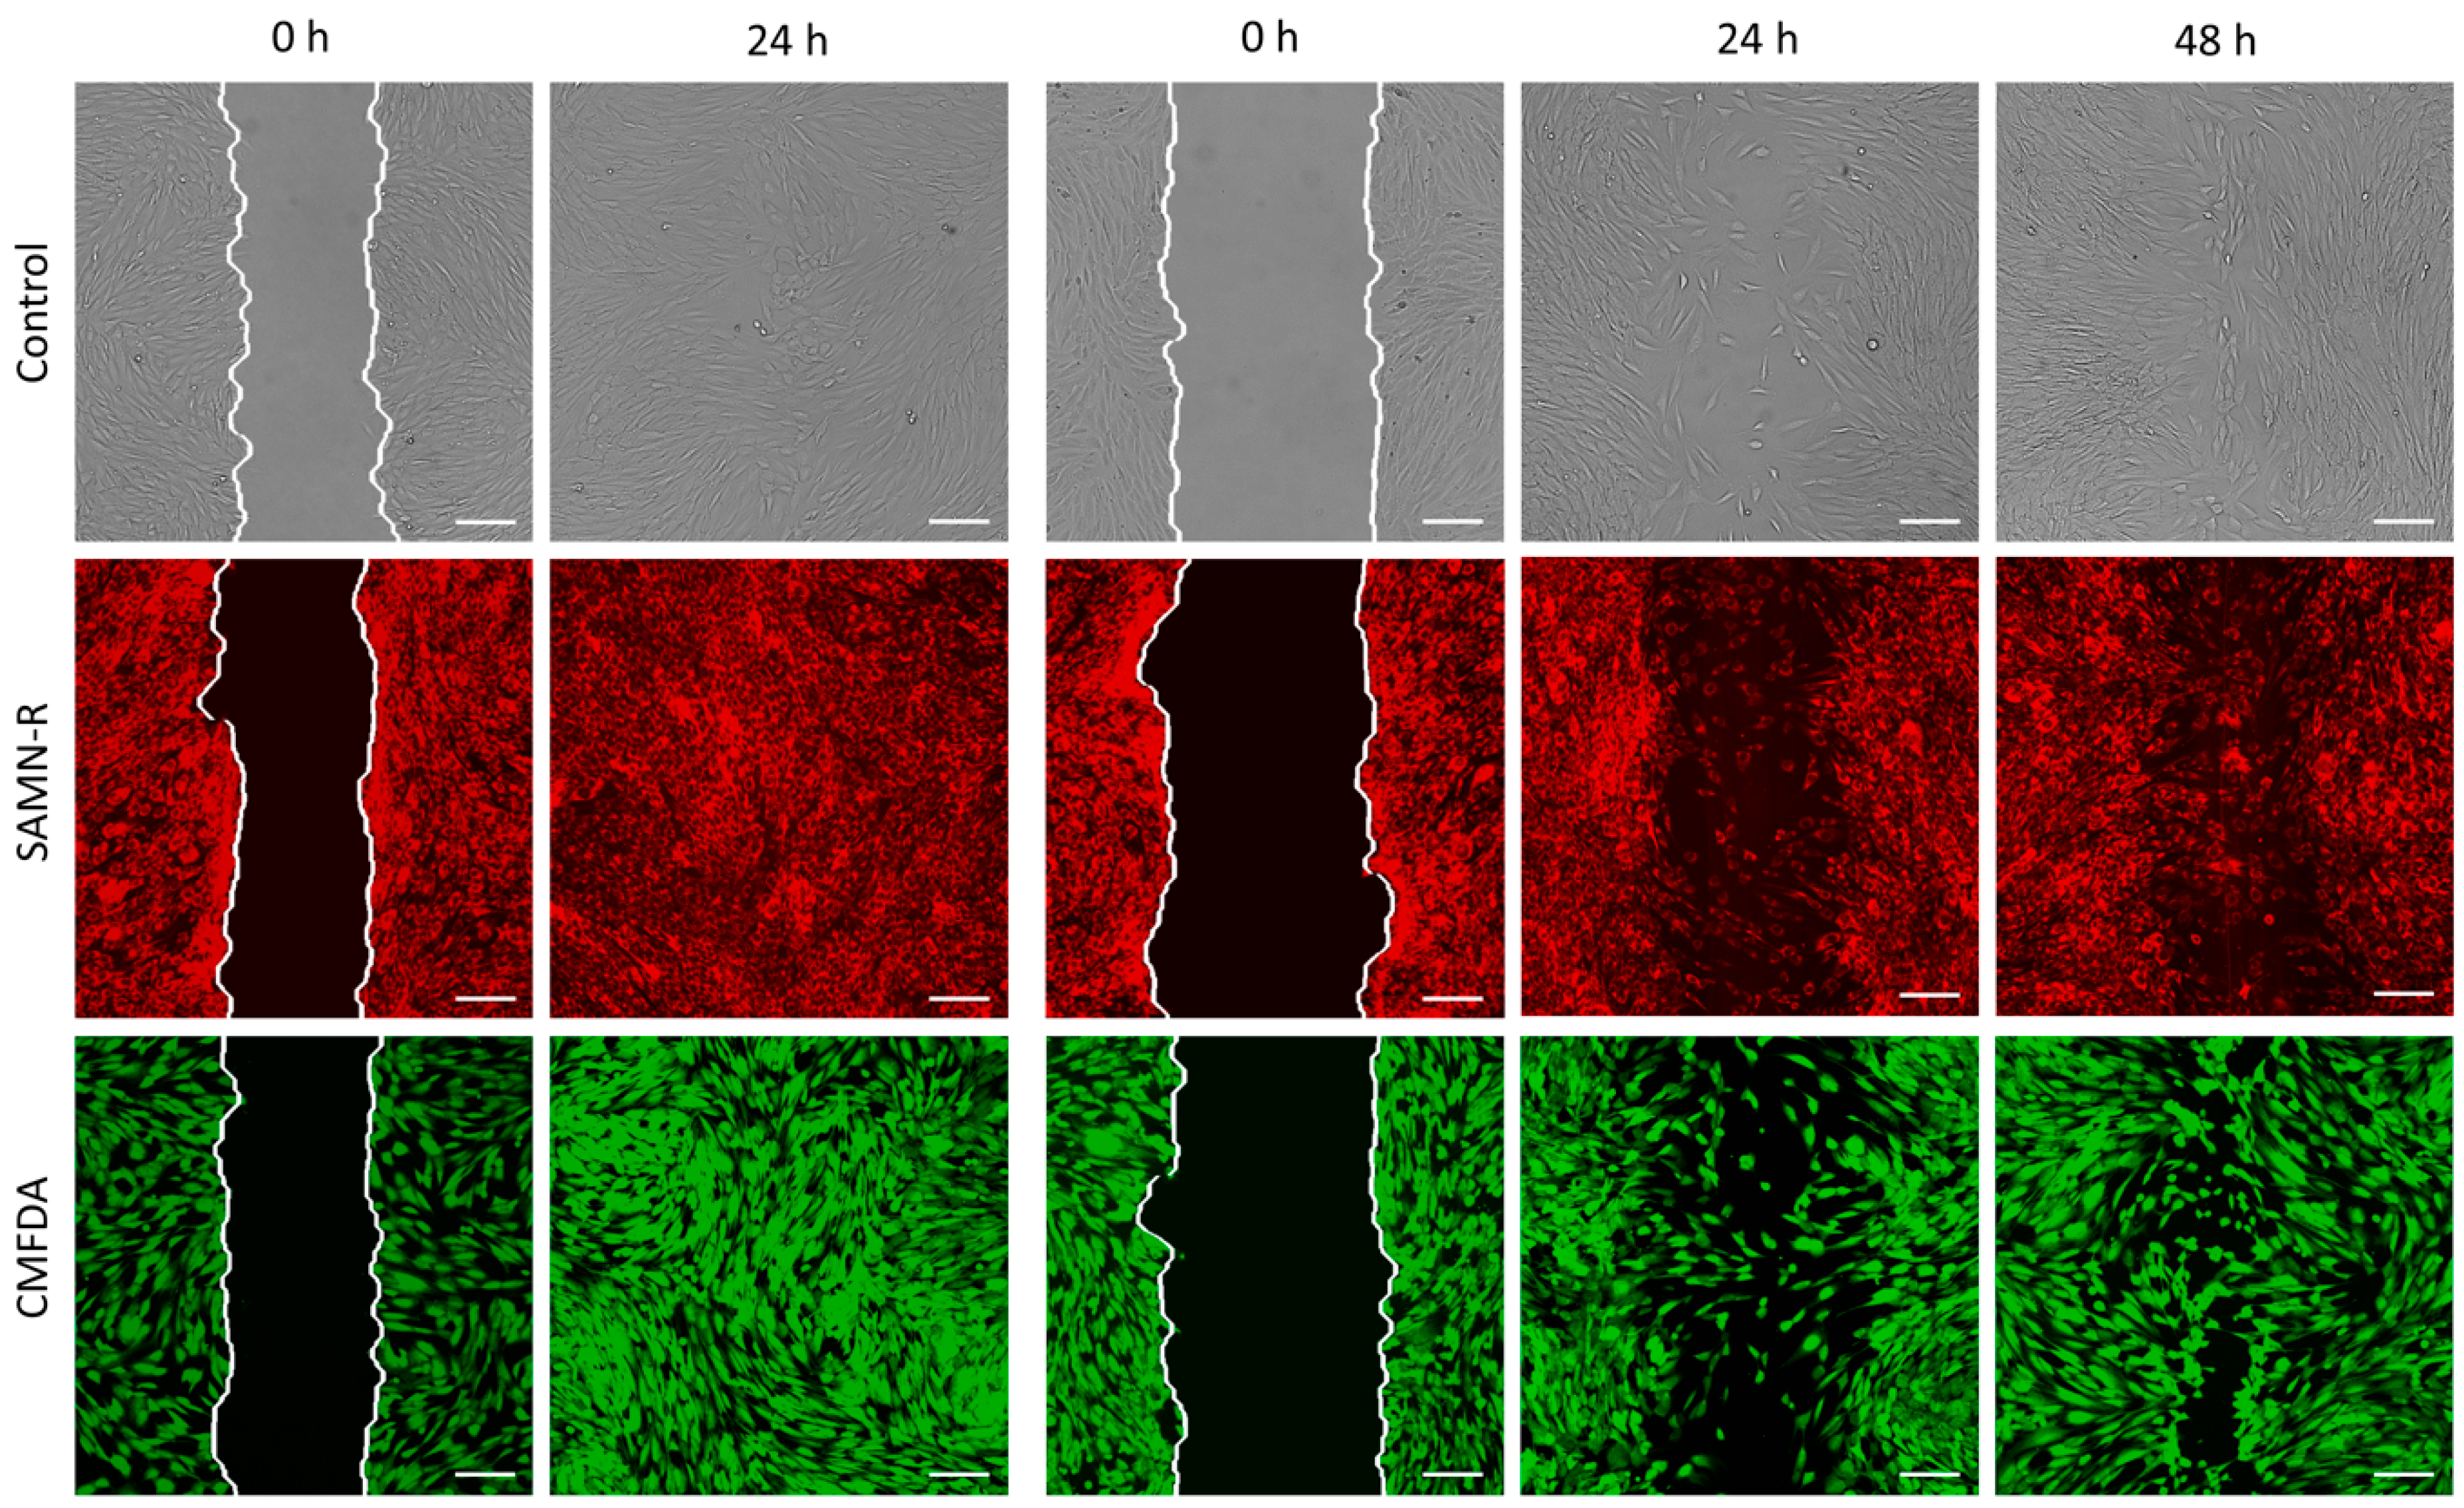
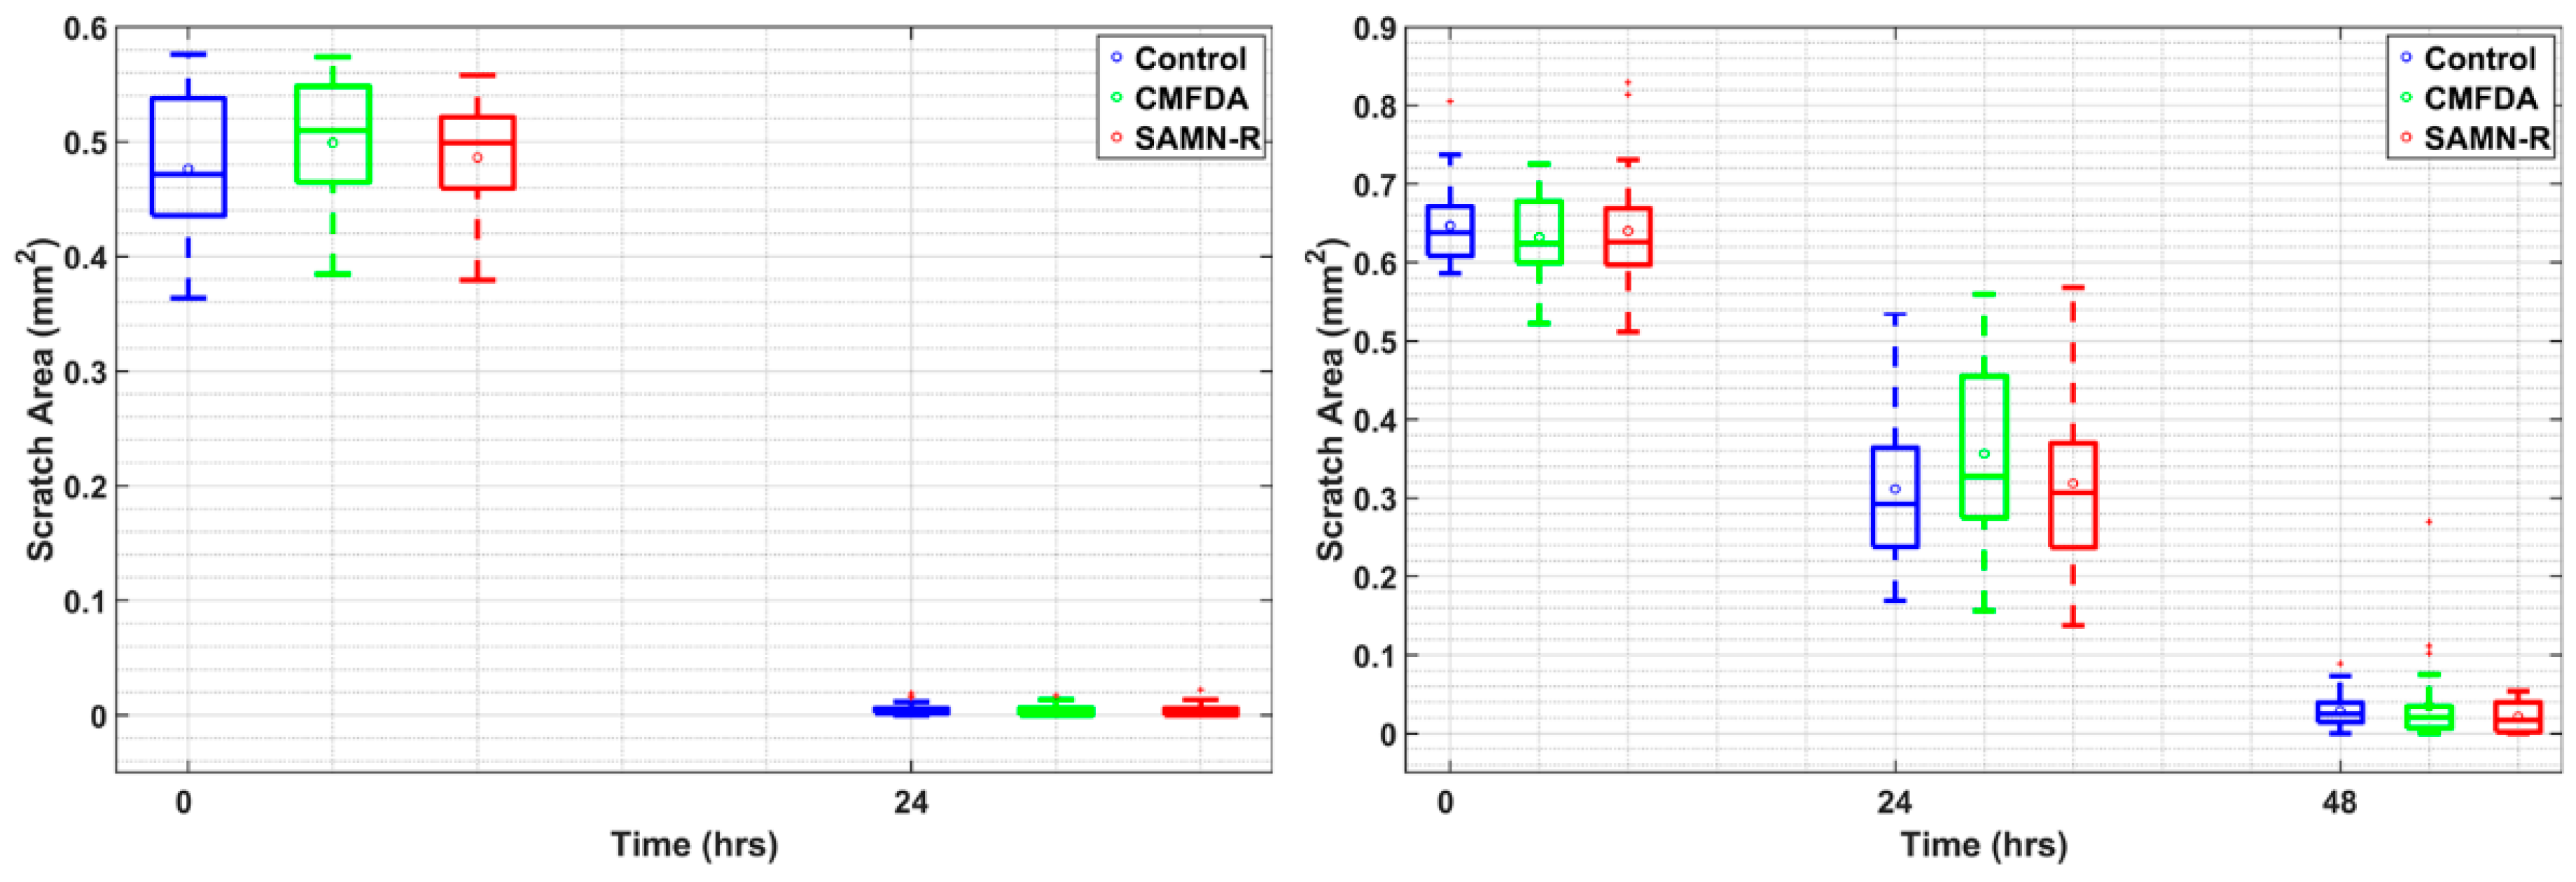
Table 6). Further motility tests performed on fibroblasts also gave positive results for SAMN-R. Covering of scratches in a fibroblast monolayer labelled by SAMN-R was not affected compared to non-labelled fibroblast experiments. Migration of SAMN-R labelled cells was also compared with migration of cells labelled by commercial low toxicity CMFDA cell tracker dye with similar results.
Our analysis showed that SAMN-R incorporation into the cells is more biocompatible with cell motility, than is the case with metal nanoparticles [
25,
28] or commercial nanoparticles used in the food industry and in oral hygiene products [
29].
Our results bring favorable data from SAMN-R tests on 3T3 cells and hMSCs, and from comparisons with CMFDA. However, other challenges remain for future research. All morphology, growth-activity and motility tests were made on in vitro 2D planar surfaces, whereas an evaluation of cell morphology and motility in 3D systems mimicking real tissue is needed in the next step. Furthermore, detailed monitoring of cytokine and extracellular vesicle production by MSCs and fibroblasts is required, as these cell functions are also important for effective procedures in regenerative medicine. For our recent work, we are developing an improved custom-made algorithm in MATLAB software for fully automatic cell tracking.
4. Materials and Methods
4.1. Synthesis and Characterisation of SAMN-R
Preparation of spherical-shaped SAMN-R ranging from 20 to 50 nm in size, with optimized zeta potential −22.5 mV, was based on a solid-heating method and covalent immobilization of rhodamine B isothiocyanate (RITC) on a metal surface. The method included the use of the precursor, ferric chloride FeCl3∙6H2O (Sigma-Aldrich, St. Louis, MO, USA), which was dissolved in 800 mL of deionized water. The addition of 2 g of NaBH4 borohydride (3.5%, 100 mL) was the next step in the procedure. The abovementioned steps were performed at 20 °C. The black precipitate was then boiled at 100 °C for two hours, cooled to room temperature, separated by an external magnet, and washed several times with water. In the final step, the intermediate product was thermally treated at 400 °C for two hours. The obtained spherical nanoparticles were dispersed in deionized water with the help of an ultrasonic bath (30 W). RITC was dissolved in 50 mM tetramethylammonium perchlorate, the solution was mixed with pure spherical nanoparticles, and the pH was adjusted to 7.0 in the presence of 50 μM RITC. After one hour of incubation, the nanoparticles were separated using an external magnetic field. A sample of bound RITC was tested by measuring absorbance at 554 nm in the supernatant. Parallel fluorospectrometric analysis was performed to confirm the RITC attachment to nanoparticles. Furthermore, the prepared SAMN-R were then diluted by sterile H2O (Ardeapharma, Sevetin, Czech Republic). Iron concentration was determined by an atomic absorption spectrometer (Avanta Sigma, GBC Scientific Equipment, Braeside, Australia) in acetylene-air flame. External calibration in the range of 0.5–10 mg·mL−1 was prepared by dilution of a certified reference material—a water calibration solution with an iron concentration of 1.000 ± 0.002 g·L−1 (Analytika, Prague, Czech Republic). The structure of the type of maghemite iron oxide nanoparticles and their stability were determined on the first day and one year after preparation. They were investigated by zero-field and in-field Mössbauer spectroscopy and magnetometry using a superconducting quantum interference device (SQUID, Quantum Design, San Diego, CA, USA). The distribution of nanoparticle diameter and polydispersity index in water and Dulbecco’s Modified Eagle’s Medium (DMEM, Sigma-Aldrich, St. Louis, MO, USA) were quantified by a Zetasizer Nano ZS (Malvern Instruments, Malvern, UK).
4.2. Cell Cultures
Two types of cells were used as a testing culture: commercial fibroblast 3T3 and MSCs isolated from patients during plastic surgery. 3T3 cell lines were obtained from Sigma-Aldrich (St. Louis, MO, USA) in a cryoconserved form. MSCs were isolated from three samples of adipose tissue from three patients (male, age 40–50, weight 80–110 kg). Adipose tissue was obtained from healthy patients undergoing abdominal liposuction (collected waste tissue) after gaining a signature of written informed consent in accordance with Czech law 372/2011 and the Declaration of Helsinki. The isolation procedure was conducted via the protocol [
30].
The 3T3 cells were cultured in T25 culture dishes (Sigma-Aldrich, St. Louis, MO, USA) at 37 °C, and 5% CO2. High-glucose DMEM containing 10% fetal bovine serum (FBS; Sigma-Aldrich, St. Louis, MO, USA), 1% penicillin/streptomycin (Sigma-Aldrich, St. Louis, MO, USA), and 1% L-glutamine (Sigma-Aldrich, St. Louis, MO, USA) was exchanged every two days. Cells were subcultured when they reached 80 to 100% confluence using Trypsin-EDTA solution (Sigma-Aldrich, St. Louis, MO, USA).
MSCs were cultured in a 24-well plate (Sigma-Aldrich) with low glucose DMEM containing 5% FBS, 1% penicillin/streptomycin, and 1% l-glutamine. Cell passage was provided when the culture reached 80 to 100% confluence, and prewarmed Accutase (PAA Laboratories, Dartmouth, MA, USA) was applied for five minutes under 37 °C as the activator of detachment. Cells were separated from the supernatant by centrifuge for three minutes in a 1.5 mL plastic microtube (450 g).
4.3. Cell Labelling
When cells reached the 70 to 80% confluence level, SAMN-R in a dose of 20 µg·cm−2 was added to the growth medium. To study the migration of individual cells, nanoparticles were added 28 h before the start of the experiment. After 24 h, this solution was removed, cells were gently washed with phosphate buffered saline (PBS; Sigma-Aldrich, St. Louis, MO, USA) and then cultured in a growth medium without nanoparticles.
CMFDA (Thermo Fisher Scientific, Waltham, MA, USA) was used to monitor cell migration. The working solution was warmed to 37 °C before use. The growth medium was removed and the cells were gently washed by PBS. Then, the final working concentration, CMFDA of 10 µm in a serum-free medium, was added for 15 to 20 minutes, controlled by a Zeiss Axio Observer 5 fluorescence microscope (ZEISS International, Oberkochen, Germany). After this, cells were cultivated in a complete growth medium during the experiment.
Hoechst 33342 (Sigma-Aldrich, St. Louis, MO, USA) was used for nuclei staining. Dye with 10 µm working concentration was mixed with a growth medium and added to the sample. After 10 to 15 min, the solution was removed (controlled by a Zeiss Axio Observer 5 fluorescence microscope). Then, the cells were gently washed by PBS and cultured in the growth medium.
4.4. Confocal Microscopy
The data were acquired using a Leica TCS SP8 X confocal microscope (Leica Microsystems, Wetzlar, Germany) equipped with a pulsed white light laser (WLL), photomultiplier tubes (PMT), and a hybrid detector (HyD). The optimal SAMN-R spectrum was defined by lambda square fluorescence mapping with an excitation wavelength at 560 nm and detection range at 570 to 620 nm (maximum at 582 nm) [
7].
When labelled with CMFDA, the excitation wavelength was set to 492 nm and the detection range was set between 505 and 545 nm; for the Hoechst 33342 dye, the excitation wavelength was set to 405 nm and the detection range was set between 415 and 475 nm.
Images were acquired with a spatial resolution of 1024 × 1024 pixels with a 100 Hz scan speed. The images were 1.16 × 1.16 mm in the X- and Y-axes. Following cell migration, 3D time-lapse data were obtained every five minutes over a period of six hours. Several scan fields were chosen and conducted one after another during this timeframe (mark and find function). A long-term scan was provided for use with a microscope incubator (The Stage Top Chamber, OKOLAB, Pozzuoli, Italy) with temperature and CO2 control.
4.5. Cell Morphology and Flow Cytometry
For enhanced cell adhesion, eight-well chambered cover glasses (Cellvis, Mountain View, CA, USA) were coated with a fibronectin (FN; Sigma-Aldrich, St. Louis, MO, USA) solution of 1 μg·cm−2 surface coverage. Then, cells were seeded in a dose of 4 × 10³ cells·cm−2 in each chamber. After three days, when the cell confluence reached 70 to 80%, the SAMN-R were added to the growth medium in each chamber with doses from 5 µg·cm−2 to 35 µg·cm−2 in increments of five, except for the control chamber. After 24 h, the medium with nanoparticles was exchanged to complete growth medium and then the cell morphology was observed using a confocal microscope.
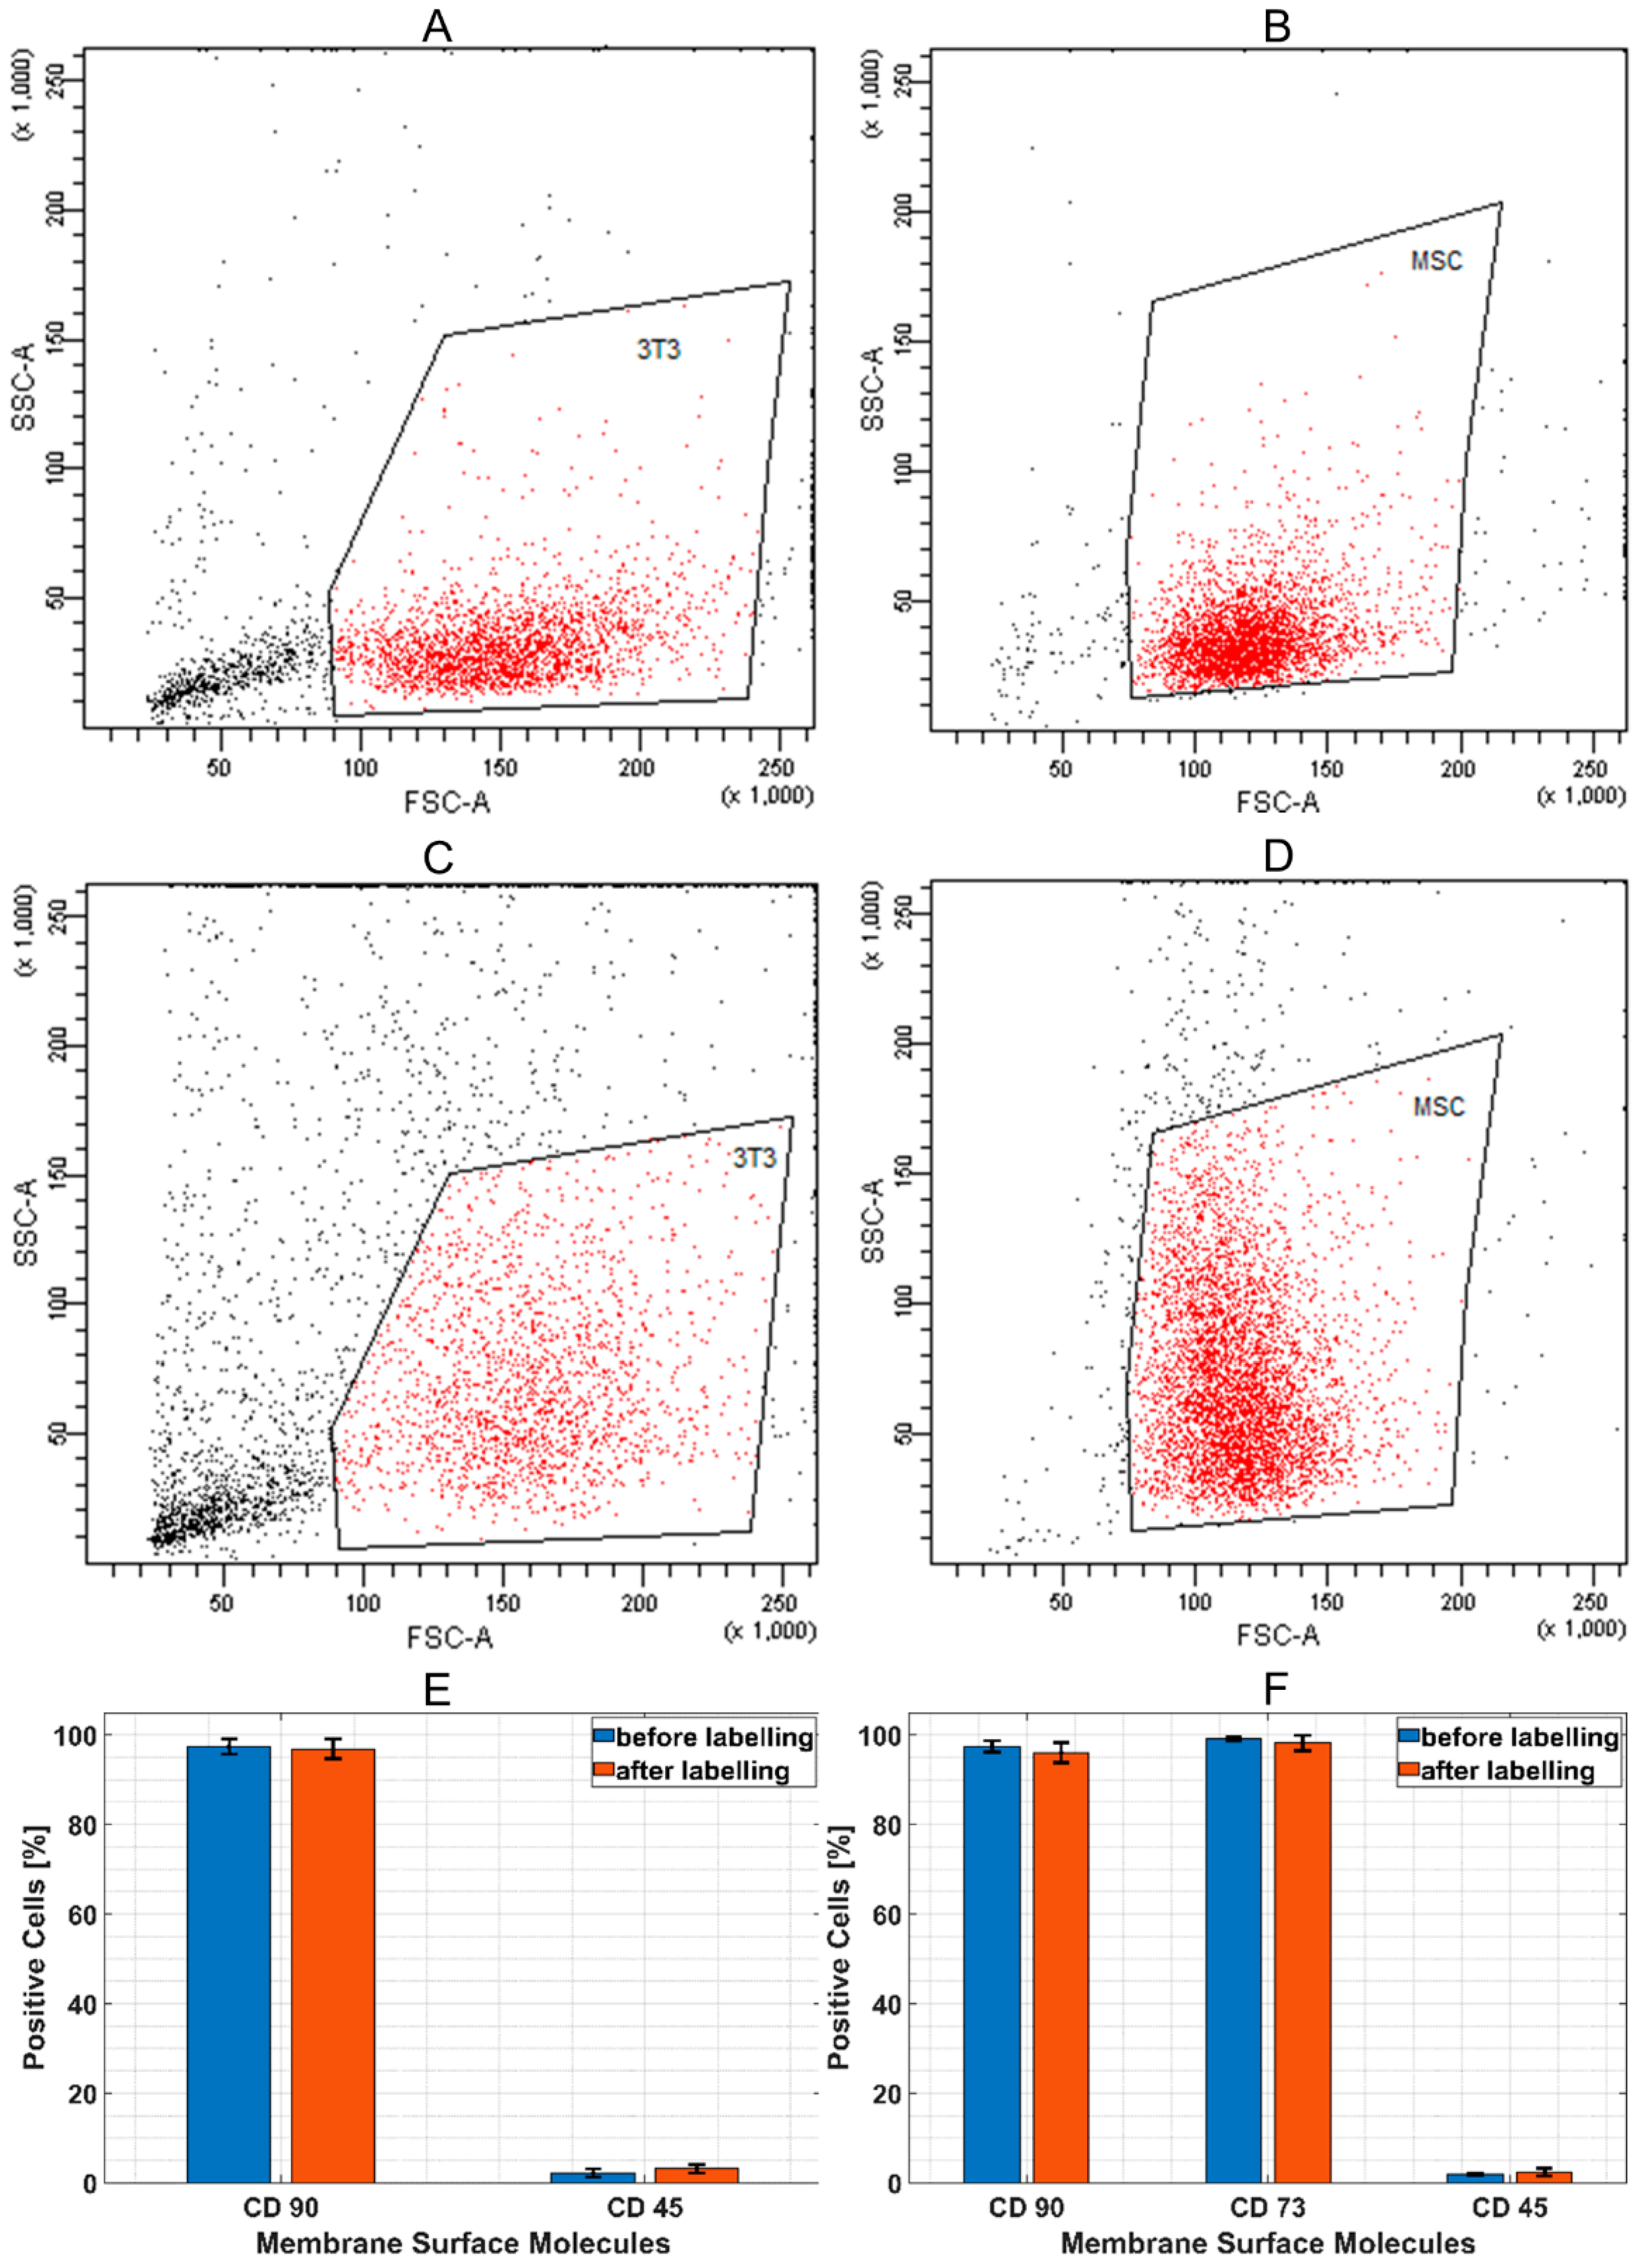
The effect of SAMN-R labelling on stability of size, granularity, and the expression of specific cell surface ligands (CD molecules on fibroblasts and on MSCs were evaluated by a flow cytometer Cytomics FC500 (Beckman-Coulter Inc., Brea, CA, USA). The cell surface CD on fibroblasts was stained by a monoclonal antibody against CD90 conjugated to phycoerythrin (1:100 dilutions) and an antibody against CD45 conjugated to allophycocyanin (1:100 dilutions). The cell surface CD on MSCs was stained by a monoclonal antibody against CD90 conjugated to phycoerythrin (1:100 dilutions), an antibody against CD45 conjugated to allophycocyanin (1:100 dilutions), and an antibody against CD73 conjugated to fluorescein isothiocyanate (1:100 dilutions). All commercial antibodies were obtained from Miltenyi Biotec (Bergisch Gladbach, Germany). Unstained cells and cells incubated with isotype-matched controls were used to set the border value between fluorescent-positive and fluorescent-negative populations. CD positivity, cell size, and granularity of control cells and cells after nanoparticles labelling were compared (comparison of basic dot-plot forward scatter (FSC) versus side scatter (SSC)). At least 2000 cells in the non-debris gate were selected for evaluation of CD marker expression and FSC/SSC characteristic in each cell sample (MSCs labelled and unlabelled, 3T3 labelled and unlabelled), and each type of cell sample was prepared in triplicate from different patients or different in vitro cultures of cell lines.
4.6. Quantification of ROS Generation after SAMN-R Labelling
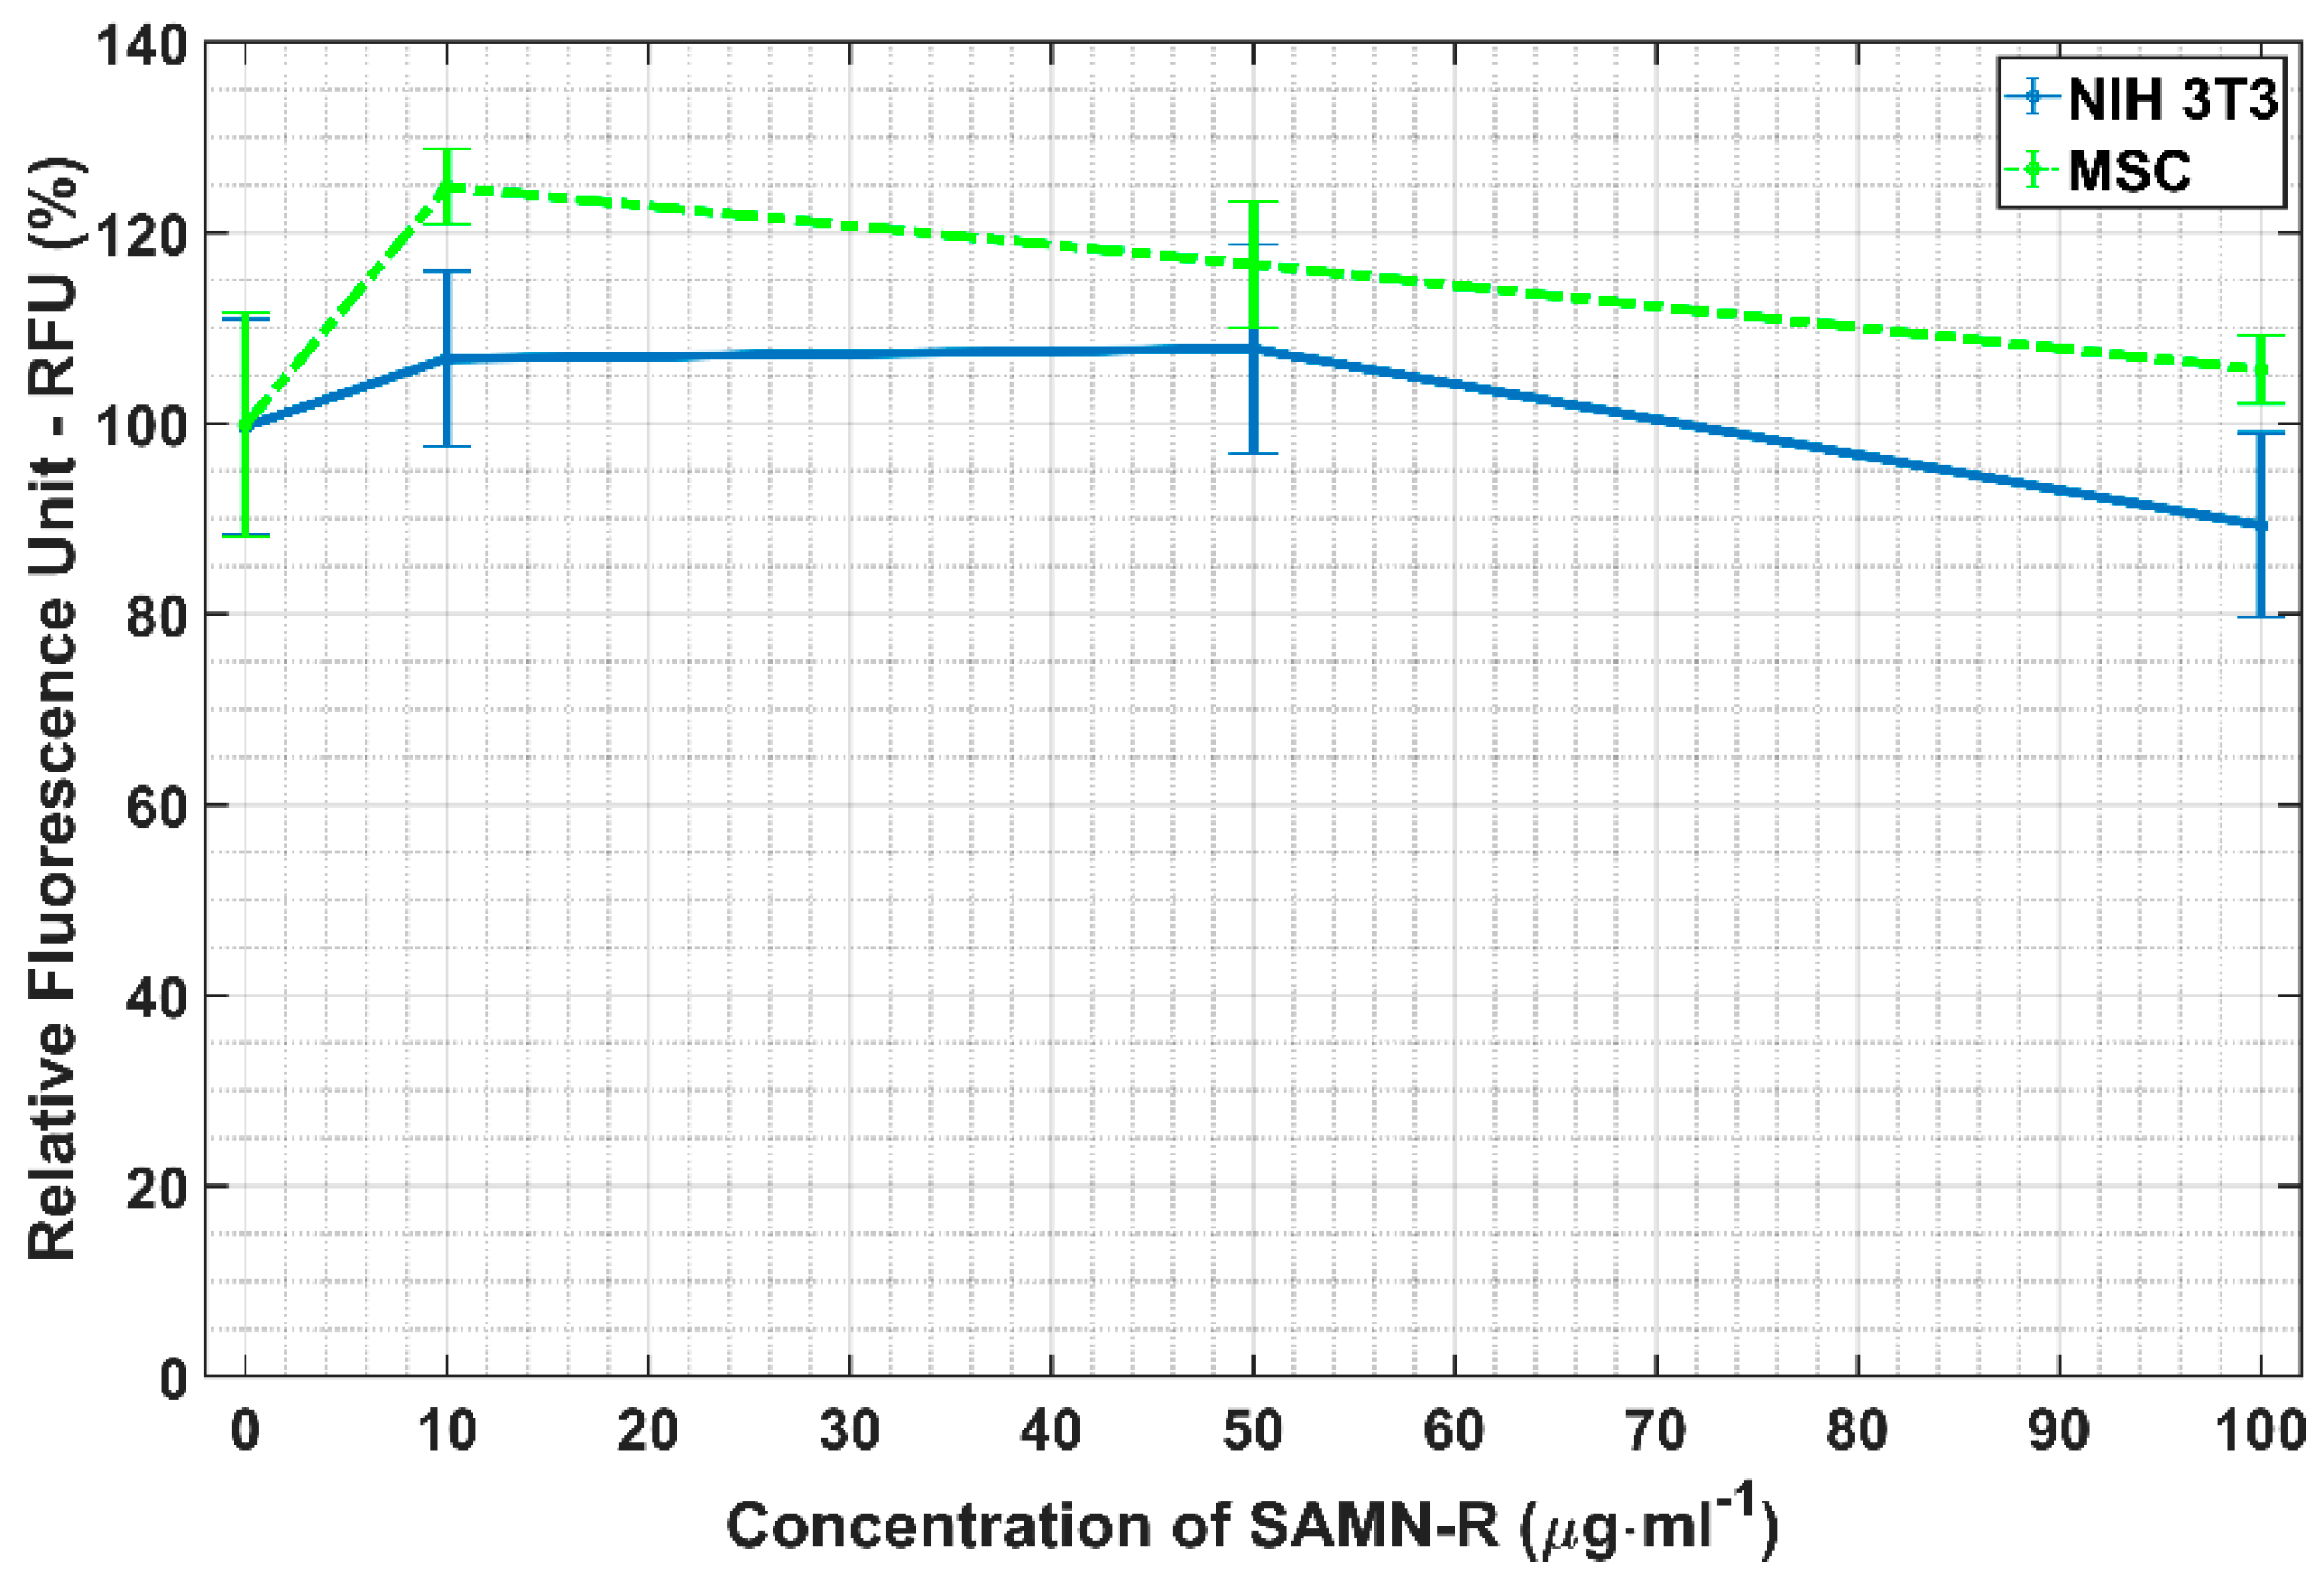
Reactive oxygen species (ROS) are an important factor connected with the beginning of cell stress and the development of pathological cell changes. Potential oxidative stress caused by SAMN-R was investigated by ROS analysis. hMSCs were seeded into four wells (5000 cells/well in 96-well plate) and were treated with 0, 10, 50, or 100 μg·mL−1 concentrations of SAMN-R. The 3T3 cells were seeded and treated in the same way. All cell samples with SAMN-R were incubated for 24 h. Afterwards, a 2 µL portion of fluorescent ROS probe (general oxidative stress indicator (CM-H2DCFDA, Thermo Fisher Scientific, Waltham, MA, USA) pre-dissolved in DMSO) was added to each well (final concentration was 10 µmol·L−1). The plate was placed in a CO2 incubator for 45 min and the fluorescent signal was measured using an Infinite PRO M200 microplate reader (Tecan, Mannedorf, Switzerland) with ex.505 nm / em.529 nm. The intensity of the fluorescence was compared with a control sample (exposed 0 μg·mL−1 of SAMN-R). All tests for hMSCs and 3T3 cells were repeated three times (three independent cell samples) and statistical summaries were calculated.
4.7. Cell Growth Curves
For this experiment type, three T25 culture dishes were prepared: a control sample, SAMN-R, and CMFDA labelling. After the subculture, each cell type was seeded into nine wells in a concentration of 4 × 10
3 cells·cm
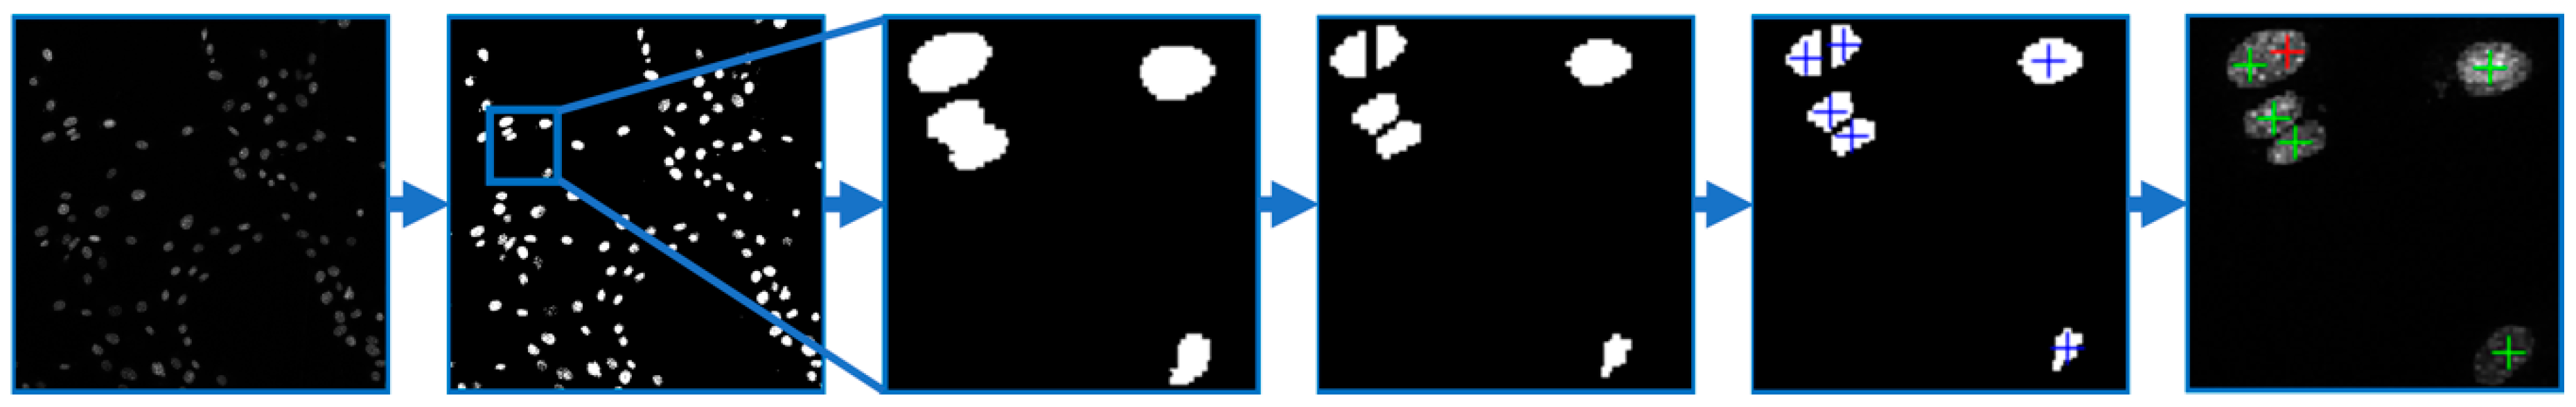
−2 with eight-well chambered FN-coated cover glasses. After 24, 48, and 72 h, three wells from each type were dyed with Hoechst 33342 and scanned using a confocal microscope. Each time, 10 acquired images were randomly chosen from one type of cell. The cell count was determined by counting the nuclei using a custom-made algorithm in MATLAB software (see
Figure 10). The image data were filtered by a Gaussian low pass filter in order to reduce noise. Thus, the nuclei edges were enhanced due to a high value of standard deviation on the edges. The filtered image was then thresholded with an experimentally set threshold value, and the binary image of segmented cell nuclei was obtained. Due to the presence of mutually adherent cells, the nuclei were divided by a watershed algorithm using the negative parametric image, which was obtained by a distance transform applied to the binary image of the segmented nuclei. Finally, objects with a smaller area than the manually selected value were removed. For each remaining object, the centroid was found and the number of the centroids in the analyzed image was determined. The total number of the centroids corresponded to the number of cells. The program also enabled a visual evaluation of detected cells to manually correct possible false positive and/or false negative detections.
4.8. Analysis of Wound Healing Assay
The cells were cultured in FN-coated culture dishes (TPP Techno Plastic Products AG, Trasadingen, Switzerland) with a growth area of 9.2 cm
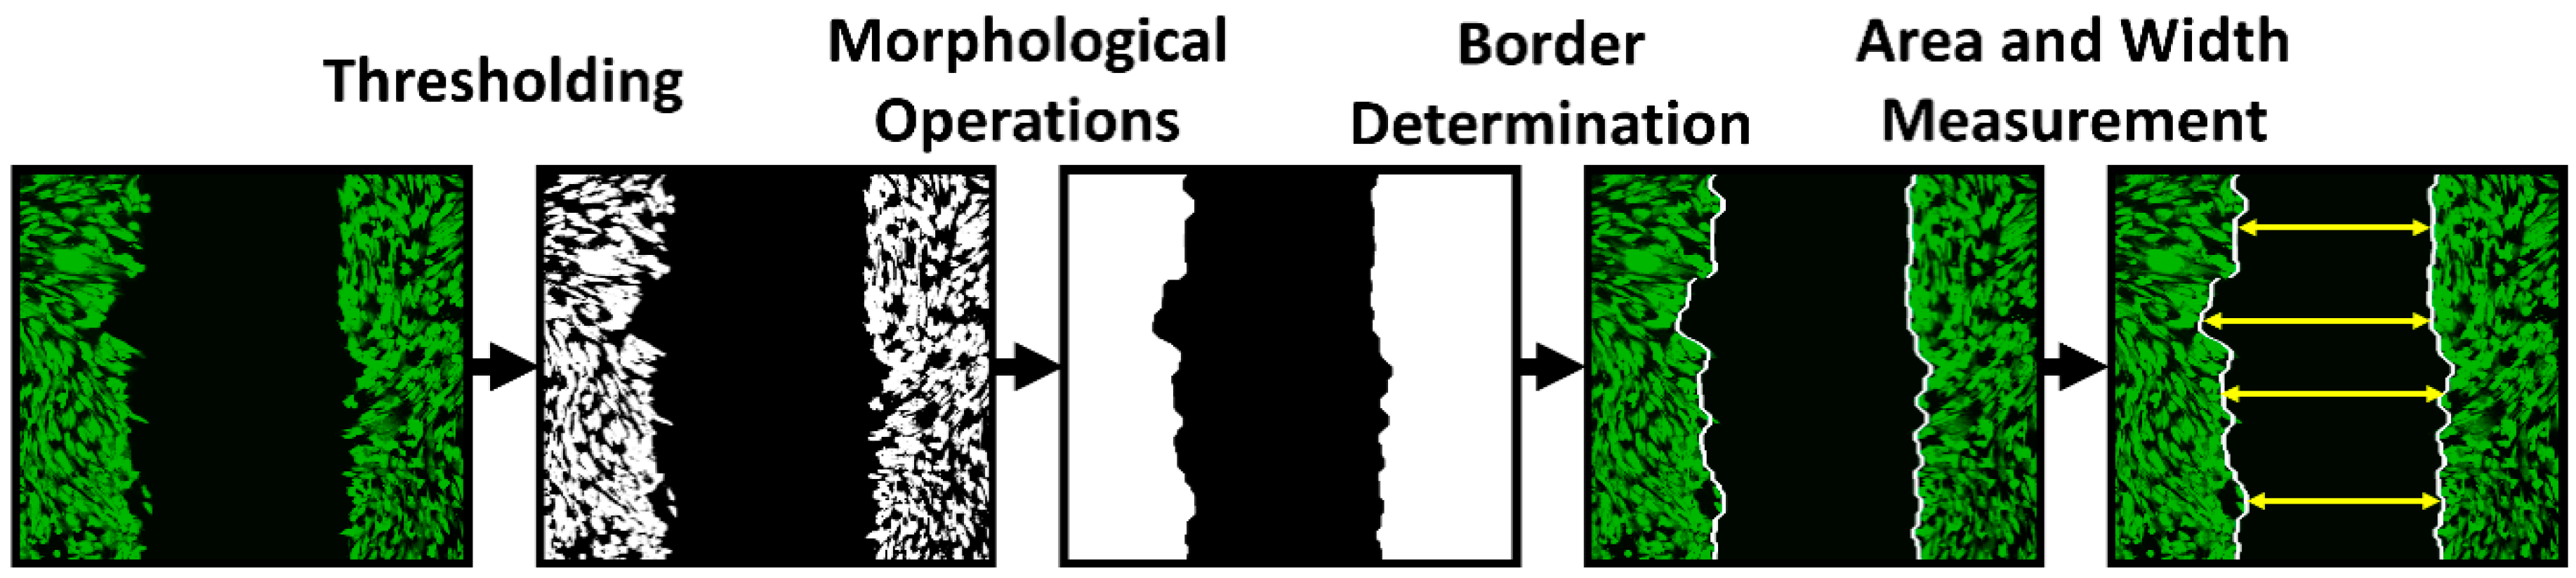
2. The cells (except the cells in the control sample) were targeted with SAMN-R 24 h before the beginning of the experiment. At the beginning of the experiment, the cells had to reach 100% confluence. At first, a scratch with a p200 pipette tip was made, then the cells were gently washed with 1 mL of PBS and the solution was replaced with 3 mL of growth medium. SAMN-R-targeted and controlled cell scratches had approximately the same width. Markings were made on the outer bottom of the dish by a marker to obtain the same field of view during the image acquisition. The first images of the scratch were acquired by confocal microscope both in fluorescent and bright-field mode. The dishes were placed into the incubator at 37 °C for 24 h and images were acquired every 24 h with the same setup. Finally, the images acquired for each sample were analyzed quantitatively by a custom algorithm using MATLAB software (see
Figure 11). The data acquired in the form of grey-scale fluorescence images were binarized by plain thresholding with a manually determined threshold (individually for each image). The scratch area was taken as a background (contained no cells) and the area of cells was taken as the foreground. Thus, a segmented image was treated by morphological filters, specifically by the morphological closing and filling of holes. Finally, the coordinates of the scratch border, the width of scratch in several segments, and the total scratch area were determined. This pipeline was applied for each scratch image in each time sample, and the computed parameters were statistically evaluated.
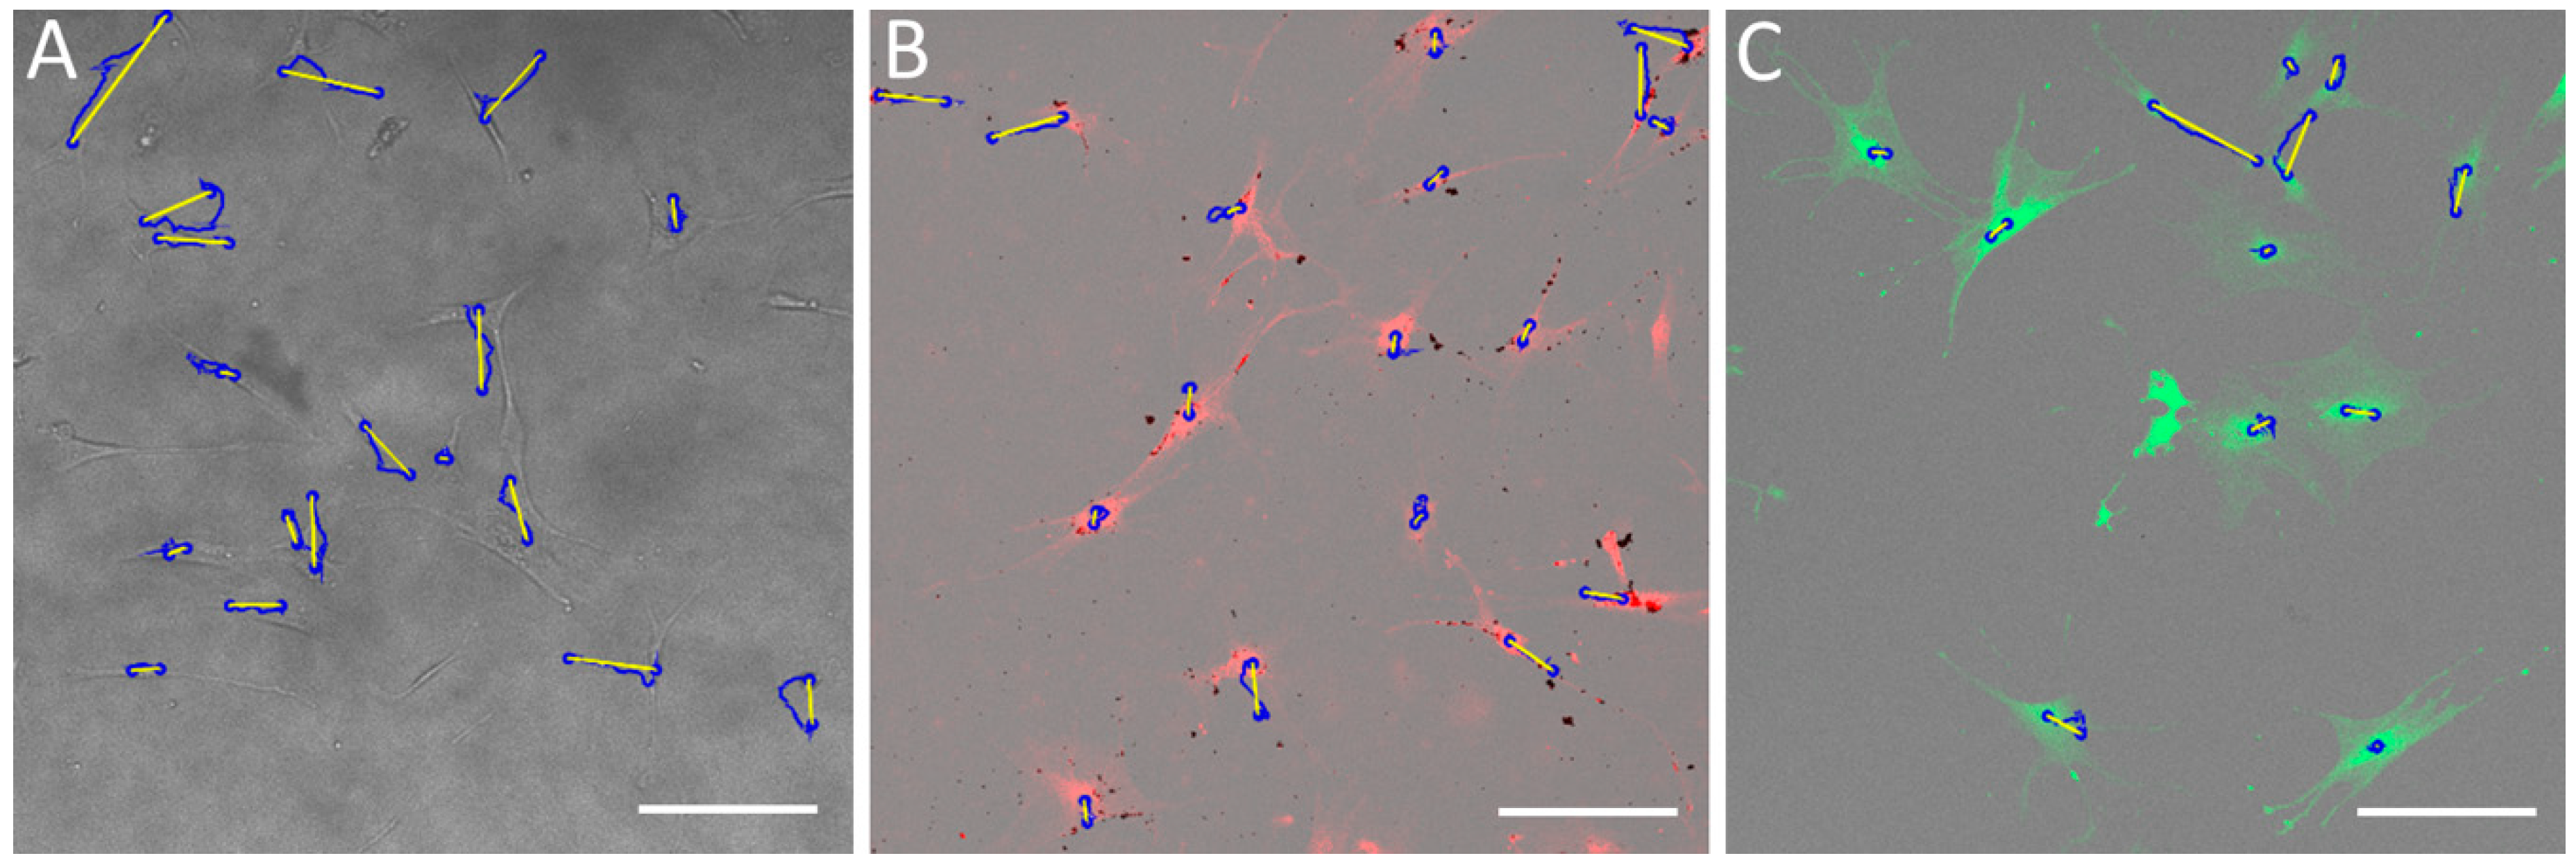
4.9. Analysis of Single-Cell Migration
To monitor the single hMSCs’ migration, cells were seeded onto three glass-bottom dishes (Cellvis) at a density of 1.5 × 10³ cells·cm−2. After 24 h, the experiment with a control sample was started and took six hours. At this time, one of the remaining samples was stained with CMFDA dye and the second was treated with SAMN-R. When the experiment with the control sample was finished, an experiment with a CMFDA-stained sample was conducted. A third sample was tested after 24 h of nanoparticle treatment.
In [
31], we introduced our developed algorithm, created in MATLAB, for the automatic detection of CMFDA fluorescent dye-labelled cells. This method has some limitations: cells should be marked with a fluorescent dye in order to be properly detected at a low surface density. This algorithm is not suitable for non-labelled cells due to low cell detection success, so we could not use it to control samples in our experiments. For these reasons, we decided to use the manual tracking plugin by ImageJ (1.52i, National Institutes of Health, Bethesda, MD, USA) with Fiji win64 package [
32,
33]. Tables with cell distribution data were exported and analyzed by a custom algorithm using MATLAB software. The main parameters were accumulated distance, Euclidean distance, and velocity.
4.10. Statistical Analysis
Statistical analyses were performed to identify the effect of SANM-R and CMFDA labelling on cell proliferation and motility. Using the F-test, we confirmed that the data were normally distributed. Then, the paired sample t-test was used to test the difference between two groups: the comparison of non-labelled cells (control group) was conducted with SAMN-R-labelled cells and CMFDA-labelled cells separately. Both statistical tests were based on the determinant of the p-value—if p > 0.05, then the distinction was considered as not statistically significant. Directional statistics were provided by the Rayleigh test of uniformity—if p > 0.05, then the distribution of cells was considered to be homogeneous. In our case, the statistical analyses were performed using MATLAB software.
5. Conclusions
Fibroblasts and MSCs play key roles in the process of wound healing, as their motility and proliferation highly correlate with the speed of the regeneration of dermal scars, muscle scars, diabetic scars, infarcted scars, and other necrotic or ischemic pathology in vivo. Any probe used for staining or transfection with these two types of migratory cells should be evaluated from the perspective of biocompatibility and cytotoxicity.
Advanced microscopic methods and MATLAB image processing statistical tools allow the precise quantification of both key cell functions: motility and morphology. Our results demonstrate that the labelling process with SAMN-R with a dose lower than 20 μg·cm−2 does not negatively affect cell morphology, migration, cytoskeletal function, proliferation, reactive oxygen synthesis, potential for wound healing, or single-cell migration. A higher dose of SAMN-R could be a potential risk for cytoskeletal folding and could lead to detachment of the cells from the solid extracellular matrix.

 ,
, 


