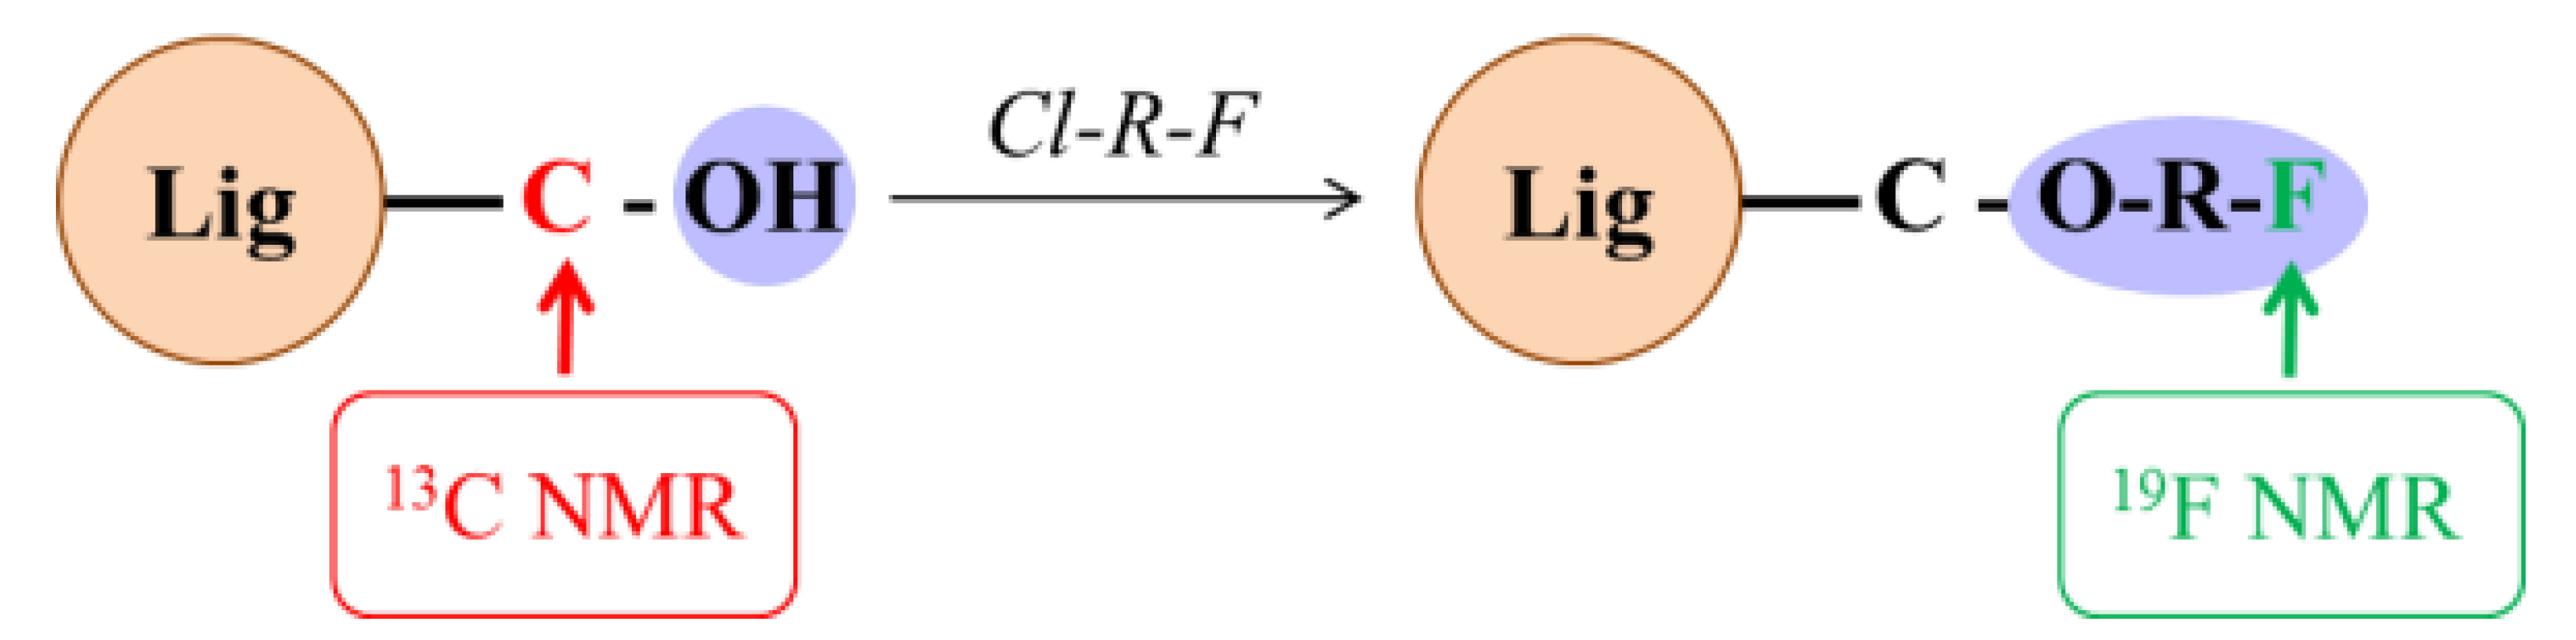
Study of the Reactivity of Lignin Model Compounds to Fluorobenzylation Using 13C and 19F NMR: Application to Lignin Phenolic Hydroxyl Group Quantification by 19F NMR

 , , and
Abstract
:
1. Introduction
2. Results and Discussion
NMR Analysis
3. Materials and Methods
3.1. Model Compounds
3.2. Commercial Lignin
3.3. Chemicals
3.4. Acetylation of the Lignin
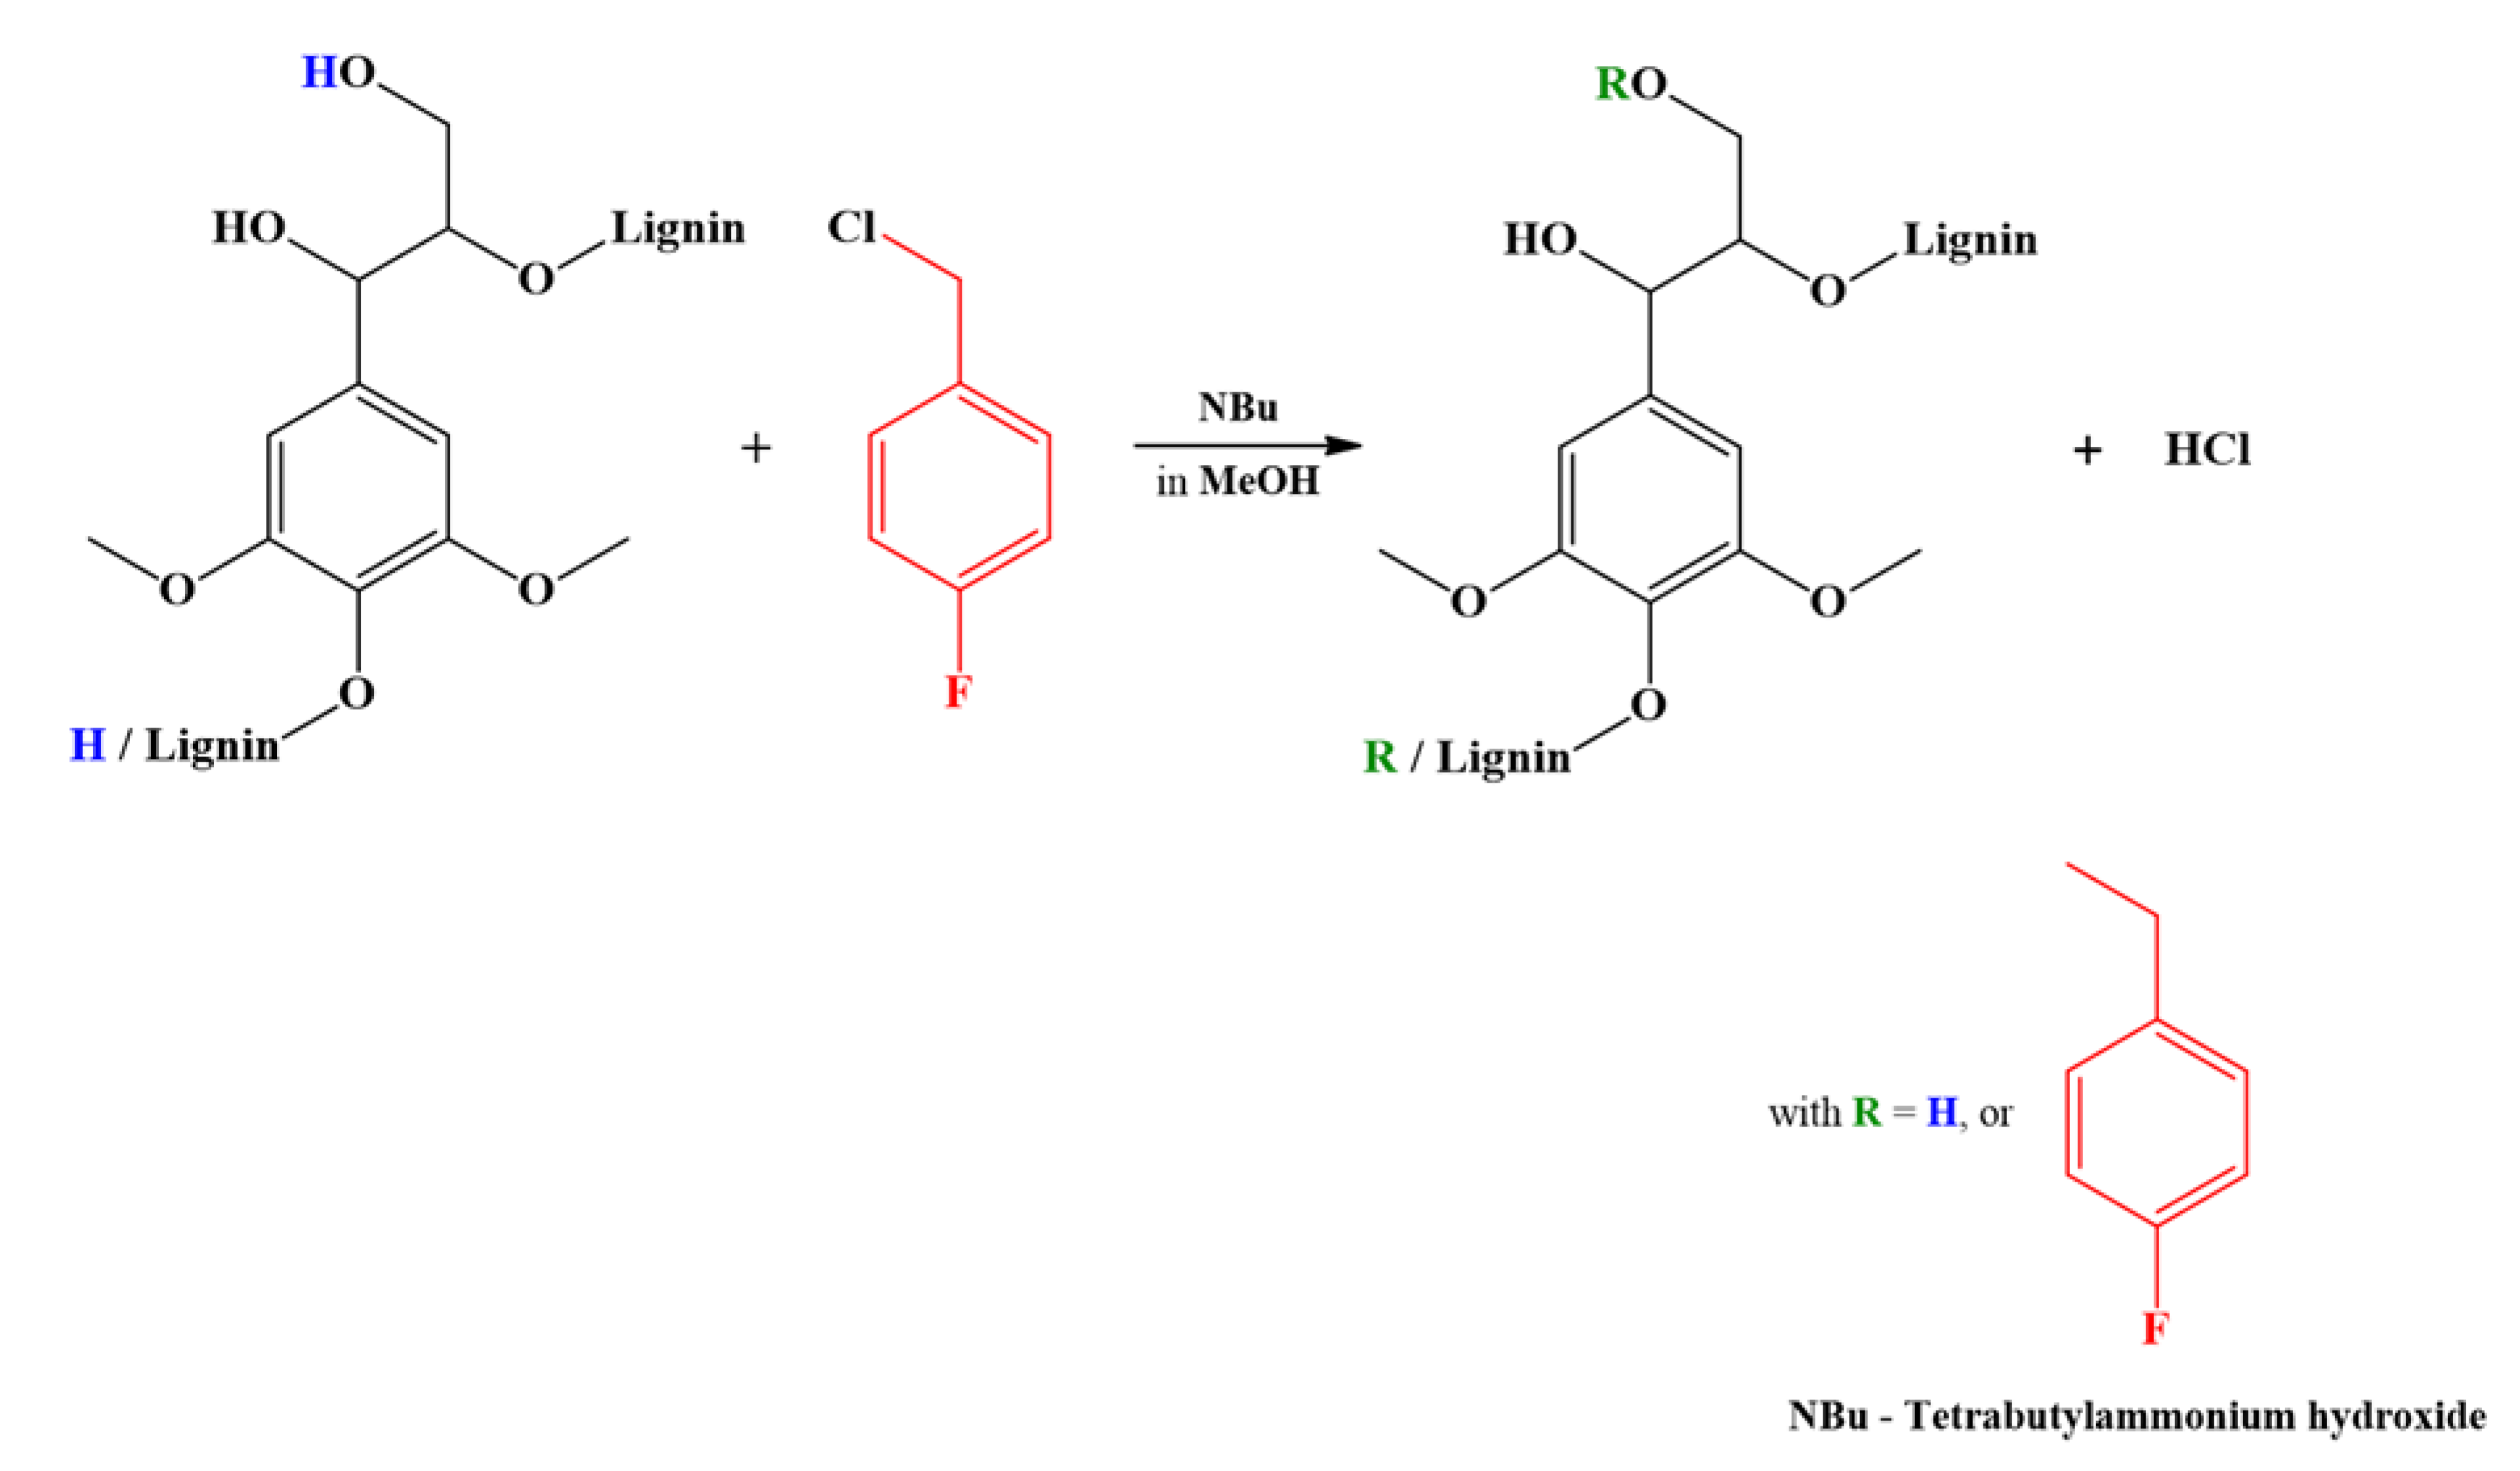
3.5. Fluorobenzylation of Model Compounds
3.6. Fluorobenzylation of the Lignin
3.7. NMR
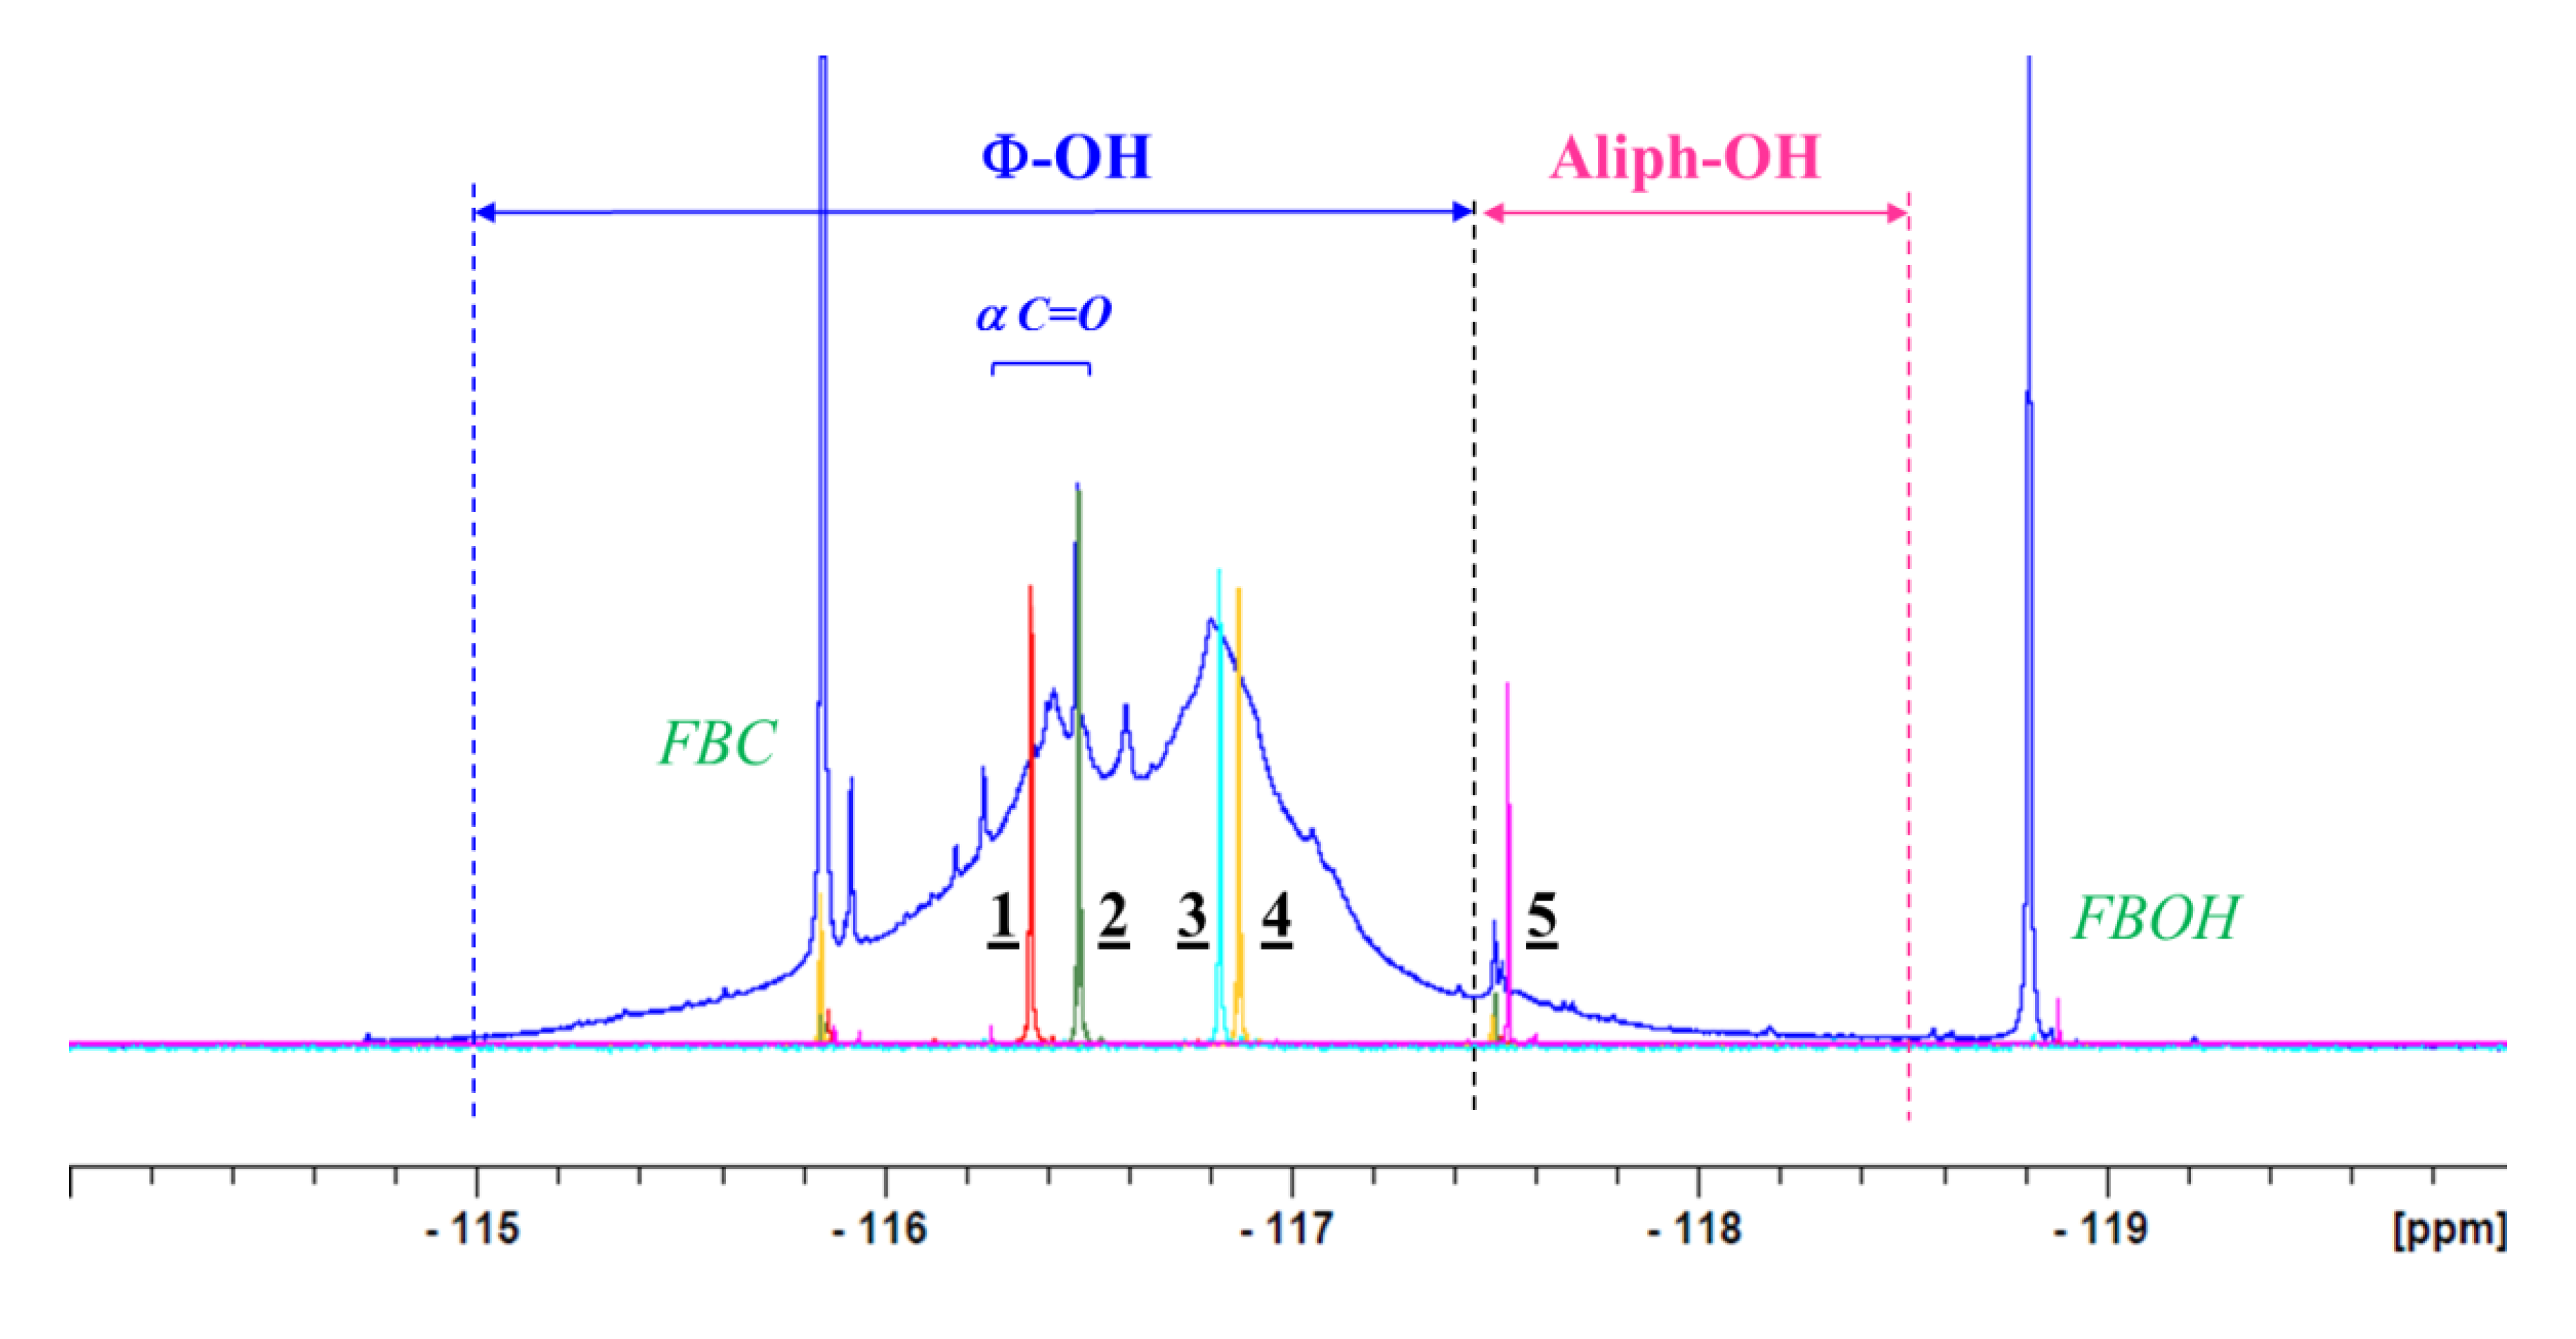
3.8. 19F-NMR
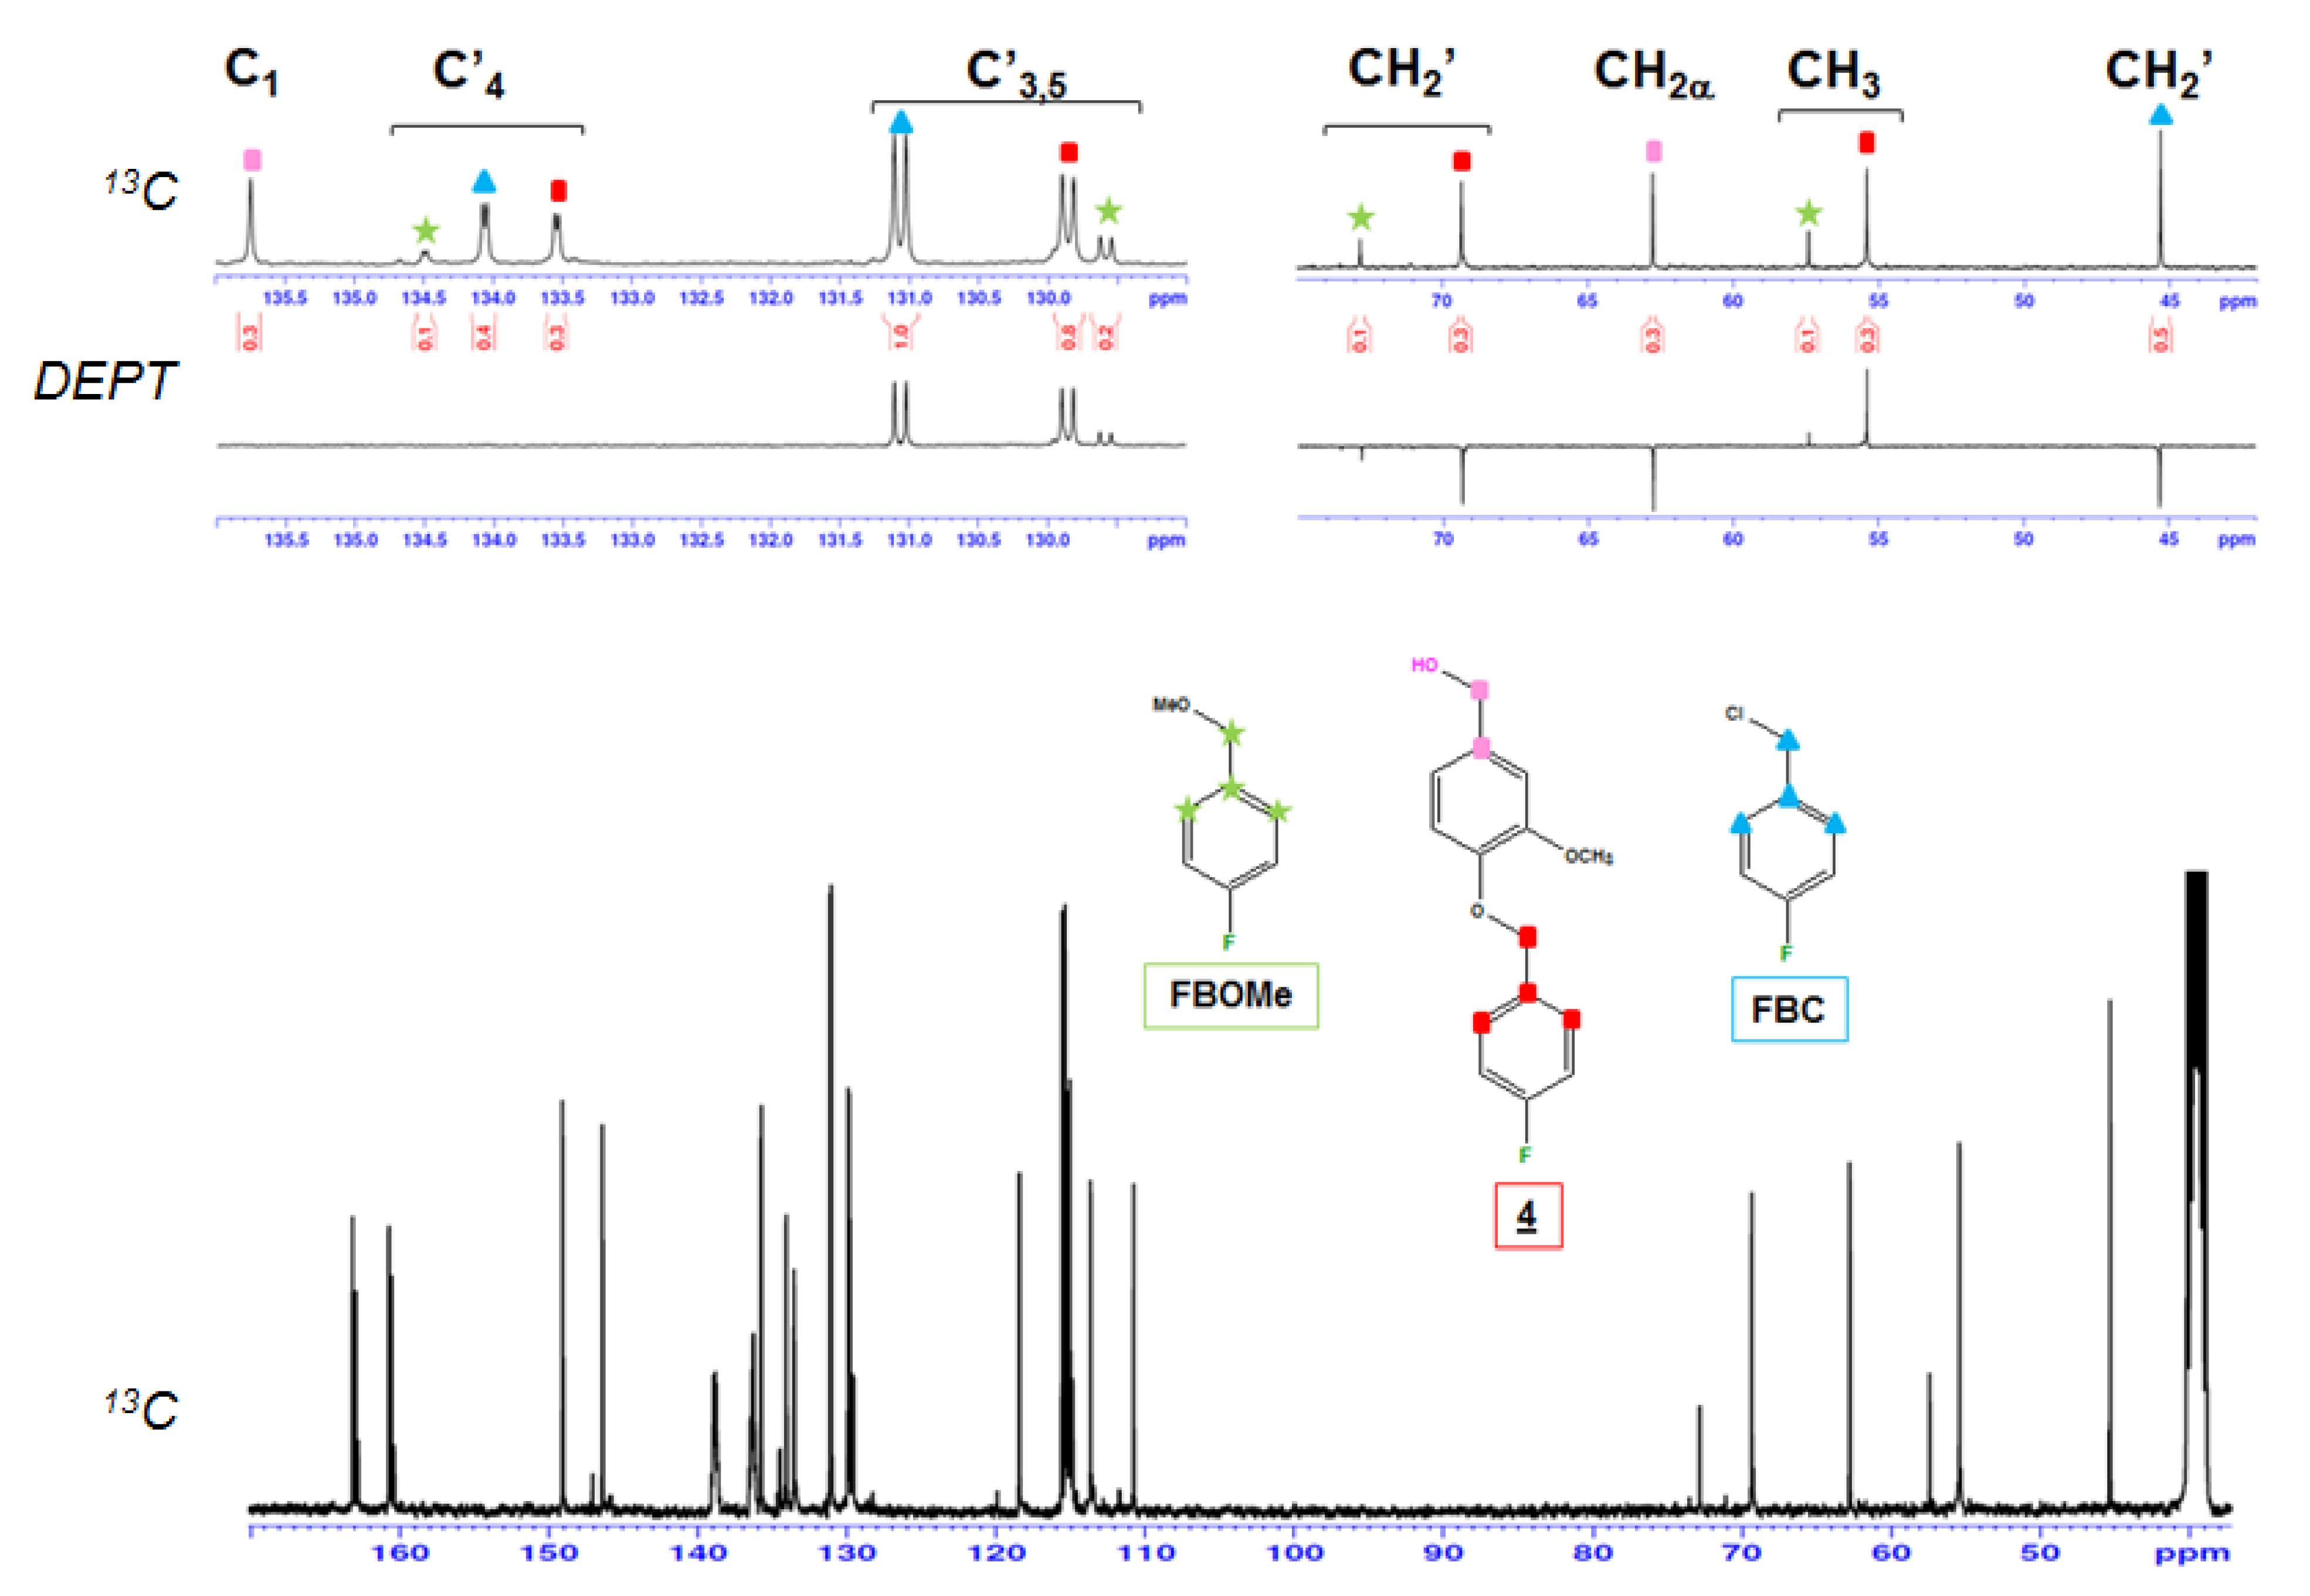
3.9. 13C-NMR
3.10. 13C DEPT
4. Conclusions
Author Contributions
Funding
Acknowledgments
Conflicts of Interest
References
- Li, C.; Zhao, X.; Wang, A.; Huber, G.W.; Zhang, T. Catalytic Transformation of Lignin for the Production of Chemicals and Fuels. Chem. Rev. 2015, 115, 11559–11624. [Google Scholar] [CrossRef] [PubMed]
- Baumberger, S.; Abaecherli, A.; Fasching, M.; Gellerstedt, G.; Gosselink, R.; Hortling, B.; Li, J.; Saake, B.; de Jong, E. Molar mass determination of lignins by size-exclusion chromatography: Towards standardisation of the method. Holzforschung 2007, 61, 459–468. [Google Scholar] [CrossRef]
- Berghel, J.; Frodeson, S.; Granström, K.; Renström, R.; Ståhl, M.; Nordgren, D.; Tomani, P. The effects of kraft lignin additives on wood fuel pellet quality, energy use and shelf life. Fuel Process. Technol. 2013, 112, 64–69. [Google Scholar] [CrossRef]
- Calvo-Flores, F.G.; Dobado, J.A.; Isac-GarcÃa, J.; MartÃn-MartÃnez, F.J. Lignin and Lignans as Renewable Raw Materials: Chemistry, Technology and Applications; John Wiley & Sons: Hoboken, NJ, USA, 2015; ISBN 978-1-118-68351-4. [Google Scholar]
- Glasser, W.G. Cross-linking Options for Lignins. In Adhesives from Renewable Resources; ACS Symposium Series; American Chemical Society: Washington, DC, USA, 1989; pp. 43–54. ISBN 978-0-8412-1562-7. [Google Scholar]
- Laurichesse, S.; Avérous, L. Chemical modification of lignins: Towards biobased polymers. Prog. Polym. Sci. 2014, 39, 1266–1290. [Google Scholar] [CrossRef]
- Kazzaz, A.E.; Feizi, Z.H.; Fatehi, P. Grafting strategies for hydroxy groups of lignin for producing materials. Green Chem. 2019, 21, 5714–5752. [Google Scholar] [CrossRef] [Green Version]
- Figueiredo, P.; Lintinen, K.; Hirvonen, J.T.; Kostiainen, M.A.; Santos, H.A. Properties and chemical modifications of lignin: Towards lignin-based nanomaterials for biomedical applications. Prog. Mater. Sci. 2018, 93, 233–269. [Google Scholar] [CrossRef]
- Lin, S.Y.; Dence, C.W. Methods in Lignin Chemistry; Springer Science & Business Media: Berlin, Germany, 1992. [Google Scholar]
- Serrano Cantador, L.; Esakkimuthu, E.S.; Marlin, N.; Brochier-Salon, M.-C.; Mortha, G.; Bertaud, F. Fast, easy and economical quantification of lignin phenolic hydroxyl groups. Comparison with classical techniques. Energy Fuels 2018, 32, 5969–5977. [Google Scholar] [CrossRef]
- Zakis, G.F. Functional Analysis of Lignins and Their Derivatives; TAPPI Press: Atlanta, GA, USA, 1994; ISBN 978-0-89852-258-7. [Google Scholar]
- Faix, O. Fourier Transform Infrared Spectroscopy. In Methods in Lignin Chemistry; Springer Series in Wood Science; Springer: Berlin/Heidelberg, Germany, 1992; pp. 233–241. ISBN 978-3-642-74067-1. [Google Scholar]
- Robert, D.R.; Brunow, G. Quantitative estimation of hydroxyl groups in milled wood lignin from spruce and in a dehydrogenation polymer from coniferyl alcohol using 13C NMR spectroscopy. Holzforsch. Int. J. Biol. Chem. Phys. Technol. Wood 1984, 38, 85–90. [Google Scholar]
- Lundquist, K. Proton 1H NMR Spectroscopy. In Methods in Lignin Chemistry; Springer Series in Wood Science; Springer: Berlin/Heidelberg, Germany, 1992; pp. 242–249. ISBN 978-3-642-74067-1. [Google Scholar]
- Cateto, C.A.; Barreiro, M.F.; Rodrigues, A.E.; Brochier-Salon, M.C.; Thielemans, W.; Belgacem, M.N. Lignins as macromonomers for polyurethane synthesis: A comparative study on hydroxyl group determination. J. Appl. Polym. Sci. 2008, 109, 3008–3017. [Google Scholar] [CrossRef]
- Hoareau, W.; Trindade, W.G.; Siegmund, B.; Castellan, A.; Frollini, E. Sugar cane bagasse and curaua lignins oxidized by chlorine dioxide and reacted with furfuryl alcohol: Characterization and stability. Polym. Degrad. Stab. 2004, 86, 567–576. [Google Scholar] [CrossRef]
- Gellerstedt, G.; Robert, D.; Parker, V.; Oivanen, M.; Eberson, L. Quantitativea 13C NMR analysis of Kraft lignins. ACTA Chem. Scand. 1987, 41b, 541–546. [Google Scholar] [CrossRef] [Green Version]
- Balakshin, M.; Capanema, E. On the quantification of lignin hydroxyl groups with 31P and 13C NMR spectroscopy. J. Wood Chem. Technol. 2015, 35, 220–237. [Google Scholar] [CrossRef]
- Xia, Z.; Akim, L.G.; Argyropoulos, D.S. Quantitative 13C NMR analysis of lignins with internal standards. J. Agric. Food Chem. 2001, 49, 3573–3578. [Google Scholar] [CrossRef] [PubMed]
- Argyropoulos, D.S.; Bolker, H.I.; Heitner, C.; Archipov, Y. 31P NMR Spectroscopy in wood chemistry. Part IV. Lignin models: Spin lattice relaxation times and solvent effects in 31P NMR. Holzforsch. Int. J. Biol. Chem. Phys. Technol. Wood 1993, 47, 50–56. [Google Scholar] [CrossRef]
- Argyropoulos, D.S. Quantitative Phosphorus-31 NMR analysis of six soluble lignins. J. Wood Chem. Technol. 1994, 14, 65–82. [Google Scholar] [CrossRef]
- Zawadzki, M.; Ragauskas, A. N-hydroxy compounds as new internal standards for the 31P-NMR determination of lignin hydroxy functional groups. Holzforschung 2001, 55, 283–285. [Google Scholar] [CrossRef]
- Argyropoulos, D.S.; Heitner, C.; Morin, F.G. P NMR Spectroscopy in wood chemistry-Part III. Solid state 31P NMR of trimethyl phosphite derivatives of chromophores in mechanical pulp. Holzforsch. Int. J. Biol. Chem. Phys. Technol. Wood 1992, 46, 211–218. [Google Scholar] [CrossRef]
- Argyropoulos, D.S.; Zhang, L. Semiquantitative Determination of quinonoid structures in isolated lignins by 31P nuclear magnetic resonance. J. Agric. Food Chem. 1998, 46, 4628–4634. [Google Scholar] [CrossRef]
- Berlin, A.; Balakshin, M. Chapter 18-Industrial lignins: Analysis, properties, and applications. In Bioenergy Research: Advances and Applications; Elsevier: Amsterdam, The Netherlands, 2014; pp. 315–336. ISBN 978-0-444-59561-4. [Google Scholar]
- Granata, A.; Argyropoulos, D.S. 2-Chloro-4,4,5,5-tetramethyl-1,3,2-dioxaphospholane, a reagent for the accurate determination of the uncondensed and condensed phenolic moieties in lignins. J. Agric. Food Chem. 1995, 43, 1538–1544. [Google Scholar] [CrossRef]
- Meng, X.; Crestini, C.; Ben, H.; Hao, N.; Pu, Y.; Ragauskas, A.J.; Argyropoulos, D.S. Determination of hydroxyl groups in biorefinery resources via quantitative 31 P NMR spectroscopy. Nat. Protoc. 2019, 14, 2627–2647. [Google Scholar] [CrossRef]
- Barrelle, M.; Fernandes, J.C.; Froment, P.; Lachenal, D. An approach to the determination of functional groups in oxidized lignins by 19F NMR. J. Wood Chem. Technol. 1992, 12, 413–424. [Google Scholar] [CrossRef]
- Barrelle, M. A new method for the quantitative 19F NMR spectroscopic analysis of hydroxyl groups in lignins. Holzforsch. Int. J. Biol. Chem. Phys. Technol. Wood 1993, 47, 261–267. [Google Scholar] [CrossRef]
- Barrelle, M. Improvements in the structural investigation of lignins by 19F NMR spectroscopy. J. Wood Chem. Technol. 1995, 15, 179–188. [Google Scholar] [CrossRef]
- Sevillano, R.M.; Mortha, G.; Barrelle, M.; Lachenal, D. 19F NMR Spectroscopy for the quantitative analysis of carbonyl groups in lignins. Holzforschung 2001, 55, 286–295. [Google Scholar] [CrossRef]
- Huang, F.; Pan, S.; Pu, Y.; Ben, H.; Ragauskas, J.A. 19F NMR spectroscopy for the quantitative analysis of carbonyl groups in bio-oils. RSC Adv. 2014, 4, 17743–17747. [Google Scholar] [CrossRef]
- Constant, S.; Lancefield, C.S.; Weckhuysen, B.M.; Bruijnincx, P.C.A. Quantification and classification of carbonyls in industrial humins and lignins by 19F NMR. ACS Sustain. Chem. Eng. 2017, 5, 965–972. [Google Scholar] [CrossRef]
- Adeosun, S.O.; Gbenebor, O.P. Characterization techniques and quality assessment of lignin and lignin carbon materials. In Sustainable Lignin for Carbon Fibers: Principles, Techniques, and Applications; Akpan, E.I., Adeosun, S.O., Eds.; Springer International Publishing: Cham, Switzerland, 2019; pp. 193–279. [Google Scholar]
- Savy, D.; Mazzei, P.; Drosos, M.; Cozzolino, V.; Lama, L.; Piccolo, A. Molecular characterization of extracts from biorefinery wastes and evaluation of their plant biostimulation. ACS Sustain. Chem. Eng. 2017, 5, 9023–9031. [Google Scholar] [CrossRef]
- Delmas, G.-H.; Benjelloun-Mlayah, B.; Bigot, Y.L.; Delmas, M. Functionality of wheat straw lignin extracted in organic acid media. J. Appl. Polym. Sci. 2011, 121, 491–501. [Google Scholar] [CrossRef]
Sample Availability: Samples of the compounds are not available from the authors. |


| δc (in ppm) | 45.3 | 57.54 | 62–63 | 69–71 | 72.81 |
|---|---|---|---|---|---|
| Methylene Group | -CH2Cl | -CH2N | -CH2OH | -CH2OR | -CH2OMe |
| Compounds | FBC | NBu | Aliphatic OH FBOH (a) | F-derivatized compounds | FBOMe (b) |
| Compounds | Fluorobenzylation Conversion (%) | Mixture Composition (%) | |||||
|---|---|---|---|---|---|---|---|
| Unreacted Starting Compound | F-Compound | FBC Reagent | FBOH | FBOMe | NBu | ||
| 1 | 100 | - | 93.6 | 6.4 | - | - | - |
| 2 | 100 | - | 81.3 | 5.2 | - | 8.3 | 5.2 |
| 3 | 100 | - | 67.6 | 24.5 | - | 4.1 | 3.8 |
| 4 | 100 | - | 34.0 | 53.9 | Traces | 10.1 | - |
| 51 day | 9 | 71.5 | 7.1 | - | Traces | - | 21.4 |
| 53 days | 8 | 27.2 | 2.7 | 32.8 | Traces | 30.3 | 7 |
| 6Organic part | 0 | - | - | - | 74 | - | 26 |
| 6Aqueous part | 0 | 10 | - | - | - | - | 90 |
| FBC blank | 94.1 | - | - | 5.9 | - | - | |
| FBC reacted | - | - | - | 7.9 | - | 92.1 | |
| Compounds | 1 | 2 | 3 | 4 | 5 | |
|---|---|---|---|---|---|---|
| Model Compounds Part | C1 | 129.8 | 130.14 | 120.59 | 135.75 | 130.61 |
| C2 | 109.9 | 110.4 | 112.22 | 110.76 | 110.51 | |
| C3 | 149.4 | 151.88 | 149.23 | 149.05 | 148.65 | |
| C4 | 153 | 148.79 | 147.66 | 146.38 | 148.30 | |
| C5 | 112.6 | 112.27 | 113.88 | 113.66 | 111.51 | |
| C6 | 125.8 | 122.92 | 121.25 | 118.45 | 120.04 | |
| OCH3 | 55.53 | 55.51 | 55.44 | 55.39 | 55.38 55.46 | |
| C=O | - | 196.2 | - | - | - | |
| HC=O | 191.34 | - | - | - | - | |
| CH2 (α) | - | - | - | 62.76 | 71.36 | |
| CH3 | - | 26.31 | - | - | - | |
| FBC Part | C′H2 | 69.28 | 69.15 | 69.15 | 69.33 | 70.33 |
| C′4 | 132.5 | 132.74 | 133.44 | 133.54 | 134.71 | |
| 4JCF(Hz) | 2.84 | |||||
| C′3,C′5 | 130.2 | 130.14 | 129.92 | 129.85 | 129.57 | |
| 3JCF(Hz) | 9.2 | |||||
| C′2,C′6 | 115.3 | 115.29 | 115.15 | 115.15 | 115.40 | |
| 2JCF(Hz) | 21.45 | |||||
| C′1 | 161.98 | 161.88 | 161.7 | 161.72 | 161.56 | |
| 1JCF(Hz) | 243 | |||||
| Compounds | F-Compound Conversion (%) | Mixture Composition (%) | |||
|---|---|---|---|---|---|
| F-Compound | FBC Reagent | FBOH | FBOMe | ||
| 1 | 100 | 94.5 | 5.5 | - | - |
| 2 | 100 | 86.3 | 6.3 | - | 7.4 |
| 3 | 100 | 72.3 | 23.3 | - | 4.4 |
| 4 | 98 | 38.8 | 55.9 | 1.1 | 10.2 |
| 51 day | 16 | 89.7 | - | 10.3 | - |
| 53 days | 12 | 4.9 | 46.0 | 0.6 | 48.5 |
| 6Organic part | 0 | - | - | 100 | - |
| 6Aqueous part | 0 | - | - | - | - |
| FBC | - | 99.9 | - | 0.1 | - |
| FBC reacted | - | - | - | 100 | - |
| Compounds | δF (ppm) | Nature |
|---|---|---|
| 1 | −116.36 | Φ-OH + Aldehyde (α) |
| 2 | −116.49 | Φ-OH + Ketone (α) |
| 3 | −116.89 | Φ-OH |
| 4 | −116.99 | Φ-OH |
| 5 | −117.50 | CH2OH |
| 6 | - | CH2OH |
| MeOH | −117.49 | CH3OH |
| FBC (blank) | −115.85 | CH2Cl |
| FBOH | −118.7 | CH2OH |
| 19F-NMR | Aminolysis | UV | 1H-NMR | 13C-NMR | 31P-NMR | Fast Method |
|---|---|---|---|---|---|---|
| 1.7 | 2.4 | 1.7 | 0.9 | 2.0 | 1.3 | 1.5 |
| Characteristics | 19F | 13C [34] | 31P [27] |
|---|---|---|---|
| Natural abundance | 100% | 1.108% | 100% |
| Sample quantity | 15–20 mg | 100–300 mg | 30 mg |
| Acquisition time | Up to 30 min | Up to 36 h | 30–120 min |
| Derivatization | Fluorobenzylation | Acetylation | Phosphitylation |
| Reaction time | 1 day | 1 day | in-situ reaction |
| Stability of derivatized sample | Good stability | Good stability | Not stable for a long period; requires instant acquisition |
| Sugar contaminants | No influence | Strong influence (requires high purity samples) | Strong influence (requires high purity samples) |
| Structural information | Provides structural information only for phenolic hydroxyl groups | Provides detailed structural information; Severe overlap for high molecular weight lignin | Detailed chemical information for phenolic hydroxyl groups, primary and secondary aliphatic hydroxyl groups, stereo-chemical information |
| Limitations | Poor reactive towards aliphatic hydroxyl groups | Difficult to determine side chain carbons in different lignin substructures | Expensive phosphitylating reagent (TMDP); however, it can be synthesized easily by the procedure described in Reference [35] |
© 2020 by the authors. Licensee MDPI, Basel, Switzerland. This article is an open access article distributed under the terms and conditions of the Creative Commons Attribution (CC BY) license (http://creativecommons.org/licenses/by/4.0/).
Share and Cite
Esakkimuthu, E.S.; Marlin, N.; Brochier-Salon, M.-C.; Mortha, G. Study of the Reactivity of Lignin Model Compounds to Fluorobenzylation Using 13C and 19F NMR: Application to Lignin Phenolic Hydroxyl Group Quantification by 19F NMR. Molecules 2020, 25, 3211. https://doi.org/10.3390/molecules25143211
Esakkimuthu ES, Marlin N, Brochier-Salon M-C, Mortha G. Study of the Reactivity of Lignin Model Compounds to Fluorobenzylation Using 13C and 19F NMR: Application to Lignin Phenolic Hydroxyl Group Quantification by 19F NMR. Molecules. 2020; 25(14):3211. https://doi.org/10.3390/molecules25143211
Chicago/Turabian StyleEsakkimuthu, Esakkiammal Sudha, Nathalie Marlin, Marie-Christine Brochier-Salon, and Gérard Mortha. 2020. "Study of the Reactivity of Lignin Model Compounds to Fluorobenzylation Using 13C and 19F NMR: Application to Lignin Phenolic Hydroxyl Group Quantification by 19F NMR" Molecules 25, no. 14: 3211. https://doi.org/10.3390/molecules25143211