
Crystal Memory near Discontinuous Triacylglycerol Phase Transitions: Models, Metastable Regimes, and Critical Points


Abstract
:
1. Introduction
2. Results
2.1. Theory and Models: The g-e Model
2.2. Theory and Models: Some (Bulk) Thermodynamic Properties of the Model
2.3. Theory and Models. Mean Field Approximation
2.4. Metastable Regimes
2.5. Predictions of the Mean Field Approximation (MFA)
2.6. Lifetimes of Metastable States
2.7. Results from Theoretical Model, Crystal Memory, Metastable Regimes, and Relaxation
3. Discussion
3.1. Predictions to Test the Model
3.2. Relating Experimental Data to Theoretical Calculations. Crystal Memory. Holding Time-Temperature Relationship
4. Conclusions
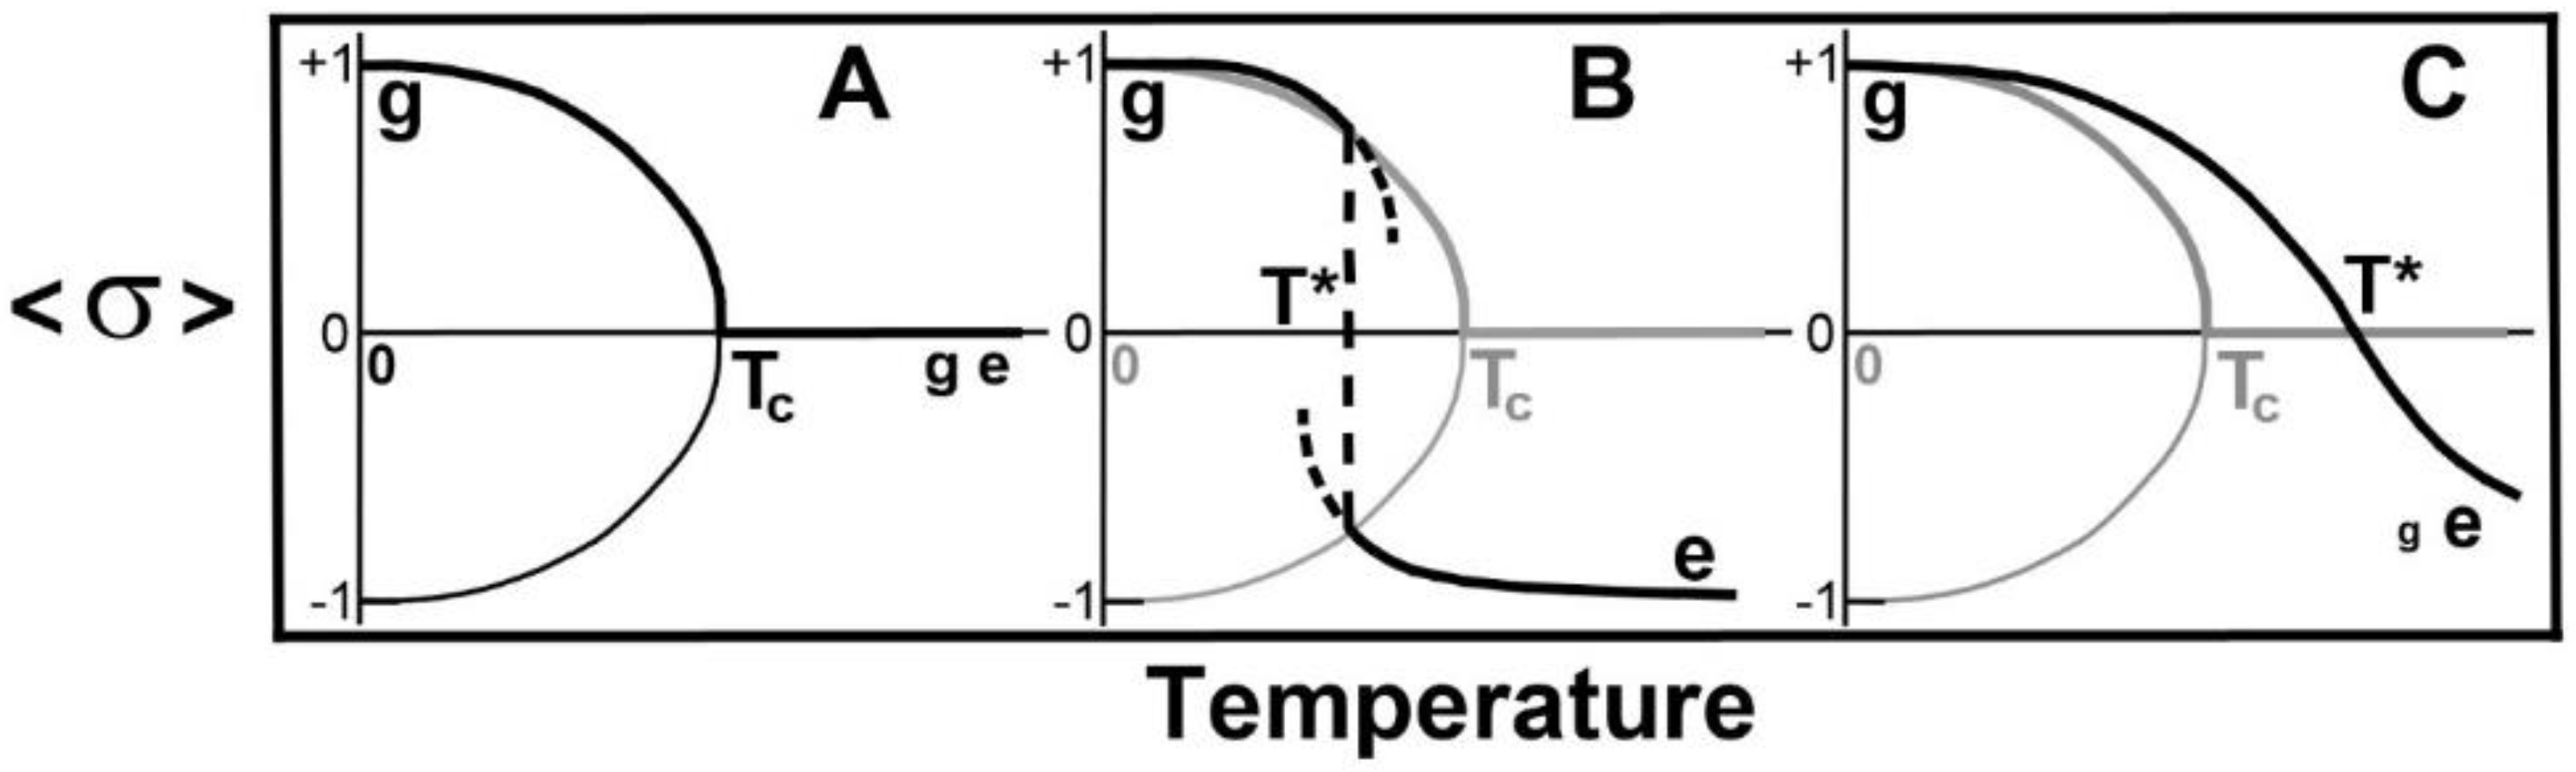
- There is a critical point at which plays an important role in whether there is a discontinuous transition, a continuous transition or a crossover with no divergences in thermodynamic quantities, at .
- The dependence of and upon hydrocarbon chain length, L, are different. The effect of this is that, as L goes to zero, goes to zero, while, as L gets sufficiently large, then depends linearly upon L and so becomes large. By changing the hydrocarbon chain length, L, this offers a way to observe changes in the phase transition or crossover, as shown in Figure 2.
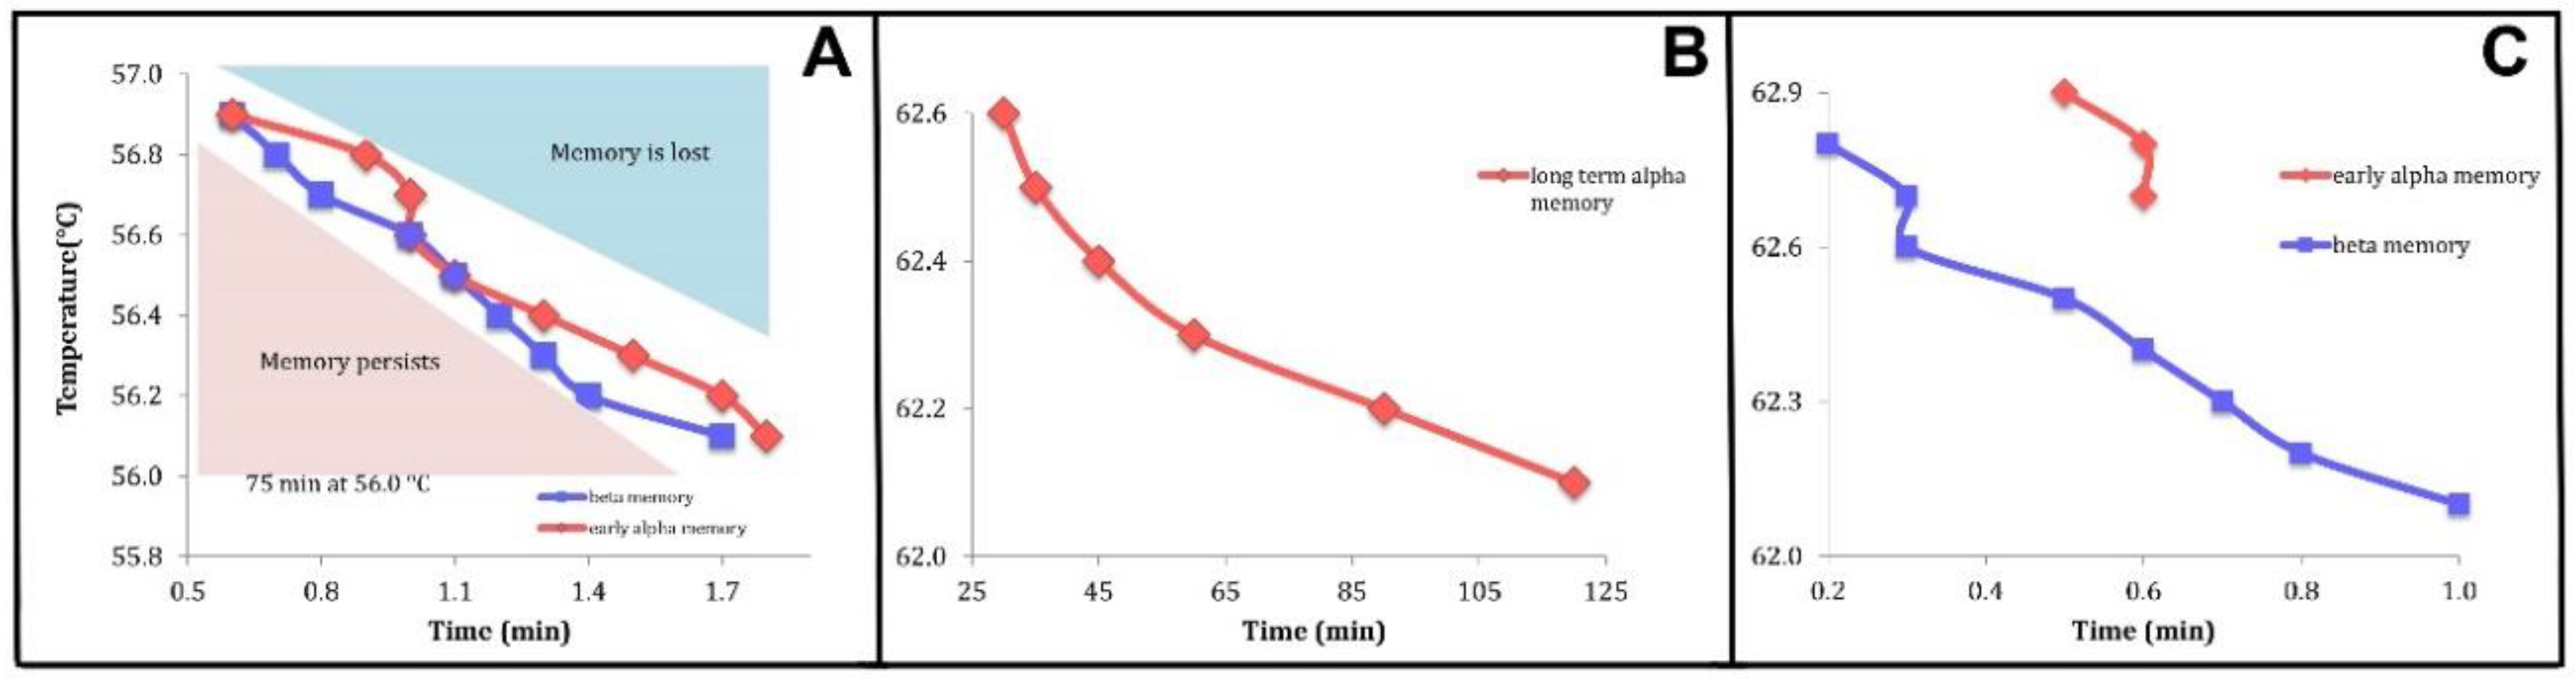
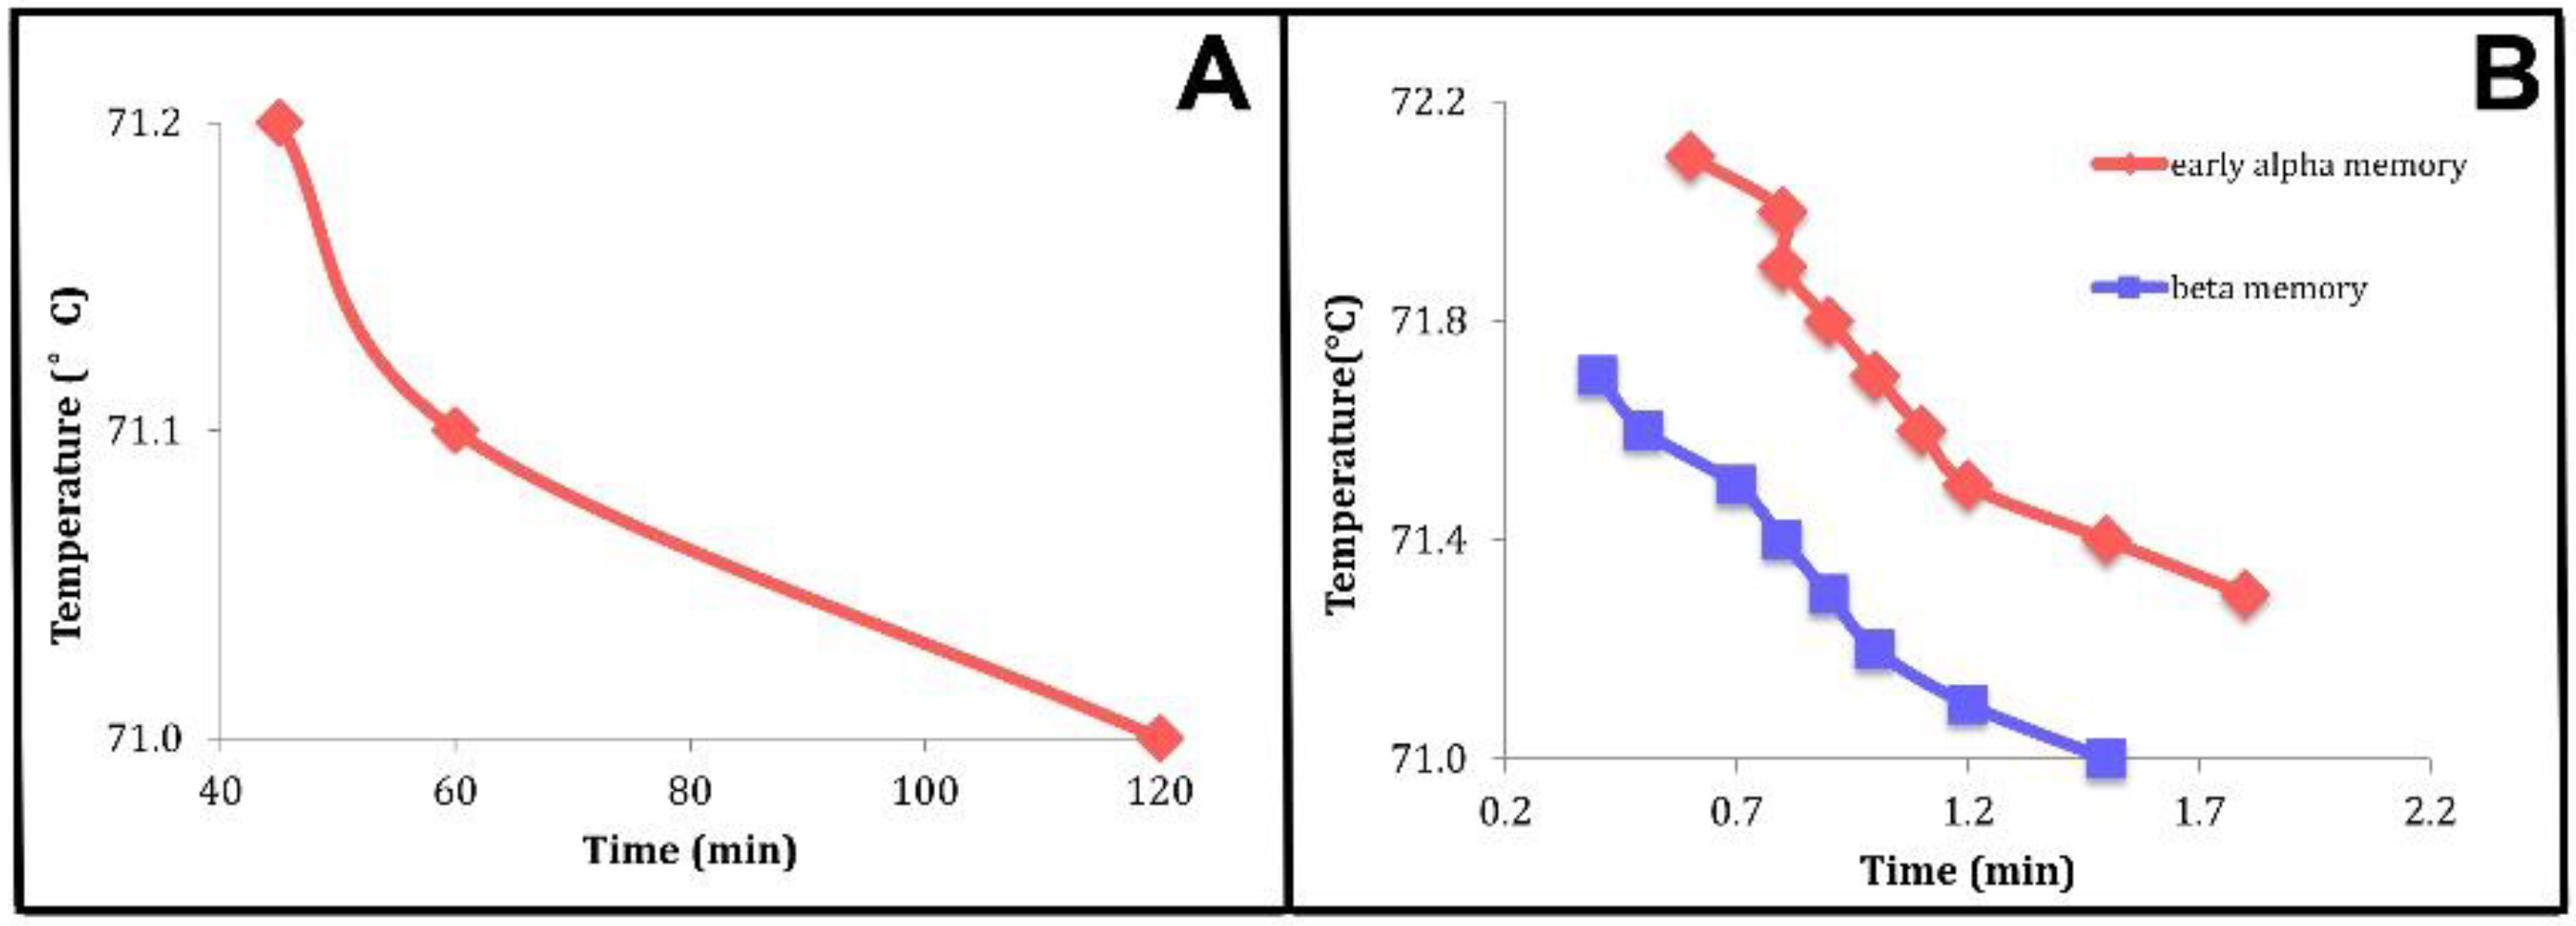
- We showed that the observed “crystal memory” effect could be explained by the existence of the metastable regimes (Figure 4 and Figure 7). The model says that the average time, the holding time, to relax to the high-temperature equilibrium state must decrease, the higher the temperature, as reported in point 3.
Author Contributions
Funding
Acknowledgments
Conflicts of Interest
References
- Wang, Y. Boundaries of the Crystal Memory effect in Saturated Triacylglycerols. Master’s Thesis, Dalhousie University, Halifax, NS, Canada, 2016. [Google Scholar]
- Sato, K.; Bayés-García, L.; Calvet, T.; Cuevas-Diarte, M.A.; Ueno, S. External factors affecting polymorphic crystallization of lipids. Eur. J. Lipid Sci. Technol. 2013, 115, 1224–1238. [Google Scholar] [CrossRef]
- Verstringe, S.; Dewettinck, K.; Ueno, S.; Sato, K. Triacylglycerol Crystal Growth: Templating Effects of Partial Glycerols Studied with Synchrotron Radiation Microbeam X-ray Diffraction. Cryst. Growth Des. 2014, 14, 5219–5226. [Google Scholar] [CrossRef]
- Da Silva, T.L.T.; Domingues, M.A.F.; Chiu, M.C.; Goncalves, L.A.G. Templating effects of dipalmitin on soft palm mid-fraction crystals. Int. J. Food Prop. 2017, 20, S935–S947. [Google Scholar] [CrossRef]
- Ladd Parada, M. The Effects of Pressure and Thermal History on the Crystallisation of Cocoa Butter. Ph.D. Thesis, University of Leeds, Leeds, UK, 2018. [Google Scholar]
- Toda, A.; Taguchi, K.; Nozaki, K.; Fukushima, T.; Kaji, H. Superheated melting kinetics of metastable chain-folded polymer crystals. Cryst. Growth Des. 2018, 18, 3637–3643. [Google Scholar] [CrossRef]
- Liavitskaya, T.; Birx, L.; Vyazovkin, S. Melting kinetics of superheated crystals of glucose and fructose. Phys. Chem. Chem. Phys. 2017, 19, 26056–26064. [Google Scholar] [CrossRef]
- Toda, R.; Yamamura, K.; Taguchi, T.; Fukushima, H.; Kaji, H. Kinetics of “melting” of sucrose crystals. Cryst. Growth Des. 2018, 18, 2602–2608. [Google Scholar] [CrossRef]
- Hondoh, H.; Ueno, S.; Sato, K. Fundamental aspects of crystallization of lipids. In Crystallization of Lipids; Sato, K., Ed.; Wiley-Blackwell: Hoboken, NJ, USA, 2018; pp. 105–141. [Google Scholar]
- Martins, J.A.; Zhang, W.; Brito, A.M. Origin of the melt memory effect in polymer crystallization. Polymer 2010, 51, 4185–4194. [Google Scholar] [CrossRef]
- Maus, A.; Hempel, E.; Thurn-Albrecht, T.; Saalwächter, K. Memory effect in isothermal crystallization of syndiotactic polypropylene—Role of melt structure and dynamics. Eur. Phys. J. E 2007, 23, 91–101. [Google Scholar] [CrossRef]
- Toda, A.; Androsch, R.; Schick, C. Insights into polymer crystallization and melting from fast scanning chip calorimetry. Polymer 2016, 91, 239–263. [Google Scholar] [CrossRef]
- Van Malssen, K.; Peschar, R.; Brito, C.; Schenk, H. Real-time X-ray powder diffraction investigations on cocoa butter. III. Direct β-crystallization of cocoa butter: Occurrence of a memory effect. J. Am. Oil Chem. Soc. 1996, 73, 1225–1230. [Google Scholar] [CrossRef]
- Yoshimoto, N.; Sato, K. Preheating effects of melt on nucleation and growth of oleic acid polymorphs. Jpn. J. Appl. Phys. 1994, 33, 2746–2749. [Google Scholar] [CrossRef]
- Dibildox-Alvarado, E.; Laredo, T.; Toro-Vazquez, J.F.; Marangoni, A.G. Pre-nucleation structuring of TAG melts revealed by fluorescence polarization spectroscopy and molecular mechanics simulations. J. Am. Oil Chem. Soc 2010, 87, 1115–1125. [Google Scholar] [CrossRef]
- Sadeghpour, A.; Ladd-Parada, M.; Vieira, J.; Povey, M.; Rappolt, M. Global Small-Angle X-ray Scattering Data Analysis of Triacylglycerols in the Molten State (Part I). J. Phys. Chem. B 2018, 122, 10320–10329. [Google Scholar] [CrossRef] [PubMed]
- Ladd-Parada, M.; Sadeghpour, A.; Vieira, J.; Povey, M.J.; Rappolt, M. Global Small-Angle X-ray Scattering Data Analysis of Triacylglycerols in the α-Phase (Part II). J. Phys. Chem. B 2018, 122, 10330–10336. [Google Scholar] [CrossRef] [PubMed]
- Ladd-Parada, M.; Povey, M.J.; Vieira, J.; Rappolt, M.; Ries, M.E. Early stages of fat crystallisation evaluated by low-field NMR and small-angle X-ray scattering. Magn. Reson. Chem. 2019, 57, 686–694. [Google Scholar] [CrossRef] [Green Version]
- Muthukumar, M.J. Communication: Theory of melt-memory in polymer crystallization. Chem. Phys. 2016, 145, 031105-1–031105-5. [Google Scholar] [CrossRef] [PubMed]
- Sato, K.; Ueno, S. Crystallization, transformation and microstructures of polymorphic fats in colloidal dispersion states. Curr. Opin. Colloid Interface Sci. 2011, 16, 384–390. [Google Scholar] [CrossRef]
- Baidakov, V.G. Phase equilibria, metastable states, and critical points in a simple one-component system. J. Eng. Thermophys. 2016, 25, 327–336. [Google Scholar] [CrossRef]
- Sum, A.K.; Biddy, M.J.; de Pablo, J.J.; Tupy, M.J. Predictive molecular model for the thermodynamic and transport properties of triacylglycerols. J. Phys. Chem. B 2003, 107, 14443–14451. [Google Scholar] [CrossRef]
- Hall, A.; Repakova, J.; Vattulainen, I. Modeling of the triglyceride-rich core in lipoprotein particles. J. Phys. Chem. B 2008, 112, 13772–13782. [Google Scholar] [CrossRef]
- Hsu, W.D.; Violi, A. Order−disorder phase transformation of triacylglycerols: Effect of the structure of the aliphatic chains. J. Phys. Chem. B 2009, 113, 887–893. [Google Scholar] [CrossRef] [PubMed]
- Ionov, G.V.; Dremov, V.V.; Karavaev, A.V.; Protsenko, S.P.; Baidakov, V.G.; Tipeev, A.O. Evaluation of metastable region boundaries for liquid and solid states in MD simulations. J. Phys. Conf. Ser. 2014, 500, 172004-1–172004-6. [Google Scholar] [CrossRef] [Green Version]
- Pink, D.A.; Hanna, C.B.; Sandt, C.; MacDonald, A.J.; MacEachern, R.; Corkery, R.; Rousseau, D. Modeling the solid-liquid phase transition in saturated triglycerides. J. Chem. Phys. 2010, 132, 054502-1–054502-11. [Google Scholar] [CrossRef] [PubMed] [Green Version]
- Cheng, S.Z.D.; Keller, A. The role of metastable states in polymer phase transitions: Concepts, principles, and experimental observations. Annu. Rev. Mater. Sci. 1998, 28, 533–562. [Google Scholar] [CrossRef]
- Mykhaylyk, O.O.; Smith, K.W.; Martinc, C.M.; Ryan, A.J. Structural models of metastable phases occurring during the crystallization process of saturated/unsaturated triacylglycerols. J. Appl. Cryst. 2007, 40, s297–s302. [Google Scholar] [CrossRef]
- Larsson, K. Molecular arrangement in glycerides. Fette Seifen Anstrichm. 1972, 74, 136–142. [Google Scholar] [CrossRef]
- Cebula, D.J.; McClements, D.J.; Povey, M.J.W.; Smith, P.R. Neutron diffraction studies of liquid and crystalline trilaurin. J. Amer. Oil Chem. Soc. 1992, 69, 130–136. [Google Scholar] [CrossRef]
- Pink, D.A.; Razul, M.S.G.; Gordon, T.; Quinn, B.; MacDonald, A.J. Computer Simulation Techniques for Modelling Statics and Dynamics of Nanoscale Structures. In Edible Nanostructures: A Bottom-Up Approach; Marangoni, A.G., Pink, D.A., Eds.; Royal Society of Chemistry: Cambridge, UK, 2015. [Google Scholar]
- Doniach, S. Thermodynamic fluctuations in phospholipid bilayers. J. Chem. Phys. 1978, 68, 4912–4916. [Google Scholar] [CrossRef]
- Brush, S.G. History of the Lenz-Ising model. Rev. Mod. Phys. 1967, 39, 883–893. [Google Scholar] [CrossRef]
- Selinger, J.V. Introduction to the Theory of Soft Matter, Chapter 2; Springer International Publishing: Cham, Switzerland, 2016. [Google Scholar]
- Kruis, J.; Maris, G. Three representations of the Ising model. Sci. Rep. 2016, 6, 34175-1–34175-11. [Google Scholar] [CrossRef] [Green Version]
- Chaikin, P.M.; Lubensky, T.C. Principles of Condensed Matter Physics, 4th ed.; Cambridge University Press: Cambridge, UK, 2007. [Google Scholar]
- Kadanoff, L.P. More is the same; phase transitions and mean field theories. J. Stat. Phys. 2009, 137, 777–797. [Google Scholar] [CrossRef]
- Ueno, S.; Ristic, R.I.; Hogaki, K.; Sato, K. In Situ Studies of Ultrasound-Stimulated Fat Crystallization Using Synchrotron Radiation. J. Phys. Chem. B 2003, 107, 4927–4935. [Google Scholar] [CrossRef]
- Keller, A.; Cheng, S.Z.D. The role of metastability in polymer phase transitions. Polymer 1998, 39, 4461–4487. [Google Scholar] [CrossRef]
- Salem, L. Attractive forces between long saturated chains at short distances. J. Chem. Phys. 1962, 37, 2100–2113. [Google Scholar] [CrossRef]
- Pink, D.A.; Green, T.J.; Chapman, D. Raman scattering in bilayers of saturated phosphatidylcholines. Experiment and theory. Biochemistry 1980, 19, 349–356. [Google Scholar] [CrossRef] [PubMed]
- Caillé, A.; Pink, D.A.; de Verteuil, F.; Zuckermann, M.J. The thermodynamic properties of mixed phospholipid bilayers: A theoretical analysis. Can. J. Phys. 1980, 58, 581–661. [Google Scholar] [CrossRef]
- Israelachvili, J. Intermolecular and Surface Forces; Academic Press: London, UK, 2010. [Google Scholar]
- Parsegian, V.A. Van der Waals Forces: A Handbook for Biologists, Chemists, Engineers, and Physicists; Cambridge University Press: Cambridge, UK, 2005. [Google Scholar]
- Vogel, H. Das Temperaturabhängigkeitsgesetz der Viskosität von Flüssigkeiten. Physik Z. 1921, 22, 645–646. [Google Scholar]
- Fulcher, G.S. Analysis of recent measurements of the viscosity of glasses. J. Am. Ceram. Soc. 1925, 8, 339–355. [Google Scholar] [CrossRef]
- Tammann, G.; Hesse, W.Z. Die Abhängigkeit der Viscosität von der Temperatur bie unterkühlten Flüssigkeiten. Z. Anorg. Allg. Chem. 1926, 156, 245–257. [Google Scholar] [CrossRef]
- Rault, J. Origin of the Vogel–Fulcher–Tammann law in glass-forming materials: The α–β bifurcation. J. Non-Cryst. Solids 2000, 271, 177–217. [Google Scholar] [CrossRef]
- Franz, S. Metastable states, relaxation times and free-energy barriers in finite-dimensional glassy systems. Europhys. Lett. 2006, 73, 492–498. [Google Scholar] [CrossRef] [Green Version]
- NIST Chemistry WebBook SRD 69 Trimyristin. Available online: https://webbook.nist.gov/cgi/cbook.cgi?ID=C555453&Mask=FFFF&Units=SI (accessed on 29 November 2020).
- NIST Chemistry WebBook SRD 69 Tripalmitin. Available online: https://webbook.nist.gov/cgi/cbook.cgi?ID=C555442&Mask=4 (accessed on 29 November 2020).
- NIST Chemistry WebBook SRD 69 Tristearin. Available online: https://webbook.nist.gov/cgi/cbook.cgi?ID=C555431&Mask=4 (accessed on 29 November 2020).


Publisher’s Note: MDPI stays neutral with regard to jurisdictional claims in published maps and institutional affiliations. |
© 2020 by the authors. Licensee MDPI, Basel, Switzerland. This article is an open access article distributed under the terms and conditions of the Creative Commons Attribution (CC BY) license (http://creativecommons.org/licenses/by/4.0/).
Share and Cite
Pink, D.A.; Ladd-Parada, M.; Marangoni, A.G.; Mazzanti, G. Crystal Memory near Discontinuous Triacylglycerol Phase Transitions: Models, Metastable Regimes, and Critical Points. Molecules 2020, 25, 5631. https://doi.org/10.3390/molecules25235631
Pink DA, Ladd-Parada M, Marangoni AG, Mazzanti G. Crystal Memory near Discontinuous Triacylglycerol Phase Transitions: Models, Metastable Regimes, and Critical Points. Molecules. 2020; 25(23):5631. https://doi.org/10.3390/molecules25235631
Chicago/Turabian StylePink, David A., Marjorie Ladd-Parada, Alejandro G. Marangoni, and Gianfranco Mazzanti. 2020. "Crystal Memory near Discontinuous Triacylglycerol Phase Transitions: Models, Metastable Regimes, and Critical Points" Molecules 25, no. 23: 5631. https://doi.org/10.3390/molecules25235631