Abstract
β-glucan is a dietary fiber that is beneficial to human health, and its content varies according to its different parts, type of cereal grain, and growing environment. In this study, the β-glucan of milled rice, rice husk, and rice bran fractions, as well as the amylose content of milled rice fraction, from 38 selected rice-paddy grains from six regions of Thailand were quantitatively determined. The milled rice of the Sakon Nakhon (SN) cultivar grown in the northeast contained the highest β-glucan content (0.88 ± 0.03%), followed by the milled rice of the Jow Khao Chiangmai (JKC) cultivar (0.71 ± 0.03%) and rice bran of the Sew Mae Jan (SMJ) cultivar (0.67 ± 0.03%) grown in the north. The results reveal that the rice cultivars from each region showing variation in the β-glucan level in each fraction, which is mainly found in milled rice and rice bran, are similar to those found in other cereal grains, although low amounts are found in the husk. The amylose and β-glucan contents in the milled rice fraction showed a strong negative correlation (r = −0.805; p < 0.0001). This new information about the β-glucan content of Thai rice cultivars could be used for the development of cereal-based functional food.
1. Introduction
Thailand is an agricultural country that produces rice as its main staple food, which is grown on approximately 10 million ha of land (about 20% of the total land area of Thailand) [1]. Thailand is the world’s sixth-largest rice producer, of which paddy rice and milled rice account for about 27.2 and 18 million tons, respectively [2]. After milling, paddy rice is separated into four parts, namely, milled rice (endosperm), rice bran, rice germ, and rice husk, each having different chemical compositions, phytochemicals, antioxidant activities, and applications [3,4,5,6]. Milled rice is mainly consumed by humans for nutrition and is also particularly valuable for use in functional foods. The waste fractions from rice milling comprise bran and husk that are of low economic value but have high nutritional content. Rice bran is commonly a mixture of bran and germ (embryo) that contains high levels of several phytochemicals that have antioxidant properties; therefore, they are extensively utilized in functional food and as food additives [3,5,7]. Rice husks have an antioxidant defense system that protects the rice seed from oxidative stress, and although they have valuable nutritional properties, they are inedible [5,8,9]. In Thailand, rice bran is mostly used as animal feed and a source of rice bran oil and bioactive phytochemicals, such as γ-oryzanols, that are found in the oil phase [3,5,10]. However, the bran is generally not fully reused, and the utilization of the husks is limited. Therefore, they are usually discarded as waste or eliminated by burning [8].
Thailand has 138 varieties of rice that are classified based on the ecosystem of the riceland on which they were cultivated and their photoperiod sensitivity and cooked texture [11]. There are four ecosystems for rice cultivation: lowland rice, upland rice, floating rice, and deep-water rice. Lowland rice is cultivated in almost every region of the country. Rainfed lowland rice is generally grown in the northern and northeastern regions, whereas irrigated lowland rice is mostly grown in the southern region and on the central plain [12]. Floating and deep-water rice are grown in some eastern provinces and in the central plain, such as in Prachinburi and Ayutthaya, respectively.
Based on the flowering response to light, rice cultivars are categorized into photosensitive and non-photosensitive; accordingly, the cultivars’ planting times are different [13]. Photoperiod-sensitive rice cultivars are always grown in the rainy season and are sensitive to winter flowering, while photoperiod-insensitive rice cultivars can be grown in the off-season [11,14].
Amylose is a major component of rice and strongly influences its cooked texture. Glutinous rice and non-glutinous rice are classified based on their amylose/amylopectin ratio: glutinous rice has low (<5%) amylose in its starch but is high in amylopectin [15]. Finally, rice is classified by the percentage of amylose in starchy endosperm as waxy (0–5%), very low (>5–12%), low (>12–20%), intermediate (>20–25% amylose), and high (>25–33%), as suggested by Juliano [16]. In contrast, the amylose content in commercial rice is classified as low (<20%), medium (21–25%), and high (26–33%) [17].
β-glucan is a significant component of the cell walls of higher plants that belong to the grass family (Poaceae), such as rice, wheat, barley, and oat; therefore, it is a common component of many human diets and feed formulations [18]. Structurally, β-glucans are usually characterized by mixed-linkage (1–3),(1–4)-β-d-glucan (hereafter referred to as “β-glucan”) and are found as a chain of linear homopolysaccharide glucopyranosyl residues linked by several (most often two or three) consecutive (1–4)-β-d-linkages separated by a single (1–3)-β-d-linkage [19,20]. The consumption of cereal β-glucan results in powerful health benefits, including moderate glycemic response, lower cholesterol, enhanced satiety after ingestion, and stimulation of healthy gut microflora [21,22,23]. Cereals containing β-glucan are widely available as a functional food offered by different areas of the food industry [24,25,26].
In general, β-glucan in cereal is found in the sub-aleurone layer and endosperm cell walls [27]. Different cereals show different distribution patterns in the kernels. For example, the amount of β-glucan is low in the sub-aleurone but high in the endosperm of oat kernels, is particularly found in the endosperm of barley, is mainly found in the sub-aleurone layer but scarcely in the endosperm of wheat, and is distributed throughout the grain in rye [20]. Moreover, the β-glucan in the starchy endosperm, sub-aleurone layer and aleurone layer of wheat and rice is labeled by the mixed-linkage β-glucan (MLG) antibody, as is the rice husk [28]. To date, a few studies have reported the content of β-glucan from rice, which varies from 0.4 to 0.9% [29], whereas that of non-fermented rice bran varies from 0.14 to 0.57% [30], and there are no data for husk. The β-glucan level of cereal can vary due to the nature of the genotype, growing environment, including conditions of flowering time and grain filling. Many researchers have studied oats and barley, with findings such as drier and warmer temperatures during the flowering time of barley could enhance the level of beta-glucan [31], whereas a higher temperature and lower rainfall during oat grain filling contributed to a higher level of beta-glucan [32]. Additionally, the amylose content of starchy endosperm also influences the level of β-glucan, in which the β-glucan and amylose contents of cereal grains are inversely corelated, particularly in barley [33,34,35,36].
Thailand not only has several rice cultivars distributed over entire regions but is also rich in rice milling fractions from these rice cultivars. Two major varieties are the Khao Dawk Mali 105 (KDM105) and RD6, which together cover approximately 64% of the cultivation area and have the greatest yield of paddy rice (8.1 and 4.7 million tons, respectively), so they have the most rice milling fractions compared to others [12]. These fractions are milled rice, bran, and husk, which can be a source of β-glucan. Currently, no basic information evaluating the β-glucan content of those fractions has been reported. Therefore, this research aimed to determine and compare the β-glucan content in each paddy-rice fraction (milled rice, rice bran, and rice husk) of 38 rice cultivars grown in six regions of Thailand: northern, northeastern, eastern, western, southern, and central plain. The difference in β-glucan level classification according to riceland ecosystem and photoperiod sensitivity is also discussed. In addition, to evaluate the relationship between amylose and β-glucan content, the amylose content in the milled rice fractions was determined.
2. Results and Discussion
2.1. Percentage of Each Paddy-Rice Fraction Yields
The percentage yields of rice paddy fractions of milled rice, rice husk, and rice bran, and the yield loss of all 38 cultivars are given in Table 1. The RD39 lowland cultivar of the northern region had the highest milled rice fraction (70.08 ± 1.51%) but the lowest rice husk fraction (21.28 ± 1.59%). The deep-water At1 rice cultivar of the eastern region had the highest rice bran fraction (10.00 ± 0.92%), whereas the lowland RD21 of the north contained the highest rice husk waste (29.76 ± 2.19%). The lowland JC1 cultivar of the central plain had the lowest milled rice fraction (61.16 ± 0.60%), whereas the RD47 cultivar in the south contained the lowest rice bran fraction (6.17 ± 0.47%). The yield loss to paddy-rice milling ranged from 0.88 ± 0.14 to 2.27 ± 0.91%. The yields of all fractions of rice cultivars (61.16–70.08% for milled rice, 21.28–29.76% for husk, and 6.17–10.00% for bran) were relatively close to the ideal for rice milling with a yield in the range of 61–72% milled rice, 20–30% rice husk, and 5–12% rice bran [37,38]. The yields of milled rice and its fraction of byproducts are not only dependent upon the degree of milling but also on several factors, such as varieties of rice, growing season, and environmental variability [37,39,40].

Table 1.
Yield of milled rice, rice husk, and rice bran fractions of the 38 rice cultivars.
2.2. β-Glucan Content in Paddy-Rice Fractions
β-glucan is abundant in the cell walls of cereal grains, such as oat, barley and wheat. In rice, β-glucan is distributed throughout the grain, including in the starchy endosperm and sub-aleurone layer of milled rice, aleurone layer and maternal pericarp of the bran, as well as the husk [28,41]. In Thailand, several studies have evaluated the nutritional composition of milled rice and its byproducts, particularly rice bran [3,5,8,10,42] although, to date, data have been lacking regarding β-glucan, a soluble dietary fiber whose consumption is beneficial to human health. To address this in our study, we determined the β-glucan content of the paddy-rice fractions of 38 rice varieties using a mixed-linkage β-glucan assay kit to specifically measure the cereal β-glucan content. The β-glucan content and total β-glucan content of milled rice, rice husk, and rice bran fractions in 38 rice varieties that are cultivated in different locations of Thailand and categorized according to riceland ecosystem, photoperiod sensitivity, and texture of cooked rice are shown in Table 2.
Table 2.
β-Glucan content and total β-glucan content in each fraction of the 38 rice cultivars obtained from entire regions of Thailand.
The β-glucan distribution of each paddy-rice fraction is ranked in the following descending order: milled rice (0.11–0.88%) > rice bran (0.11–0.67%) > rice husk (0.02–0.11%). The measured contents in milled rice and rice bran are relatively similar to the findings of Demirbas [29] and Jung et al. [30], who reported a β-glucan content of rice in the range of 0.4–0.9% and that of Korean non-fermented rice bran in the range of 0.18–0.57%, respectively. Our study also presented results for the β-glucan content in rice husk which, surprisingly, had not previously been reported. The results are also supported by the finding of Palmer et al. [28], who determined the cellular location of β-glucan in whole rice grain using MLG antibody labeling detection. The β-glucan of each fraction was separately expressed as the total β-glucan content (mg) that might be found in 300 g of prepared paddy-rice grain (Table 2). Among the three paddy-rice grain fractions, milled rice had the highest total content (218.35–1749.21 mg) followed by rice bran (21.12–182.91 mg) and rice husk (12.90–81.62 mg). Among the milled rice fractions, the SN and JKC cultivars (1749.21 ± 29.62 and 1427.68 ± 56.74 mg, respectively) had much higher total β-glucan contents than the other cultivars. Similarly, the rice husk β-glucan content for SN (81.62 ± 2.36 mg) was the highest. For the rice bran fraction, however, the SMJ, DPy and SYP cultivars had a higher amount of β-glucan: 182.91 ± 1.37 mg, 157.73 ± 3.35 mg and 152.96 ± 7.08 mg, respectively.
KDM105 and RD6 had β-glucan contents in milled rice of 0.41 ± 0.02 and 0.46 ± 0.02%, respectively; rice bran of 0.20 ± 0.02 and 0.31 ± 0.01%, respectively; and rice husk of 0.06 ± 0.00 and 0.07 ± 0.00%. The total β-glucan contents in milled rice, rice husk, and rice bran of KDM105 were 842.02 ± 18.98, 46.11 ± 0.97, and 38.36 ± 0.70 mg, respectively. The total β-glucan contents in milled rice, rice husk, and rice bran of RD6 were 854.67 ± 26.14, 56.45 ± 3.97, and 79.80 ± 1.67 mg, respectively. Although these two cultivars have moderate β-glucan contents in each fraction, they are two major cultivars of Thailand. Therefore, they are another source of β-glucan content as they have a rich annual yield of rice paddy.
For each of the six regions, the highest amounts of β-glucan for selected rice cultivar fractions, in descending order, for milled rice, were found as follows: northeastern (0.88 ± 0.03% for SN) > northern (0.71 ± 0.03% for JKC) > southern (0.45 ± 0.02% for NDC4) > central plain (0.42 ± 0.02% for PT1) > eastern (0.29 ± 0.02% for At1) > western (0.21 ± 0.03% for CN1). For rice bran, the highest amounts were found in the following order: northern (0.67 ± 0.03% for SMJ) > southern (0.57 ± 0.02% for Dpy) > northeastern (0.52 ± 0.02% for SN) > central plain (0.40 ± 0.01% for JC1) = eastern region (0.40 ± 0.01% for PB2) > western region (0.39 ± 0.02% for CN1). For the most part, the rice husk showed a very low β-glucan content. In descending order, the highest levels were northeast (0.11 ± 0.01% for SN) > northern (0.09 ± 0.01% for JKC) > southern (0.08 ± 0.00% for DPy) > central plain (0.07 ± 0.01% and 0.07 ± 0.00% for JC1 and Pl2, respectively) = eastern (0.07 ± 0.00% for PB1) > western (0.06 ± 0.01% for CN1).
The β-glucan content of the cultivars, as classified by the riceland ecosystem, photoperiod sensitivity, and cooked texture, was also investigated, as shown in Table 2. For each riceland ecosystem, the β-glucan contents of milled rice, in descending order, were 0.11–0.88% for lowland (L) > 0.37–0.71% for upland (U) > 0.21–0.29% for deep-water (D) > 0.28% (only one cultivar) for floating (F). Conversely, for rice bran, the β-glucan contents were 0.25–0.67% for U > 0.11–0.55% for L > 0.29–0.40% for D > 0.33% for F. For rice husk, the β-glucan contents in each of riceland ecosystems were slightly different values in the range of 0.02–0.11% for L > 0.05–0.09% for U > 0.05–0.07% for D > 0.05% for F. The lowland group has the highest number of samples as more than half of Thailand grows lowland rice [1]. Additionally, lowland rice cultivars are almost found in all regions of the country, whereas upland rice is found only in the north and south. Floating rice and deep-water rice cultivars are planted to a lesser extent and found in the eastern region and on the central plain. Therefore, the amount of β-glucan among three fractions from cultivars grown in lowland region was more varied than others. The SN cultivar, which is lowland rice and is grown in northeastern region, showed the highest content for both milled rice and rice husk fractions, which was higher than for the upland JKC cultivar grown in the northern region. This might be due to the northeast of Thailand mostly experiencing a higher temperature, especially Sakon Nakhon province, and lower rainfall than the northern region [43], which is consistent with the study of Howarth et al. [31] that found a higher β-glucan content of grown oats occurred when grain filling in higher temperature and lower rainfall conditions. However, this result is not consistent with bran of the upland SMJ grown in the north, the β-glucan content of which was the highest and slightly higher than that for the upland DPy and lowland SYP grown in the southern region.
Based on the flowering response to light, rice cultivars are grouped into photosensitive and non-photosensitive. Photoperiod-sensitive rice has a longer growing period, resulting in only one crop per year. In contrast, photoperiod-insensitive rice can be grown at any time, even during the dry season when lowland rice areas are being irrigated [14]. In Thailand, the entire northern, northeastern and southern rice-growing regions grow mostly photoperiod-sensitive cultivars [44,45]. The β-glucan contents of milled rice from a group of photoperiod-sensitive (S) cultivars varied from 0.14 to 0.71%; these were slightly lower than those of the group of photoperiod-insensitive (IS) cultivars, which varied from 0.11 to 0.88%. For rice husk, the group of S cultivars in the range of 0.02–0.09% showed slightly lower amounts than the group of IS cultivars in the range of 0.02–0.11%. For rice bran, the group of S cultivars in the range of 0.20–0.67% showed higher amount than the group of IS cultivars in the range of 0.11–0.52%. In the case of milled rice and rice husk, the photoperiod-insensitive rice cultivars growing in the dry season might result in a higher level of β-glucan than the photoperiod-sensitive rice. This is consistent with the finding of Ehrenbergerová et al. [31], which revealed that lower rainfall and warmer weather during flowering time result in an enhanced β-glucan content in barley.
Based on the texture of cooked rice, rice cultivars are grouped into glutinous and non-glutinous rice. The non-glutinous cultivars were grown in all regions of the country, while the glutinous cultivars were mainly grown in the northeast [33]. However, Thai people in the north and northeast prefer glutinous rice. The β-glucan contents in glutinous rice (G) cultivars, which varied from 0.34 to 0.88% for milled rice and 0.23 to 0.67% for rice bran, were higher than those of non-glutinous rice (NG) cultivars, ranging from 0.11 to 0.71% for milled rice and 0.11 to 0.57% for rice bran. For rice husk, G cultivars ranging from 0.05 to 0.11% were relatively similar to NG cultivars ranging from 0.02 to 0.09%. It was found for G cultivars that the β-glucan content of milled rice fraction was higher than that of rice bran, except for the SMJ cultivar. The glutinous rice cultivars with a low amylose content showed a higher β-glucan content than non-glutinous rice due to the amylose content in starchy endosperm being inversely correlated with the β-glucan content, especially in milled rice fraction [33,34,35,36].
The SN cultivar showed the highest β-glucan of all rice fractions in the photoperiod-insensitive and glutinous rice groups, but its rice bran fraction had a lower β-glucan content than SMJ, which is in the same glutinous rice group, but is photoperiod sensitive. In the photoperiod-sensitive and non-glutinous rice groups, JKC also has the highest β-glucan content for all fractions. These results suggest that the milled rice fractions of SN and JKC, as well as the rice bran fraction of SMJ, are better sources of β-glucan than the other cultivars. According to photoperiod sensitivity [14], SN can be grown at any time of year in an irrigated lowland area, but JKC and SMJ can only be grown once a year.
2.3. Descriptive Statistic and Frequency Distribution of β-Glucan Content in Each Rice Fraction
The Kolmogorov–Smirnov test for normality and skewness and kurtosis statistics were applied to the analysis of the β-glucan content of each rice fraction sample. The significant value of the test is 0.05, and an acceptable range for skewness and kurtosis was from +1.96 to −1.96 [46]. The data suggest that β-glucan is normally distributed in rice husk, but not in milled rice or rice bran. Moreover, the kurtosis of 2.732 (SE = 0.449) for milled rice showed that it was not in the acceptable range. This was due to three exceptional cultivars identified by the box plot: SN and JKC in the milled rice population and SMJ for rice bran, which showed a distinctly higher β-glucan content compared to the other cultivars. After removing these three from the milled rice and rice bran populations, the Kolmogorov–Smirnov test suggested that the β-glucan content was normally distributed in both populations with an acceptable skewness range of 0.197 (SE = 0.236) and kurtosis of −0.771 (SE = 0.467) for milled rice. Moreover, the skewness of −0.358 and kurtosis of 0.140 for rice husk and skewness of 0.419 and kurtosis of 0.344 for rice bran (the same SE as milled rice) are presented in Table 3. The mean β-glucan content of milled rice at 0.302% (SE = 0.112, SD = 0.115) was relatively equal to that of rice bran at 0.309% (SE = 0.010, SD = 0.102), whereas rice husk showed the lowest mean β-glucan content at 0.054% (SE = 0.001, SD = 0.015). The β-glucan contents of milled rice with the exceptional SN and JKC cultivars and rice bran with the exceptional SMJ cultivar were similar, ranging from 0.090 to 0.580%. The β-glucan contents of rice husk ranged from 0.010 to 0.080%.
Table 3.
Descriptive statistics for the β-glucan content of the milled rice, rice husk, and rice bran fractions of paddy-rice samples with the exceptional SN, JKC, and SMJ cultivars.
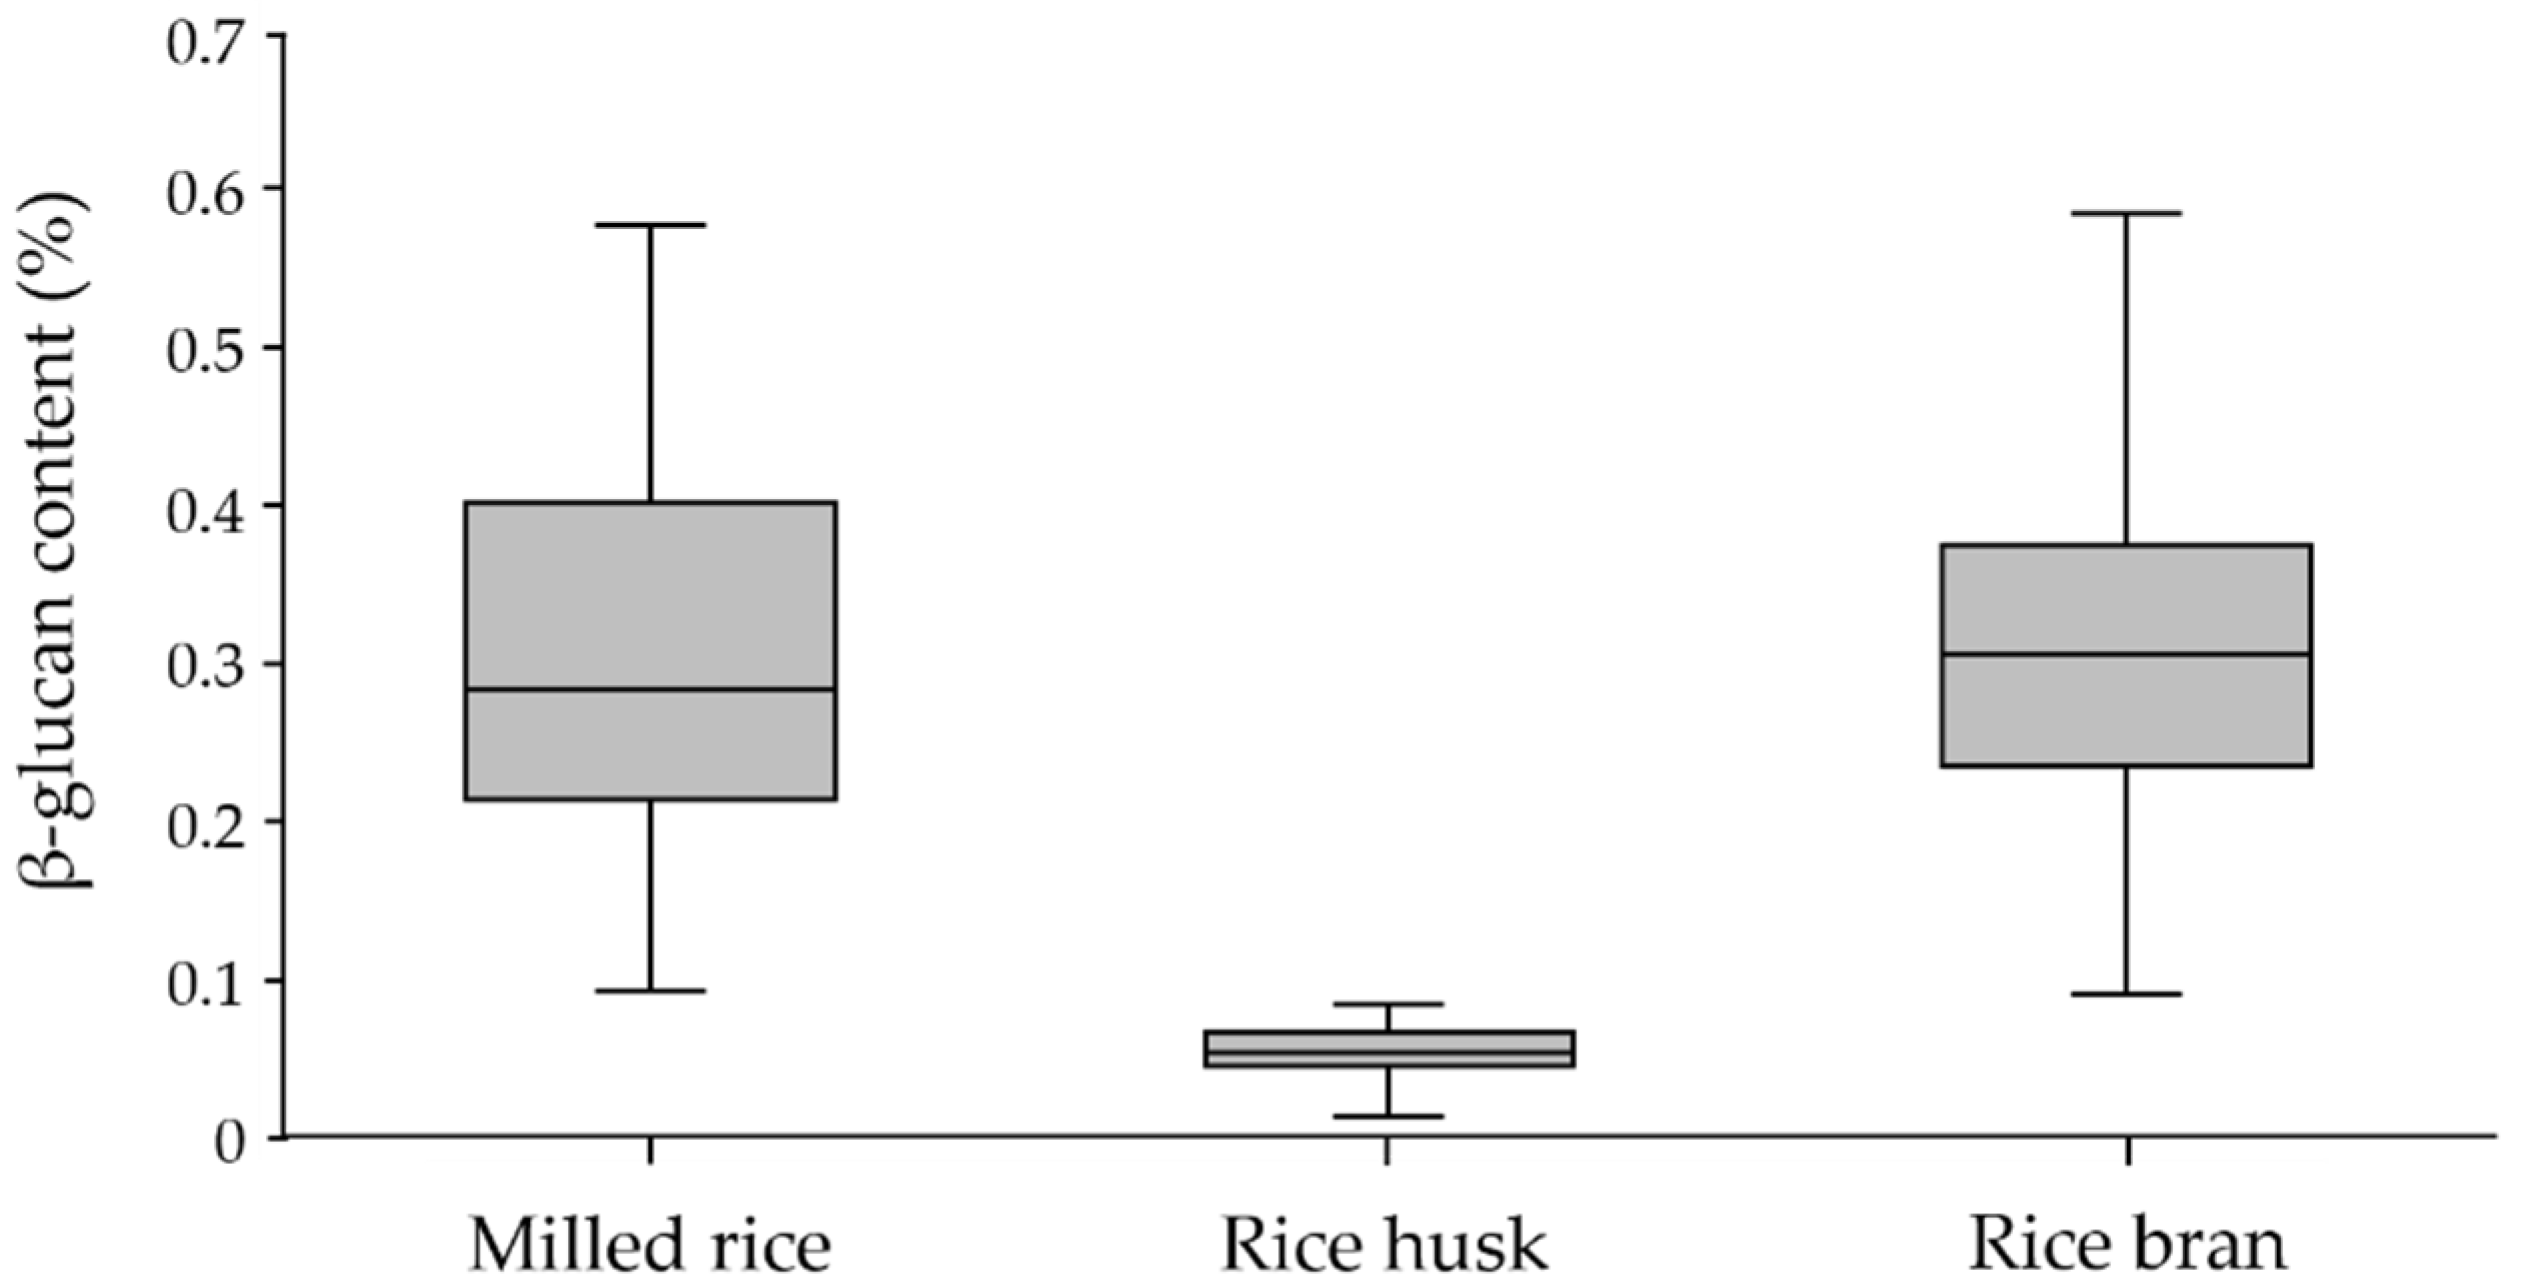
The box plot in Figure 1 illustrates the variation in β-glucan contents among the three fractions. According to the frequency distribution, the majority of the milled rice fraction was between 0.2 and 0.3%, representing 31.6%; the majority of the rice bran fraction was between 0.3 and 0.4%, representing 36.8%; and the majority of the rice husk fraction was between 0.05 and 0.06%, representing 52.6%. These results reveal that the β-glucan content of rice bran was slightly higher than that of milled rice, while little was found in rice husk. This observation is supported by Palmer et al. [28], who found that the aleurone cell walls of rice bran were strongly labeled using MLG antibody, whereas the sub-aleurone and endosperm cells of milled rice were labeled with an even intensity.
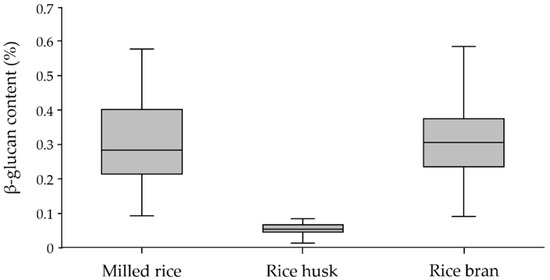
Figure 1.
Variation in β-glucan content in milled rice, rice husk, and rice bran fractions of paddy-rice samples with the exceptional SN, JKC, and SMJ cultivars.
2.4. Relation of Amylose and β-Glucan Contents in Milled Rice Fraction
To evaluate the relationship between amylose and β-glucan content, amylose in milled rice was determined using an amylopectin/amylose assay kit, and the results are shown in Table 4. Glutinous and non-glutinous rice cultivars were grouped as indicated in Table 2 and classified into four clusters according to the amylose level: 1—waxy (0–6%); 2—very low (>6–14%); 3—low (>14–20%); and 4—intermediate (>20–30%), slightly modified from Juliano [16].
Table 4.
Amylose contents in milled rice fractions of four rice cultivar clusters.
Amylose level distribution in milled rice was ranked in the following ascending order: cluster 1 (2.45–5.77%) < cluster 2 (10.07–13.85%) < cluster 3 (15.19–19.97%) < cluster 4 (20.03–27.39%). For the glutinous rice group (cluster 1), RD6 had the lowest amylose content of 2.45 ± 0.08%, close to that of SN with 2.59 ± 0.02%. Glutinous rice RD14 had the highest amylose content of 5.77 ± 0.06%. Among the non-glutinous cultivars, RD41 had the highest amylose content of 27.39 ± 0.25%, close to that for LPt123 with 27.10 ± 0.28%, while JKC had the lowest: 10.07 ± 0.03%. Cluster 1 contained only glutinous rice cultivars, which mostly had less than 6% amylose, whereas clusters 2–4 contained non-glutinous cultivars with amylose in the range of 10–30%. This was consistent with the findings of Chung et al. [15], who stated that glutinous differs from non-glutinous rice mainly in the low amylose content (<5%) in its starch or milled rice.
In contrast to the amylose level, the distribution of β-glucan content was ranked in the following descending order: cluster 1 (0.34–0.88%) > cluster 2 (0.24–0.71%) > cluster 3 (0.21–0.34%) > cluster 4 (0.11–0.18%). This inverse relationship between amylose and β-glucan content was consistent with the findings of Islamovic et al. [33] and lzydorczyk et al. [34], who reported that waxy or low amylose barley had a higher β-glucan level than normal or high-amylose barley. This study showed a similar relationship: the waxy SN cultivar had the highest β-glucan content of 0.88 ± 0.03%, followed by the very low amylose JKC, which had a high β-glucan content of 0.71 ± 0.03%. On the other hand, RD41 had the highest amylose but the lowest β-glucan content of 0.11 ± 0.02%.
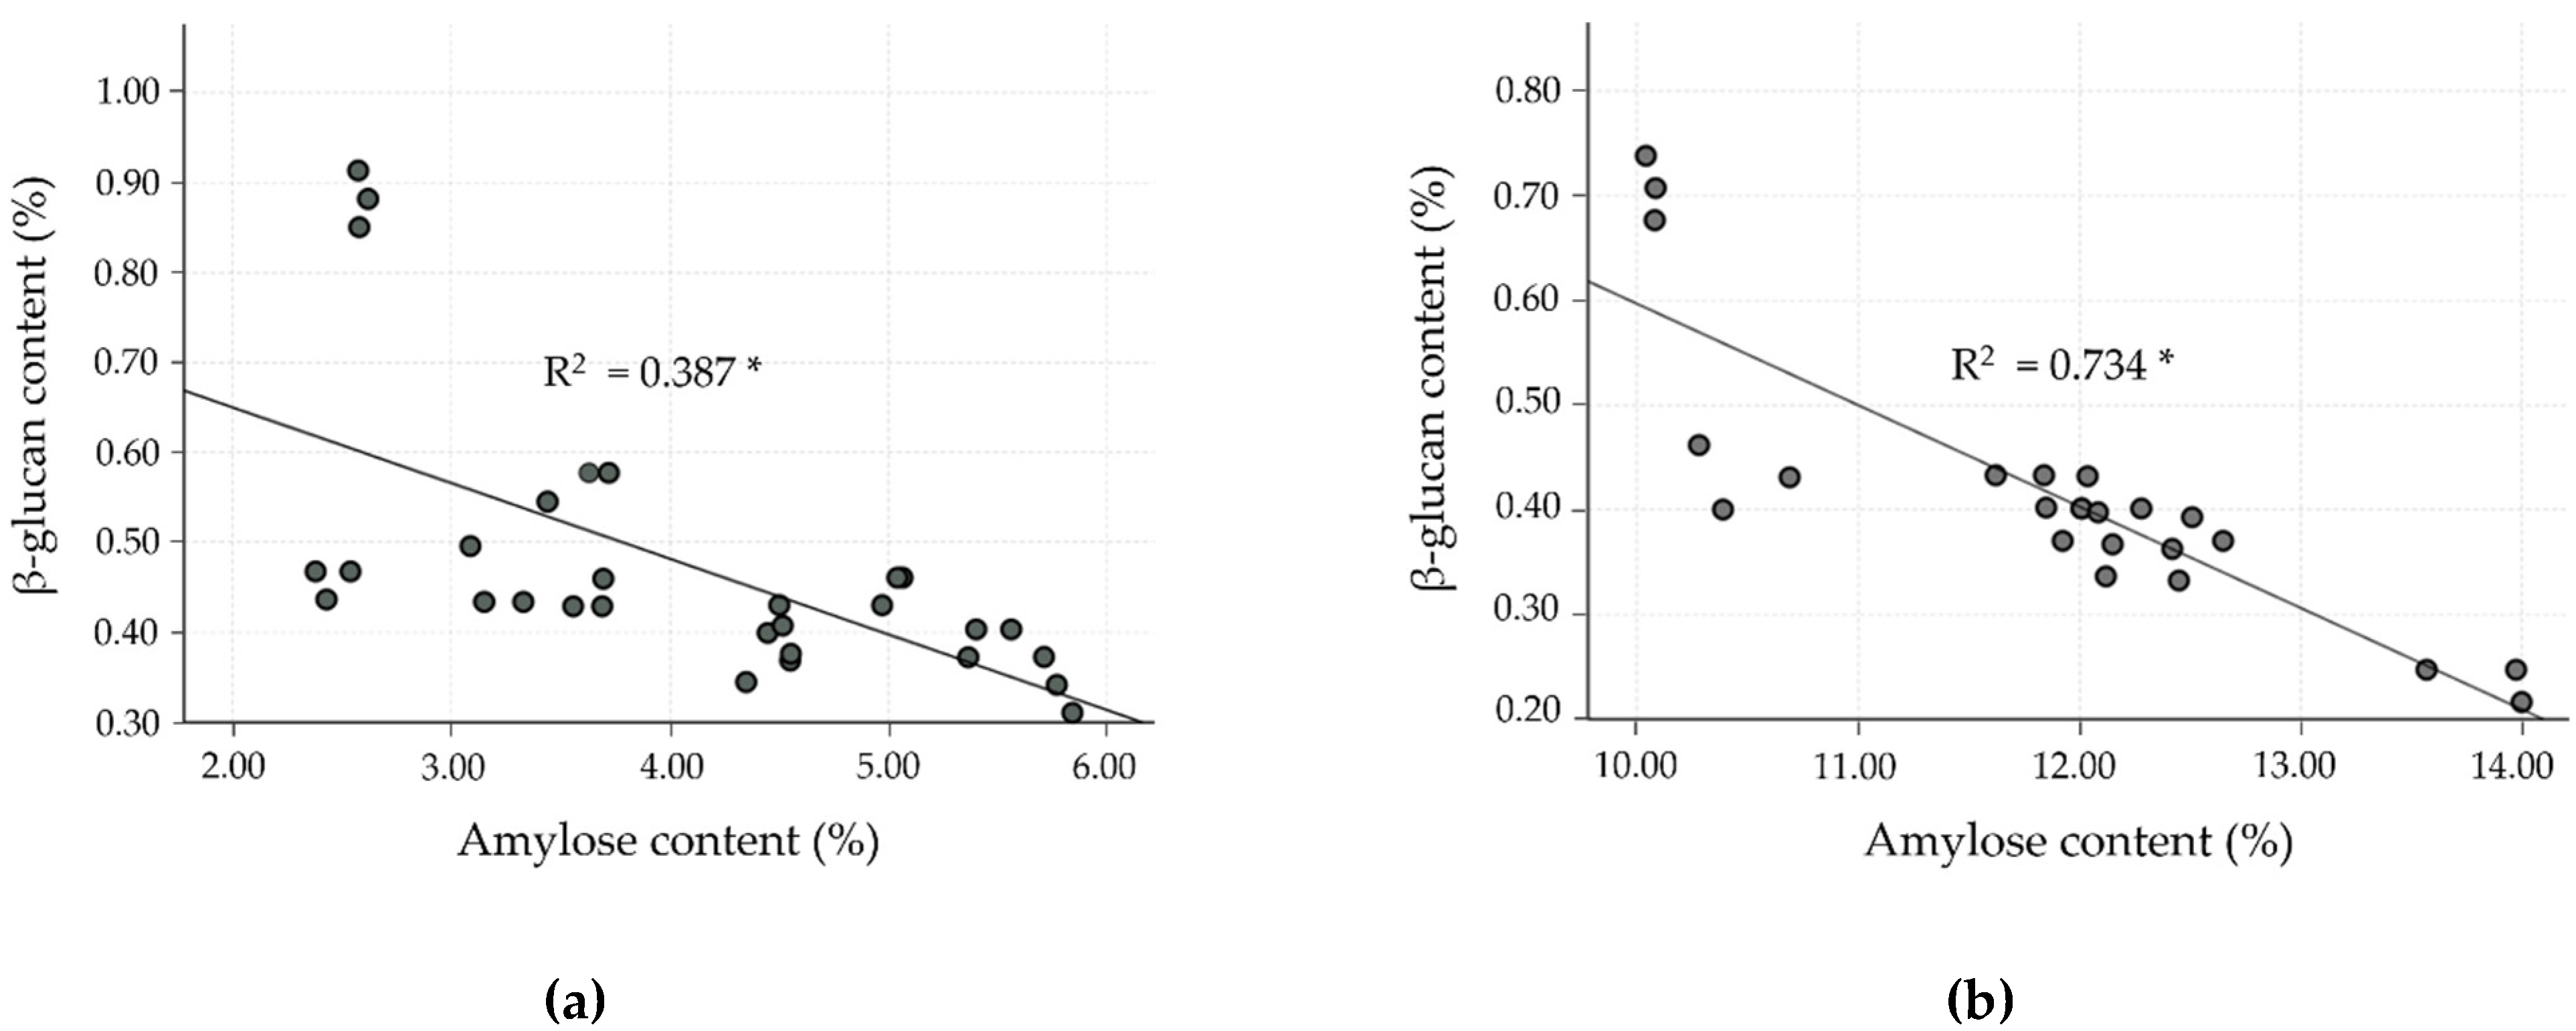
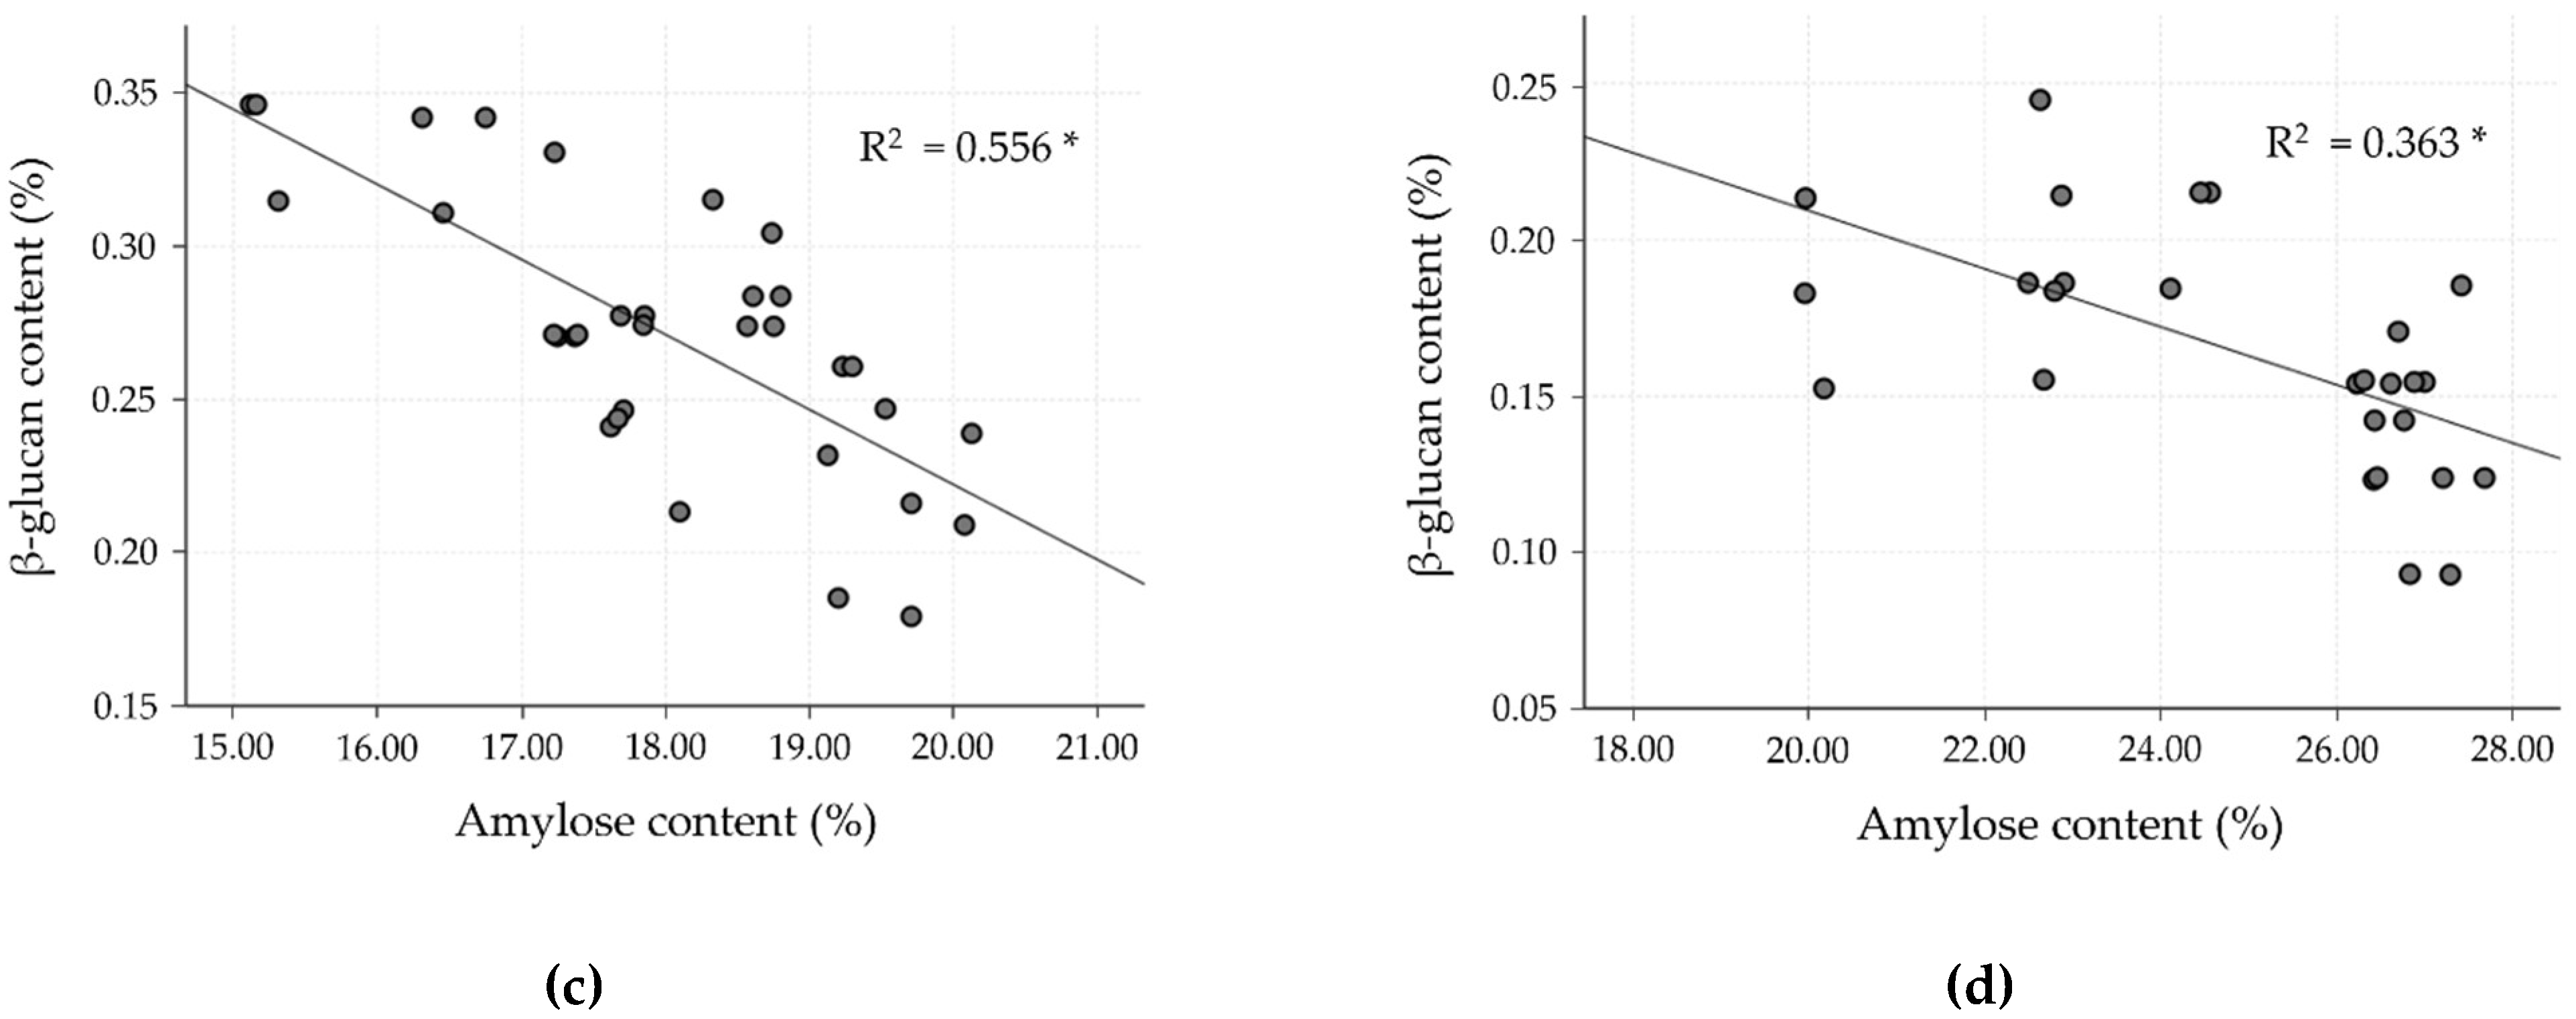
To date, much research has found an inverse relationship between amylose and β-glucan content, especially for barley cultivars, but data for rice are lacking. Hence, the correlation as well as linear regression analysis were studied in the milled rice fraction to confirm the inverse relationship. In the milled rice of all the cultivars, amylose content showed a strong negative correlation with β-glucan (r = −0.805, p < 0.0001). In the case of the four clusters, classified by differences in amylose level, the relationship between amylose and β-glucan was separately evaluated, as shown in Table 5 and Figure 2, and showed a negatively moderate to strong relationship (p < 0.001). Cluster 2 showed a strong negative correlation (r = −0.857, R2 = 0.734), followed by cluster 3, which showed a good negative correlation (r = −0.746, R2 =0.556). Clusters 1 and 4, however, showed only a fairly negative correlation (r = −0.622, R2 = 0.387 for cluster 1, and r = −0.603, R2 = 0.363 for cluster 4). These results exhibited a relationship similar to that observed by Hang et al. [35] and Shu and Rasmussen [36], who found a negative correlation of amylose and β-glucan in barley, reporting a Pearson’s correlation of −0.829 and −0.620 at p < 0.01, respectively. The glutinous rice cultivars (cluster 1) revealed a lower correlation of amylose and β-glucan content than for non-glutinous rice cultivars (clusters 2–4). However, the β-glucan level in cluster 1 was higher than for the other clusters. As shown in Figure 2, clusters 1 and 2 of the SN and JKC cultivars, respectively, stand out due to their higher β-glucan content, which is consistent with the findings of the normality test of milled rice β-glucan samples.
Table 5.
Pearson’s correlation coefficients, linear equation, R2, sample sizes, and p-value for amylose and β-glucan contents in milled rice fraction.

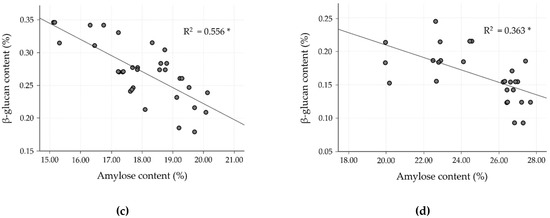
Figure 2.
Linear correlation between β-glucan and amylose contents in milled rice fractions of four clusters classified by amylose level. (a) Cluster 1: waxy (0–6%); (b) cluster 2: very low (>6–14%); (c) cluster 3: low (>14–20%); and (d) cluster 4: medium (>20–30%). * p < 0.0001.
3. Materials and Methods
3.1. Chemicals
The mixed-linkage β-glucan and amylose/amylopectin assay kits were purchased from Megazyme (International Ireland Ltd., Wicklow, Ireland). Ethanol, glacial acetic acid, and dimethyl sulfoxide were purchased from Merck (Darmstadt, Germany). Sodium dihydrogen orthophosphate dihydrate, sodium hydroxide, anhydrous sodium acetate, and sodium chloride were purchased from Qrec (Qrec (Asia) SDN BHD, Selangor, Malaysia) and Ajax Finechem Pty Ltd. (Sydney, New South Wales, Australia). Calcium chloride dihydrate, magnesium chloride hexahydrate, and manganese chloride tetrahydrate were obtained from Sigma-Aldrich Co. (St. Louis, MO, USA). All chemicals and reagents used in the study were of analytical grade.
3.2. Rice Sample
The 38 paddy-rice samples in this study were obtained from 12 rice research centers in each province of Thailand. A list of the selected rice cultivars is shown in Table 6: 14 from the northern provinces of Chiang Rai, Chiang Mai, Phrae and Mae Hong Son and the Samoeng Distinct of Chiang Mai province; 6 from Pathum Thani province on the central plain, 4 from the eastern province of Prachinburi; 3 from the western province of Ratchaburi; 2 from the northeastern province of Sakon Nakhon; and 9 from the southern provinces of Nakhon Si Thammarat, Phatthalung and Pattani.
Table 6.
List of the 38 paddy-rice cultivars from various rice research centers.
Based on information from the Rice Department at the Ministry of Agriculture and Cooperatives [11], the rice cultivars we studied were categorized according to three factors: riceland ecosystem, photoperiod sensitivity, and cooked texture (Figure 3). The cultivars could also be divided into four groups according to cultivation, namely upland, lowland, floating, and deep-water rice, whereby there were 29 lowland, 5 upland, 3 deep-water, and 1 floating rice cultivars, as listed in Figure 3a. Just over half (23) of all selected cultivars belonged to the group of photoperiod-sensitive rice, whereas 15 were photoperiod insensitive (Figure 3b). According to the texture of cooked white rice, which is influenced by amylose content, 28 cultivars were non-glutinous and 10 were glutinous, as illustrated in Figure 3c.
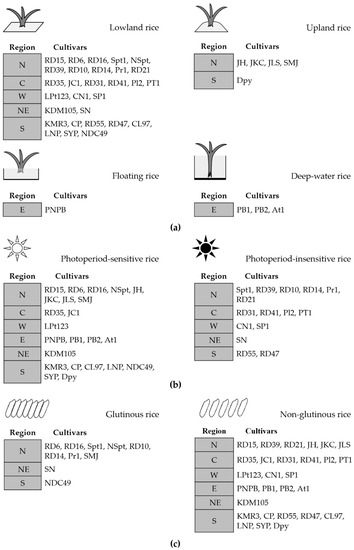
Figure 3.
The list of rice cultivars in each region (northern, N; central plain, C; northeastern, NE; eastern, E; western, W; southern, S) categorized according to three factors (a) riceland ecosystem; (b) photoperiod sensitivity; and (c) texture of cooked rice. Abbreviations for the rice cultivars are in Table 1.
3.3. Yield of Paddy-Rice Fractions
The 38 paddy-rice samples (300 g) were de-hulled and polished using a rice milling machine (Mini-Rice mill Machine, Bangkok, Thailand) to obtain the fractions of milled rice, rice husk, and rice bran, the latter of which includes the rice germ (generally 2.81–3.19% of a rice grain [3]). All fractions were dried at 105 °C for 24 h to a constant weight. Then, the paddy-rice fraction of each sample was weighed and expressed as a percentage of yield according to Equation (1). The milled rice and rice husk were ground. Then, all three fractions were passed through a 0.5 mm sieve before being used for analysis.
where WRF is the weight of each paddy-rice fraction (milled rice, rice bran, and rice husk) of the cultivars (g) after rice milling, and WR is the weight of the paddy-rice sample (g).
Yield of paddy rice fraction (% w/w) = (WRF/WR) × 100
3.4. β-Glucan Content Analysis
A mixed-linkage β-glucan assay for cereal grains kit (K-BGLU, Megazyme, Wicklow, Ireland) was used for the analysis of β-glucan content in each fraction of the 38 rice cultivars. This method uses a highly specific enzyme for cereal mixed-linkage β-glucan hydrolysis without affecting other polysaccharides. To carry out the reaction, 1.0 g of rice fraction sample, after passing through a 0.5 mm sieve screen, was mixed with 5.0 mL of 50% (v/v) aqueous ethanol and incubated at 100 °C for 5 min. After mixing the sample on a vortexer (VM-300, Gemmy Industrial Corp., Taipei, Taiwan), 5.0 mL of 50% (v/v) aqueous ethanol was then added, followed by mixing. The sample was then centrifuged at 1000g × for 10 min (Z206A, Hermle Labortechnik GmbH, Wehingen, Germany). The pellet was resuspended in 10.0 mL of 50% (v/v) aqueous ethanol and the centrifugation repeated. The pellet was further mixed and incubated with 5.0 mL of 20 mM sodium phosphate buffer (pH 6.5) (prepared by dissolving 3.12 g of sodium dihydrogen orthophosphate dihydrate in 900 mL of distilled water, adjusting the pH to 6.5 by 100 mM sodium hydroxide, and then adjusting the volume to 1 L) at 100 °C for 2 min, then vigorously stirred and incubated again for 3 min. Then, 0.2 mL of lichenase (10 U, EC 3.2.1.73) was added to the sample and incubated at 40 °C for 1 hr. Distilled water was added to the sample in a tube to adjust the final volume to 30.0 mL, followed by centrifugation at 1000g × for 10 min. Furthermore, 3 of 4 supernatant tubes (0.1 mL) were added to 0.1 mL of β-glucosidase (0.2 U, EC 3.2.1.21) plus 50 mM sodium acetate buffer (pH 4.0) (prepared by adding 2.9 mL of glacial acetic acid to 900 mL of distilled water, adjusting the pH to 4.0 by 100 mM sodium hydroxide, and then adjusting the volume to 1 L), while another was added to 0.1 mL of 50 mM sodium acetate buffer (pH 4.0). Then, these samples were incubated at 40 °C for 15 min. Finally, 3.0 mL of GOPOD reagent, containing 36 U of glucose oxidase (EC. 1.1.3.4) plus 1.95 U of peroxidase (EC 1.11.1.7) and 0.24 g of 4-aminoantipyrine was added and incubated at 40 °C for 20 min. An amount of 100 µg of D-glucose standard was added to GOPOD reagent and incubated at 40 °C for 20 min. The β-glucan content was measured at 510 nm using a spectrophotometer (Genesys 20 Spectrophotometer, Thermo Spectronic, New York, NY, USA) and reported on a moisture-free basis. The moisture content was assayed following approved method 44-15.02 [47].
β-glucan content was calculated using the glucose quantity determined with the described assay in Equation (2) and expressed as total β-glucan (mg) in 300 g of paddy-rice using Equation (3).
where ΔE is the absorbance difference of the sample after β-d-glucosidase treatment—the absorbance of a blank (non-treatment by β-d-glucosidase); mg is the weight of the sample (mg); and F is a factor for the conversion of absorbance values to µg glucose, which is calculated from 100 (µg of d-glucose)/ absorbance of 100 µg of d-glucose.
where G is the β-glucan content (% w/w), and Y is the fraction yield of paddy rice (% w/w).
β-glucan (% w/w) = ΔE × (F/mg) × 27
Total β-glucan (mg) in 300 g of paddy rice = G × Y × 10
3.5. Amylose Content Analysis
The amylose content in the milled rice fraction of each rice cultivar was determined using an amylose/amylopectin assay kit (K-AMYL, Megazyme, Wicklow, Ireland). Starch pretreatment was first performed, whereby a 20 mg milled rice sample was completely dispersed in 1.0 mL of dimethyl sulfoxide by heating at 100 °C for 1 min. Then, the mixture was vigorously stirred and incubated at 100 °C for 15 min. After incubating the mixture at room temperature for 5 min, the starch was precipitated out by adding 4.0 mL of 95% (v/v) aqueous ethanol for 15 min while lipids remaining in the supernatant were removed by centrifugation at 2000g × for 10 min. The starch pellet was mixed with 2.0 mL of dimethyl sulfoxide and incubated at 100 °C for 15 min. A measure of 4.0 mL of Con A solvent was immediately added to this mixture. The Con A solvent was freshy prepared by diluting 30 mL of concentrated Con A solvent in 100 mL of distilled water (concentrated Con A solvent prepared by dissolving 49.2 g of anhydrous sodium acetate, 175.5 g of sodium chloride, 0.5 g of calcium chloride dihydrate, 0.7 g of magnesium chloride hexahydrate, and 0.7 g of manganese chloride tetrahydrate in 900 mL of distilled water; adjusting the pH to 6.4 by glacial acetic acid; and then adjusting the volume to 1 L).
Amylopectin specifically forms a complex with lectin concanavalin A (Con A). To the starch suspension, 0.50 mL of Con A solution (4 mg/mL) was added, gently mixed, and allowed to stand at room temperature for 1 h. Then, the amylose supernatant was collected following centrifugation at 4400g × for 20 min, and subsequently, the amylopectin pellet was removed. After adding 3.0 mL of 100 mM sodium acetate buffer (pH 4.5) (prepared by adding 5.9 mL of glacial acetic acid to 900 mL of distilled water, adjusting the pH to 4.5 by 1 M sodium hydroxide, and then adjusting the volume to 1 L) to 1.0 mL of the supernatant to decrease the pH to 5.0, the remaining Con A was denatured by heating at 100 °C for 5 min. An amount of 0.1 mL of a mixture of amyloglucosidase (16.5 U, EC 3.2.1.3) and α-amylase (2.5 U, EC 3.2.1.1) enzymes was added to the supernatant, and then incubated at 40 °C for 30 min. After centrifugation at 2000g × for 5 min, 1.0 mL of supernatant was mixed with 4.0 mL of GOPOD and incubated at 40 °C for 20 min. The absorbance of Con A supernatant (EA) was measured at 510 nm.
Total starch was further determined for the calculation of amylose content. The starch suspension (0.5 mL) was mixed with 4.0 mL of 100 mM sodium acetate buffer (pH 4.5) plus 0.1 mL of amyloglucosidase/α-amylase solution and incubated at 40 °C for 10 min. Then, 1.0 mL of the mixture was added to 4.0 mL of GOPOD reagent and incubated at 40 °C for 20 min. The absorbance of total starch (ES) was measured at 510 nm.
The amylose content was estimated using the glucose quantity found in the Equation (4)
where EA is the absorbance of the Con A supernatant (containing amylose after amylopectin precipitated by lectin concanavalin A) and ES is the absorbance of total starch.
Amylose (% w/w) = (EA/ES) × 66.8
3.6. Statistical Analysis
Statistical analyses were conducted using SPSS (v22; IBM, Amonk., New York, NY, USA). The results were calculated as an average of three replicate samples and the results expressed as mean ± standard deviation. A significant difference among each paddy-rice fraction yield, β-glucan, and amylose contents of 38 rice cultivars was determined using the one-way analysis of variance (ANOVA) at the p < 0.05 level using the Duncan multiple-range test (DMRT). Pearson coefficient (r) studies were carried out to determine the relationship between amylose and β-glucan contents using bivariate significance at the p < 0.01 level.
4. Conclusions
In this study, 38 paddy-rice samples grown in six regions of Thailand (northern, central plain, eastern, western, northeastern, and southern) were selected to determine and evaluate the difference in β-glucan contents in three of their fractions (milled rice, rice husk, and rice bran). All the cultivars grown in those regions contained variations in β-glucan levels in each fraction, which were milled rice, rice bran, and rice husk in ranges of 0.11–0.88%, 0.11–0.67%, and 0.02–0.11%, respectively. A slight difference was found in milled rice and rice bran fractions, but both clearly differed from rice husk, which had a low level of β-glucan. Therefore, the β-glucan mainly found in milled rice and rice bran is similar to that found in other cereal grains, generally in the starchy endosperm, sub-aleurone, and aleurone cell walls. The milled rice of the SN cultivar, lowland rice grown in the northeastern region, contained the highest β-glucan content, followed by the milled rice of the JKC cultivar and rice bran of the SMJ cultivar, which are upland rice grown in the northern region. The environmental classification, based on riceland ecosystem and photoperiod sensitivity, showed some patterns with the level of β-glucan content for each paddy-rice fraction, while the cooked texture of glutinous and non-glutinous rice, which is strongly influenced by amylose, was obviously related to the β-glucan content in the milled rice fraction. The significant correlation between β-glucan and amylose content was strongly negative. This research suggests that Thai rice cultivars could be a potential source of beneficial β-glucan, especially in their milled rice and rice bran fractions, for further use as functional ingredients for cereal-based products, supplement products and cosmetics. The application of milled rice of SN and JKC cultivars, as well as rice bran of SMJ, as functional food ingredients could be studied in the future.
Funding
This research was supported by the National Research Council of Thailand (NRCT, grant number 2557A12762001) (https://nrct.go.th/).
Institutional Review Board Statement
Not applicable.
Informed Consent Statement
Not applicable.
Data Availability Statement
Not applicable.
Acknowledgments
The author is thankful to Rice Research Centers from Chiang Rai, Chiang Mai, Phrae, Mae Hong Son, Samoeng, Pathum Thani, Ratchaburi, Prachinburi, Sakon Nakhon, Nakhon Si Thammarat, Phatthalung, and Pattani provinces, for supplying the paddy-rice grain used in this study.
Conflicts of Interest
The author declares no conflict of interest.
Sample Availability
Samples of the compounds are not available from the authors.
References
- Thanawong, K.; Perret, S.R.; Basset-Mens, C. Eco-efficiency of paddy rice production in northeastern Thailand: A comparison of rain-fed and irrigated cropping systems. J. Clean. Prod. 2014, 73, 204–217. [Google Scholar] [CrossRef]
- USDA Foreign Agricultural Services. Grain report: Grain and feed update Thailand; Report Number: TH2020-0012; Global Agricultural Information Network: Washington, DC, USA, 2020. [Google Scholar]
- Moongngarm, A.; Daomukda, N.; Khumpika, S. Chemical compositions, phytochemicals, and antioxidant capacity of rice bran, rice bran layer, and rice germ. APCBEE Procedia 2012, 2, 73–79. [Google Scholar] [CrossRef] [Green Version]
- Goufo, P.; Trindade, H. Rice antioxidants: Phenolic acids, flavonoids, anthocyanins, proanthocyanidins, tocopherols, tocotrienols, γ-oryzanol, and phytic acid. Food Sci. Nutr. 2014, 2, 75–104. [Google Scholar] [CrossRef]
- Wanyo, P.; Meeso, N.; Siriamornpun, S. Effects of different treatments on the antioxidant properties and phenolic compounds of rice bran and rice husk. Food Chem. 2014, 157, 457–463. [Google Scholar] [CrossRef]
- Rondanelli, M.; Miccono, A.; Peroni, G.; Nichetti, M.; Infantino, V.; Spadaccini, D.; Alalwan, T.A.; Faliva, M.A.; Perna, S. Rice germ macro- and micronutrients: A new opportunity for the nutraceutics. Nat. Prod. Res. 2019, 35, 1532–1536. [Google Scholar] [CrossRef]
- Tabaraki, R.; Nateghi, A. Optimization of ultrasonic-assisted extraction of natural antioxidants from rice bran using response surface methodology. Ultrason. Sonochem. 2011, 18, 1279–1286. [Google Scholar] [CrossRef]
- Lourith, N.; Kanlayavattanakul, M. Appraisal of Thai glutinous rice husk for health promotion products. J. Cereal Sci. 2013, 57, 343–347. [Google Scholar] [CrossRef]
- Gao, Y.; Guo, X.; Liu, Y.; Fang, Z.; Zhang, M.; Zhang, R.; You, L.; Li, T.; Liu, R.H. A full utilization of rice husk to evaluate phytochemical bioactivities and prepare cellulose nanocrystals. Sci. Rep. 2018, 8, 10482. [Google Scholar] [CrossRef] [PubMed]
- Chinvongamorn, C.; Sansenya, S. The γ-oryzanol content of Thai rice cultivars and the effects of gamma irradiation on the γ-oryzanol content of germinated Thai market rice. Orient. J. Chem. 2020, 36, 812–818. [Google Scholar] [CrossRef]
- Division of Rice Research and Development. Rice Knowledge Bank, Rice Department, Ministry of Agriculture and Cooperatives. Available online: http://webold.ricethailand.go.th/rkb3/ (accessed on 8 September 2021).
- OAE. Agricultural Production Information of Thailand: In-Season Rice and Off-Season Rice; Center for Agricultural Information, Office of Agricultural Economics, Ministry of Agriculture and Cooperatives: Bangkok, Thailand, 2018. [Google Scholar]
- Vergara, B.S.; Chang, T.T. The Flowering Response of the Rice Plant to Photoperiod: A Review of the Literature, 4th ed.; International Rice Research Institute: Los Baños, Philippines, 1986. [Google Scholar]
- Boontakham, P.; Sookwong, P.; Jongkaewwattana, S.; Wangtueai, S.; Mahatheeranont, S. Comparison of grain yield and 2-acetyl-1-pyrroline (2AP) content in leaves and grain of two Thai fragrant rice cultivars cultivated at greenhouse and open-air conditions. Aust. J. Crop Sci. 2019, 13, 1431. [Google Scholar] [CrossRef]
- Chung, H.-J.; Liu, Q.; Lee, L.; Wei, D. Relationship between the structure, physicochemical properties and in vitro digestibility of rice starches with different amylose contents. Food Hydrocoll. 2011, 25, 968–975. [Google Scholar] [CrossRef]
- Juliano, B.O.; Pascaul, C.G. Quality Characteristics of Milled Rice Grown in Different Countries; Paper Series 48; International Rice Research Institute: Los Banos, Philippines, 1980. [Google Scholar]
- Suwannaporn, P.; Pitiphunpong, S.; Champangern, S. Classification of rice amylose content by discriminant analysis of physicochemical properties. Starch-Stärke 2007, 59, 171–177. [Google Scholar] [CrossRef]
- Buckeridge, M.S.; Rayon, C.; Urbanowicz, B.; Tiné, M.A.S.; Carpita, N.C. Mixed linkage (1→3),(1→4)-β-D-glucans of grasses. Cereal Chem. 2004, 81, 115–127. [Google Scholar] [CrossRef]
- Cui, S.W.; Wood, P.J. Relationships between structural features, molecular weight and rheological properties of cereal β-D-glucans. In Hydrocolloids: Part 1: Physical Chemistry and Industrial Applications of Gels, Polysaccharides and Proteins; Nishinari, K., Ed.; Elsevier: Amsterdam, The Netherlands, 2000; pp. 159–168. [Google Scholar]
- Collins, H.M.; Burton, R.A.; Topping, D.L.; Liao, M.-L.; Bacic, A.; Fincher, G.B. Variability in fine structures of noncellulosic cell wall polysaccharides from cereal grains: Potential importance in human health and nutrition. Cereal Chem. 2010, 87, 272–282. [Google Scholar] [CrossRef]
- Henrion, M.; Francey, C.; Lê, K.-A.; Lamothe, L. Cereal β-glucans: The impact of processing and how it affects physiological responses. Nutrients 2019, 11, 1729. [Google Scholar] [CrossRef] [PubMed] [Green Version]
- Cicero, A.F.G.; Fogacci, F.; Veronesi, M.; Strocchi, E.; Grandi, E.; Rizzoli, E.; Poli, A.; Marangoni, F.; Borghi, C. A randomized placebo-controlled clinical trial to evaluate the medium-term effects of oat fibers on human health: The beta-glucan effects on lipid profile, glycemia and intestinal health (belt) study. Nutrients 2020, 12, 686. [Google Scholar] [CrossRef] [Green Version]
- Pino, J.L.; Mujica, V.; Arredondo, M. Effect of dietary supplementation with oat β-glucan for 3 months in subjects with type 2 diabetes: A randomized, double-blind, controlled clinical trial. J. Funct. Foods 2021, 77, 104311. [Google Scholar] [CrossRef]
- Brennan, C.S.; Cleary, L.J. The potential use of cereal (1→3,1→4)-β-d-glucans as functional food ingredients. J. Cereal Sci. 2005, 42, 1–13. [Google Scholar] [CrossRef]
- Tosh, S.M.; Miller, S.S. Health effects of β-glucans found in cereals. In Encyclopedia of Food Grains; Wrigley, C., Corke, H., Seetharaman, K., Faubion, J., Eds.; Elsevier Science Publishers, B.V.: Amsterdam, The Netherlands, 2016; pp. 236–240. [Google Scholar]
- Jayachandran, M.; Chen, J.; Chung, S.S.M.; Xu, B. A critical review on the impacts of β-glucans on gut microbiota and human health. J. Nutr. Biochem. 2018, 61, 101–110. [Google Scholar] [CrossRef]
- Cui, S.W.; Wang, Q. Cell wall polysaccharides in cereals: Chemical structures and functional properties. Struct. Chem. 2009, 20, 291–297. [Google Scholar] [CrossRef]
- Palmer, R.; Cornuault, V.; Marcus, S.E.; Knox, J.P.; Shewry, P.R.; Tosi, P. Comparative in situ analyses of cell wall matrix polysaccharide dynamics in developing rice and wheat grain. Planta 2015, 241, 669–685. [Google Scholar] [CrossRef] [PubMed] [Green Version]
- Demirbas, A. β-Glucan and mineral nutrient contents of cereals grown in Turkey. Food Chem. 2005, 90, 773–777. [Google Scholar] [CrossRef]
- Jung, T.-D.; Shin, G.-H.; Kim, J.-M.; Choi, S.-I.; Lee, J.-H.; Lee, S.J.; Park, S.J.; Woo, K.S.; Oh, S.K.; Lee, O.-H. Comparative analysis of γ-oryzanol, β-glucan, total phenolic content and antioxidant activity in fermented rice bran of different varieties. Nutrients 2017, 9, 571. [Google Scholar] [CrossRef] [PubMed] [Green Version]
- Ehrenbergerová, J.; Brezinová Belcredi, N.; Psota, V.; Hrstková, P.; Cerkal, R.; Newman, C.W. Changes caused by genotype and environmental conditions in beta-glucan content of spring barley for dietetically beneficial human nutrition. Plant Foods Hum. Nutr. 2008, 63, 111–117. [Google Scholar] [CrossRef] [PubMed]
- Howarth, C.J.; Martinez-Martin, P.M.J.; Cowan, A.A.; Griffiths, I.M.; Sanderson, R.; Lister, S.J.; Langdon, T.; Clarke, S.; Fradgley, N.; Marshall, A.H. Genotype and environment affect the grain quality and yield of winter oats (Avena sativa L.). Foods 2021, 10, 2356. [Google Scholar] [CrossRef]
- Islamovic, E.; Obert, D.E.; Oliver, R.E.; Harrison, S.A.; Ibrahim, A.; Marshall, J.M.; Miclaus, K.J.; Hu, G.; Jackson, E.W. Genetic dissection of grain beta-glucan and amylose content in barley (Hordeum vulgare L.). Mol. Breed. 2013, 31, 15–25. [Google Scholar] [CrossRef]
- Izydorczyk, M.S.; Storsley, J.; Labossiere, D.; MacGregor, A.W.; Rossnagel, B.G. Variation in total and solube β-glucan content in hulless barley: Effects of thermal, physical, and enzymatic treatments. J. Agric. Food Chem. 2000, 48, 982–989. [Google Scholar] [CrossRef]
- Hang, A.; Obert, D.; Gironella, A.I.N.; Burton, C.S. Barley amylose and β-glucan: Their relationships to protein, agronomic traits, and environmental factors. Crop Sci. 2007, 47, 1754–1760. [Google Scholar] [CrossRef] [Green Version]
- Shu, X.; Rasmussen, S.K. Quantification of amylose, amylopectin, and β-glucan in search for genes controlling the three major quality traits in barley by genome-wide association studies. Front. Plant. Sci. 2014, 5, 197. [Google Scholar] [CrossRef] [Green Version]
- Esa, N.M.; Ling, T.B.; Peng, L.S. By-Products of rice processing: An overview of health benefits and applications. J. Rice Res. 2013, 1, 107. [Google Scholar] [CrossRef] [Green Version]
- Gopala Krishna, A.G.; Raja Rajan, R.G.; Bhatnagar, A.S. Rice Bran: Chemistry, production and applications—A review. Beverage Food World 2012, 39, 31–36. [Google Scholar]
- Bandonill, E.H.; Corpuz, G.G. Grain quality of irrigated lowland rice varieties as affected by season and crop establishment. J. Crop Sci. 2015, 40, 74–77. [Google Scholar]
- Kalpanadevi, C.; Singh, V.; Subramanian, R. Influence of milling on the nutritional composition of bran from different rice varieties. J. Food Sci. Technol. 2018, 55, 2259–2269. [Google Scholar] [CrossRef] [PubMed]
- Hoogenkamp, H.; Kumagai, H.; Wanasundara, J.P.D. Chapter 3—Rice protein and rice protein products. In Sustainable Protein Sources; Nadathur, S.R., Wanasundara, J.P.D., Scanlin, L., Eds.; Elsevier: Amsterdam, The Netherlands, 2017; pp. 47–65. [Google Scholar]
- Vichapong, J.; Sookserm, M.; Srijesdaruk, V.; Swatsitang, P.; Srijaranai, S. High performance liquid chromatographic analysis of phenolic compounds and their antioxidant activities in rice varieties. LWT Food Sci. Technol. 2010, 43, 1325–1330. [Google Scholar] [CrossRef]
- USAID Mekong Adaptation and Resilience to Climate Change (USAID Mekong ARCC). Thailand Climate Change Vulnerability Profile, IUCN, Asia. Available online: https://www.iucn.org/asia/thailand/countries/thailand/usaid-mekong-adaptation-and-resilience-climate-change (accessed on 5 October 2021).
- De Datta, S.K. Principles and Practices of Rice Production; A Wiley-Interscience Publication; John Wiley & Sons: New York, NY, USA, 1981. [Google Scholar]
- Suebpongsang, P.; Ekasingh, B.; Cramb, R. Commercialisation of rice Farming in northeast Thailand. In White Gold: The Commercialisation of Rice Farming in the Lower Mekong Basin; Cramb, R., Ed.; Palgrave Macmillan: London, UK, 2020; pp. 39–68. [Google Scholar]
- Nishantha, M.D.L.C.; Zhao, X.; Jeewani, D.C.; Bian, J.; Nie, X.; Weining, S. Direct comparison of β-glucan content in wild and cultivated barley. Int. J. Food Prop. 2018, 21, 2218–2228. [Google Scholar] [CrossRef] [Green Version]
- AACC International. Method 44-15.02 Moisture—Air-Oven Methods. Available online: https://www.cerealsgrains.org/resources/Methods/Pages/44Moisture.aspx (accessed on 8 September 2021).

Publisher’s Note: MDPI stays neutral with regard to jurisdictional claims in published maps and institutional affiliations. |
© 2021 by the author. Licensee MDPI, Basel, Switzerland. This article is an open access article distributed under the terms and conditions of the Creative Commons Attribution (CC BY) license (https://creativecommons.org/licenses/by/4.0/).