
Multi-Elemental Composition Data Handled by Chemometrics for the Discrimination of High-Value Italian Pecorino Cheeses

 ,
,  ,
,  ,
,  and
and 
Abstract
:1. Introduction
2. Results
2.1. Validation of ICP-OES Analysis of Pecorino Cheese
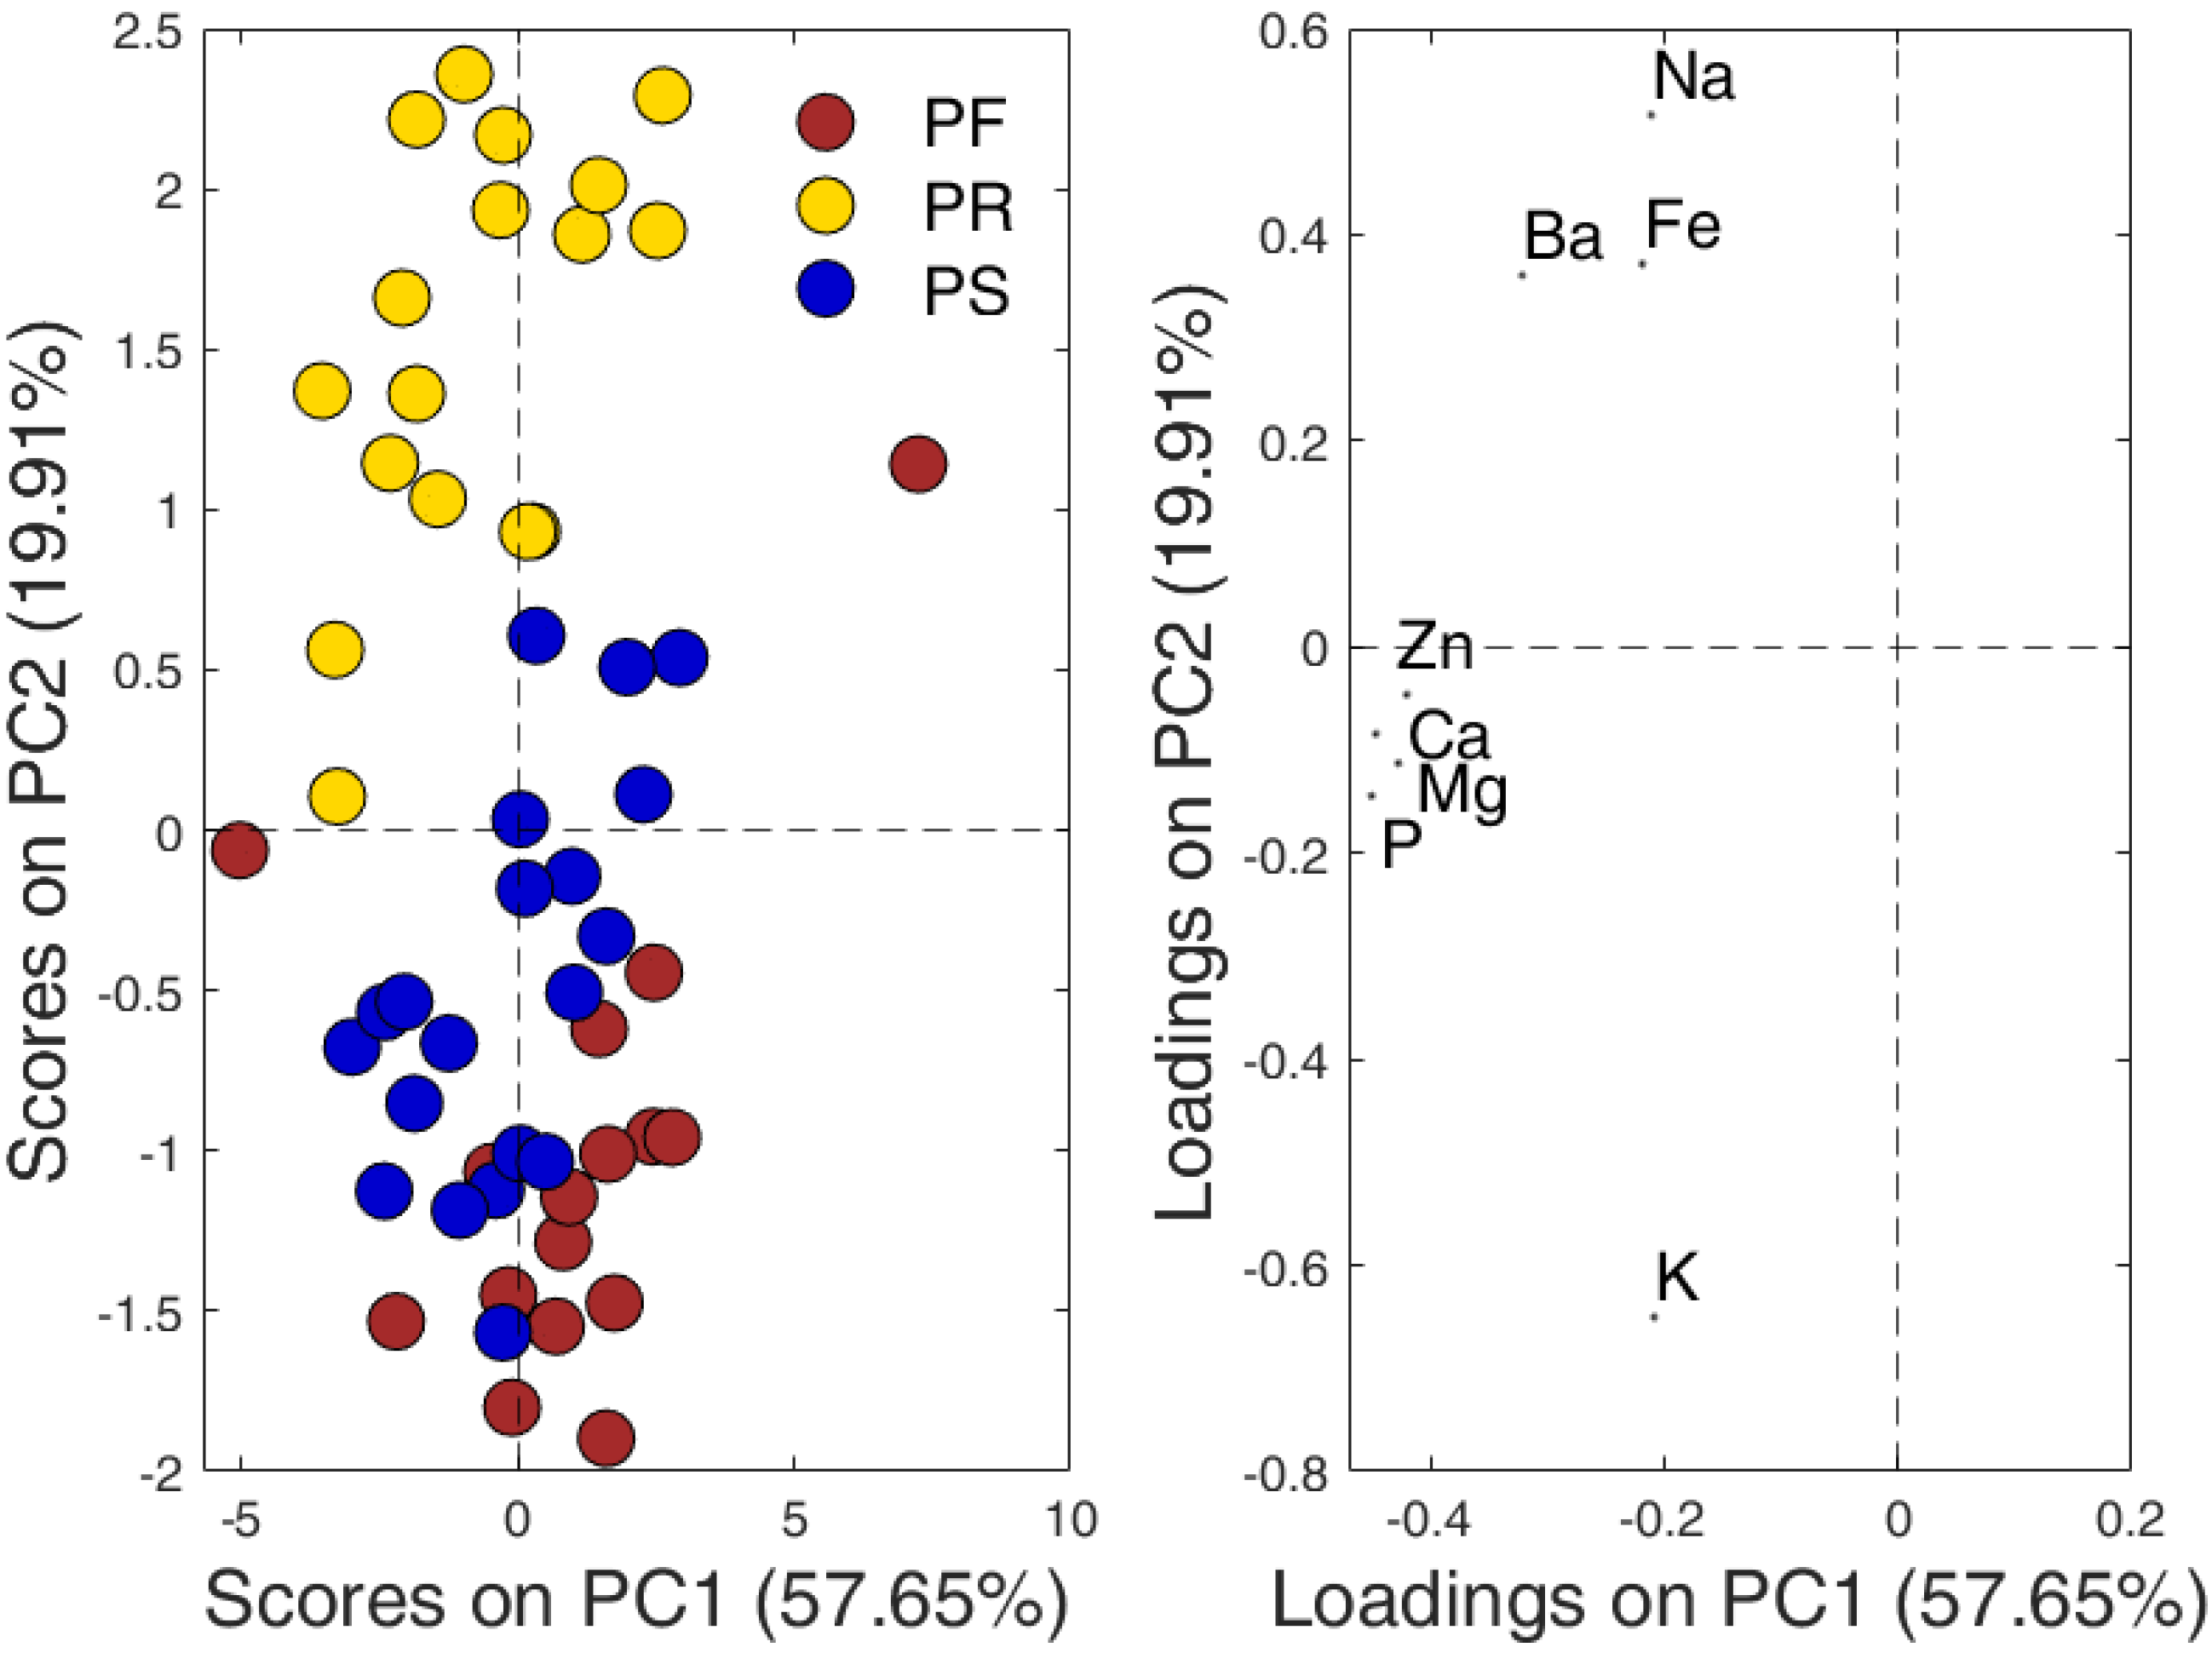
2.2. Exploratory Analysis of ICP-OES Data
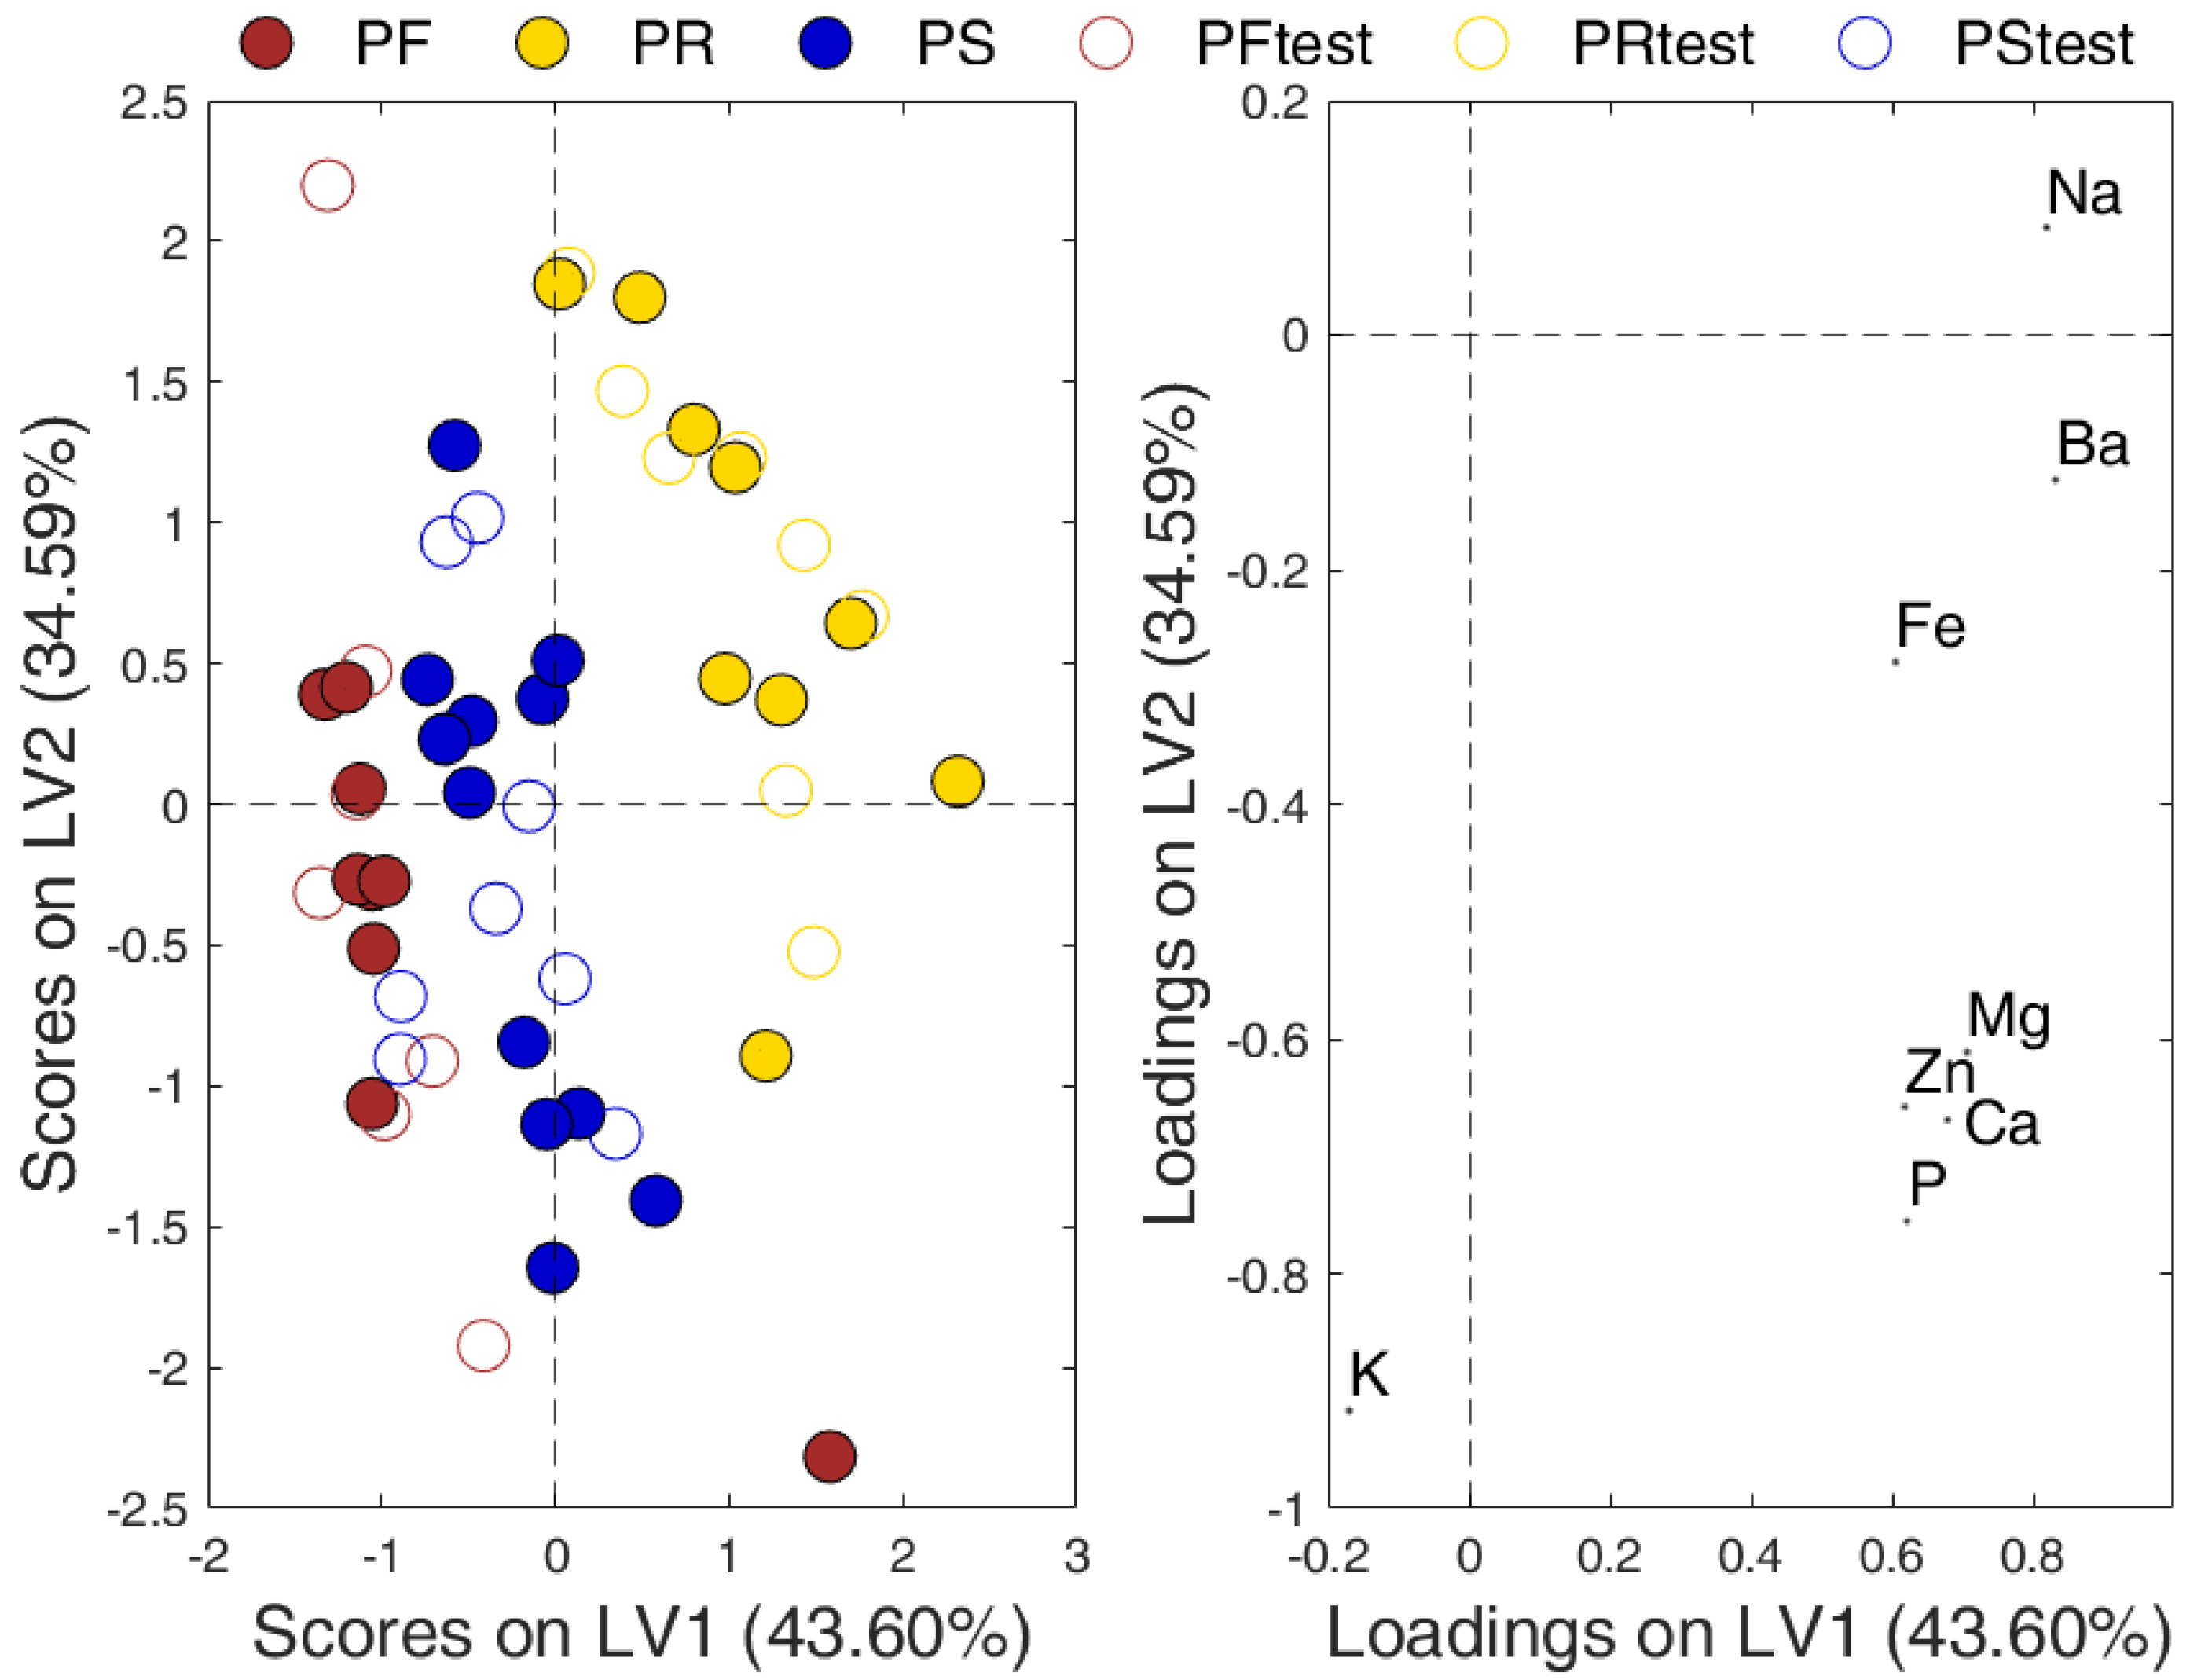
2.3. PLS-DA Geographical Classification of Pecorino Samples
3. Discussion
4. Materials and Methods
4.1. Pecorino Cheese Samples
4.2. Chemicals
4.3. Sample Preparation and Microwave-Assisted Digestion
4.4. ICP-OES Analysis
4.5. Multivariate Statistical Analysis
5. Conclusions
Author Contributions
Funding
Institutional Review Board Statement
Informed Consent Statement
Data Availability Statement
Conflicts of Interest
Sample Availability
References
- Di Donato, F.; Biancolillo, A.; Mazzulli, D.; Rossi, L.; D’Archivio, A.A. HS-SPME/GC–MS volatile fraction determination and chemometrics for the discrimination of typical Italian Pecorino cheeses. Microchem. J. 2021, 165, 106133. [Google Scholar] [CrossRef]
- European Commission Agriculture and Rural Development. DOOR Database. Available online: https://ec.europa.eu/agriculture/quality/door/list.html (accessed on 1 October 2021).
- Hrbek, V.; Vaclavik, L.; Elich, O.; Hajslova, J. Authentication of milk and milk-based foods by direct analysis in real time ionization-high resolution mass spectrometry (DART-HRMS) technique: A critical assessment. Food Control. 2014, 36, 138–145. [Google Scholar] [CrossRef]
- Kamal, M.; Karoui, R. Analytical methods coupled with chemometric tools for determining the authenticity and detecting the adulteration of dairy products: A review. Trends Food Sci. Technol. 2015, 46, 27–48. [Google Scholar] [CrossRef]
- Karoui, R.; De Baerdemaeker, J. A review of the analytical methods coupled with chemometric tools for the determination of the quality and identity of dairy products. Food Chem. 2007, 102, 621–640. [Google Scholar] [CrossRef]
- Rodríguez-Bermúdez, R.; López-Alonso, M.; Miranda, M.; Fouz, R.; Orjales, I.; Herrero-Latorre, C. Chemometric authentication of the organic status of milk on the basis of trace element content. Food Chem. 2018, 240, 686–693. [Google Scholar] [CrossRef]
- D’Archivio, A.A.; Foschi, M.; Aloia, R.; Maggi, M.A.; Rossi, L.; Ruggieri, F. Geographical discrimination of red garlic (Allium sativum L.) produced in Italy by means of multivariate statistical analysis of ICP-OES data. Food Chem. 2019, 275, 333–338. [Google Scholar] [CrossRef]
- Ruggiero, L.; Fontanella, M.C.; Amalfitano, C.; Beone, G.M.; Adamo, P. Provenance discrimination of Sorrento lemon with Protected Geographical indication (PGI) by multi-elemental fingerprinting. Food Chem. 2021, 362, 130168. [Google Scholar] [CrossRef]
- Foschi, M.; D’Archivio, A.A.; Rossi, L. Geographical discrimination and authentication of lentils (Lens culinaris Medik.) by ICP-OES elemental analysis and chemometrics. Food Control 2020, 118, 107438. [Google Scholar] [CrossRef]
- D’Archivio, A.A.; Di Vacri, M.L.; Ferrante, M.; Maggi, M.A.; Nisi, S.; Ruggieri, F. Geographical discrimination of saffron (Crocus sativus L.) using ICP-MS elemental data and class modeling of PDO Zafferano dell’Aquila produced in Abruzzo (Italy). Food Anal. Methods 2019, 12, 2572–2581. [Google Scholar] [CrossRef]
- Varrà, M.O.; Husáková, L.; Patočka, J.; Ghidini, S.; Zanardi, E. Multi-element signature of cuttlefish and its potential for the discrimination of different geographical provenances and traceability. Food Chem. 2021, 356. [Google Scholar] [CrossRef]
- Wu, F.; Zhao, H.; Sun, J.; Guo, J.; Wu, L.; Xue, X.; Cao, W. ICP-MS-based ionomics method for discriminating the geographical origin of honey of Apis cerana Fabricius. Food Chem. 2021, 354. [Google Scholar] [CrossRef] [PubMed]
- Zain, S.M.; Behkami, S.; Bakirdere, S.; Koki, I.B. Milk authentication and discrimination via metal content clustering-A case of comparing milk from Malaysia and selected countries of the world. Food Control. 2016, 66, 306–314. [Google Scholar] [CrossRef]
- Sacco, D.; Brescia, M.A.; Sgaramella, A.; Casiello, G.; Buccolieri, A.; Ogrinc, N.; Sacco, A. Discrimination between Southern Italy and foreign milk samples using spectroscopic and analytical data. Food Chem. 2009, 114, 1559–1563. [Google Scholar] [CrossRef]
- Camin, F.; Wehrens, R.; Bertoldi, D.; Bontempo, L.; Ziller, L.; Perini, M.; Nicolini, G.; Nocetti, M.; Larcher, R. H, C, N and S stable isotopes and mineral profiles to objectively guarantee the authenticity of grated hard cheeses. Anal. Chim. Acta 2012, 711, 54–59. [Google Scholar] [CrossRef]
- Bontempo, L.; Barbero, A.; Bertoldi, D.; Camin, F.; Larcher, R.; Perini, M.; Sepulcri, A.; Zicarelli, L.; Piasentier, E. Isotopic and elemental profiles of Mediterranean buffalo milk and cheese and authentication of Mozzarella di Bufala Campana PDO: An initial exploratory study. Food Chem. 2019, 285, 316–323. [Google Scholar] [CrossRef]
- Brescia, M.A.; Monfreda, M.; Buccolieri, A.; Carrino, C. Characterisation of the geographical origin of buffalo milk and mozzarella cheese by means of analytical and spectroscopic determinations. Food Chem. 2005, 89, 139–147. [Google Scholar] [CrossRef]
- Slow Food Foundation for Biodiversity. Italian Slow Food Presidia. Available online: https://www.fondazioneslowfood.com/en/slow-food-presidia/farindola-pecorino/ (accessed on 20 October 2021).
- Eurachem. Eurachem Guide: The Fitness for Purpose of Analytical Methods—A Laboratory Guide to Method Validation and Related Topics. Available online: www.eurachem.org (accessed on 20 October 2021).
- Thomsen, V.; Roberts, G.; Burgess, K. The concept of background equivalent concentration in spectrochemistry. Spectroscopy 2000, 15, 33–36. [Google Scholar]
- Huber, L. Validation and Qualification in Analytical Laboratories; Informa Healthcare: London, UK, 2007. [Google Scholar]
- Gustavo González, A.; Ángeles Herrador, M. A practical guide to analytical method validation, including measurement uncertainty and accuracy profiles. TrAC-Trends Anal. Chem. 2007, 26, 227–238. [Google Scholar] [CrossRef]
- Snee, R.D. Validation of Regression Models: Methods and Examples. Technometrics 1977, 19, 415–428. [Google Scholar] [CrossRef]
- Wold, S.; Johansson, E.; Cocchi, M. PLS-Partial least squares projections to latent structures. In 3D QSAR in Drug Design. Theory, Methods, and Applications; Escom: Lieden, Germany, 1993; pp. 523–550. [Google Scholar]
- Moreno-Rojas, R.; Cámara-Martos, F.; Sánchez-Segarra, P.J.; Amaro-López, M.Á. Influence of manufacturing conditions and discrimination of Northern Spanish cheeses using multi-element analysis. Int. J. Dairy Technol. 2012, 65, 594–602. [Google Scholar] [CrossRef]
- Raynal-Ljutovac, K.; Lagriffoul, G.; Paccard, P.; Guillet, I.; Chilliard, Y. Composition of goat and sheep milk products: An update. Small Rumin. Res. 2008, 79, 57–72. [Google Scholar] [CrossRef]
- Patel, H.G.; Upadhyay, K.G.; Pandya, A.J. Effects of milk acidity at rennenting and acidity of whey at draining on partitioning of minerals during manufacture of buffalo milk Cheddar cheese. Asian J. Dairy Res. 1991, 10, 217–222. [Google Scholar]
- Tofalo, R.; Schirone, M.; Fasoli, G.; Perpetuini, G.; Patrignani, F.; Manetta, A.C.; Lanciotti, R.; Corsetti, A.; Martino, G.; Suzzi, G. Influence of pig rennet on proteolysis, organic acids content and microbiota of Pecorino di Farindola, a traditional Italian ewe’s raw milk cheese. Food Chem. 2015, 175, 121–127. [Google Scholar] [CrossRef] [PubMed]
- Adams, R.S. Variability in Mineral and Trace Element Content of Dairy Cattle Feeds. J. Dairy Sci. 1975, 58, 1538–1548. [Google Scholar] [CrossRef]
- Anon, T. The composition of ewe’s and goat’s milk. Int. Dairy Feed. Bull. 1981, 140, 5–19. [Google Scholar]
- Wold, S. Principal component analysis. Chemom. Intell. Lab. Syst. 1987, 2, 37–52. [Google Scholar] [CrossRef]
- Sjöström, M.; Wold, S.; Söderström, B. PLS Discriminant Plots. In Pattern Recognition in Practice II; Gelsema, E.S., Kanal, L.N., Eds.; Elsevier: Amsterdam, The Netherlands, 1986; pp. 461–470. [Google Scholar]
- Biancolillo, A.; Marini, F.; Ruckebusch, C.; Vitale, R. Chemometric strategies for spectroscopy-based food authentication. Appl. Sci. 2020, 10, 6544. [Google Scholar] [CrossRef]
- Fisher, R.A. The use of multiple measurements in taxonomic problems. Ann. Eugen. 1936, 7, 179–188. [Google Scholar] [CrossRef]
- Barker, M.; Rayens, W. Partial least squares for discrimination. J. Chemom. 2003, 17, 166–173. [Google Scholar] [CrossRef]
- Pérez, N.F.; Ferré, J.; Boqué, R. Calculation of the reliability of classification in discriminant partial least-squares binary classification. Chemom. Intell. Lab. Syst. 2009, 95, 122–128. [Google Scholar] [CrossRef]


| Element | λ (nm) | R2 | WLR (µg/mL) | LOD (µg/gdry) | LOQ (µg/gdry) | R(%) | RSD (%) |
|---|---|---|---|---|---|---|---|
| Ba | 233.527 | 0.9998 | 0.008–0.08 | 0.05 | 0.18 | 97 | 7 |
| Ca | 315.887 | 0.9997 | 10–100 | 3.38 | 11.27 | 99 | 2 |
| Fe | 259.940 | 0.9921 | 0.02–0.20 | 0.22 | 0.73 | 83 | 12 |
| K | 766.491 | 0.9996 | 5–50 | 1.43 | 4.78 | 98 | 1 |
| Mg | 280.271 | 0.9997 | 1–30 | 1.01 | 3.35 | 99 | 2 |
| Na | 588.995 | 0.9996 | 10–100 | 5.64 | 18.80 | 99 | 1 |
| P | 213.618 | 0.9998 | 10–100 | 2.80 | 9.33 | 100 | 2 |
| Zn | 202.548 | 0.9975 | 0.02–0.20 | 0.24 | 0.81 | 102 | 1 |
| Element | PF (n = 16) | PS (n = 20) | PR (n = 17) | ANOVA (p Value) | LSD § |
|---|---|---|---|---|---|
| Ba * | 1.2 ± 0.7 | 2.7 ± 0.8 | 3.5 ± 1.1 | <10−4 | PF-PS; PS-PR; PF-PR |
| Ca $ | 12 ± 3 | 13 ± 2 | 13 ± 3 | 0.3070 | - |
| Fe * | 2.4 ± 1.7 | 2.5 ± 1.3 | 3.8 ± 1.8 | 0.0283 | PF-PR; PS-PR |
| K $ | 1.7 ± 0.3 | 1.5 ± 0.4 | 1.1 ± 0.3 | <10−4 | PF-PR; PS-PR |
| Mg $ | 0.65 ± 0.19 | 0.70 ± 0.12 | 0.73 ± 0.16 | 0.3331 | - |
| Na $ | 11 ± 5 | 10 ± 2 | 21 ± 5 | <10−4 | PF-PR; PS-PR |
| P $ | 8 ± 2 | 8 ± 2 | 9.0 ± 1.7 | 0.6910 | - |
| Zn * | 40 ± 12 | 48 ± 11 | 49 ± 15 | 0.0711 | PF-PS; PF-PR |
Publisher’s Note: MDPI stays neutral with regard to jurisdictional claims in published maps and institutional affiliations. |
© 2021 by the authors. Licensee MDPI, Basel, Switzerland. This article is an open access article distributed under the terms and conditions of the Creative Commons Attribution (CC BY) license (https://creativecommons.org/licenses/by/4.0/).
Share and Cite
Di Donato, F.; Foschi, M.; Vlad, N.; Biancolillo, A.; Rossi, L.; D’Archivio, A.A. Multi-Elemental Composition Data Handled by Chemometrics for the Discrimination of High-Value Italian Pecorino Cheeses. Molecules 2021, 26, 6875. https://doi.org/10.3390/molecules26226875
Di Donato F, Foschi M, Vlad N, Biancolillo A, Rossi L, D’Archivio AA. Multi-Elemental Composition Data Handled by Chemometrics for the Discrimination of High-Value Italian Pecorino Cheeses. Molecules. 2021; 26(22):6875. https://doi.org/10.3390/molecules26226875
Chicago/Turabian StyleDi Donato, Francesca, Martina Foschi, Nadia Vlad, Alessandra Biancolillo, Leucio Rossi, and Angelo Antonio D’Archivio. 2021. "Multi-Elemental Composition Data Handled by Chemometrics for the Discrimination of High-Value Italian Pecorino Cheeses" Molecules 26, no. 22: 6875. https://doi.org/10.3390/molecules26226875
APA StyleDi Donato, F., Foschi, M., Vlad, N., Biancolillo, A., Rossi, L., & D’Archivio, A. A. (2021). Multi-Elemental Composition Data Handled by Chemometrics for the Discrimination of High-Value Italian Pecorino Cheeses. Molecules, 26(22), 6875. https://doi.org/10.3390/molecules26226875