
The Effect of Sound Frequency and Intensity on Yeast Growth, Fermentation Performance and Volatile Composition of Beer

 , , , , and
Abstract
:1. Introduction
2. Results and Discussion
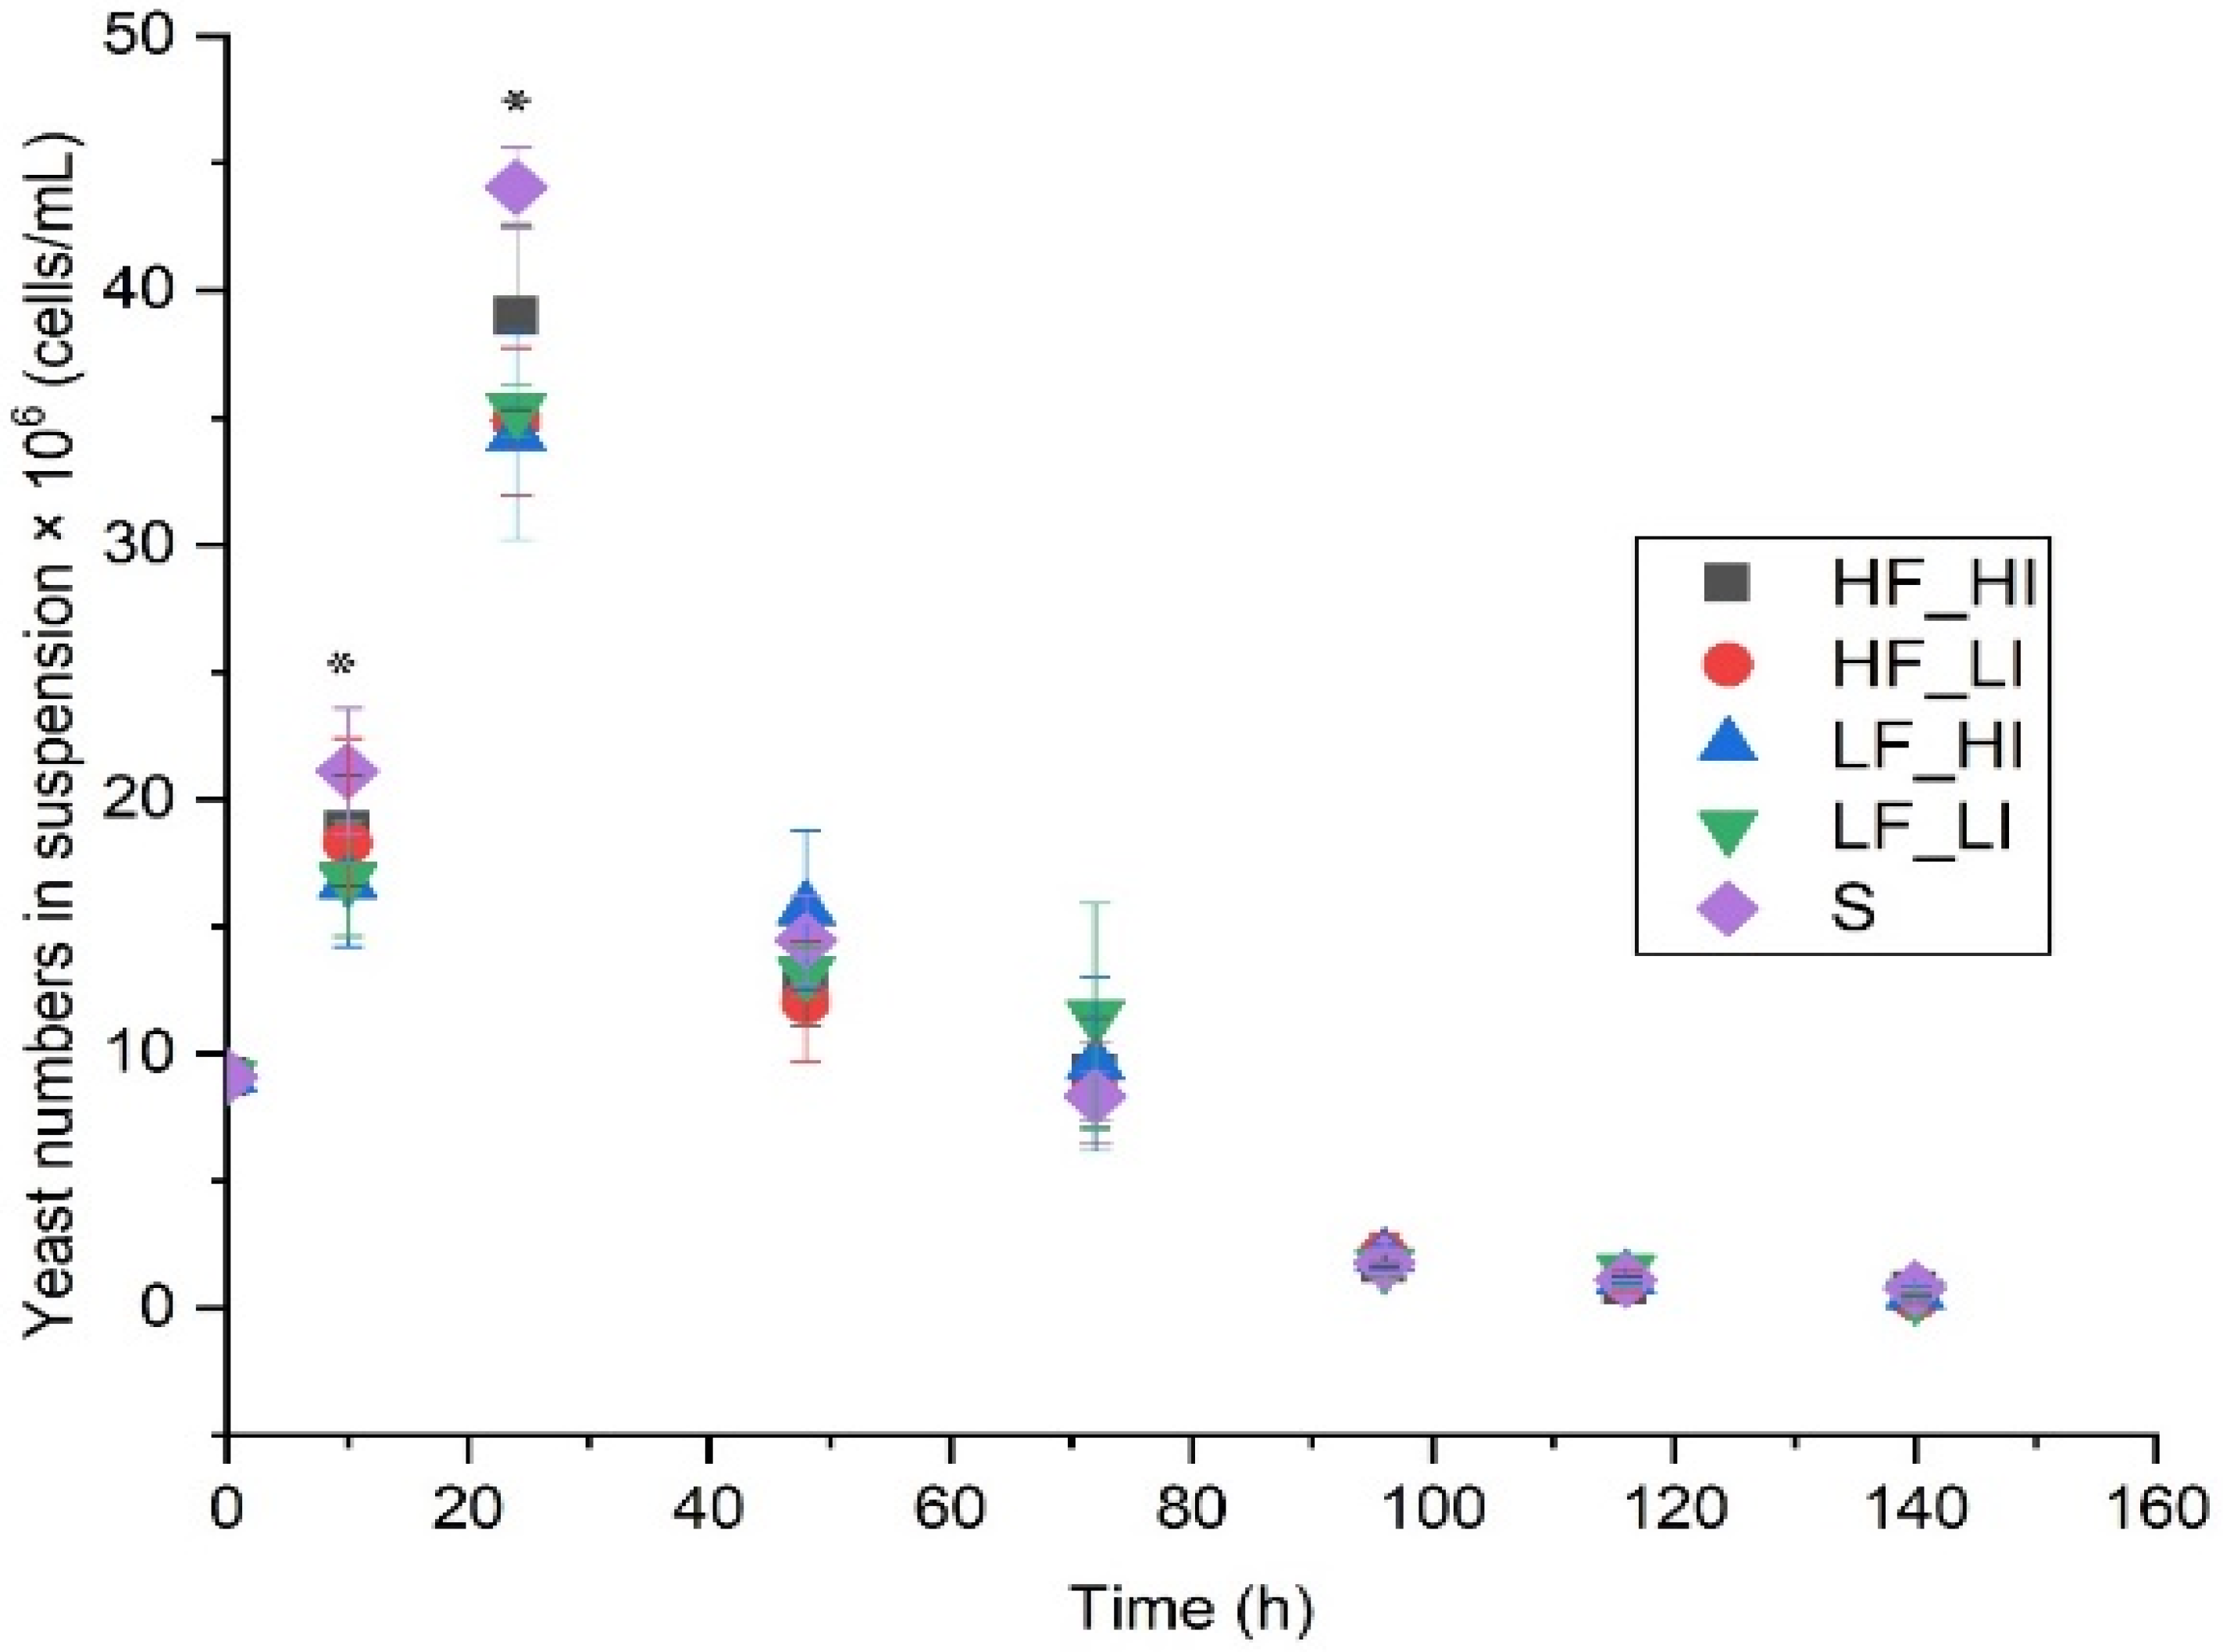
2.1. Yeast Number (Cells in Suspension)
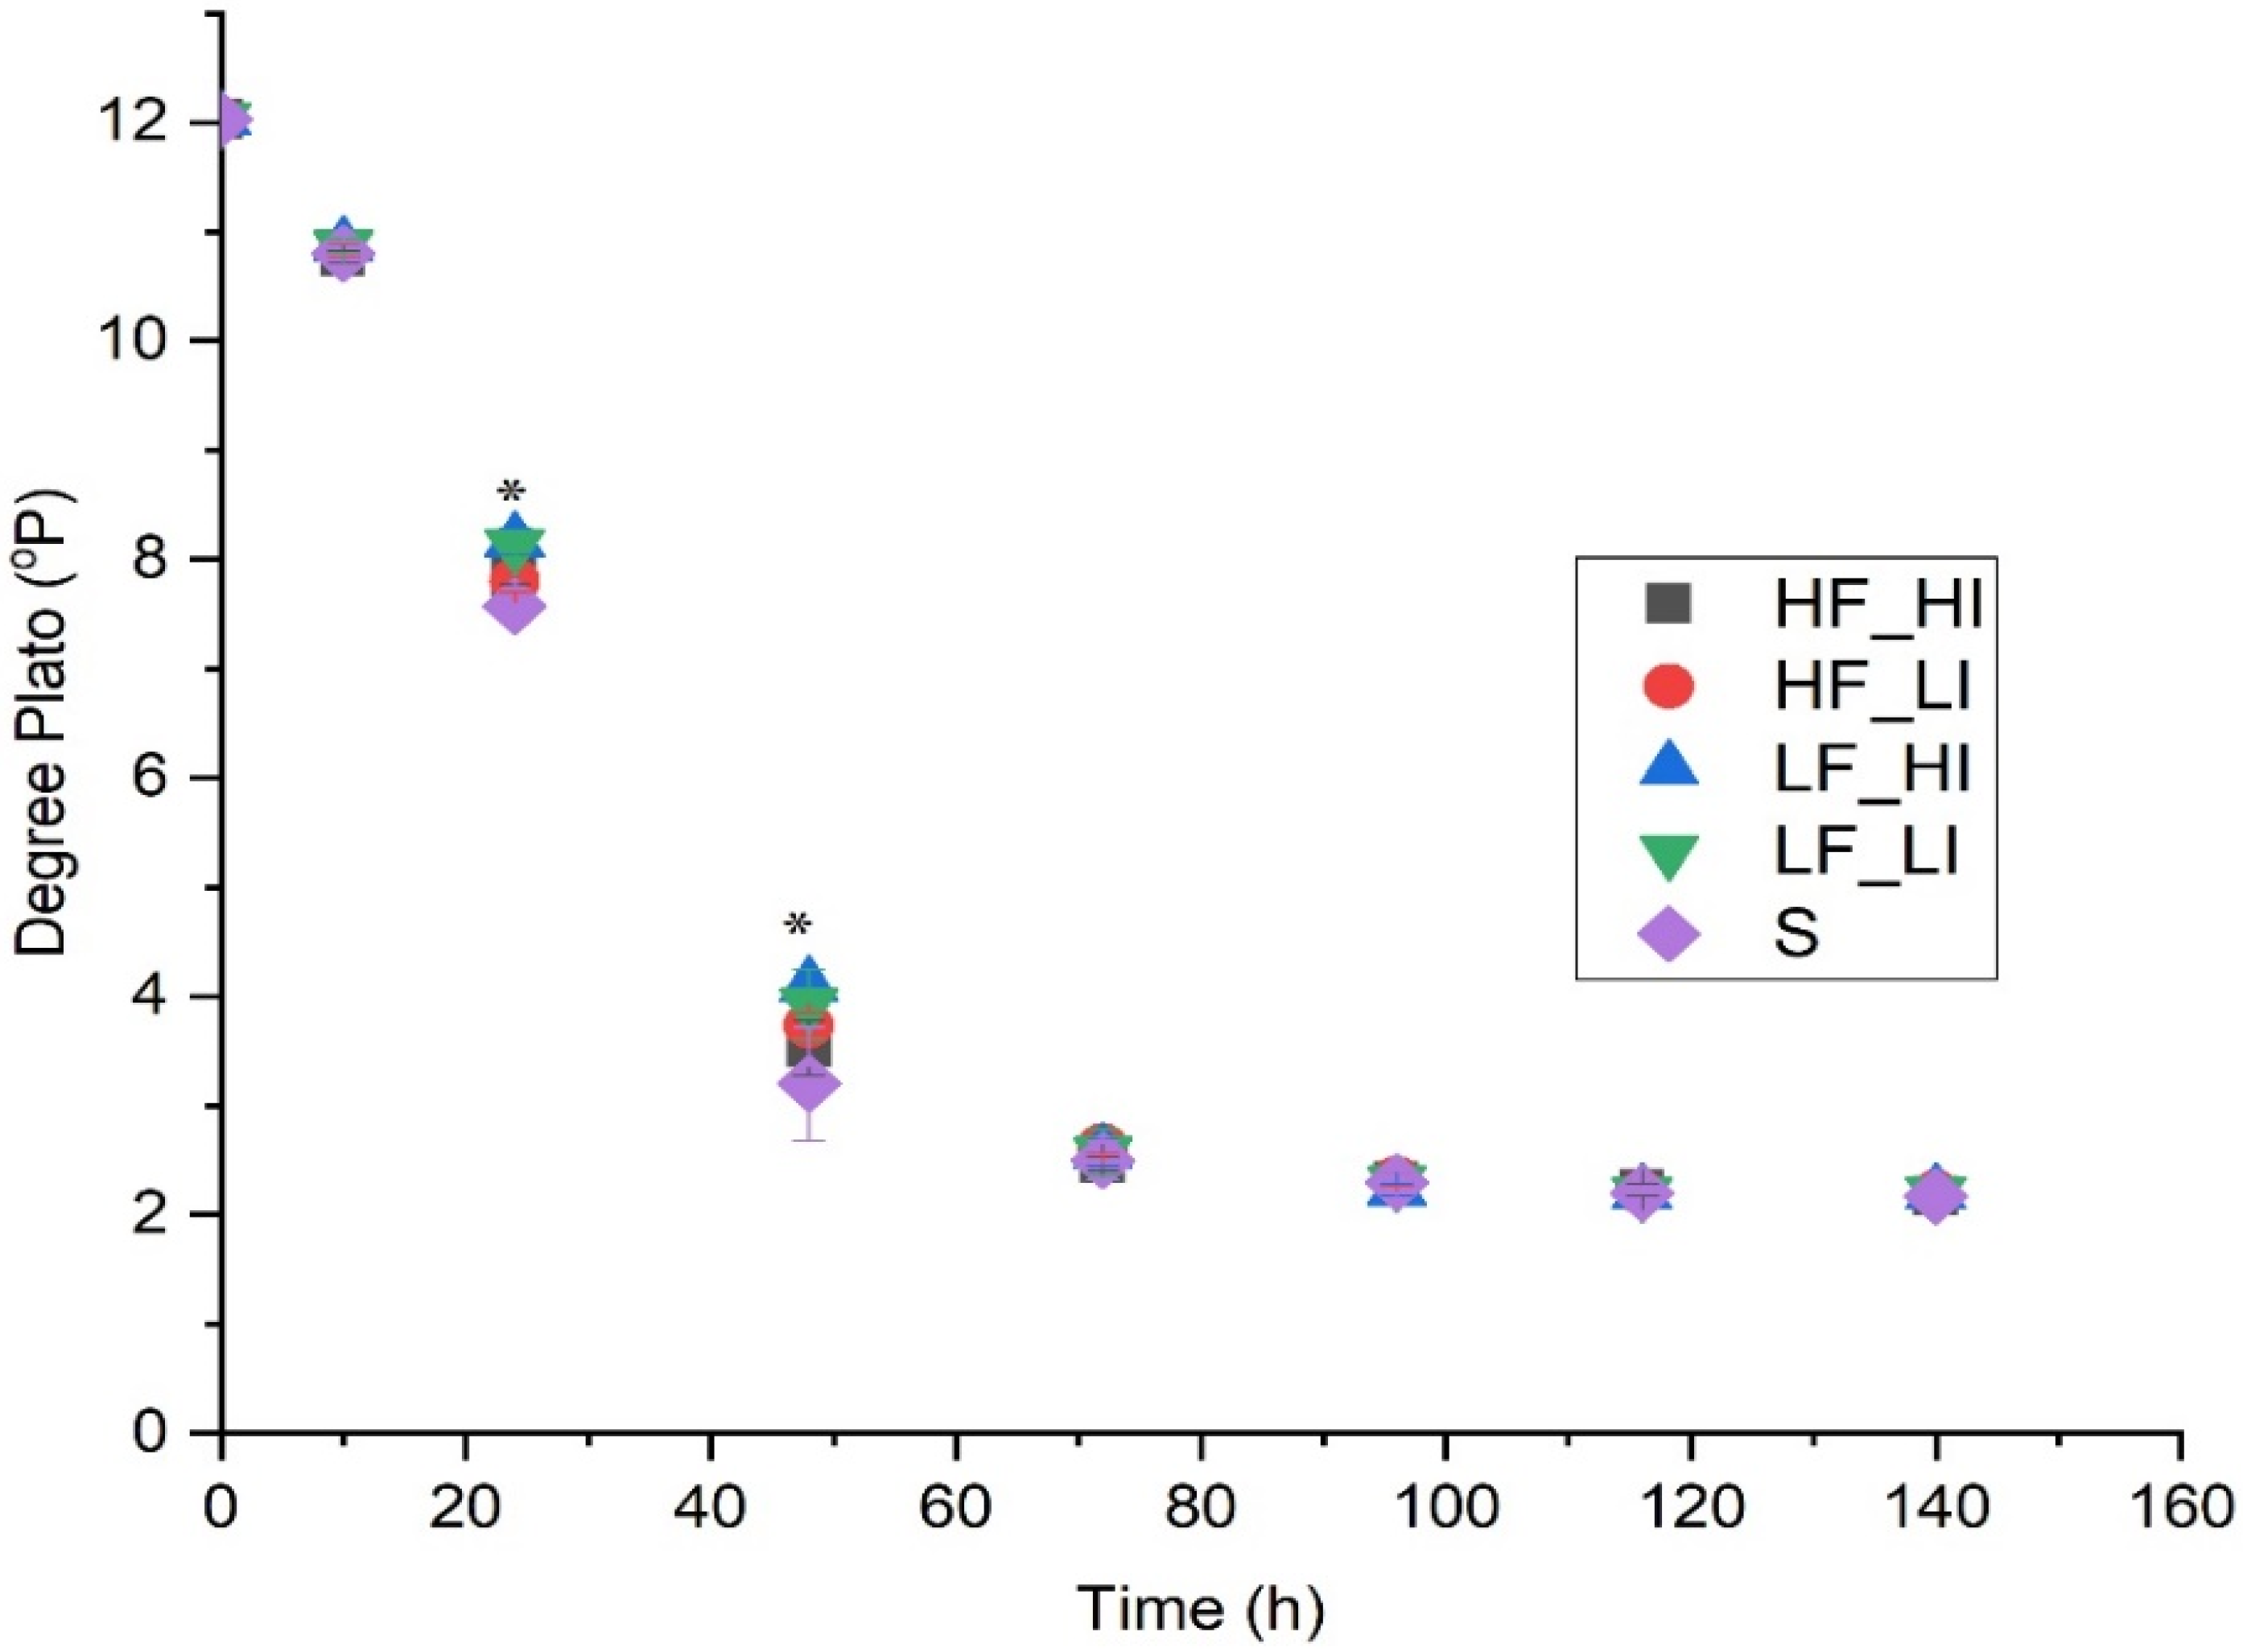
2.2. Wort Gravity
2.3. pH
2.4. Volatile Organic Compounds
3. Materials and Methods
3.1. Materials and Chemicals
3.2. Yeast Activation
3.2.1. Yeast Quantification and Pitching
3.3. Preparation of Wort
3.4. Sound Generation
3.4.1. Sound Delivery and Fermentation
3.5. Physicochemical Parameters
Yeast in Suspension and Viability
3.6. VOC Analysis
3.6.1. GC–MS Conditions
3.6.2. Data Analysis
3.7. Statistical Analysis
4. Conclusions
Supplementary Materials
Author Contributions
Funding
Institutional Review Board Statement
Informed Consent Statement
Data Availability Statement
Acknowledgments
Conflicts of Interest
Sample Availability
Appendix A

| 24 h | ||||||||
| Codes | Volatile organic compounds | RT | HF_HI | HF_LI | LF_HI | LF_LI | S | p value |
| A1 | Ethyl acetate | 2.43 | 8.21 ± 2.89 a | 8.61 ± 2.23 a | 8.49 ± 2.52 a | 9.49 ± 3.29 a | 5.51 ± 4.12 a | 0.206 |
| A2 | 1,1-diethoxyethane | 2.5 | 0.35 ± 0.23 a | 0.52 ± 0.04 a | 0.31 ± 0.28 a | 0.64 ± 0.22 a | 0.34 ± 0.35 a | 0.147 |
| A3 | Ethanol | 3.08 | 1124.33 ± 322.34 ab | 753.61 ± 338.25 b | 1151.64 ± 323.96 ab | 1187.76 ± 193.40 ab | 1338.22 ± 275.64 a | 0.058 |
| A4 | 2,6-dimethyl-2-trans-6-octadiene | 6 | 0.40 ± 0.17 ab | 0.54 ± 0.12 a | 0.42 ± 0.13 ab | 0.41 ± 0.12 ab | 0.24 ± 0.13 b | 0.03 |
| A5 | 2-methyl-1-propanol | 6.12 | 10.11 ± 5.25 a | 12.03 ± 2.93 a | 12.06 ± 4.46 a | 13.04 ± 5.45 a | 10.02 ± 5.32 a | 0.801 |
| A6 | Isoamyl acetate | 6.76 | 20.53 ± 6.78 ab | 26.31 ± 8.19 a | 18.24 ± 6.54 ab | 23.17 ± 6.60 ab | 12.03 ± 9.19 b | 0.032 |
| A7 | 2-methylbutyl isobutyrate | 8.68 | 1.59 ± 1.13 ab | 3.39 ± 2.18 a | 0.85 ± 0.58 b | 1.67 ± 1.30 ab | 0.51 ± 0.44 b | 0.012 |
| A8 | 2-methyl-1-butanol | 9.18 | 39.95 ± 17.89 a | 47.48 ± 8.18 a | 44.57 ± 14.50 a | 48.80 ± 17.98 a | 38.72 ± 18.95 a | 0.809 |
| A9 | 3-methyl-1-butanol | 9.23 | 104.24 ± 46.43 a | 123.67 ± 20.84 a | 115.67 ± 37.05 a | 126.23 ± 45.09 a | 99.72 ± 49.00 a | 0.977 |
| A10 | Ethyl hexanoate | 9.84 | 7.26 ± 4.11 a | 10.38 ± 2.54 a | 6.12 ± 2.79 a | 10.16 ± 4.24 a | 5.62 ± 4.07 a | 0.087 |
| A11 | Methyl 4-methylenehexanoate | 12.42 | 1.11 ± 0.97 a | 1.89 ± 0.93 a | 1.16 ± 0.92 a | 1.59 ± 0.80 a | 0.47 ± 0.58 b | 0.052 |
| A12 | Ethyl heptanoate | 12.53 | 0.41 ± 0.28 a | 0.49 ± 0.23 a | 0.31 ± 0.22 a | 0.58 ± 0.40 a | 0.32 ± 0.34 a | 0.523 |
| A13 | 1-hexanol | 12.95 | 0.74 ± 0.45 a | 0.96 ± 0.19 a | 0.92 ± 0.42 a | 0.95 ± 0.38 a | 0.53 ± 0.40 a | 0.33 |
| A14 | Ethyl octanoate | 15.34 | 28.86 ± 17.30 a | 39.05 ± 9.82 a | 23.38 ± 8.03 a | 38.93 ± 20.96 a | 27.12 ± 16.38 a | 0.363 |
| A15 | 1-heptanol | 15.58 | 0.59 ± 0.58 a | 0.67 ± 0.19 a | 0.63 ± 0.46 a | 0.89 ± 0.58 a | 0.38 ± 0.38 a | 0.506 |
| A16 | Ethyl-1-hexanol | 16.99 | 1.21 ± 1.05 a | 0.40 ± 0.18 a | 1.28 ± 1.20 a | 0.77 ± 0.62 a | 1.64 ± 1.88 a | 0.418 |
| A17 | 1,2-dihydrolinalool | 17.55 | 5.51 ± 2.72 a | 6.17 ± 0.44 a | 6.38 ± 2.67 a | 7.05 ± 2.78 a | 3.96 ± 3.02 a | 0.384 |
| A18 | Linalool | 17.85 | 30.26 ± 18.74 a | 45.56 ± 6.44 a | 37.50 ± 16.44 a | 37.82 ± 12.67 a | 20.63 ± 17.66 b | 0.047 |
| A19 | 1-octanol | 18.1 | 1.21 ± 0.60 a | 1.64 ± 0.18 a | 1.44 ± 0.46 a | 1.45 ± 0.53 a | 0.96 ± 0.50 a | 0.257 |
| A20 | 2-methylpropanoic acid | 18.16 | 1.31 ± 0.87 a | 1.91 ± 0.39 a | 1.60 ± 0.68 a | 1.86 ± 0.72 a | 1.66 ± 0.78 a | 0.725 |
| A21 | Ethyl decanoate | 20.14 | 12.01 ± 6.17 a | 16.86 ± 4.14 a | 10.10 ± 3.63 a | 19.67 ± 10.35 a | 13.95 ± 8.15 a | 0.256 |
| A22 | 3-methylbutyl octanoate | 20.59 | 0.85 ± 0.48 a | 0.97 ± 0.23 a | 0.67 ± 0.18 a | 1.18 ± 0.75 a | 0.95 ± 0.57 a | 0.565 |
| A23 | Unknown terpene alcohol | 21.18 | 1.22 ± 1.13 a | 2.16 ± 0.26 a | 1.50 ± 1.10 a | 1.74 ± 0.88 a | 0.94 ± 0.89 a | 0.332 |
| A24 | Ethyl 9-decenoate | 21.23 | 0.22 ± 0.27 a | ND | ND | 1.01 ± 1.96 a | 0.44 ± 0.65 a | 0.418 |
| A25 | Citronellol | 22.76 | 2.62 ± 1.52 a | 3.66 ± 0.58 a | 3.16 ± 1.21 a | 3.38 ± 1.17 a | 2.07 ± 1.24 a | 0.272 |
| A26 | 3,5-dimethyl-benzaldehyde | 23.51 | 0.71± 0.44 a | 0.54 ± 0.18 a | 1.02 ± 0.76 a | 0.57 ± 0.33 a | 0.84 ± 0.83 a | 0.556 |
| A27 | Phenethyl acetate | 23.65 | 1.58 ± 0.88 a | 2.17 ± 0.34 a | 1.67 ± 0.67 a | 1.98 ± 0.68 a | 1.51 ± 0.81 a | 0.567 |
| A28 | Hexanoic acid | 24.26 | 3.49 ± 2.77 a | 5.04 ± 0.99 a | 3.82 ± 2.14 a | 4.80 ± 2.18 a | 3.50 ± 2.40 a | 0.709 |
| A29 | Geraniol | 24.42 | 3.52 ± 2.93 a | 5.69 ± 1.04 a | 4.81 ± 3.16 a | 4.88 ± 2.27 a | 2.73 ± 2.46 a | 0.413 |
| A30 | Ethyl dodecanoate | 24.57 | 4.29 ± 1.44 a | 6.49 ± 1.42 a | 4.21 ± 1.40 a | 4.80 ± 2.24 a | 3.89 ± 2.28 a | 0.229 |
| A31 | 2,2,4-trimethyl-1,3-pentanediol isobutyrate | 25.12 | 8.55 ± 6.20 a | 4.31 ± 1.13 a | 6.89 ± 4.86 a | 6.73 ± 3.58 a | 7.28 ± 5.24 a | 0.981 |
| A32 | Phenylethyl alcohol | 25.57 | 18.12 ± 11.11 a | 24.80 ± 3.47 a | 18.40 ± 8.35 a | 22.78 ± 7.28 a | 23.68 ± 11.54 a | 0.662 |
| A33 | Octanoic acid | 28.52 | 30.33 ± 25.29 a | 48.68 ± 10.53 a | 35.43 ± 21.99 a | 45.56 ± 20.88 a | 29.82 ± 24.35 a | 0.56 |
| 48 h | ||||||||
| Codes | Volatile organic compounds | RT | HF_HI | HF_LI | LF_HI | LF_LI | S | p value |
| A1 | Ethyl acetate | 2.43 | 18.67 ± 4.96 a | 14.77 ± 9.21 a | 18.69 ± 4.96 a | 17.26 ± 4.29 a | 18.71 ± 2.14 a | 0.663 |
| A2 | 1,1-diethoxyethane | 2.5 | 0.21 ± 0.13 b | 0.52 ± 0.36 ab | 0.74 ± 0.39 a | 0.71 ± 0.16 ab | 0.65 ± 0.22 ab | 0.05 |
| A3 | Ethanol | 3.08 | 1279.77 ± 522.72 a | 1016.36 ± 137.43 a | 1230.44 ± 163.86 a | 1254.08 ± 160.52 a | 1250.48 ± 210.65 a | 0.537 |
| A4 | 2,6-dimethyl-2-trans-6-octadiene | 6 | 0.37 ± 0.03 ab | 0.29 ± 0.11 b | 0.39 ± 0.09 ab | 0.41 ± 0.09 a | 0.39 ± 0.06 ab | 0.042 |
| A5 | 2-methyl-1-propanol | 6.12 | 14.26 ± 4.47 a | 14.59 ± 5.67 a | 14.42 ± 5.33 a | 13.56 ± 3.69 a | 17.40 ± 2.56 a | 0.241 |
| A6 | Isoamyl acetate | 6.76 | 49.13 ± 9.47 a | 37.21 ± 24.64 b | 48.89 ± 11.77 a | 48.77 ± 12.11 a | 48.78 ± 5.41 a | 0.051 |
| A7 | 2-methylbutyl isobutyrate | 8.68 | 0.76 ± 0.73 a | 0.66 ± 0.78 a | 0.48 ± 0.34 a | 0.82 ± 0.37 a | 0.58 ± 0.76 a | 0.896 |
| A8 | 2-methyl-1-butanol | 9.18 | 81.53 ± 18.78 a | 73.98 ± 25.60 a | 75.84 ± 22.11 a | 73.33 ± 15.24 a | 88.07 ± 10.13 a | 0.26 |
| A9 | 3-methyl-1-butanol | 9.23 | 159.77 ± 35.26 a | 149.23 ± 51.22 a | 153.71 ± 44.77 a | 148.94 ± 31.24 a | 168.93 ± 16.98 a | 0.56 |
| A10 | Ethyl hexanoate | 9.84 | 26.79 ± 3.76 a | 19.79 ± 13.59 a | 27.32 ± 10.16 a | 28.12 ± 7.76 a | 26.87 ± 4.74 a | 0.447 |
| A11 | Methyl 4-methylenehexanoate | 12.42 | 0.76 ± 0.20 a | 0.59 ± 0.56 a | 0.83 ± 0.44 a | 0.88 ± 0.44 a | 0.73 ± 0.26 a | 0.64 |
| A12 | Ethyl heptanoate | 12.53 | 0.90 ± 0.40 a | 0.57 ± 0.69 a | 1.05 ± 0.57 a | 1.08 ± 0.50 a | 0.96 ± 0.25 a | 0.434 |
| A13 | 1-hexanol | 12.95 | 0.60 ± 0.15 a | 0.49 ± 0.24 a | 0.54 ± 0.19 a | 0.52 ± 0.16 a | 0.58 ± 0.08 a | 0.269 |
| A14 | Ethyl octanoate | 15.34 | 97.17 ± 36.89 a | 93.38 ± 55.96 a | 113.34 ± 59.86 a | 120.41 ± 52.76 a | 107.98 ± 17.94 a | 0.785 |
| A15 | 1-heptanol | 15.85 | 0.63 ± 0.29 ab | 0.42 ± 0.30 b | 0.58 ± 0.31 ab | 0.57 ± 0.25 ab | 0.86 ± 0.33 a | 0.052 |
| A16 | Ethyl-1-hexanol | 16.99 | 1.03 ± 0.26 a | 1.44 ± 1.41 a | 1.13 ± 0.33 a | 1.96 ± 2.73 a | 0.99 ± 0.23 a | 0.7 |
| A17 | 1,2-dihydrolinalool | 17.55 | 6.20 ± 1.66 a | 5.08 ± 2.01 a | 5.96 ± 1.43 a | 5.94 ± 1.12 a | 5.81 ± 1.16 a | 0.676 |
| A18 | Linalool | 17.85 | 33.14 ± 2.69 a | 30.48 ± 12.34 a | 36.21 ± 10.16 a | 36.21 ± 6.51 a | 36.05 ± 3.62 a | 0.584 |
| A19 | 1-octanol | 18.1 | 2.80 ± 0.56 a | 2.31 ± 0.89 a | 2.83 ± 0.90 a | 2.85 ± 0.71 a | 2.97 ± 0.41 a | 0.41 |
| A20 | 2-methylpropanoic acid | 18.16 | 1.56 ± 0.33 a | 1.66 ± 0.69 a | 1.58 ± 0.52 a | 1.61 ± 0.36 a | 1.81 ± 0.26 a | 0.655 |
| A21 | Ethyl decanoate | 20.14 | 32.98 ± 15.17 a | 33.90 ± 17.01 a | 42.59 ± 23.22 a | 47.79 ± 23.41 a | 33.11 ± 10.85 a | 0.475 |
| A22 | 3-methylbutyl octanoate | 20.59 | 5.26 ± 2.78 a | 4.76 ± 2.82 a | 5.75 ± 3.49 a | 6.45 ± 3.04 a | 5.74 ± 0.97 a | 0.851 |
| A23 | Unknown terpene alcohol | 21.18 | 1.80 ± 0.21 a | 1.51 ± 0.84 a | 1.73 ± 0.82 a | 2.02 ± 0.77 a | 1.96 ± 0.24 a | 0.475 |
| A24 | Ethyl 9-decenoate | 21.23 | 0.50 ± 0.20 ab | 0.38 ± 0.46 b | 1.13 ± 0.74 ab | 1.24 ± 0.69 a | 0.81 ± 0.25 ab | 0.025 |
| A25 | Citronellol | 22.76 | 4.43 ± 0.54 a | 3.76 ± 1.43 a | 4.18 ± 1.16 a | 4.34 ± 0.82 a | 4.86 ± 0.72 a | 0.195 |
| A26 | 2,5-dimethyl-benzaldehyde | 23.51 | 1.05 ± 0.15 a | 0.93 ± 0.33 a | 1.27 ± 0.79 a | 1.13 ± 0.81 a | 0.94 ± 0.13 a | 0.616 |
| A27 | Phenethyl acetate | 23.65 | 11.25 ± 1.61 a | 10.30 ± 4.22 a | 9.90 ± 3.55 a | 10.68 ± 2.56 a | 12.43 ± 1.20 a | 0.326 |
| A28 | Hexanoic acid | 24.26 | 6.53 ± 1.62 a | 6.28 ± 3.04 a | 5.79 ± 2.41 a | 6.48 ± 2.17 a | 6.41 ± 0.86 a | 0.931 |
| A29 | Geraniol | 24.42 | 4.65 ± 0.70 a | 4.08 ± 2.16 a | 4.46 ± 1.98 a | 4.57 ± 1.42 a | 5.80 ± 0.77 a | 0.234 |
| A30 | Ethyl dodecanoate | 24.57 | 3.66 ± 1.83 a | 5.31 ± 2.56 a | 6.29 ± 3.22 a | 7.62 ± 3.78 a | 5.32 ± 2.49 a | 0.238 |
| A31 | 2,2,4-trimethyl-1,3-pentanediol isobutyrate | 25.12 | 6.36 ± 1.79 a | 3.38 ± 1.74 a | 7.98 ± 10.28 a | 5.34 ± 2.78 a | 4.00 ± 2.00 a | 0.506 |
| A32 | Phenylethyl alcohol | 25.57 | 132.81 ± 26.08 ab | 111.86 ± 36.43 b | 109.21 ± 36.29 b | 114.91 ± 29.59 b | 165.52 ± 37.94 a | 0.015 |
| A33 | Octanoic acid | 28.52 | 61.51 ± 11.90 a | 49.54 ± 23.96 a | 52.63 ± 22.05 a | 57.76 ± 18.91 a | 53.54 ± 4.73 a | 0.605 |
| 72 h | ||||||||
| Codes | Volatile organic compounds | RT | HF_HI | HF_LI | LF_HI | LF_LI | S | p value |
| A1 | Ethyl acetate | 2.43 | 24.44 ± 2.85 a | 21.92 ± 6.78 a | 22.71 ± 3.94 a | 21.79 ± 5.74 a | 22.73 ± 3.16 a | 0.707 |
| A2 | 1,1-diethoxyethane | 2.5 | 0.92 ± 0.22 a | 0.50 ± 0.18 a | 0.51 ± 0.24 a | 0.59 ± 0.15 a | 0.76 ± 0.29 a | 0.064 |
| A3 | Ethanol | 3.08 | 740.27 ± 247.94 a | 1310.97 ± 209.72 a | 1310.10 ± 463.47 a | 1300.82 ± 372.64 a | 1135.00 ± 240.16 a | 0.099 |
| A4 | 2,6-dimethyl-2-trans-6-octadiene | 6 | 0.36 ± 0.07 a | 0.31 ± 0.11 a | 0.39 ± 0.07 a | 0.37 ± 0.13 a | 0.37 ± 0.07 a | 0.381 |
| A5 | 2-methyl-1-propanol | 6.12 | 19.80 ± 2.75 a | 15.15 ± 5.50 b | 17.65 ± 4.23 ab | 15.12 ± 5.04 b | 19.58 ± 3.74 a | 0.006 |
| A6 | Isoamyl acetate | 6.76 | 58.05 ± 8.22 a | 56.42 ± 17.24 a | 56.68 ± 10.06 a | 58.03 ± 15.25 a | 53.84 ± 5.66 a | 0.898 |
| A7 | 2-methylbutyl isobutyrate | 8.68 | 0.22 ± 0.27 a | 0.56 ± 0.87 a | 0.43 ± 0.50 a | 0.81 ± 0.72 a | 0.30 ± 0.32 a | 0.211 |
| A8 | 2-methyl-1-butanol | 9.18 | 93.53 ± 10.61 a | 75.63 ± 26.06 a | 91.52 ± 17.30 a | 76.66 ± 22.75 a | 94.33 ± 13.22 a | 0.109 |
| A9 | 3-methyl-1-butanol | 9.23 | 167.47 ± 18.81 a | 138.82 ± 47.60 ab | 168.48 ± 30.92 a | 143.39 ± 42.43 ab | 169.53 ± 23.21 a | 0.044 |
| A10 | Ethyl hexanoate | 9.84 | 33.64 ± 7.39 a | 26.96 ± 11.22 a | 32.22 ± 5.39 a | 32.28 ± 12.08 a | 30.99 ± 4.55 a | 0.417 |
| A11 | Methyl 4-methylenehexanoate | 12.42 | 0.78 ± 0.30 a | 0.56 ± 0.39 a | 0.66 ± 0.17 a | 0.68 ± 0.33 a | 0.62 ± 0.19 a | 0.29 |
| A12 | Ethyl heptanoate | 12.53 | 1.48 ± 0.34 a | 0.79 ± 0.52 b | 1.02 ± 0.28 ab | 0.95 ± 0.65 ab | 1.34 ± 0.35 ab | 0.008 |
| A13 | 1-hexanol | 12.95 | 0.58 ± 0.10 ab | 0.42 ± 0.21 b | 0.58 ± 0.15 a | 0.46 ± 0.20 ab | 0.56 ± 0.12 ab | 0.013 |
| A14 | Ethyl octanoate | 15.34 | 146.18 ± 30.36 a | 113.89 ± 52.05 a | 114.68 ± 21.34 a | 117.91 ± 58.06 a | 121.55 ± 18.09 a | 0.375 |
| A15 | 1-heptanol | 15.85 | 1.68 ± 0.71 ab | 0.86 ± 0.39 b | 1.28 ± 0.52 ab | 1.17 ± 0.41 ab | 2.29 ± 1.29 a | 0.03 |
| A16 | Ethyl-1-hexanol | 16.99 | 0.82 ± 0.11 a | 0.82 ± 0.20 a | 0.68 ± 0.13 a | 1.13 ± 1.38 a | 0.62 ± 0.13 a | 0.629 |
| A17 | 1,2-dihydrolinalool | 17.55 | 7.04 ± 1.17 a | 4.87 ± 1.96 b | 6.16 ± 1.81 ab | 5.52 ± 1.96 ab | 6.23 ± 0.72 ab | 0.017 |
| A18 | Linalool | 17.85 | 36.63 ± 2.51 a | 26.68 ± 10.12 a | 34.07 ± 3.46 a | 31.87 ± 9.26 a | 33.77 ± 3.06 a | 0.126 |
| A19 | 1-octanol | 18.1 | 4.04 ± 0.50 a | 2.98 ± 1.09 b | 3.49 ± 0.49 ab | 3.25 ± 1.03 ab | 3.55 ± 0.36 ab | 0.05 |
| A20 | 2-methylpropanoic acid | 18.16 | 1.82 ± 0.20 a | 1.41 ± 0.63 a | 1.72 ± 0.29 a | 1.52 ± 0.50 a | 1.80 ± 0.25 a | 0.099 |
| A21 | Ethyl decanoate | 20.14 | 28.83 ± 4.75 a | 25.07 ± 12.31 a | 24.06 ± 2.88 a | 21.54 ± 10.56 a | 23.90 ± 2.69 a | 0.549 |
| A22 | 3-methylbutyl octanoate | 20.59 | 8.43 ± 1.93 a | 6.04 ± 3.04 a | 6.41 ± 1.80 a | 6.16 ± 3.34 a | 6.71 ± 0.96 a | 0.269 |
| A23 | Unknown terpene alcohol | 21.18 | 1.88 ± 0.16 a | 1.28 ± 0.79 a | 1.69 ± 0.19 a | 1.48 ± 0.71 a | 1.65±0.29 a | 0.269 |
| A24 | Ethyl 9-decenoate | 21.23 | 1.31 ± 0.33 a | 0.81 ± 0.42 a | 0.63 ± 0.28 a | 0.74 ± 0.51 a | 0.98 ± 0.55 a | 0.064 |
| A25 | Citronellol | 22.76 | 6.14 ± 0.70 a | 4.36 ± 1.64 b | 5.62 ± 0.62 ab | 5.04 ± 1.48 ab | 5.92 ± 0.97 ab | 0.022 |
| A26 | 3,5-dimethyl-benzaldehyde | 23.51 | 1.29 ± 0.14 a | 1.30 ± 0.19 a | 1.21 ± 0.21 a | 1.18 ± 0.20 a | 1.18 ± 0.16 a | 0.628 |
| A27 | Phenethyl acetate | 23.65 | 16.43 ± 1.22 a | 12.71 ± 5.70 a | 15.20 ± 1.33 a | 14.44 ± 4.80 a | 16.26 ± 1.32 a | 0.275 |
| A28 | Hexanoic acid | 24.26 | 7.18 ± 0.76 a | 5.79 ± 2.99 a | 7.29 ± 1.44 a | 6.85 ± 2.92 a | 6.82 ± 0.59 a | 0.612 |
| A29 | Geraniol | 24.42 | 5.57 ± 0.41 a | 3.86 ± 2.05 a | 5.47 ± 0.82 a | 4.55 ± 2.08 a | 5.54 ± 0.58 a | 0.128 |
| A30 | Ethyl dodecanoate | 24.57 | 1.64 ± 0.51 ab | 2.80 ± 1.24 a | 2.30 ± 0.27 ab | 1.84 ± 0.91 ab | 1.42 ± 0.43 b | 0.047 |
| A31 | 2,2,4-trimethyl-1,3-pentanediol isobutyrate | 25.12 | 2.44 ± 1.09 a | 4.84 ± 3.19 a | 3.17 ± 1.70 a | 4.85 ± 6.10 a | 1.48 ± 0.61 a | 0.333 |
| A32 | Phenylethyl alcohol | 25.57 | 182.84 ± 28.54 ab | 122.76 ± 47.69 c | 168.93 ± 24.59 ab | 145.12 ± 45.33 bc | 192.80 ± 39.75 a | 0.001 |
| A33 | Octanoic acid | 28.52 | 49.92 ± 5.05 a | 41.98 ± 22.27 a | 54.63 ± 9.25 a | 50.18 ± 21.84 a | 49.70 ± 3.98 a | 0.601 |
| 96 h | ||||||||
| Codes | Volatile organic compounds | RT | HF_HI | HF_LI | LF_HI | LF_LI | S | p value |
| A1 | Ethyl acetate | 2.43 | 27.35 ± 5.45 a | 27.18 ± 6.37 a | 25.99 ± 7.45 a | 24.47 ± 4.75 a | 23.16 ± 2.76 a | 0.299 |
| A2 | 1,1-diethoxyethane | 2.5 | 1.36 ± 0.60 a | 1.20 ± 0.39 a | 1.26 ± 0.20 a | 1.26 ± 0.64 a | 1.21 ± 0.36 a | 0.987 |
| A3 | Ethanol | 3.08 | 1287.99 ± 181.22 a | 1232.84 ± 284.62 a | 1175.28 ± 134.38 a | 1427.62 ± 193.39 a | 1130.10 ± 84.85 a | 0.083 |
| A4 | 2,6-dimethyl-2-trans-6-octadiene | 6 | 0.35 ± 0.04 a | 0.33 ± 0.07 a | 0.35 ± 0.03 a | 0.35 ± 0.06 a | 0.32 ± 0.05 a | 0.59 |
| A5 | 2-methyl-1-propanol | 6.12 | 19.61 ± 3.97 a | 18.42 ± 4.44 a | 20.02 ± 2.65 a | 17.07 ± 3.28 a | 19.23 ± 4.14 a | 0.084 |
| A6 | Isoamyl acetate | 6.76 | 59.13 ± 9.30 a | 61.80 ± 14.66 a | 54.61 ± 23.24 a | 58.80 ± 10.08 a | 47.60 ± 8.89 a | 0.253 |
| A7 | 2-methylbutyl isobutyrate | 8.68 | 0.23 ± 0.27 a | 0.33 ± 0.25 a | 0.18 ± 0.30 a | 0.70 ± 0.56 a | 0.31 ± 0.32 a | 0.103 |
| A8 | 2-methyl-1-butanol | 9.18 | 95.18 ± 13.65 a | 91.15 ± 16.82 a | 95.18 ± 10.22 a | 85.66 ± 11.81 a | 91.81 ± 14.40 a | 0.052 |
| A9 | 3-methyl-1-butanol | 9.23 | 169.12 ± 24.70 a | 164.66 ± 30.28 a | 171.66 ± 18.47 a | 157.72 ± 19.67 a | 163.56 ± 25.10 a | 0.16 |
| A10 | Ethyl hexanoate | 9.84 | 35.72 ± 11.35 a | 33.42 ± 6.90 a | 30.61 ± 13.81 a | 35.89 ± 6.08 a | 28.28 ± 5.05 a | 0.29 |
| A11 | Methyl 4-methylenehexanoate | 12.42 | 0.65 ± 0.20 ab | 0.55 ± 0.19 ab | 0.55 ± 0.27 ab | 0.66 ± 0.18 a | 0.45 ± 0.16 b | 0.039 |
| A12 | Ethyl heptanoate | 12.53 | 1.63 ± 0.46 a | 1.29 ± 0.27 a | 1.24 ± 0.52 a | 1.34 ± 0.35 a | 1.37 ± 0.36 a | 0.329 |
| A13 | 1-hexanol | 12.95 | 0.65 ± 0.10 a | 0.59 ± 0.13 ab | 0.63 ± 0.12 ab | 0.54 ± 0.09 b | 0.59 ± 0.13 ab | 0.019 |
| A14 | Ethyl octanoate | 15.34 | 150.21 ± 42.30 a | 125.66 ± 20.08 a | 135.81 ± 51.52 a | 140.33 ± 22.87 a | 118.90 ± 14.46 a | 0.145 |
| A15 | 1-heptanol | 15.85 | 1.78 ± 0.65 a | 1.72 ± 0.29 a | 2.15 ± 0.85 a | 2.22 ± 0.72 a | 2.72 ± 1.42 a | 0.482 |
| A16 | Ethyl-1-hexanol | 16.99 | 0.63 ± 0.21 a | 0.54 ± 0.19 a | 0.59 ± 0.06 a | 0.54 ± 0.08 a | 0.60 ± 0.12 a | 0.597 |
| A17 | 1,2-dihydrolinalool | 17.55 | 6.95 ± 0.48 a | 6.18 ± 1.08 a | 7.15 ± 0.55 a | 6.14 ± 1.24 a | 6.12 ± 0.81 a | 0.159 |
| A18 | Linalool | 17.85 | 34.92 ± 2.29 a | 30.26 ± 3.02 a | 34.16 ± 3.19 a | 34.07 ± 3.37 a | 30.52 ± 3.56 a | 0.14 |
| A19 | 1-octanol | 18.1 | 4.10 ± 0.52 a | 3.48 ± 0.39 b | 3.91 ± 0.61 ab | 3.73 ± 0.34 ab | 3.52 ± 0.33 b | 0.002 |
| A20 | 2-methylpropanoic acid | 18.16 | 1.79 ± 0.33 a | 1.67 ± 0.29 a | 1.78 ± 0.20 a | 1.75 ± 0.17 a | 1.78 ± 0.23 a | 0.548 |
| A21 | Ethyl decanoate | 20.14 | 25.38 ± 3.70 a | 22.64 ± 6.17 a | 30.36 ± 9.95 a | 25.92 ± 3.55 a | 25.42 ± 6.36 a | 0.256 |
| A22 | 3-methylbutyl octanoate | 20.59 | 8.57 ± 2.38 a | 6.99± 0.71 a | 7.77 ± 2.45 a | 7.88 ± 1.62 a | 6.80 ± 1.05 a | 0.128 |
| A23 | Unknown terpene alcohol | 21.18 | 1.51 ± 0.16 a | 1.46 ± 0.15 a | 1.68 ± 0.18 a | 1.74 ± 0.21 a | 1.63 ± 0.26 a | 0.181 |
| A24 | Ethyl 9-decenoate | 21.23 | 1.71 ± 0.96 a | 1.12 ± 0.25 a | 1.41 ± 0.85 a | 1.79 ± 1.02 a | 2.19 ± 1.32 a | 0.565 |
| A25 | Citronellol | 22.76 | 6.21 ± 0.56 a | 5.51 ± 0.54 a | 6.37 ± 0.30 a | 6.21 ± 0.82 a | 6.19 ± 1.16 a | 0.49 |
| A26 | 3,5-dimethyl-benzaldehyde | 23.51 | 1.59 ± 0.50 a | 1.22 ± 0.20 ab | 1.24 ± 0.17 ab | 1.19 ± 0.13 b | 1.20 ± 0.13 ab | 0.035 |
| A27 | Phenethyl acetate | 23.65 | 16.21 ± 1.78 a | 15.77 ± 1.69 a | 16.90 ± 0.96 a | 16.47 ± 0.73 a | 15.52 ±1.40 a | 0.274 |
| A28 | Hexanoic acid | 24.26 | 7.59 ± 1.30 ab | 7.45 ± 1.33 ab | 8.17 ± 0.84 a | 7.90 ± 0.81 ab | 7.02 ± 0.91 b | 0.054 |
| A29 | Geraniol | 24.42 | 4.80 ± 0.40 a | 4.25 ± 0.45 a | 4.95 ± 0.49 a | 4.75 ± 0.63 a | 4.61 ± 0.75 a | 0.204 |
| A30 | Ethyl dodecanoate | 24.57 | 0.95 ± 0.32 a | 1.24 ± 0.35 a | 0.97 ± 0.36 a | 1.24 ± 0.20 a | 1.13 ± 0.23 a | 0.408 |
| A31 | 2,2,4-trimethyl-1,3-pentanediol isobutyrate | 25.12 | 2.48 ± 1.00 a | 3.28 ± 0.99 a | 1.71 ± 1.64 a | 1.40 ± 0.60 a | 1.89 ± 0.83 a | 0.071 |
| A32 | Phenylethyl alcohol | 25.57 | 171.23 ± 18.80 a | 159.30 ± 29.03 a | 169.27 ± 14.90 a | 166.47 ± 24.08 a | 195.27 ± 44.58 a | 0.229 |
| A33 | Octanoic acid | 28.52 | 50.40 ± 4.93 b | 51.39 ± 8.83 ab | 57.19 ± 6.04 a | 54.35 ± 4.88 ab | 51.83 ± 8.47 ab | 0.024 |
| 120 h | ||||||||
| Codes | Volatile organic compounds | RT | HF_HI | HF_LI | LF_HI | LF_LI | S | p value |
| A1 | Ethyl acetate | 2.43 | 25.37 ± 5.43 a | 25.89 ± 3.41 a | 25.07 ± 4.65 a | 26.23 ± 5.15 a | 26.41 ± 5.08 a | 0.976 |
| A2 | 1,1-diethoxyethane | 2.5 | 1.92 ± 1.14 a | 2.01 ± 0.98 a | 2.58 ± 1.27 a | 1.35 ± 0.84 a | 3.05 ± 1.36 a | 0.226 |
| A3 | Ethanol | 3.08 | 1191.93 ± 178.7 a | 1289.36 ± 183.16 a | 1342.30 ± 191.47 a | 1185.40 ± 282.46 a | 665.06 ± 251.01 b | 0.001 |
| A4 | 2,6-dimethyl-2-trans-6-octadiene | 6 | 0.31 ± 0.06 a | 0.30 ± 0.03 a | 0.30 ± 0.04 a | 0.34 ± 0.07 a | 0.32 ± 0.05 a | 0.44 |
| A5 | 2-methyl-1-propanol | 6.12 | 17.92 ± 3.33 a | 18.75 ± 2.51 a | 18.21 ± 3.91 a | 16.87 ± 2.30 a | 21.51 ± 5.08 a | 0.181 |
| A6 | Isoamyl acetate | 6.76 | 53.63 ± 11.56 a | 54.81 ± 8.44 a | 52.12 ± 8.36 a | 56.01 ± 10.71 a | 49.07 ± 6.81 a | 0.499 |
| A7 | 2-methylbutyl isobutyrate | 8.68 | 0.41 ± 0.35 a | 0.35 ± 0.58 a | 0.22 ± 0.16 a | 0.29 ± 0.32 a | 0.14 ± 0.09 a | 0.637 |
| A8 | 2-methyl-1-butanol | 9.18 | 89.24 ± 11.73 a | 89.29 ± 7.89 a | 91.38 ± 13.11 a | 84.54 ± 9.30 a | 97.99 ± 14.60 a | 0.313 |
| A9 | 3-methyl-1-butanol | 9.23 | 159.86 ± 22.09 a | 159.90 ± 13.89 a | 161.60 ± 22.94 a | 152.38 ± 15.88 a | 172.08 ± 25.11 a | 0.446 |
| A10 | Ethyl hexanoate | 9.84 | 33.04 ± 9.26 a | 30.88 ± 7.32 a | 33.92 ± 6.72 a | 30.06 ± 5.41 a | 31.96 ± 7.07 a | 0.684 |
| A11 | Methyl 4-methylenehexanoate | 12.42 | 0.55 ± 0.19 a | 0.49 ± 0.19 a | 0.43 ± 0.14 a | 0.50 ± 0.12 a | 0.46 ± 0.16 a | 0.295 |
| A12 | Ethyl heptanoate | 12.53 | 1.50 ± 0.41 a | 1.30 ± 0.57 a | 1.61 ± 0.45 a | 1.31 ± 0.27 a | 2.15 ± 0.70 a | 0.078 |
| A13 | 1-hexanol | 12.95 | 0.59 ± 0.12 a | 0.59 ± 0.06 a | 0.55 ± 0.11 a | 0.58 ± 0.09 a | 0.63 ± 0.10 a | 0.611 |
| A14 | Ethyl octanoate | 15.34 | 140.38 ± 32.33 a | 138.81 ± 24.08 a | 139.58 ± 19.90 a | 124.72 ± 22.07 a | 151.92 ± 41.78 a | 0.385 |
| A15 | 1-heptanol | 15.85 | 2.00 ± 0.62 a | 2.25 ± 0.21 a | 2.44 ± 1.01 a | 2.31 ± 0.69 a | 3.61 ± 1.34 a | 0.08 |
| A16 | Ethyl-1-hexanol | 16.99 | 0.60 ± 0.09 ab | 0.60 ± 0.20 ab | 0.50 ± 0.12 b | 0.50 ± 0.08 b | 0.75 ± 0.09 a | 0.026 |
| A17 | 1,2-dihydrolinalool | 17.55 | 6.67 ± 1.11 a | 5.73 ± 0.79 a | 6.57 ± 1.88 a | 6.46 ± 1.19 a | 7.25 ± 1.62 a | 0.506 |
| A18 | Linalool | 17.85 | 31.38 ± 2.61 a | 30.39 ± 1.35 a | 29.42 ± 1.34 a | 28.93 ± 4.13 a | 32.28 ± 3.68 a | 0.302 |
| A19 | 1-octanol | 18.1 | 3.90 ± 0.47 a | 3.60 ± 0.50 a | 3.66 ± 0.34 a | 3.47 ± 0.49 a | 4.05 ± 0.69 a | 0.225 |
| A20 | 2-methylpropanoic acid | 18.16 | 1.71 ± 0.31 ab | 1.73 ± 0.16 ab | 1.68 ± 0.24 ab | 1.54 ± 0.13 b | 1.99 ± 0.33 a | 0.04 |
| A21 | Ethyl decanoate | 20.14 | 29.29 ± 5.97 a | 31.18 ± 10.35 a | 33.26 ± 11.81 a | 28.10 ± 3.65 a | 39.54 ± 14.14 a | 0.402 |
| A22 | 3-methylbutyl octanoate | 20.59 | 8.43 ± 2.04 a | 8.34 ± 1.80 a | 8.58 ± 1.33 a | 7.09 ± 1.65 a | 9.91 ± 3.13 a | 0.203 |
| A23 | Unknown terpene alcohol | 21.18 | 1.53 ± 0.18 a | 1.58 ± 0.11 a | 1.45 ± 0.06 a | 1.35 ± 0.26 a | 1.60 ± 0.24 a | 0.211 |
| A24 | Ethyl 9-decenoate | 21.23 | 3.07 ± 1.56 a | 3.27 ± 0.69 a | 3.20 ± 1.59 a | 2.32 ± 1.23 a | 4.85 ± 2.39 a | 0.217 |
| A25 | Citronellol | 22.76 | 6.72 ± 0.66 a | 6.40 ± 0.34 a | 6.28 ± 0.60 a | 6.08 ± 0.76 a | 7.41 ± 1.25 a | 0.066 |
| A26 | 3,5-dimethyl-benzaldehyde | 23.51 | 1.47 ± 0.20 a | 1.42 ± 0.22 a | 1.38 ± 0.27 a | 1.20 ± 0.27 a | 1.49 ± 0.27 a | 0.093 |
| A27 | Phenethyl acetate | 23.65 | 15.31 ± 1.80 a | 15.28 ± 0.84 a | 14.46 ± 1.35 a | 13.87 ± 2.07 a | 15.57 ± 1.51 a | 0.313 |
| A28 | Hexanoic acid | 24.26 | 7.83 ± 1.37 a | 7.94 ± 1.09 a | 7.63 ± 1.38 a | 7.34 ± 1.58 a | 7.49 ± 0.69 a | 0.859 |
| A29 | Geraniol | 24.42 | 4.28 ± 0.34 a | 4.20 ± 0.23 a | 3.72 ± 0.54 a | 3.81 ± 0.96 a | 4.34 ± 0.47 a | 0.185 |
| A30 | Ethyl dodecanoate | 24.57 | 0.72 ± 0.18 c | 1.08 ± 0.24 ab | 0.76 ± 0.06 c | 1.32 ± 0.20 a | 0.86 ± 0.19 bc | 0.001 |
| A31 | 2,2,4-trimethyl-1,3-pentanediol isobutyrate | 25.12 | 3.57 ± 1.50 a | 3.84 ± 2.62 a | 1.87 ± 1.34 a | 4.62 ± 2.24 a | 4.21 ± 1.59 a | 0.212 |
| A32 | Phenylethyl alcohol | 25.57 | 181.37 ± 23.04 ab | 173.29 ± 18.69 ab | 167.33 ± 21.83 ab | 148.65 ± 23.78 b | 211.75 ± 38.30 a | 0.021 |
| A33 | Octanoic acid | 28.52 | 57.01 ± 5.19 a | 58.15 ± 12.53 a | 54.35 ± 8.74 a | 56.70 ± 8.33 a | 50.18 ± 5.69 a | 0.388 |
| 144 h | ||||||||
| Codes | Volatile organic compounds | RT | HF_HI | HF_LI | LF_HI | LF_LI | S | p values |
| A1 | Ethyl acetate | 2.43 | 25.91 ± 3.55 a | 29.44 ± 5.98 a | 26.16 ± 4.57 a | 28.07 ± 3.04 a | 25.83 ± 3.61 a | 0.062 |
| A2 | 1,1-diethoxyethane | 2.5 | 4.05 ± 2.24 a | 4.43 ± 1.18 a | 3.44 ± 0.82 a | 3.43 ± 2.06 a | 4.39 ± 0.94 a | 0.714 |
| A3 | Ethanol | 3.08 | 1306.27 ± 384.06 a | 1305.65 ± 295.92 a | 1037.67 ± 270.81 a | 941.88 ± 304.17 a | 1300.48 ± 261.20 a | 0.11 |
| A4 | 2,6-dimethyl-2-trans-6-octadiene | 6 | 0.33 ± 0.05 a | 0.30 ± 0.05 a | 0.28 ± 0.03 a | 0.31 ± 0.04 a | 0.33 ± 0.08 a | 0.302 |
| A5 | 2-methyl-1-propanol | 6.12 | 18.62 ± 3.50 a | 19.86 ± 4.11 a | 18.39 ± 3.66 a | 19.38 ± 2.64 a | 20.74 ± 4.06 a | 0.604 |
| A6 | Isoamyl acetate | 6.76 | 51.17 ± 8.68 a | 57.09 ± 11.37 a | 52.07 ± 7.45 a | 55.88 ± 8.26 a | 48.42 ± 8.30 a | 0.083 |
| A7 | 2-methylbutyl isobutyrate | 8.68 | 0.30 ± 0.33 a | 0.16 ± 0.14 a | 0.19 ± 0.29 a | 0.24 ± 0.30 a | 0.24 ± 0.31 a | 0.888 |
| A8 | 2-methyl-1-butanol | 9.18 | 90.63 ± 12.19 a | 94.94 ± 15.00 a | 90.22 ± 13.66 a | 92.78 ± 10.19 a | 94.93 ± 12.49 a | 0.816 |
| A9 | 3-methyl-1-butanol | 9.23 | 161.54 ± 21.74 a | 168.26 ± 25.95 a | 161.47 ± 23.41 a | 166.86 ± 20.09 a | 167.97 ± 22.07 a | 0.801 |
| A10 | Ethyl hexanoate | 9.84 | 33.54 ± 8.04 abc | 35.90 ± 8.77 ab | 30.02 ± 6.24 bc | 38.05 ± 9.47 a | 28.20 ± 5.75 c | 0.001 |
| A11 | Methyl 4-methylenehexanoate | 12.42 | 0.51 ± 0.17 a | 0.55 ± 0.24 a | 0.44 ± 0.12 a | 0.56 ± 0.15 a | 0.47 ± 0.21 a | 0.173 |
| A12 | Ethyl heptanoate | 12.53 | 1.70 ± 0.35 a | 1.77 ± 0.52 a | 1.40 ± 0.33 a | 1.98 ± 0.29 a | 1.83 ± 0.45 a | 0.106 |
| A13 | 1-hexanol | 12.95 | 0.60 ± 0.10 a | 0.63 ± 0.14 a | 0.62 ± 0.12 a | 0.61 ± 0.10 a | 0.63 ± 0.09 a | 0.912 |
| A14 | Ethyl octanoate | 15.34 | 147.42 ± 25.51 abc | 154.11 ± 44.10 ab | 122.17 ± 15.91 c | 161.12 ± 27.16 a | 129.03 ± 22.47 bc | 0.004 |
| A15 | 1-heptanol | 15.85 | 2.14 ± 0.70 a | 2.49 ± 0.36 a | 2.54 ± 0.93 a | 2.74 ± 0.70 a | 3.75 ± 1.33 a | 0.093 |
| A16 | Ethyl-1-hexanol | 16.99 | 0.65 ± 0.10 a | 0.70 ± 0.15 a | 0.68 ± 0.11 a | 0.62 ± 0.16 a | 0.70 ± 0.07 a | 0.626 |
| A17 | 1,2-dihydrolinalool | 17.55 | 6.48 ± 0.72 a | 6.65 ± 1.00 a | 6.40 ± 0.66 a | 6.81 ± 0.39 a | 6.80 ± 0.70 a | 0.765 |
| A18 | Linalool | 17.85 | 31.91 ± 2.22 a | 32.78± 4.15 a | 30.28 ± 2.08 a | 33.16 ± 1.76 a | 34.04 ± 3.31 a | 0.219 |
| A19 | 1-octanol | 18.1 | 3.99 ± 0.22 ab | 3.96 ± 0.58 ab | 3.54 ± 0.30 b | 4.03 ± 0.33 a | 3.76 ± 0.36 ab | 0.036 |
| A20 | 2-methylpropanoic acid | 18.16 | 1.72 ± 0.20 a | 1.84 ± 0.29 a | 1.65 ± 0.19 a | 1.81 ± 0.27 a | 1.88 ± 0.31 a | 0.188 |
| A21 | Ethyl decanoate | 20.14 | 27.49 ± 6.43 a | 28.11 ± 5.31 a | 26.12 ± 6.61 a | 29.91 ± 4.28 a | 31.56 ± 10.96 a | 0.764 |
| A22 | 3-methylbutyl octanoate | 20.59 | 9.03 ± 1.45 ab | 9.13 ± 2.27 ab | 7.23 ± 0.73 b | 9.89 ± 1.97 a | 7.80 ± 1.26 b | 0.006 |
| A23 | Unknown terpene alcohol | 21.18 | 1.45 ± 0.17 a | 1.52 ± 0.13 a | 1.36 ± 0.07 a | 1.48 ± 0.10 a | 1.54 ± 0.15 a | 0.212 |
| A24 | Ethyl 9-decenoate | 21.23 | 4.19 ± 2.12 a | 4.51 ± 0.48 a | 3.67 ± 1.22 a | 4.65 ± 1.22 a | 5.63 ± 2.34 a | 0.438 |
| A25 | Citronellol | 22.76 | 7.12 ± 0.87 a | 7.25 ± 0.72 a | 6.87 ± 0.46 a | 7.03 ± 0.57 a | 8.15 ± 1.13 a | 0.072 |
| A26 | 3,5-dimethyl-benzaldehyde | 23.51 | 1.54 ± 0.15 b | 1.60 ± 0.15 b | 1.48 ± 0.32 b | 1.58 ± 0.19 b | 1.94 ± 0.29 a | 0.004 |
| A27 | Phenethyl acetate | 23.65 | 14.44 ± 0.60 ab | 15.84 ± 1.11 a | 13.98 ± 0.71 b | 14.86 ± 1.25 ab | 15.57 ± 1.27 ab | 0.030 |
| A28 | Hexanoic acid | 24.26 | 7.63 ± 0.83 a | 8.45 ± 1.14 a | 7.64 ± 0.79 a | 8.21 ± 1.44 a | 7.73 ± 0.92 a | 0.313 |
| A29 | Geraniol | 24.42 | 3.99 ± 0.50 a | 4.07 ± 0.41 a | 3.93 ± 0.44 a | 3.97 ± 0.35 a | 4.42 ± 0.34 a | 0.231 |
| A30 | Ethyl dodecanoate | 24.57 | 0.64 ± 0.09 b | 0.65 ± 0.16 b | 0.69 ± 0.10 ab | 0.93 ± 0.28 a | 0.53 ± 0.06 b | 0.002 |
| A31 | 2,2,4-trimethyl-1,3-pentanediol isobutyrate | 25.12 | 2.41 ±1.11 a | 2.29 ± 0.89 a | 2.52 ± 1.08 a | 3.15 ± 0.77 a | 3.19 ± 1.31 a | 0.476 |
| A32 | Phenylethyl alcohol | 25.57 | 177.95 ± 24.31 ab | 180.54 ± 23.76 ab | 168.47 ± 15.58 b | 162.71 ± 21.40 b | 215.52 ± 33.77 a | 0.015 |
| A33 | Octanoic acid | 28.52 | 55.70 ± 11.85 a | 54.33 ± 8.39 a | 53.21 ± 7.94 a | 52.42 ± 9.40 a | 51.41 ± 5.37 a | 0.840 |
References
- Verbelen, P.; Dekoninck, T.; Saerens, S.; Van Mulders, S.; Thevelein, J.; Delvaux, F. Impact of pitching rate on yeast fermentation performance and beer flavour. Appl. Microbiol. Biotechnol. 2009, 82, 155–167. [Google Scholar] [CrossRef] [PubMed]
- Richter, T.M.; Silcock, P.; Algarra, A.; Eyres, G.T.; Capozzi, V.; Bremer, P.J.; Biasioli, F. Evaluation of PTR-ToF-MS as a tool to track the behavior of hop-derived compounds during the fermentation of beer. Food. Res. Int. 2018, 111, 582–589. [Google Scholar] [CrossRef]
- Aggio, R.B.M.; Obolonkin, V.; Villas-Bôas, S.G. Sonic vibration affects the metabolism of yeast cells growing in liquid culture: A metabolomic study. Metabolomics 2012, 8, 670–678. [Google Scholar] [CrossRef]
- Schläfer, O.; Sievers, M.; Klotzbücher, H.; Onyeche, T.I. Improvement of biological activity by low energy ultrasound assisted bioreactors. Ultrasonics 2000, 38, 711–716. [Google Scholar] [CrossRef]
- Shah, A.; Raval, A.; Kothari, V. Sound stimulation can influence microbial growth and production of certain key metabolites. J. Microbiol. Biotechnol. Food Sci. 2016, 10, 330–334. [Google Scholar] [CrossRef] [Green Version]
- Harris, A.; Lindsay, M.A.; Ganley, A.R.D.; Jeffs, A.; Villas-Bôas, S.G. Sound stimulation can affect Saccharomyces cerevisiae growth and production of volatile metabolites in liquid medium. Metabolites 2021, 11, 605. [Google Scholar] [CrossRef]
- Chandra, T.S.; Lekha, V.S.; Krishna, T.M. Effect of music on growth and pigment production of Brevibacterium sp. Int. J. Pharm. Chem. Biol. Sci. 2018, 8, 157–160. [Google Scholar]
- Gu, S.; Zhang, Y.; Wu, Y. Effects of sound exposure on the growth and intracellular macromolecular synthesis of E. coli k-12. PeerJ 2016, 4, e1920. [Google Scholar] [CrossRef] [PubMed] [Green Version]
- Kisielewska, M. Ultrasonic stimulation of co-immobilized Saccharomyces cerevisiae cells and β-galactosidase enzyme for enhanced ethanol production from whey ultrafiltration permeate. Pol. J. Environ. Stud. 2012, 21, 387–393. [Google Scholar]
- Gu, S.; Yang, B.; Wu, Y.; Li, S.-C.; Liu, W.; Duan, X.-F.; Li, M.-W. Growth and physiological characteristics of E. coli in response to the exposure of sound field. Pak. J. Biol. Sci. 2013, 16, 969–975. [Google Scholar] [CrossRef] [PubMed]
- Kothari, V.; Patel, P.; Joshi, C.; Mishra, B.; Dubey, S.; Mehta, M. Sonic stimulation can affect production of quorum sensing regulated pigment in Serratia marcescens and Pseudomonas aeruginosa. Curr. Trends Biotechnol. Pharm. 2017, 11, 121–128. [Google Scholar]
- Shaobin, G.; Wu, Y.; Li, K.; Li, S.; Ma, S.; Wang, Q.; Wang, R. A pilot study of the effect of audible sound on the growth of Escherichia coli. Colloids Surf. B Biointerfaces 2010, 78, 367–371. [Google Scholar] [CrossRef]
- Ying, J.L.; Dayou, J.; Phin, C.K. Experimental investigation on the effects of audible sound to the growth of Escherichia coli. Mod. Appl. Sci. 2009, 3, 124–127. [Google Scholar] [CrossRef] [Green Version]
- Cai, W.; Dunford, N.T.; Wang, N.; Zhu, S.; He, H. Audible sound treatment of the microalgae Picochlorum oklahomensis for enhancing biomass productivity. Bioresour. Technol. 2016, 202, 226–230. [Google Scholar] [CrossRef] [PubMed]
- Jiang, S.; Rao, H.; Chen, Z.; Liang, M.; Li, L. Effects of sonic waves at different frequencies on propagation of Chlorella pyrenoidosa. Agricul. Sci. Technol. 2012, 13, 2197. [Google Scholar]
- Telewski, F.W. A unified hypothesis of mechanoperception in plants. Am. J. Bot. 2006, 93, 1466–1476. [Google Scholar] [CrossRef]
- Xiujuan, W.; Bochu, W.; Yi, J.; Defang, L.; Chuanren, D.; Xiaocheng, Y.; Sakanishi, A. Effects of sound stimulation on protective enzyme activities and peroxidase isoenzymes of Chrysanthemum. Colloids Surf. B Biointerfaces 2003, 27, 59–63. [Google Scholar] [CrossRef]
- Zhao, H.C.; Wu, J.; Zheng, L.; Zhu, T.; Xi, B.S.; Wang, B.; Cai, S.; Younian, W. Effect of sound stimulation on Dendranthema morifolium callus growth. Colloids Surf. B Biointerfaces 2003, 29, 143–147. [Google Scholar] [CrossRef]
- Adadi, P.; Kovaleva, E.; Glukhareva, T.; Shatunova, S.; Petrov, A. Production and analysis of non-traditional beer supplemented with sea buckthorn. Agron. Res. 2017, 15, 1831–1845. [Google Scholar] [CrossRef]
- Adadi, P.; Kovaleva, E.G.; Glukhareva, T.V.; Barakova, N.V. Production and investigations of antioxidant rich beverage: Utilizing Monascus purpureus IHEM LY2014-0696 and various malts. Agron. Res. 2018, 16, 1312–1321. [Google Scholar] [CrossRef]
- Adadi, P.; Kovaleva, E.G.; Glukhareva, T.V.; Shatunova, S.A. Biotechnological production of non-traditional beer. AIP Conf. Proc. 2017, 1886, 1–13. [Google Scholar] [CrossRef]
- Briggs, D.E.; Brookes, P.A.; Stevens, R.; Boulton, C. Brewing: Science and Practice; Elsevier: Amsterdam, The Netherlands, 2004. [Google Scholar]
- Brányik, T.; Vicente, A.A.; Dostálek, P.; Teixeira, J.A. A review of flavour formation in continuous beer fermentations. J. Inst. Brew. 2008, 114, 3–13. [Google Scholar] [CrossRef] [Green Version]
- Pietruszka, M.; Pielech-Przybylska, K.; Szopa, J. Synthesis of higher alcohols during alcoholic fermentation of rye mashes. Sci. Bull. Technol. Univ. Lodz. 2010, 74, 51–64. [Google Scholar]
- Stewart, G.G. The production of secondary metabolites with flavour potential during brewing and distilling wort fermentations. Fermentation 2017, 3, 63. [Google Scholar] [CrossRef] [Green Version]
- Dickinson, J.R.; Salgado, L.E.J.; Hewlins, M.J. The catabolism of amino acids to long chain and complex alcohols in Saccharomyces cerevisiae. J. Biol. Chem. 2003, 278, 8028–8034. [Google Scholar] [CrossRef] [PubMed] [Green Version]
- Pires, E.J.; Teixeira, J.A.; Brányik, T.; Vicente, A.A. Yeast: The soul of beer’s aroma—A review of flavour-active esters and higher alcohols produced by the brewing yeast. Appl. Microbiol. Biotechnol. 2014, 98, 1937–1949. [Google Scholar] [CrossRef] [Green Version]
- Saerens, S.M.; Delvaux, F.R.; Verstrepen, K.J.; Thevelein, J.M. Production and biological function of volatile esters in Saccharomyces cerevisiae. Microb. Biotechnol. 2010, 3, 165–177. [Google Scholar] [CrossRef] [Green Version]
- Verstrepen, K.J.; Derdelinckx, G.; Dufour, J.-P.; Winderickx, J.; Thevelein, J.M.; Pretorius, I.S.; Delvaux, F.R. Flavor-active esters: Adding fruitiness to beer. J. Biosci. Bioeng. 2003, 96, 110–118. [Google Scholar] [CrossRef]
- Verstrepen, K.J.; Derdelinckx, G.; Dufour, J.-P.; Winderickx, J.; Pretorius, I.S.; Thevelein, J.M.; Delvaux, F.R. The Saccharomyces cerevisiae alcohol acetyl transferase gene ATF1 is a target of the cAMP/PKA and FGM nutrient-signalling pathways. FEMS Yeast Res. 2003, 4, 285–296. [Google Scholar] [CrossRef] [Green Version]
- Verstrepen, K.J.; Van Laere, S.D.; Vanderhaegen, B.M.; Derdelinckx, G.; Dufour, J.-P.; Pretorius, I.S.; Winderickx, J.; Thevelein, J.M.; Delvaux, F.R. Expression levels of the yeast alcohol acetyltransferase genes ATF1, Lg-ATF1, and ATF2 control the formation of a broad range of volatile esters. Appl. Environ. Microbiol. 2003, 69, 5228–5237. [Google Scholar] [CrossRef] [Green Version]
- King, A.J.; Dickinson, J.R. Biotransformation of hop aroma terpenoids by ale and lager yeasts. FEMS Yeast Res. 2003, 3, 53–62. [Google Scholar] [CrossRef]
- Takoi, K.; Koie, K.; Itoga, Y.; Katayama, Y.; Shimase, M.; Nakayama, Y.; Watari, J. Biotransformation of hop-derived monoterpene alcohols by lager yeast and their contribution to the flavor of hopped beer. J. Agric. Food Chem. 2010, 58, 5050–5058. [Google Scholar] [CrossRef] [PubMed]
- Pfeil, J.; Frohme, M.; Schulze, K. Mobile microscopy and automated image analysis: The ease of cell counting and classification. Opt. Photonik 2018, 13, 36–39. [Google Scholar] [CrossRef] [Green Version]
- Richter, T.M.; Eyres, G.T.; Silcock, P.; Bremer, P.J. Comparison of four extraction methods for analysis of volatile hop-derived aroma compounds in beer. J. Sep. Sci. 2017, 40, 4366–4376. [Google Scholar] [CrossRef]
- Johnsen, L.G.; Skou, P.B.; Khakimov, B.; Bro, R. Gas chromatography–mass spectrometry data processing made easy. J. Chromatogr. A 2017, 1503, 57–64. [Google Scholar] [CrossRef] [PubMed]


| Barrel | Frequency (Hz) | Intensity (dB) | Temperature (°C) | Treatment |
|---|---|---|---|---|
| 1 | 200–800 | 124 † | 20 | Low frequency_low intensity (LF_LI) |
| 2 | 800–2000 | 140 † | 20 | High frequency_ High intensity (HF_HI) |
| 3 | 800–2000 | 124 † | 20 | High frequency_low intensity (HF_LI) |
| 4 | 200–800 | 140 † | 20 | Low frequency_high intensity (LF_HI) |
| 5 | Silence | 94.55 β | 20 | Silence (S) |
Publisher’s Note: MDPI stays neutral with regard to jurisdictional claims in published maps and institutional affiliations. |
© 2021 by the authors. Licensee MDPI, Basel, Switzerland. This article is an open access article distributed under the terms and conditions of the Creative Commons Attribution (CC BY) license (https://creativecommons.org/licenses/by/4.0/).
Share and Cite
Adadi, P.; Harris, A.; Bremer, P.; Silcock, P.; Ganley, A.R.D.; Jeffs, A.G.; Eyres, G.T. The Effect of Sound Frequency and Intensity on Yeast Growth, Fermentation Performance and Volatile Composition of Beer. Molecules 2021, 26, 7239. https://doi.org/10.3390/molecules26237239
Adadi P, Harris A, Bremer P, Silcock P, Ganley ARD, Jeffs AG, Eyres GT. The Effect of Sound Frequency and Intensity on Yeast Growth, Fermentation Performance and Volatile Composition of Beer. Molecules. 2021; 26(23):7239. https://doi.org/10.3390/molecules26237239
Chicago/Turabian StyleAdadi, Parise, Alastair Harris, Phil Bremer, Patrick Silcock, Austen R. D. Ganley, Andrew G. Jeffs, and Graham T. Eyres. 2021. "The Effect of Sound Frequency and Intensity on Yeast Growth, Fermentation Performance and Volatile Composition of Beer" Molecules 26, no. 23: 7239. https://doi.org/10.3390/molecules26237239