3.1. EPS Molar Mass Determination and Polydispersity
Polysaccharides are heterogeneous substances; their chemistry, morphology, and polydispersity play an important role on their biodistribution [
34,
43], and when coupled to radionuclides, it could lead to the irradiation of healthy tissues. After their production in bioreactors, it is important to monitor their rheological properties to ensure reproducibility. AF4, an alternative separative technique to SEC-MALS with a higher selectivity [
44], was proposed to determine the molecular weights of polysaccharides. MALS provides a direct and absolute way of measuring the
value [
45]. Indeed, for polysaccharides, non-ideality arising from co-exclusion and polyelectrolyte effects can be a serious problem and, if not corrected for, can lead to significant underestimates for
. At the concentrations used in this work, the non-ideality effect could be neglected. The estimate for
could thus be considered within a few percent of the true or “ideal”
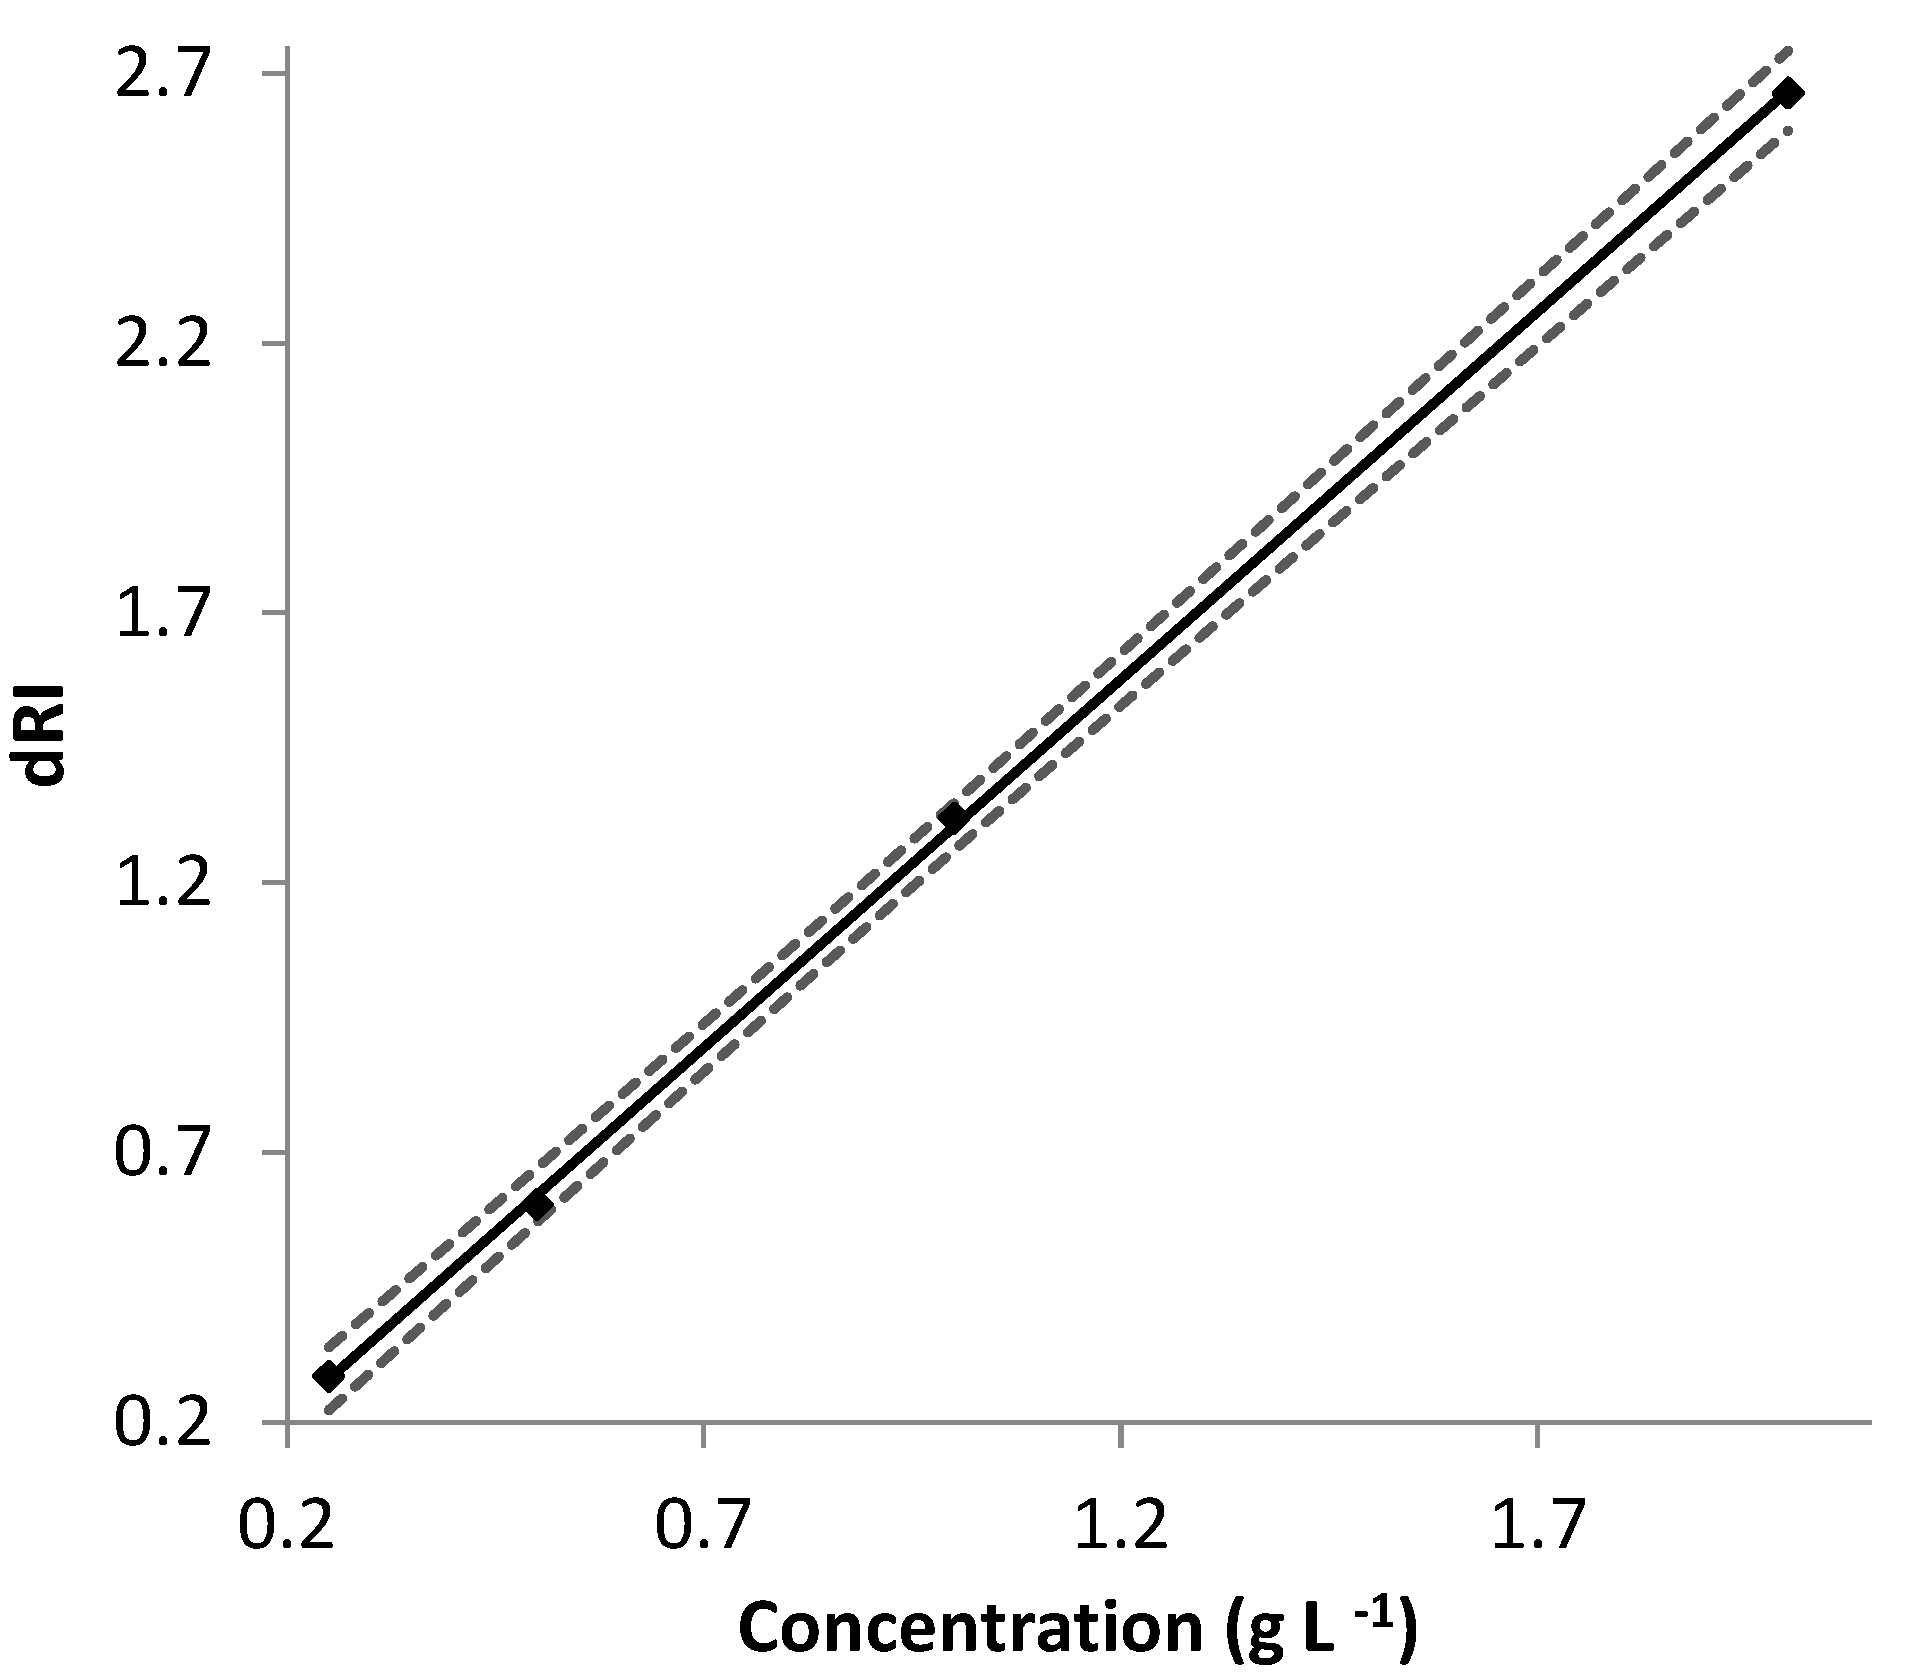
. In order to use MALS data, the ∂n/∂c value for the studied polyelectrolytes must be accurately known.
The ∂n/∂c values determined for the two EPS samples were lower than the common range considered for other polysaccharides. The published ∂n/∂c values for various macromolecules [
30], particularly for polysaccharides such as dextran and pullulan, indicated ∂n/∂c values in aqueous solution ranging between 0.14 and 0.15 mL g
−1, whereas the range is broader, i.e., from 0.044 to 0.218 mL g
−1, for non-aqueous systems [
45]. For chitosan, the degree of substitution could influence the ∂n/∂c value, particularly if ionic functional groups are involved in the polysaccharide structure [
46]. The presence of counter ions, such as Na
+, together with a small chain branching, were shown to decrease the ∂n/∂c value from the general range of aqueous solutions, i.e., 0.14–0.15 mL g
−1 [
47]. The different ∂n/∂c values between the two EPSs of this work could be explained by: (i) the differences in the sulfate contents, thus leading to different degree of ionization; by (ii) the different chain lengths of the two EPSs, as described later.
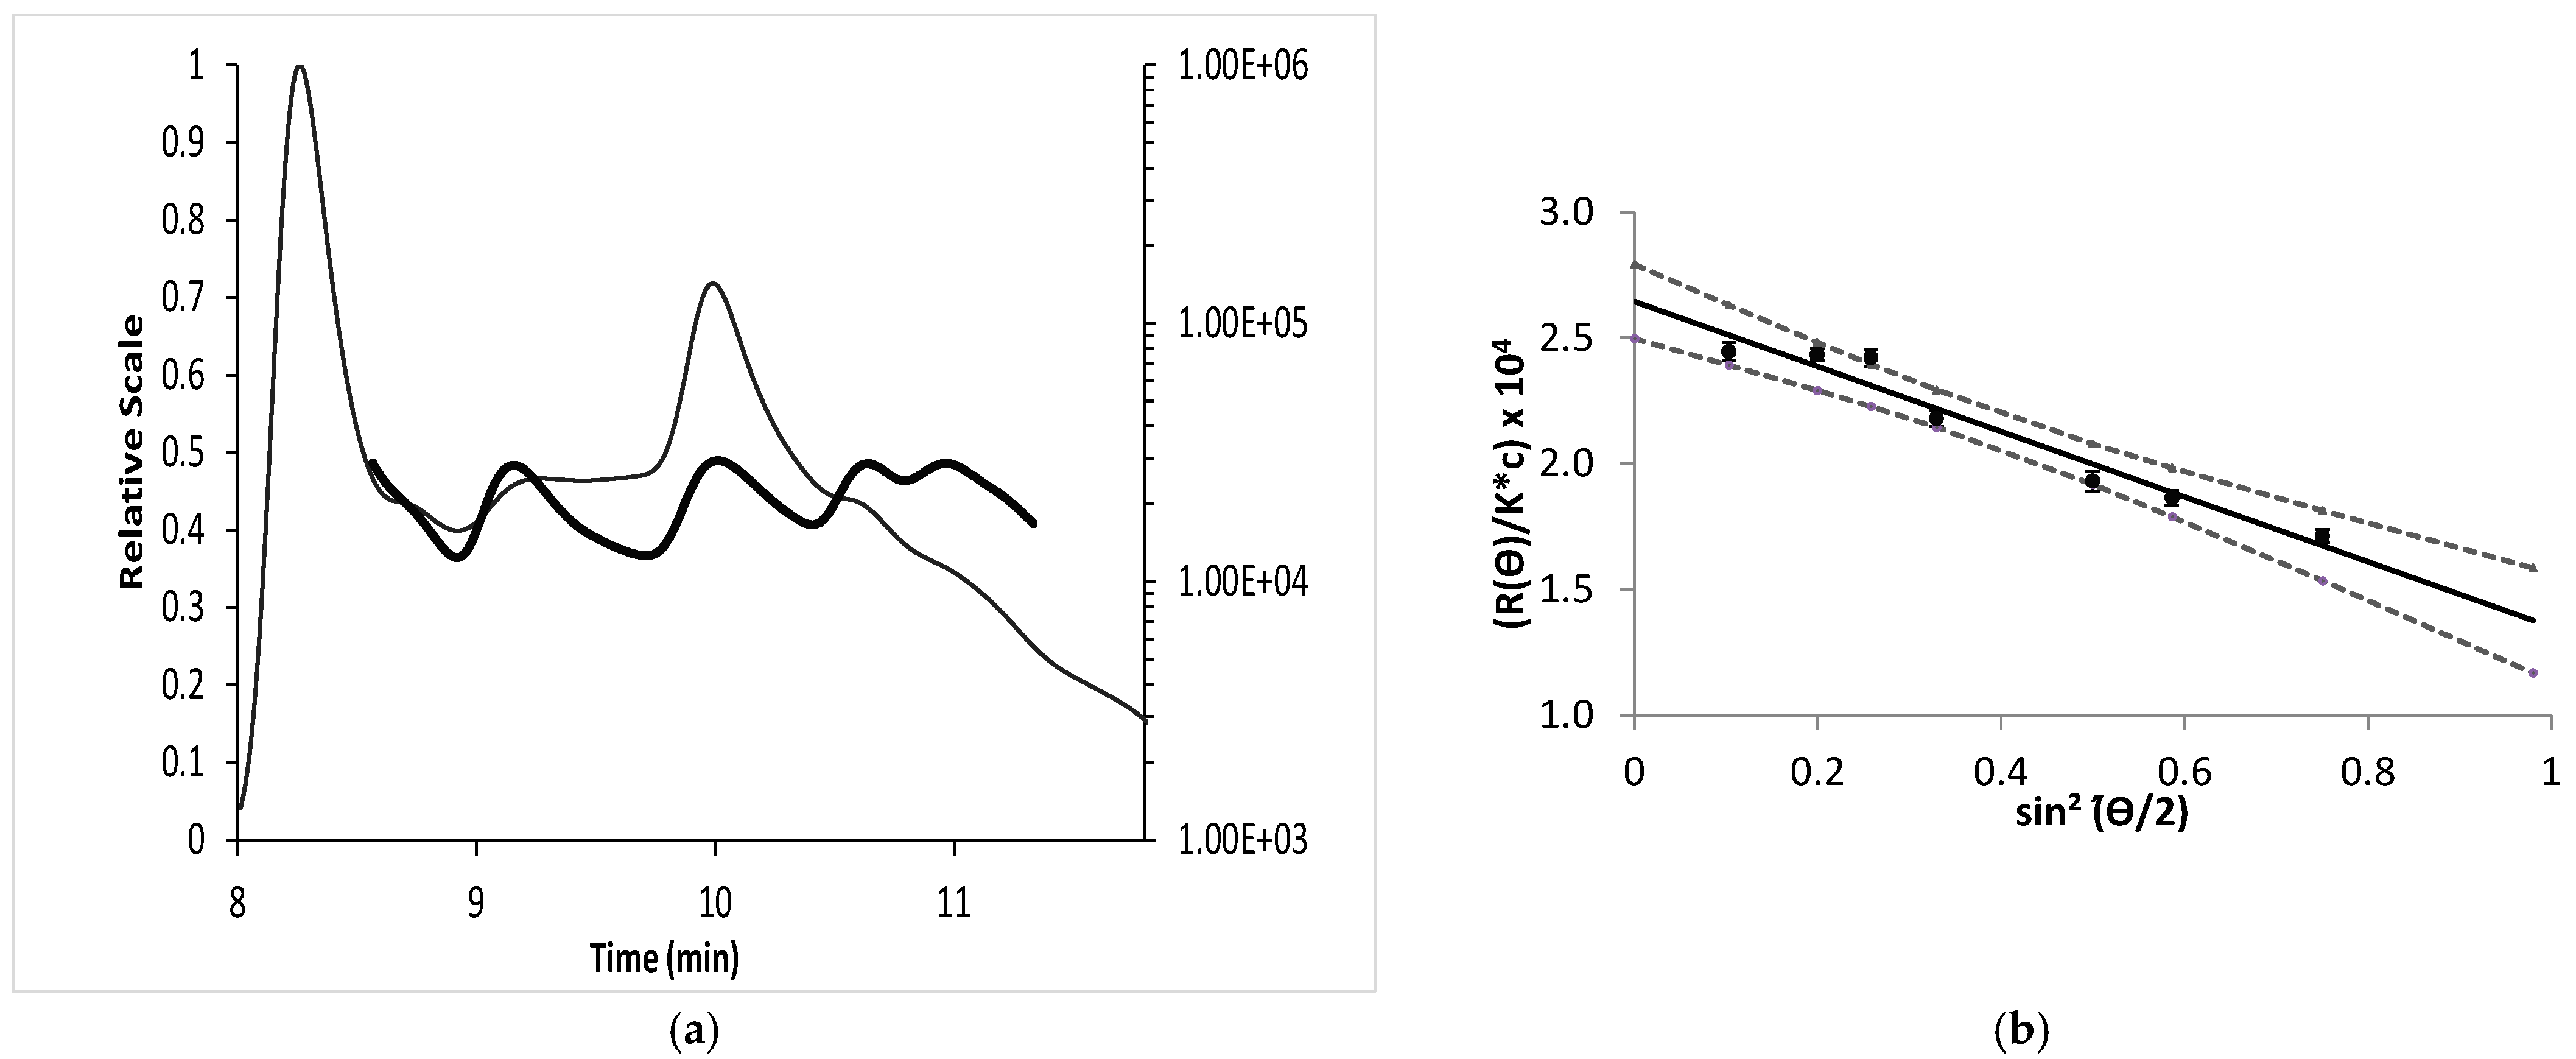
The ∂n/∂c values determined for EPS-DR and -DRS were thus used with AF4-MALS, and the
were determined. EPS-DR and -DRS appeared to be monodisperse. Their
were slightly higher than the ones published on low molecular weight polysaccharides, i.e., 10
6 and 24–35 10
3 g mol
−1, respectively [
13]. Nonetheless, it was confirmed that radical depolymerization provided homogeneous polysaccharides in terms of molar mass dispersion (for both
and
) [
48]. Monodisperse polymers have the same degree of polymerization or relative molecular mass [
49], with a polydispersity index PDI = 1. For this kind of polysaccharide, the PDI found is usually around 1.5 [
14], while most of the natural polysaccharides have PDI above 2 [
50,
51].
It can be assumed that the
of EPS-DR and -DRS were underestimated in the previously published work [
14] since the authors characterized these EPS by SEC-MALS with an average ∂n/∂c values for both EPS. Many commonly used SEC stationary phases may contribute to the unwanted interactions between charged analytes and column material. Another limitation of SEC is the incapability of the technique to characterize high-molar mass polymers and polysaccharides accurately (M
w > 1 × 10
6 g mol
−1), even if SEC has been successfully used for characterization of commercial cationic hydroxyethyl cellulose derivatives [
52]. Additionally, it has been well established that the potential for degradation exists when analyzing long linear polymers by SEC [
53].
Finally, the use of SEC in combination with MALS or the triple detector system, where a true size exclusion from the column is not necessary in order to obtain absolute
, would still give erroneous results as the ∂n/∂c for the polymer in solution would change due to the change in repeating unit composition. It was shown, for instance that loss of sulfate groups would result in the polymer assuming a less extended and more flexible conformation due to lower electrostatic intramolecular repulsion [
39]. A desulfated polysaccharide molecule would, therefore, effectively behave as a smaller molecule in solution compared to another molecule of the same degree of polymerization but unchanged degree of sulfation. To some extent, the impact of this factor on elution from a SEC column could be minimized by using a mobile phase with high ionic strength, which will shield the electrostatic charges, but would definitely change the size of the polymer in solution [
39].
Finally, both EPS samples exhibit nanometric sizes for their gyration radius that correspond to one quantitative indicator of molecular conformation. This last one controls the efficacy in drug delivery [
54]. With R
g ranging from 44 to 58 nm, these EPS are suitable with rapid in vivo circulation, and fast clearance through the kidneys [
43].
3.2. Polymer Conformation
Other useful quantitative indicators of molecular conformation are the viscosimetric radius (Rη) or the hydrodynamic radius (Rh). The hydrodynamic radius (or equivalent sphere radius) is usually determined by dynamic light scattering. Thus, this work has examined the viscosimetric radius (Rη) and the conformation of the polymers.
The viscosity of a polymer in solution is related to the polymer conformation, that could be affected by the complexation with metal ions [
28]. The change in conformation was monitored through the polymer’s intrinsic viscosity in solution, by varying the ionic strength of solvent for both EPS-DR and heparin.
Figure 5a,b show an important decrease in the intrinsic viscosity for all concentrations considered with increasing ionic strength. These results were in agreement with results otherwise obtained on heparin [
55]. A decrease in Debye length and a shield effect are caused by cations from the background electrolyte that decreased the electrostatic repulsion of the ionized groups, thus leading to a drop in viscosity [
56].
Indeed, electrostatic interactions are very long-range (ca. 1000 nm) in pure water but quickly become screened in the presence of added salt (10 nm for 10−3 mol L−1 monovalent salt). This is why, during dilution in pure water, polyelectrolytes adopt a more elongated conformation under the effect of electrostatic repulsions and the length of the chain is proportional to the number of monomers. However, the chain is not fully stretched, and it has been showed that the concept of the electrostatic blob allows for the accounting of both long-range electrostatic interactions at the monomers. When the conformation is a highly stretched chain bearing a large number of charges, thus producing an important interoperable electrostatic potential with the counter-ions.
Intrinsic viscosity, [η] and the hydrodynamic volume Vh are related through Equation (9), where M is given by the Mark–Houwink–Sakurada equation (Equation (10)).
A universal calibration was performed first with polyacrylic acid (PAA) of different molecular weights. In this method, a set of standards are still required, but they do not have to be exactly the same. The polymer samples used for such calibration should be as narrow in distribution as possible because the width of the distribution will influence the values of K and a. Since viscosity is a function of molecular size and not strictly molecular weight, the constants K and a apply only to a given polymer at a specified temperature and solvent. They should be limited to the molecular weight range for which they were determined. The polymer must be linear, unbranched and not crosslinked. As a result, the calibration curve generated gives information about the intrinsic viscosity, molecular weight, and elution volume of a sample. Since intrinsic viscosity is the basis for this method, a universally calibrated system can be used for any polymer sample. One advantage of this method is that, unlike conventional calibration, the series of standards used do not have to be the same. Thus, a separate calibration for each type of polymer is not necessary.
In an aqueous solution at neutral pH, PAA was under an anionic form composed only of carboxylic groups (pK
a = 4.54 [
57]). The PAA standards used were all linear. The intrinsic viscosity of each standard was determined (
Table 3) and from this a calibration curve was established allowing the determination of
K and
a [
58]. The
a = 0.617 obtained for PAA in 0.1 mol L
−1 NaCl at 20 °C would indicate that the solvent is a “poor” solvent. However, NaCl has a great affinity for water and the addition of ions to aqueous solutions of polymers reduced the hydration of hydrophilic polymers [
59]. The polymers are partially hydrated due to the great affinity of ions for hydration and, consequently, the polymer–polymer interactions are enhanced. This led to a low
a value, as observed experimentally.
The constants
K and
a from Equation (10) were used to determine the viscosity average molar mass (
Mv), depending on the polymer type and solute–solvent interactions. For instance, Grubisic et al. [
60] calculated the
Vh of different linear and branched polystyrene using the product [
η]
. Hamielec and Ouano [
61] determined the
Vh of standard polystyrenes using the product [
η]
. The authors concluded that inaccurate
Vh values were obtained, when using
or
instead of
Mv [
62].
For the two EPS samples, a decrease in Vh was observed with increasing ionic strength. This decrease is slightly higher for EPS-DR and -DRS than for heparin, meaning that EPS-DR and -DRS are more sensitive to the ionic strength changes. This could be explained by considering the overall charges surrounding EPS-DR or -DRS chains that are more important compared to the heparin ones. EPS-DR and -DRS exhibit more ionized functional groups that could be shielded by the counter-ions from the background electrolyte, leading to the folding of the polymer chain. The decrease in intrinsic viscosity with increasing ionic strength reflects a change in conformation: the expansion of the polymer chain is clearly affected by the addition of ions that seem to make the ionized functional groups of the polymer inaccessible. Coil expansion, and thus the intrinsic viscosity, decreased with ion concentration. This means that, with a higher Vh, the EPS polymers seem to be more elongated, exhibiting a larger portion of available ionized functional groups, i.e., carboxylate, available for the counter ion, i.e., Na+. By contrast, when Vh is lower, the polymer is more compact and tightly coiled, reducing the portions of ionized functional moieties for the counter ions.
Smidsrød and Haug [
38] noticed that the size of the polysaccharide molecule in solution at a certain ionic strength changed depending upon the degree of desulfation (random coil to rigid rod) since the sulfate groups determine the total charge and charge distribution on the polymer. Loss of sulfate groups resulted in the polymer assuming a less extended and more flexible conformation due to lower electrostatic intramolecular repulsion. A desulfated polysaccharide molecule would, therefore, effectively behave as a smaller molecule in solution compared to another molecule of the same degree of polymerization but unchanged degree of sulfation. This is observed here between EPS-DR and -DRS. Hence, we measured the ability of polyelectrolytes to respond to changes in salt concentration by altering their hydrodynamic volume in agreement with published data on other type of polysaccharides [
38].
3.3. Stability Constants of Sc-EPS and Sc-Heparin
As described by Santo et al. [
42], the simplest model of complexation used in the literature is the non-bonded model, in which the metal atom interacts with the ligands simply by van der Waals and Coulombic interactions. This model cannot take into account the number and spatial arrangement of coordinating bonds specific to the particular metal, as the ligands tend to close-pack around the metal atom. In the bonded model, the metal atom is covalently bonded to ligands, and this preserves the coordination number and complex geometry. This model is applicable to stable metal-ligand complexes but cannot be used in the systems where ligand dissociation and exchange may occur.
The FISRE method has been used for the determination of thermodynamic stability of metallo-radiopharmaceuticals containing Y
3+ [
63], or for Sc
3+ complexes with several chelating ligands, i.e., EDTA, DTPA, NOTA, and DOTA [
37]. Other techniques, such as potentiometric titrations and CE-ICP-MS were considered being less suitable to analyze Sc-EPS complexes. The influence of coordination on the structure and rheology of polymer solutions has been extensively studied in the literature [
42]. As written earlier, potentiometric titrations would affect the integrity of the polymer chain because of an extreme pH range that can cause chain scission. CE-ICP-MS, instead, could be used because of the complex highly charged polysaccharides-metal complexes, leading to a very difficult interpretation of the speciation.
Hao et al. demonstrated using NMR and FTIR measurements that metal atom interacts with the carbonyl oxygen of the polyvinylpyrrolidone (PVP) polymer and, based on the data, hypothesized possible coordination with amine group [
64]. For sugar-based moieties, it was evidenced that, in glucuronic, as well as galacturonic acid, the complexation with a trivalent ion, such as Eu
3+, occurred between the carboxylic moiety, the ring oxygen and the C-4 hydroxyl group [
65,
66].
To the best of our knowledge, there are no data on the complexation of EPS or heparin with Sc
3+. It was shown that, on a sulfate containing polyelectrolyte, the fixation of weakly acidic cations resembled the formation of outer-sphere complexes, in which the cation was separated from the anionic group by a solvent molecule [
67]. The cation and anion were held together by electrostatic forces, and the smaller the radius of the solvated cation, the stronger the bond. The stability constant of heparin with Ca
2+ is log K = 2.09 at pH = 7.2 and I = 0.15 M [
67]. Feofanova et al. determined by potentiometric titration the stability constants of heparin with divalent d-transition series metals, i.e., Cu
2+, Zn
2+, Co
2+, Ni
2+ and Fe
3+ [
65]. They found that the monoligand complex MHep
2- was the predominant species in weakly acidic, neutral, and weakly basic pH ranges. Otherwise, it was also shown that the affinity of metal ions for donor groups of low basicity is expected to decrease with increasing ionic radius of the hydrated cation. [
68]. For Sc
3+, the ionic radius is smaller than the one of Ca
2+ [
69], so a higher complexation is expected.
With increasing pH, metal hydrolysis occurs. Water molecules are present in the inner coordination sphere of the metal that are progressively replaced by hydroxo-complexes, such as [M(OH)Hep]
3− and [M(OH)
2Hep]
4−, with increasing pH. For all the metal-heparin complexes identified, these authors showed that log β values increased when more hydroxo-species of the metal were complexed—see Feofanova et al. [
65] for application.
From a thermodynamic point of view, and with no further indication, the two following equilibria cannot be discriminated.
For EPS, these assumptions are not straightforward. Indeed, even if the literature provided some data on the complexation of polysaccharides with metals, there are very few data on the determination of their stability constants [
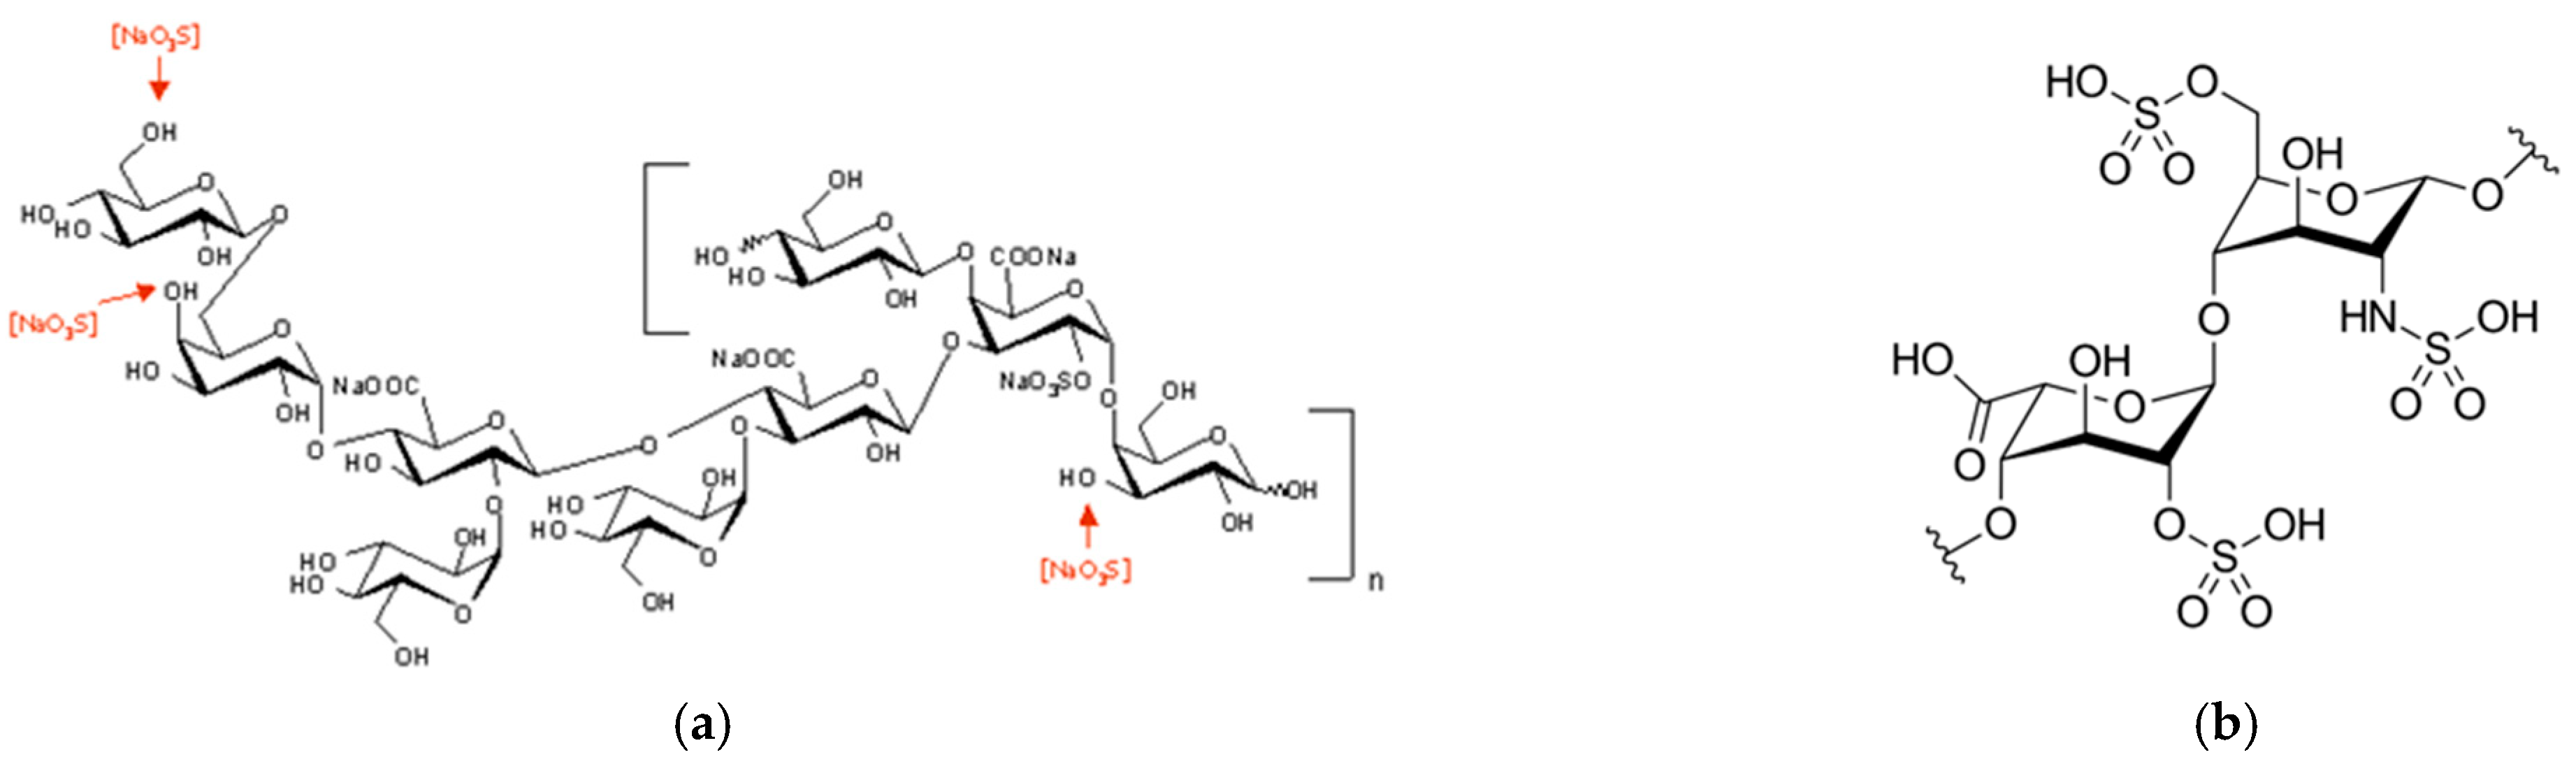
70]. Nonetheless, considering the nonasaccharide monomer that composes EPS-DR and -DRS (
Figure 1a), there are from five (DR) to eight (DRS) negative charges from its glucuronic and galacturonic acid units. Fuks and Bünzli [
71] determined, by spectrophotometry, the complexation constants of these two latter uronic acids with lanthanide trivalent ions. These authors found that the complexation of La(III) with glucuronic acid and galacturonic acid lead to two complexes with respective values of log
K1 = 1.32 and log
K2 = 3.86 and log
K1 = 1.41 and log
K2 = 3.94, without consideration of La(III) hydrolysis, which is less extensive than Sc(III) [
72].
Thus, for our investigated systems, the model with more than one complex was chosen, as it would be more relevant for the experimental data considered. The stability constants found for EPS-DR and -DRS were higher than those from Fuks and Bünzli [
71] on glucuronic and galacturonic acids, and this could suggest the presence of hydroxo-complexes of Sc for both of them. Indeed, the hydrolysis of Sc
3+ is more extensive than La
3+ since it occurs at pH 5 [
71].
Comparing the stability constants between two EPS, Sc-EPS-DR complexes seem to be slightly more stable than the Sc-EPS-DRS ones. However, in terms of speciation, both ligands seem to quantitatively complex scandium in conditions near physiological ones. In terms of charge, EPS-DRS present three additional negative charges, related to the three sulfate groups generated by the oversulfation reaction. The presence of the sulfate groups was awaited to enhance the complexation. The reasons for this opposite trend, instead, could be due to a higher steric hindrance with DRS monomers caused by sulfates. At higher ionic strength, those groups are shielded, which makes polymer folding into a more contracted random coil. Carboxylate moieties of EPS-DRS may be less accessible for steric reasons than those of EPS-DR. Nonetheless, Sc-EPS complexes appear to be less stable than those between scandium and classic chelate ligands used in radiopharmaceuticals, such as DOTA and DTPA (
KScDOTA = 30.79;
KScDTPA = 27.43) [
73]. From the values published in [
73], we calculated the apparent complexation constant for DTPA and DOTA, respectively, with scandium at pH = 6.1. We found 16.93 and 16.98, respectively. Even if these values are much higher than those determined for heparin, EPS-DR and –DRS (i.e., 6.38; 7.07 and 5.62 from
Table 5), the complexation of scandium with these ligands is total. Additionally, the Sc-EPS and Sc-heparin complexes appear comparable, meaning that the complexation behavior of those exopolysaccharides is quite similar to the traditional GAG heparin.
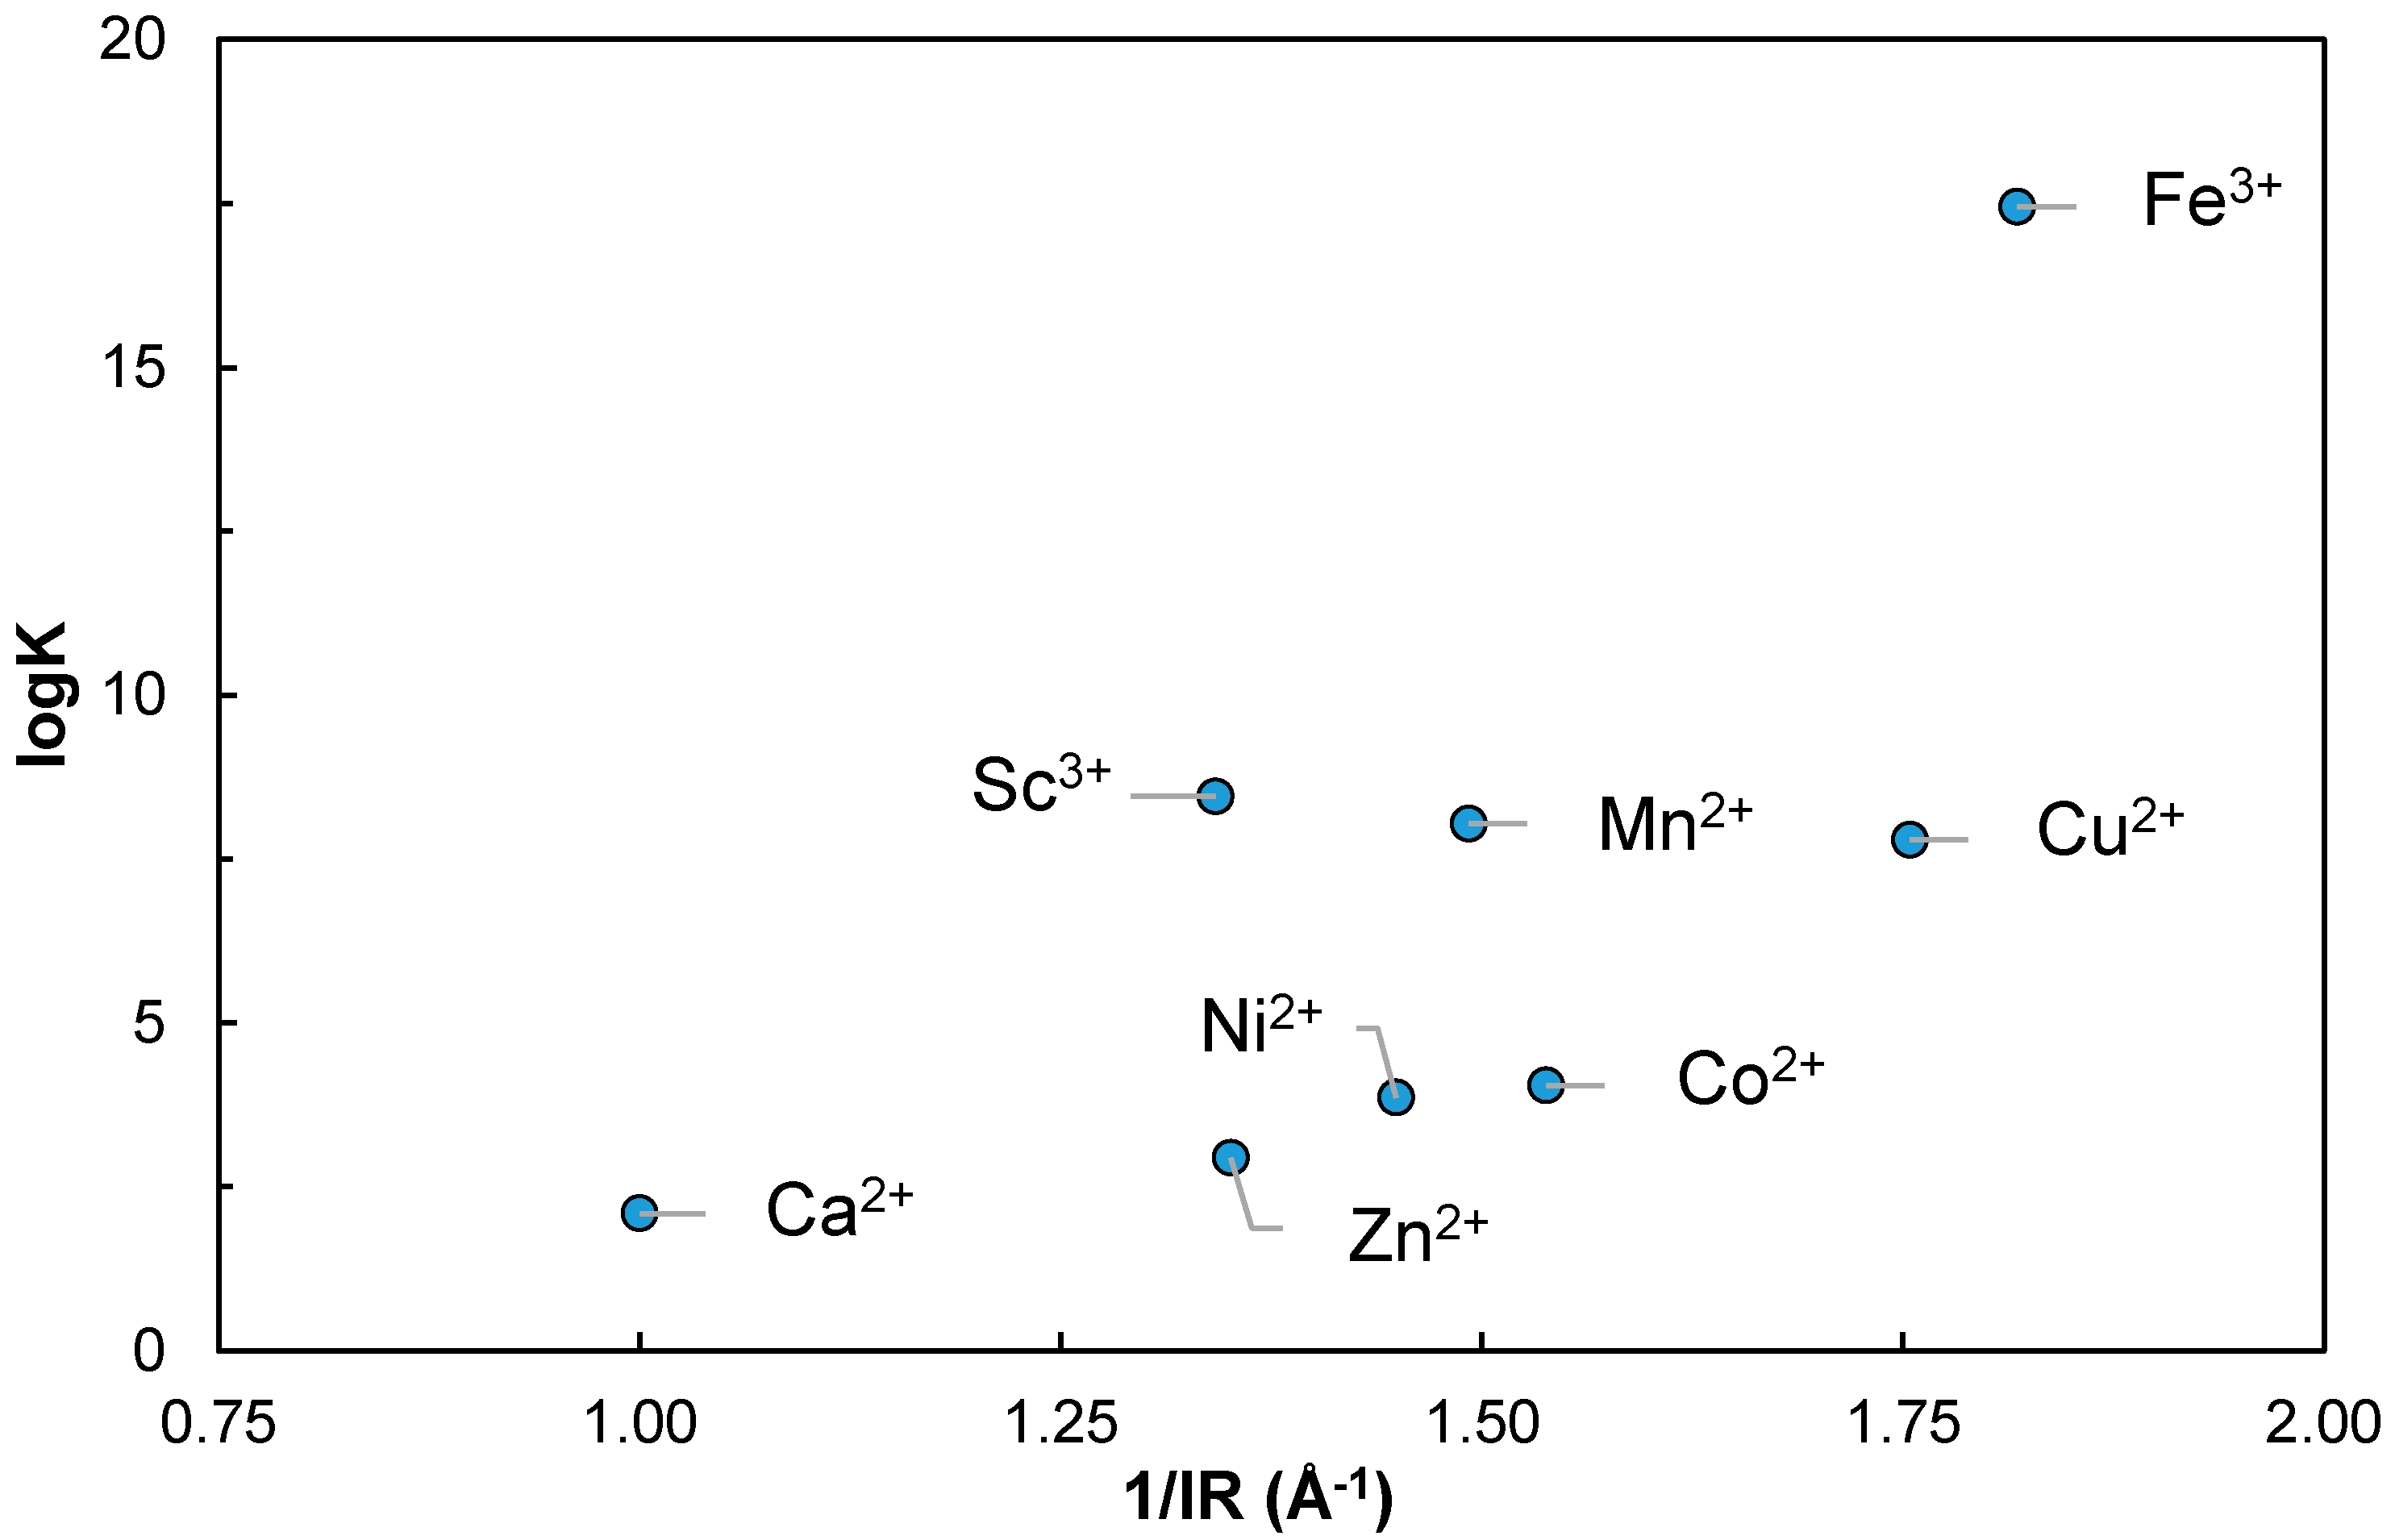
Regarding the Metal–Heparin complexes, a comparison could be made plotting the log β values vs. the inverse effective ionic radius 1/IR of the free metals in Shannon [
69] in
Figure 7. It can be seen that Sc
3+ seems to effectively show stronger complexation than Ca
2+, and even stronger complexation than smaller ions, such as Zn
2+, Ni
2+ or Co
2+. It is comparable to Mn
2+ and Cu
2+, which is distorted by Jahn–Teller effect. It also shows a markedly smaller value that the trivalent Fe
3+ complex. In effect, the comparison could be somewhat difficult as the formation of Fe(OH)Hep complex—and of Cu(OH)Hep to a somewhat lesser extent—is more extensive than the other first series d-transition elements [
65]. Even the formation of Sc(OH)Hep seems to be lower than Fe(OH)Hep.
The two EPSs studied are strongly complexing Sc3+ and thus, they can be further envisaged as carriers for the theranostic pair 44Sc/47Sc.


 ,
, 


