Article

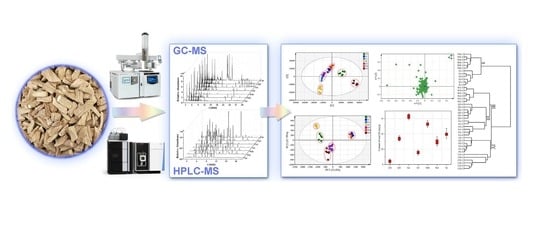
Quantitative Analysis and Differential Evaluation of Radix Bupleuri Cultivated in Different Regions Based on HPLC-MS and GC-MS Combined with Multivariate Statistical Analysis

Jilin Ginseng Academy, Changchun University of Chinese Medicine, Changchun 130117, China
*
Authors to whom correspondence should be addressed.
These authors contributed equally to this work.
Molecules 2022, 27(15), 4830; https://doi.org/10.3390/molecules27154830
Submission received: 28 June 2022 / Revised: 25 July 2022 / Accepted: 26 July 2022 / Published: 28 July 2022
(This article belongs to the Special Issue Mass Spectrometry in Pharmaceutical Analysis)

Abstract

:
The quality of Radix Bupleuri is greatly affected by its growing environment. In this study, Radix Bupleuri samples that were harvested from seven different regions across northwest China were examined by high-performance liquid chromatography (HPLC) and gas chromatography (GC) coupled with mass spectrometry (MS) to reveal significant differences in quality contributed by the cultivation region. An HPLC-MS method was firstly established and used in the multiple reaction monitoring mode for the quantitative analysis of five saikosaponins in Radix Bupleuri so as to evaluate the difference in the absolute content of saikosaponins attributable to the cultivation region. The effect on the components of Radix Bupleuri was further investigated based on the profiles of the representative saponins and volatile compounds, which were extracted from the Radix Bupleuri samples and analyzed by HPLC-MS and GC-MS. Multivariate statistical analysis was employed to differentiate the Radix Bupleuri samples cultivated in different regions and to discover the differential compositions. The developed quantitative method was validated to be accurate, stable, sensitive, and repeatable for the determination of five saikosaponins. Further statistical tests revealed that the collected Radix Bupleuri samples were distinctly different from each other in terms of both saponins and volatile compounds, based on the provinces where they were grown. In addition, twenty-eight saponins and fifty-eight volatile compounds were identified as the differentially accumulated compositions that contributed to the discrimination of the Radix Bupleuri samples. The Radix Bupleuri samples grown in Shouyang county showed the highest content of saikosaponins. All of the results indicated that the cultivation region significantly affected the accumulation and diversity of the main chemical components of Radix Bupleuri. The findings of this research provide insights into the effect of the cultivation region on the quality of Radix Bupleuri and the differentiation of Radix Bupleuri cultivated in different regions based on the use of HPLC-MS and GC-MS combined with multivariate statistical analysis.

Graphical Abstract

1. Introduction

Radix Bupleuri, which is the dry root of Bupleurum chinense DC and narrow leaf Bupleurum scorzonerifolium Willd, is a commonly used traditional Chinese medicine. It was firstly recorded in Shennong Traditional Herbal Scriptures and has been widely used in the treatment of inflammation, malaria, influenza, fever, menstrual disorders, and hepatitis for thousands of years [1]. Radix Bupleuri is mainly cultivated in Shanxi, Shaanxi, Hebei, Gansu, and Ningxia provinces in northwest China, because it prefers dry environments and large temperature differences between day and night [2]. The Radix Bupleuri medicinal materials cultivated in China are not only supplied to the domestic market, but also exported to Japan and other countries. The growth of Radix Bupleuri is greatly affected by precipitation, climate, and soil, which lead to different kinds and contents of chemical components in Radix Bupleuri. Therefore, a comparative analysis for differentiating Radix Bupleuri from various main cultivation regions is important and valuable for its quality control and evaluation [3,4,5].
Radix Bupleuri mainly contains saikosaponins, volatile oils, flavonoids, polysaccharides, fatty acids and sterols [1,6]. Among them, saikosaponins and essential oils are the most prominent active components, the types and contents of which are normally used as the main indexes for quality assessment of Radix Bupleuri [7]. Pharmacological studies have indicated that saikosaponins possess various pharmacological functions, such as immunoregulatory, anti-inflammatory, antioxidant, anti-fibrotic, and anti-hepatoma properties [8,9,10,11]. Saikosaponins mainly belong to pentacyclic triterpenoid derivatives, which can be classified into seven types according to their different aglycones [12]: epoxy ether at C13, C28-position (type I), isocyclic diene (type II), C12-ene (type III), homocyclic diene (type IV), C12-ene-C28-carboxylic acid (type V), isocyclic diene and C30-carboxylic acid (type VI), and C18-ene (type VII), the structural formulas of which are shown in Figure 1. More than 100 kinds of saikosaponins have been discovered so far, among which saikosaponin a (SSa) and saikosaponin d (SSd) have attracted much attention for their good activity and high content in Radix Bupleuri. Chinese Pharmacopoeia also prescribes their contents as the measurement index of total saponin content in Radix Bupleuri [13]. However, a growing number of saikosaponins are found to be of high content and good activity as well. Additionally, the precise analysis methods that are applicable to more kinds of saikosaponins are demanded increasingly for further pharmacological research.
On the other hand, much of the current literature on the activity research of Radix Bupleuri pays particular attention to the volatile oils, which mainly refer to monoterpenes and sesquiterpenes [14]. In addition to playing physicochemical roles, they exhibit considerable pharmacological activities, such as clear antipyretic, analgesic, anti-inflammatory and anti-convulsant effects [15], making them suitable to be used for medicinal purposes. Radix Bupleuri injections and transdermal patches, which are formulated with volatile oils, have been widely used in the clinical setting. Although they only account for about 0.15% of the root weight, the volatile oils are an essential active component and play an important role in the therapeutic effects and quality evaluation of Radix Bupleuri.
A comprehensive and precise detection of the complex Radix Bupleuri extracts is the premise on which quality evaluation and difference analysis are based. High-performance liquid chromatography (HPLC) and gas chromatography (GC) coupled with mass spectrometry (MS) methods have proven to be applicable in the qualitative analysis of saponins and volatile oils, as they can rapidly separate many complex compounds and provide unique retention times as well as structural information [16,17]. Another advantage of using the chromatography-based MS method is that it is suited for almost all polar and non-polar organic compounds. As for quantitative analysis, MS in multiple reaction monitoring (MRM) mode also offers an effective way. It avoids the interference of co-eluting components through exact scanning of the predefined precursor and product ions, and therefore, has attractive features of good accuracy, precision, and repeatability in the quantification of bioactive metabolites. We showed previously the simultaneous quantification of 14 ginsenosides in cultivated ginseng using an established HPLC-MRM/MS method, which provided insights into the accumulation characteristics of ginsenoside affected by cultivation region and age [18].
Previous research has been devoted to the analysis of constituents in different varieties of Radix Bupleuri, such as fatty acids, lipids, and saponins [19,20]. Tykheev investigated the chemical composition of the essential oils and lipid fraction of B. scorzonerifolium from different habitats [21]. Saracoglu analyzed the fatty acid composition and the oil content in five endemic Bupleurum species, which proved the significant nutritional value of Bupleurum oils [22]. However, the quantitative analysis of rare saikosaponins as well as the effect of the cultivation region on the accumulation of saponins and volatile compounds in Radix Bupleuri have rarely been reported, especially for Radix Bupleuri grown in the main production regions of northwest China.
Herein, the effect of cultivation region on the active components of cultivated Radix Bupleuri was systematically investigated. Samples of two-year-old Radix Bupleuri plants were harvested from seven cultivation regions across northwest China. Saikosaponins and volatile compounds were extracted from these samples and were analyzed by HPLC-MS and GC-MS, respectively. Multivariate statistical analysis was further employed to evaluate the differences in these extracted components contributed by the cultivation region based on their respective HPLC-MS and GC-MS profiles, and also to discover the compounds characterized by differential accumulation. Moreover, the quality of Radix Bupleuri samples was assessed by the absolute contents of five saikosaponins, which were accurately quantified by an established HPLC-MRM/MS method. The objective of the current research was to differentiate and evaluate Radix Bupleuri cultivated in different regions and to provide insight into the accumulation characteristics of active components in Radix Bupleuri.

2. Results and Discussion

2.1. Differential Analysis of Five Saikosaponins in Radix Bupleuri Samples Cultivated in Different Regions

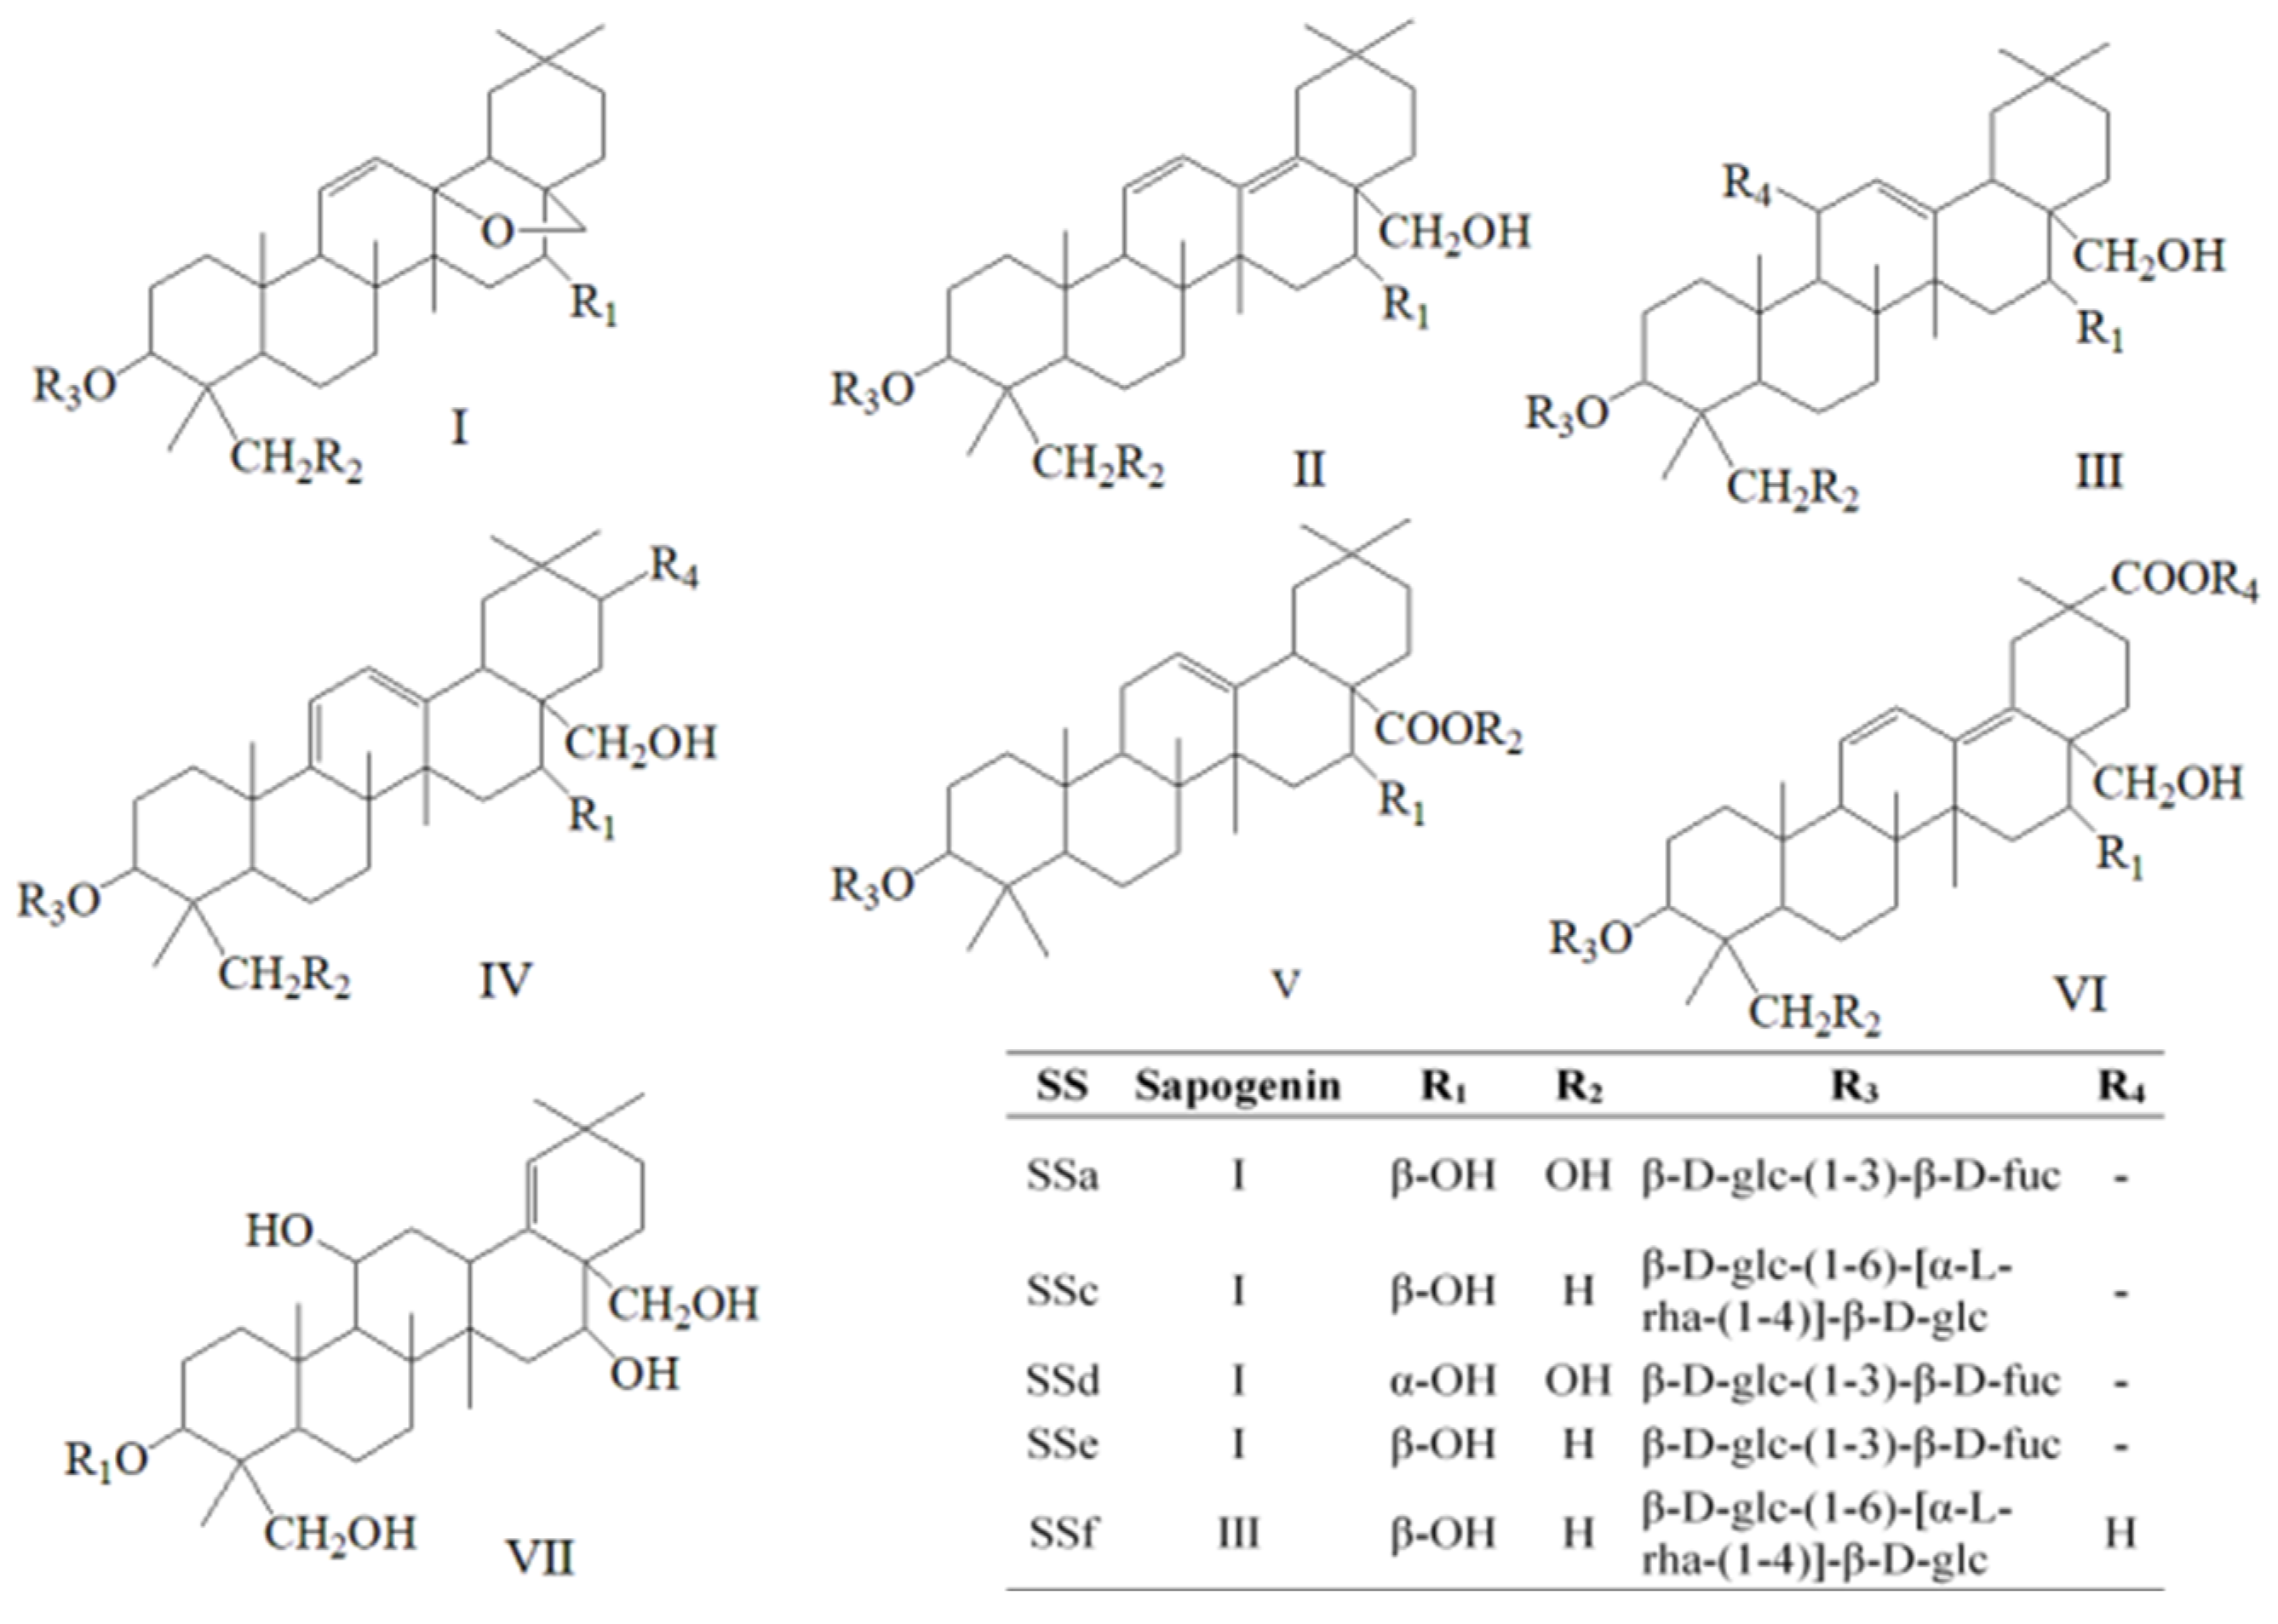
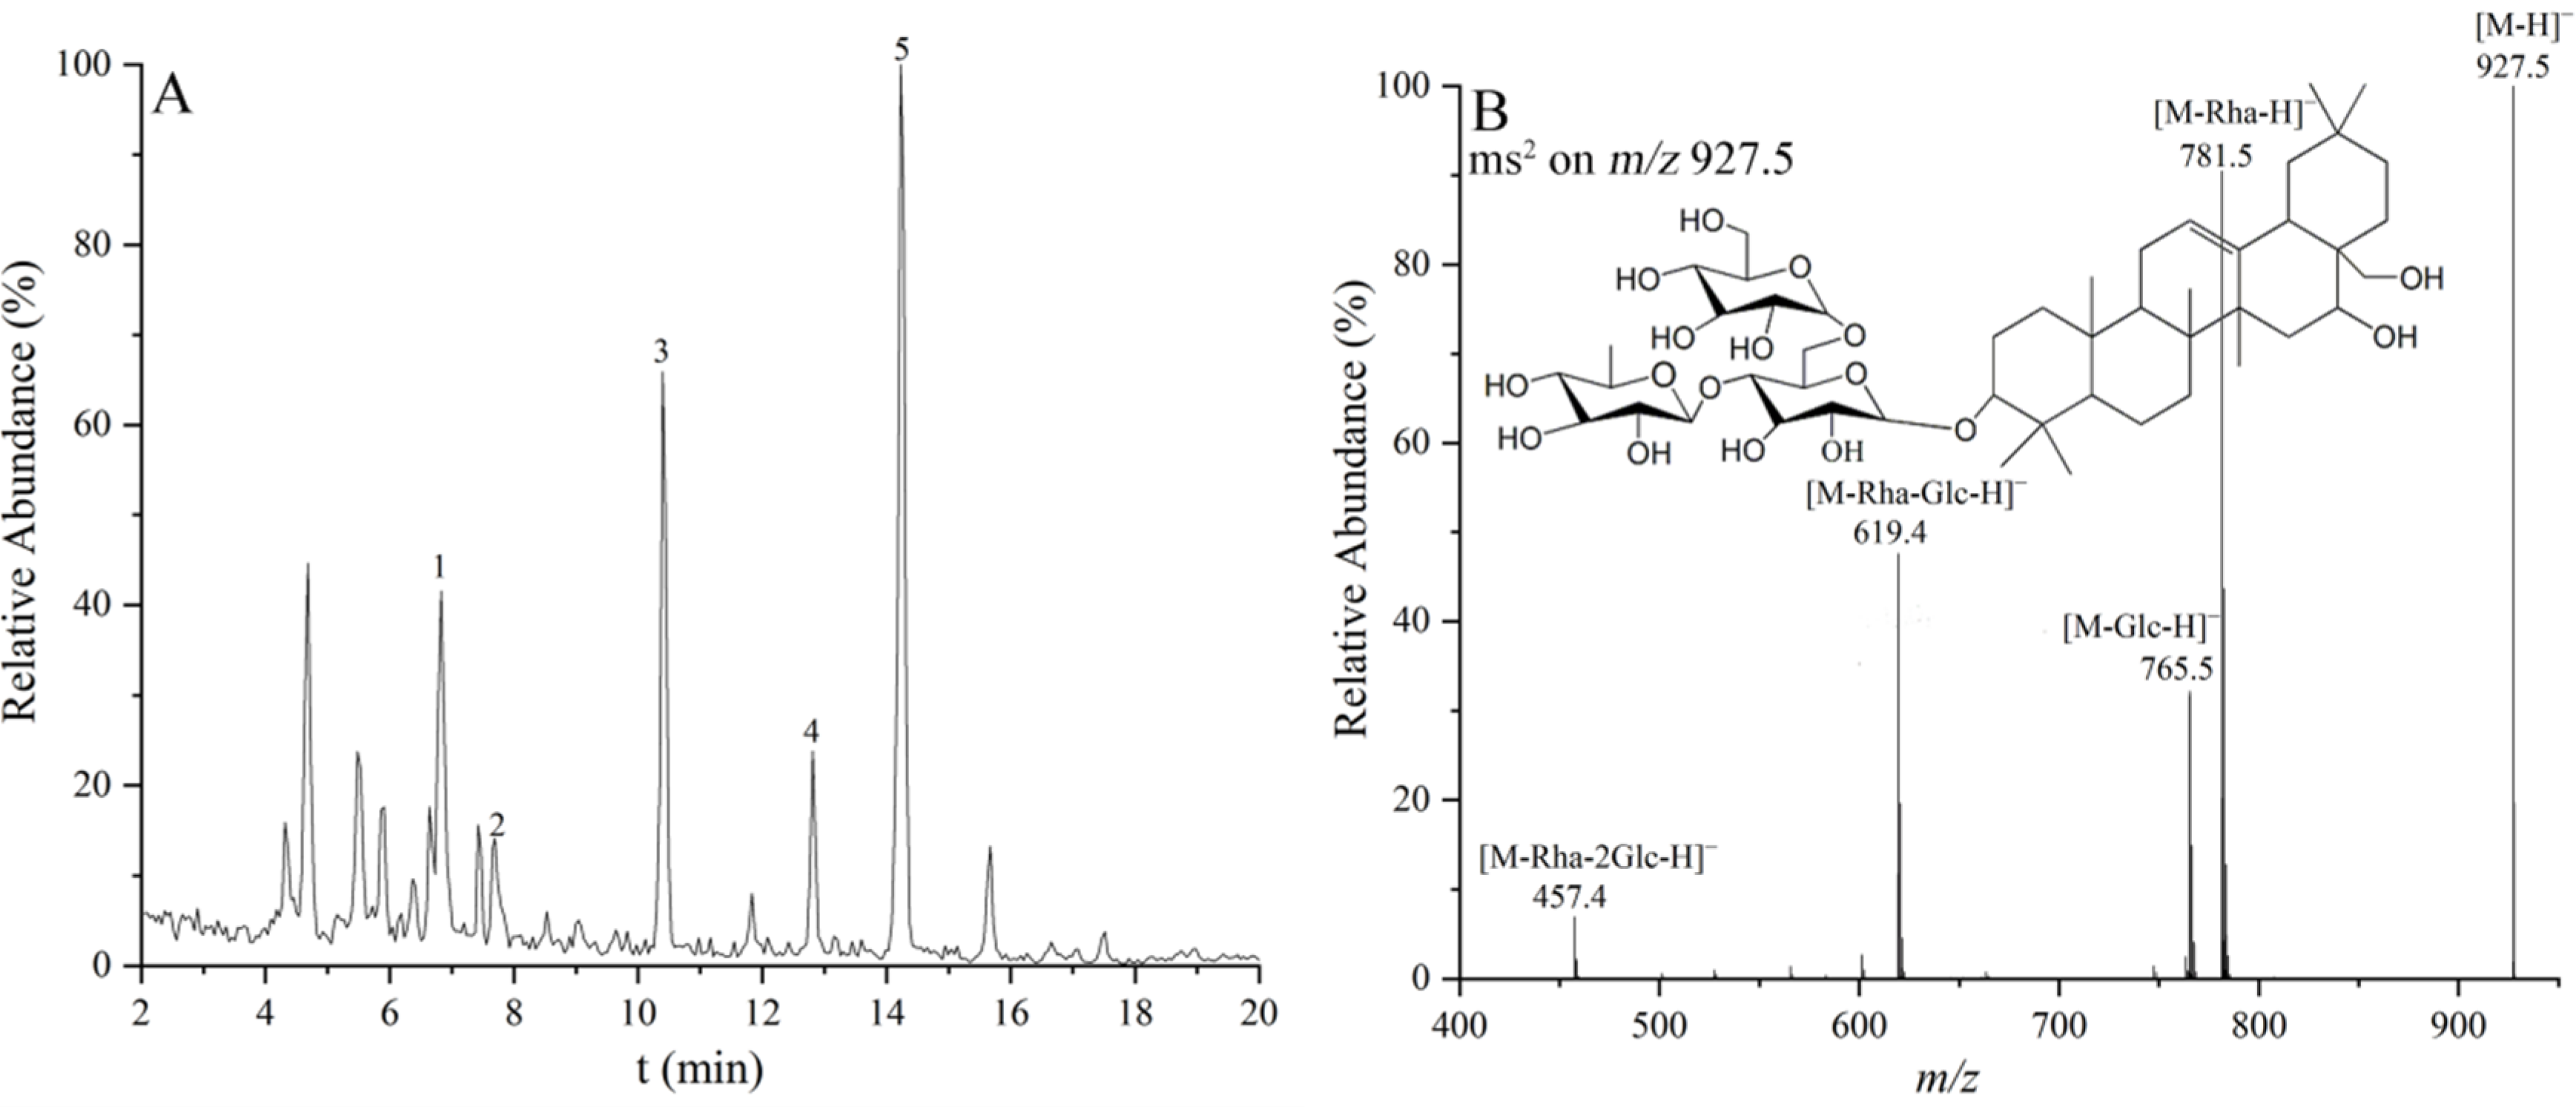
2.1.1. Identification of Five Saikosaponins in Radix Bupleuri

The negative ion mode in the electrospray ionization (ESI) ion source was used for the qualitative and quantitative analysis of saikosaponins, because it provided more direct structural information and clearer spectra than the positive ion mode [12]. Total ion chromatography (TIC) of the saikosaponins extracted from Radix Bupleuri cultivated in SA is shown as typical in Figure 2A. The peaks of the concerned saikosaponins were labeled 1–5. Their structural identification was first performed by tandem mass spectrometry as well as by comparing their retention behavior with authentic standards. In the negative ion mode, the neutral saponin molecules usually lose a proton to form [M-H] ion or loosely combine with a formate ion to form [M+HCOO] ion. This pair of quasi-molecular ions can be used to calculate the relative molecular mass and to infer the molecular formula of saponins. The deprotonation process is endothermic and reduces the internal energy of saponin molecules. It results in the need to obtain additional energy and limited chemical bond cleavage upon collision-induced dissociation. Therefore, the tandem MS analysis of the saponins in the negative ion mode was mainly observed for the product ions resulting from the cleavage of glycosidic bonds [23]. These ions can provide valuable information on the kind of glycosyl substituent.
Taking peak 2 as an example, its relative molecular mass was calculated to be 928.5, and the empirical molecular formula was C48H80O17. Four product ions at m/z 781.5, m/z 765.5, m/z 619.4, and m/z 457.4 were observed in the MS/MS spectrum of its [M-H] ion at m/z 927.5, as shown in Figure 2B. The neutral loss of 162 Da and 146 Da between the four ions indicated the presence of two hexose and one deoxyhexose substituents in the structure of peak 2. Therefore, these ions were assignable to [M-Rha-H], [M-Glc-H], [M-Rha-Glc-H], and [M-Rha-2Glc-H] ions, respectively. The coexistence of the [M-Rha-H] and [M-Glc-H] ions demonstrated the presence of two terminal substituents, namely rhamnose and glucose residues. Moreover, the intensity of the [M-Rha-H] ion was significantly higher than that of the [M-Glc-H] ion, suggesting that the rhamnose terminal was more easily dissociated than the glucose terminal. Therefore, as compared to the authentic standard, peak 2 was clearly attributed to saikosaponin f (SSf), and the other four peaks were further identified as saikosaponin c (SSc), SSa, saikosaponin e (SSe), and SSd sequentially, whose structures and spectra information are shown in Figure 1 and Table 1. The above structural analysis rationalized the results of the MRM optimization, indicating that product ions were mainly generated by glycosyl fragmentation, as well as the selection of product ion I and II. Two ion pairs, that is precursor ion combined with product ion I and product ion II, respectively, are usually selected to improve the accuracy of quantification in MRM analysis, where the product ion I is usually the ion of highest intensity and also used for the qualitative analysis of the target compound. For example, the [M-Rha-H] ion of SSf was selected as the dominant product ion I rather than the [M-Glc-H] ion, as shown in the Materials and Methods section.
At present, more than 100 saikosaponins have been isolated from Radix Bupleuri and its processed products, but most of their contents are too low in the original medicinal materials to be easily extracted and separated [24]. In this study, SSa, SSc, SSd, SSe, and SSf were chosen for the quantitative experiments. This is because SSa, SSc, and SSd are the representative saikosaponins with high content and good pharmacological activity. On the other hand, SSe and SSf were reported to have good immunomodulatory effects, indicating that they are potential pharmaceutically active candidates for traditional Chinese medicine [25].
Saikosaponins were extracted from Radix Bupleuri using a developed ultrasonic extraction method. The parameters of extraction time, solvent, and solid/liquid ratio that affect the total contents of the five saikosaponins were investigated under different conditions. As shown in Figure S1, the optimized extraction conditions were found at an extraction time of 60 min and solid/liquid ratio of 50 mg/g using 15% ammonia methanol solution. Compared with the traditional heat-reflux extraction method, the established ultrasonic extraction method was more convenient, efficient, and time-saving, and could protect the active components from decomposition [26]. On the other hand, volatile compounds were extracted by the steam distillation method recorded in Chinese Pharmacopoeia without developing and optimizing a new method. This is because among the few extraction methods for volatile components from Radix Bupleuri, steam distillation is recognized as the most effective one. In addition, there have been many reports on the extraction of volatile components using steam distillation [27,28].

2.1.2. Validation of Quantitative Method

As observed in Figure 2A, most of the saikosaponins could be well separated within 20 min, providing a basis for the accuracy of the HPLC-based quantitative method. The linearity, precision, repeatability, stability, and recovery of the established HPLC-MRM/MS method were evaluated to validate the feasibility of quantitative analysis. As shown in Table 2, the calibration curves of the five saikosaponins had good linearity in a wide range of up to three orders of magnitude with correlation coefficients (R2) greater than 0.9940. Moreover, the limit of detection (LOD) and limit of quantification (LOQ) were as low as 0.005 and 0.017 μg/mL, respectively, indicating a good sensitivity for the detection of saikosaponins. As Table 3 shows, the intraday and interday precision, repeatability, and stability of the five saikosaponins were all less than 4%. Additionally, the average recoveries were between 95.55% and 103.20% with relative standard deviation (RSD) of less than 4% on the three amount levels. Together, these validated results proved the developed HPLC-MRM/MS method to be suitable for the simultaneous determination of the five saikosaponins in Radix Bupleuri extract.

2.1.3. Quantitative Analysis of Five Saikosaponins in Radix Bupleuri Cultivated in Different Regions

The validated HPLC-MRM/MS method was used for the quantitative determination of the five saikosaponins in Radix Bupleuri samples from seven different regions. The contents of the saponins are expressed as mean ± standard deviation in Table S1 and boxplots in Figure 3, respectively. It can be seen from Figure 3 that the contents of the five saikosaponins varied by cultivation region. Among them, Radix Bupleuri harvested from Shouyang County (SA) in Gansu Province had the highest saikosaponin content, followed by harvested samples from Wanrong County (WR) and Xinjiang County (XJ) in Shanxi Province, Qingyang City (QY) in Gansu Province, Wuzhong City (WZ) in Ningxia Province, and Sanyuan County (SY) in Shaanxi Province, while the samples from Chengde City (CD) in Hebei Province had the lowest saikosaponin content. The five saikosaponins showed the same trend as the total saikosaponins in content between different cultivation regions. Analysis of variance (ANOVA) was conducted to investigate the effect of cultivation region on the contents of individual and total saikosaponins. The results in Table S2 show that the contents of SSa, SSc, SSd, SSe, and SSf as well as their total contents were significantly affected by the cultivation region. Although they were all Bupleurum plants, the quality of Radix Bupleuri cultivated in different regions was quite different, which may be attributed to a combination of factors, such as the germplasm of the Radix Bupleuri planted and the climate and soil in the growing area. Moreover, the contents of SSa and SSd accounted for an average of 35.0% and 53.7% of the total saikosaponins, respectively, indicating that they accounted for most of the saponins in Radix Bupleuri. While the sum of the contents of SSc, SSe, and SSf accounted for about 11.3% on average, these three saikosaponins also contributed significantly to the total saponin content and could be used as indicators to evaluate the quality of Radix Bupleuri.

2.2. Differential Analysis of Radix Bupleuri from Different Cultivation Regions Based on HPLC-MS and GC-MS Analysis

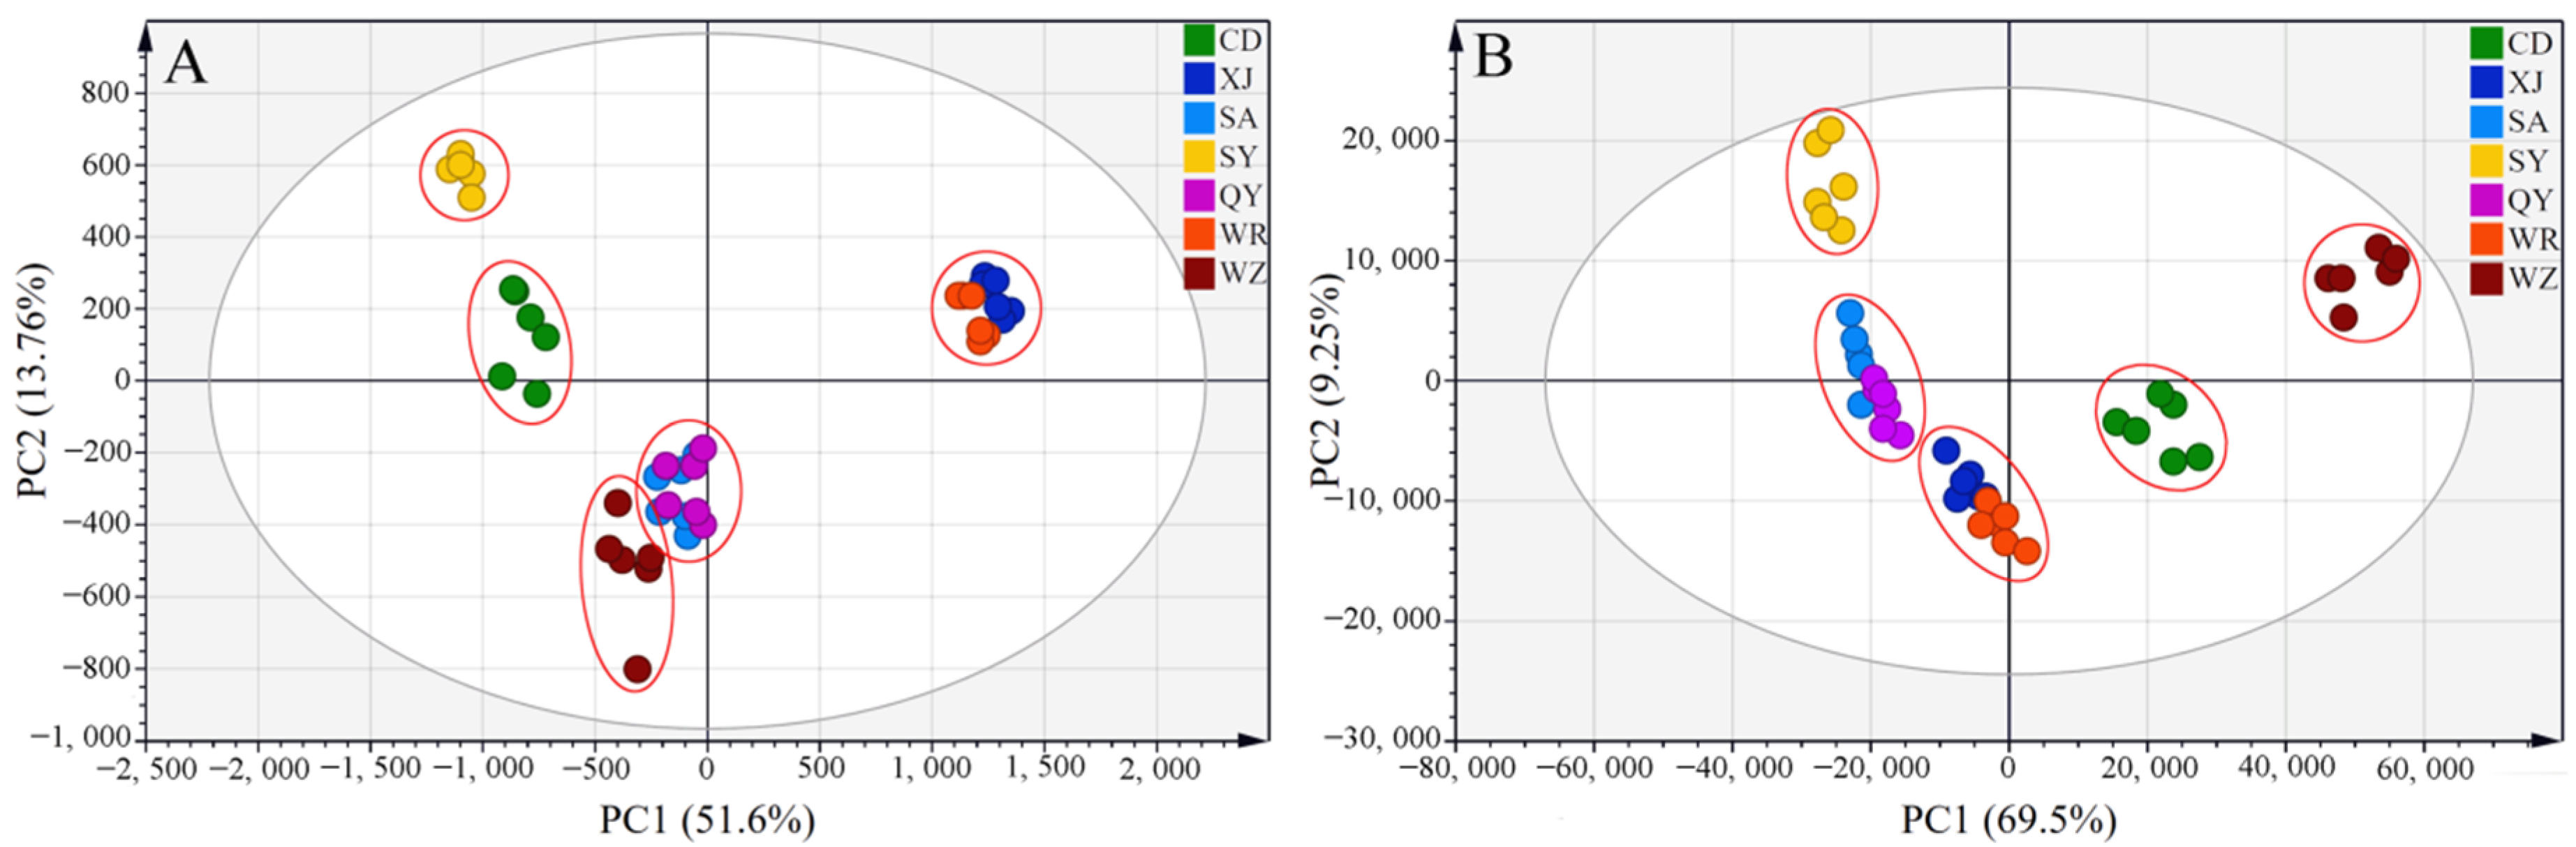
2.2.1. Principal Component Analysis

The saikosaponins and volatile compounds in the Radix Bupleuri samples from all seven cultivation regions were analyzed by HPLC-MS and GC-MS, respectively, and the resulting TICs are shown in Figure 4. All of these extracts exhibited diverse compositions and complex spectra. In addition, the high similarity of the spectra of saikosaponins made them difficult to be distinguished directly by TIC. Moreover, although the spectra of the volatile compounds were less similar, the differential compounds could not be accurately identified. Therefore, the HPLC-MS and GC-MS datasets were converted and subjected to multivariate statistical analysis to distinguish Radix Bupleuri samples from different cultivation regions and to identify the differential characteristics of saikosaponins and volatile compounds.
Principal component analysis (PCA) is an unsupervised pattern recognition technique that preserves the original data as much as possible. It employs a few comprehensive indicators to explain multiple variables with specific correlations in order to reduce the dimensionality of complex data and to observe the correlation between samples. Figure 5A,B illustrate PCA score plots of saikosaponins and volatile compounds extracted from the Radix Bupleuri samples cultivated in different regions, respectively. All of the samples were free of outliers at 95% confidence interval. In Figure 5A, the first and the second principal components described 51.6% and 13.76% of the total variables of the HPLC-MS datasets, respectively, that is, a total of 65.36% of the original variables, while in Figure 5B, they accounted for 78.75% of the total variables of the GC-MS datasets. The Radix Bupleuri samples from the same regions clustered together in Figure 5A,B, indicating the homogeneous quality of these samples that were grown in similar environments. It is worth noting that neither the XJ and WR samples harvested from Shanxi Province nor the SA and QY samples harvested from Gansu Province could be distinguished from each other. This indicated that Radix Bupleuri samples grown in the same province were similar in terms of saikosaponins and volatile compounds. Therefore, all of the samples were clearly divided into five groups according to the province where they were grown, suggesting the Radix Bupleuri samples cultivated in different provinces were significantly different in terms of their saikosaponin and volatile compound contents. In Figure 5A, the WZ samples grown in Ningxia Province are distributed near the SA and QY samples that were cultivated in Gansu Province. This may be attributed to the geographical proximity of Ningxia and Gansu Province, which is conducive to the development of a similar climate and natural environment in these regions. However, the samples from these two regions were separated distinctly in Figure 5B, indicating that cultivation region is only one of many factors that help to determine the chemical composition of Radix Bupleuri.

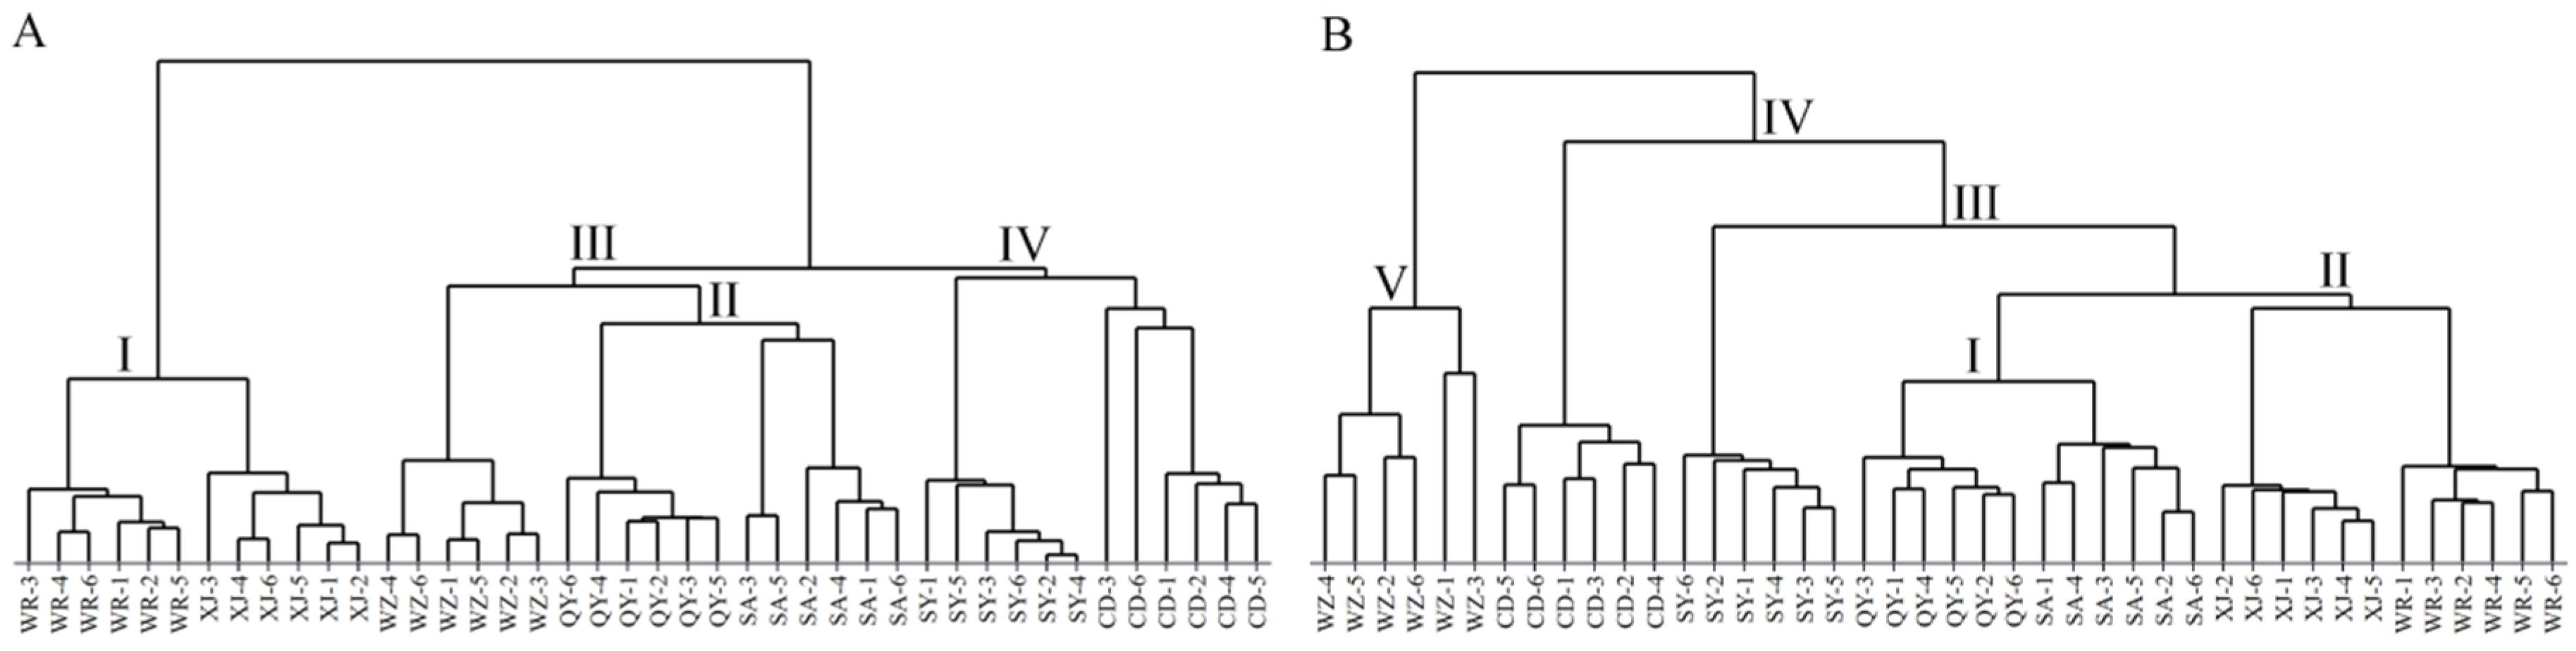
2.2.2. Hierarchical Cluster Analysis

Hierarchical cluster analysis (HCA) is another unsupervised pattern recognition method that classifies samples into relatively uniform categories based on the similarity of data [29]. The dendrograms of HCA were generated using the converted HPLC-MS and GC-MS datasets of all of the collected Radix Bupleuri samples, the results of which are shown in Figure 6. All of the samples were able to be classified individually based on their cultivation regions, further demonstrating the high similarity of saikosaponins and volatile compounds in Radix Bupleuri samples cultivated in the same region. In Figure 6A, the WR and XJ samples and the QY and SA samples were first classified as cluster I and II, respectively, indicating that the similarity of saponins in Radix Bupleuri from the same province was higher than that in samples from different provinces. The WZ samples were similar to cluster II, with which they were classified as cluster III. The CD and SY samples were classified in cluster IV and were far away from cluster I. Notably, both WR and XJ were geographically located between SY and CD, but the similarity of the saikosaponins in their samples was not high, indicating that geographical distance was not a decisive factor affecting the similarity of saikosaponins in Radix Bupleuri samples from different cultivation regions. In Figure 6B, all of the samples could still be preferentially classified according to the province where they were grown, showing a high similarity in volatile compounds of Radix Bupleuri from the same province. Cluster I and II gathered from the samples of Gansu and Shanxi Province, respectively, were classified with the SY samples as cluster III and subsequently with the CD samples as cluster IV. Additionally, the WZ samples were included in cluster V alone, indicating that their volatile compounds were less similar to those from the other six regions.

2.2.3. Partial Least Squares-Discriminate Analysis

Partial least squares-discriminate analysis (PLS-DA), a supervised pattern recognition technique, was conducted in an effort to discover characteristic differences and composition variations between Radix Bupleuri samples from different regions. Two PLS-DA models were generated first based on the converted HPLC-MS and GC-MS datasets to find the most discriminating features in saikosaponins and volatile compounds of the collected Radix Bupleuri samples, respectively. The quality of the two models was described by R2 and Q2 values via cross-validation. R2 indicates the explanatory power of the model, while Q2 indicates the extent to which the model predicts new data. The score plots illustrated the clustering of the Radix Bupleuri samples from different origins with the model parameters of R2 = 0.985 and Q2 = 0.906 for the HPLC-MS dataset (Figure 7A) and R2 = 0.963 and Q2 = 0.927 for the GC-MS dataset (Figure 7B), respectively. These parameters revealed high goodness of fit and high predictive ability of both PLS-DA models. Permutation tests were further conducted with 200 random permutations to validate each PLS-DA model. As shown in Figure S1, all of the permuted R2 and Q2 values were lower than those in the original models, and the regression line of the permuted Q2 values intersected with the vertical axis below 0, which indicated the validity of these two models. The XJ and WR samples as well as the SA and QY samples were found to be still indistinguishable in Figure 7 even under the mandatory grouping conditions of PLS-DA, indicating the quality of Radix Bupleuri grown in these two provinces was extremely similar. The samples were distinctly divided into five groups according to the province where they were grown, indicating that the provinces where the Radix Bupleuri samples were grown could be discriminated using these models.
In order to select the saponins and volatile compounds that contributed significantly to the grouping, variable importance for projection (VIP) values were calculated from the PLS-DA models. VIP values indicate the importance of the variable to explain the dataset and to the critical influence on grouping. In the loading plots, the further away from the origin, the greater the contribution of the variables to the discrimination of groups. By combining the loading plots in Figure 8, saponins and volatile compounds with VIP > 1, were selected as differential components. Finally, fifty-eight volatile compounds were obtained and identified by means of retrieval of MS spectra from the NIST database, while twenty-eight saponins were identified using literature data with references, and the identification of the five quantified saikosaponins was further confirmed using standard comparison. Then, the Student’s t-tests showed that these compounds were significantly different (p < 0.05) at least between two cultivation regions. The information on the identified compounds is listed in Table 4 and Table 5. Among the twenty-eight saponins, twenty-two belonged to triterpenoid saponins and their derivatives. Additionally, most of the fifty-eight volatile components were aliphatic compounds, as well as some alcohols, aldehydes, and terpenoids. The number of differential components for volatile compounds was much greater than that for saponins, indicating that the cultivation region has a strong influence on the kind and content of volatile components in Radix Bupleuri.

3. Materials and Methods

3.1. Materials and Chemicals

Forty-two batches of Radix Bupleuri samples that were cultivated for two years were collected during September and October in 2021 from different cultivation regions in China, including Sanyuan County (SY) in Shaanxi Province, Shouyang County (SA) and Qingyang City (QY) in Gansu Province, Xinjiang County (XJ) and Wanrong County (WR) in Shanxi Province, Chengde City (CD) in Hebei Province, and Wuzhong City (WZ) in Ningxia Province. Their botanical origins were all authenticated to Bupleurum chinense DC by Professor Shumin Wang of Changchun University of Chinese Medicine, China. Authentic standards of SSa, SSd, SSc, SSe, and SSf were purchased from Shanghai Yuanye Biological Technology Co., Ltd. (Shanghai, China). HPLC-grade methanol, acetonitrile, and n-hexane were acquired from Tedia Company, Inc. (Fairfield, CT, USA), while formic acid was purchased from Thermo Fisher Scientific (Waltham, MA, USA). Analytical grade methanol, ammonia, and n-butanol were bought from Beijing Chemical Industry Group Co, Ltd. (Beijing, China). Ultrapure water was prepared by Milli-Q water purification apparatus (Merck Millipore, Bedford, OH, USA).

3.2. Preparation of Sample and Standard Solutions

3.2.1. Extraction of Saikosaponins from Radix Bupleuri

All of the Radix Bupleuri samples were washed, dried in the shade, and then pulverized to 40 mesh. A 0.5 g amount of Radix Bupleuri powder was accurately weighed and mixed with 25 mL of 15% ammonia-methanol solution. The solution was extracted using an ultrasonic bath for 60 min at room temperature followed by filtration. The extraction procedure was repeated twice in the same conditions. The filtrate from two extractions were combined and dried through rotary evaporation. The resulting residue was dissolved in 5 mL of n-butanol. After centrifugation at 7000 rpm for 5 min, the supernatant was evaporated to dryness and then fully redissolved in HPLC-grade methanol to a constant volume.

3.2.2. Extraction of Volatile Compounds from Radix Bupleuri

Volatile compounds were extracted from Radix Bupleuri by steam distillation. Typically, 25.0 g of Radix Bupleuri powder was immersed in 250 mL of ultrapure water for 12 h. The volatile oil determination apparatus was filled with water and sealed with 2 mL of n-hexane. After steam distillation for 8 h, the n-hexane layer was collected and dehydrated using anhydrous magnesium sulfate. The solution was then transferred to a 10 mL volumetric flask and filled up with n-hexane.

3.2.3. Preparation of Standard Solutions

The single standard solutions were prepared by individually dissolving accurately weighed 1.0 mg of authentic saikosaponin standard in 10 mL of HPLC-grade methanol, and then were used to optimize the MRM parameters, including the precursor and product ions, as well as the collision energy. All of the saikosaponin standards were dissolved in 2 mL of methanol to prepare the mixed standard stock solutions, which were diluted into a series of mixed standard solutions at different concentration levels to establish the calibration curves. All of the prepared samples and standard solutions were filtered through a 0.22 μm filter membrane prior to MS analysis.

3.3. Chromatography-Based MS Conditions

3.3.1. HPLC-MS Conditions

HPLC analysis was performed on an Ultimate 3000 system (Thermo Fisher Scientific Inc, San Jose, CA, USA) equipped with a quaternary bump, an online vacuum degasser, an autosampler, and a thermostatically controlled column compartment that worked at the temperature of 25 °C. A Thermo Syncronis C18 column (100 mm × 2.1 mm, 1.7 μm) was used to separate the analytes with the following gradient elution: 0–20 min, 35–90% A; 20–20.5 min, 90–35% A; 20.5–25 min, 35% A, where the mobile phase A and B were acetonitrile and 0.1% (v/v) formic acid aqueous solution, respectively. The analytes were delivered at a flow rate of 0.2 mL/min. The injected sample volume was 2 μL.
MS analysis was performed using a TSQ Endura triple quadrupole mass spectrometer (Thermo Fisher Scientific Inc., San Jose, CA, USA), which was coupled with HPLC apparatus via an ESI ion source. Nitrogen was supplied as sheath gas, auxiliary gas, and sweep gas in the ion source at a flow rate of 35, 10, and 1 arbitrary units. The analytes were detected in the negative ion mode with optimized capillary temperature, spray voltage, and vaporizer temperature at 325 °C, −2500 V, and 290 °C. Ultrapure argon was used as the collision gas for the collision-induced dissociation experiment. The optimization of MRM parameters was performed using the built-in program when introducing a single standard solution into the ion source via an infusion pump. Two ion pairs and the corresponding collision energy were selected for quantification (Table 6). Full scan mode was run in the range of m/z 100 to 2000 with a scan speed of 1000 Da/s, and data were collected automatically in centroid mode.

3.3.2. GC-MS Conditions

GC-MS analysis was performed using a Trace 1310 gas chromatograph coupled with TSQ 8000 triple quadrupole mass spectrometer (Thermo Fisher Scientific Inc., San Jose, CA, USA) equipped with an HP-5MS capillary column (30 m × 0.25 mm, 0.25 μm) (Agilent Technologies, Santa Clara, CA, USA). Ultrapure helium was used as the carrier gas with a flow rate of 1.2 mL/min. The temperatures of injector, MS transfer line, and ion source were set as 250 °C, 230 °C, and 230 °C, respectively. The injection volume was 1 μL, which was split in the ratio of 20:1. The oven temperature was programmed to hold initially at 60 °C for 2 min, then increase from 60 °C to 140 °C at 15 °C/min followed by a hold at 140 °C for 2 min, then increase from 140 °C to 180 °C at 5 °C/min followed by a hold at 180 °C for 3 min, and then increase from 180 °C to 250 °C at 10 °C/min with a final hold at 250 °C for 10 min. MS was performed in full scan mode with the mass range of m/z 100 to 700, using an electron impact ion source operated at 70 eV.

3.4. Validation of Methodology

The calibration curves of saikosaponins were established by linearity fitting of eight mixed standard solutions of different concentrations. The LOD and LOQ were determined at the signal to noise ratios of 3 and 10, respectively. The stability was validated by analyzing the variations in saikosaponin content in a freshly extracted sample solution from 0 h to 24 h at 4 h intervals. Variations were expressed by RSD. The precision was evaluated by the intraday and interday variations of the saikosaponin content in extracted samples, which were measured six times in one day and were measured three times a day for three consecutive days. One Radix Bupleuri sample was divided into six equal parts, with the saikosaponin in each extracted and analyzed to evaluate the repeatability based on the variations in saikosaponin content between each part. The accuracy was assessed by the recovery of the spiked saikosaponin standards from Radix Bupleuri powder. The standards were spiked at three amount levels, which were approximately equal to 80%, 100%, and 120% of the original content of each saikosaponin in the extract, and three replicates of each amount level were tested. The recovery was calculated as follows: recovery (%) = 100 × (found content-original content)/spiked content.

3.5. Data Processing and Statistical Analysis

The peak areas in TIC of the detected saikosaponins were integrated automatically using Qual Browser in Xcalibur software (version 2.2 SP1.48, Thermo Fisher Scientific Inc, San Jose, CA, USA). The saikosaponin contents were calculated by substituting the peak areas into the established calibration curve equations. Each Radix Bupleuri sample was quantitatively analyzed in triplicate. The saikosaponin contents were expressed as mean and standard deviation and subjected to analysis of variance (ANOVA) and box-plot analysis using OriginPro software (version 9.1, OriginLab Corporation, Northampton, MA, USA). HPLC-MS and GC-MS data were recorded automatically by Xcalibur software and processed by SIEVE software (Version 2.1, Thermo Fisher Scientific Inc., San Jose, CA, USA) for peak matching, peak alignment, and peak area normalization. Additionally, a data table containing sample name, retention time, m/z, and peak intensity was obtained. Data from isotope peaks and missing values greater than 80% were removed. The remaining data were imported into SIMCA-P software (Version 14.1, Umetrics, Umeå, Sweden) and converted for multivariate statistical analysis, including PCA, HCA, and PLS-DA.

3.6. General Process of Compound Identification

The saponins were analyzed by HPLC-MS in negative ion mode of ESI ion source to obtain the information on the retention time and the quasi-molecular ion pair of [M-H] ion and [M+HCOO] ion, which were used to calculate the relative molecular mass and infer the molecular formula. Then, tandem MS analysis was performed using collision-induced dissociation at different collision energies to observe the fragment ions. Based on the neutral loss between fragment ions, the number and type of glycosyl substituents in saponins were summarized. The characteristic aglycone ion observed at high collision energy was indicative of the types of saponins. Combining the above structural information with the literature data, the structure of saponins could be identified. For the identification of volatile compounds, the obtained GC-MS data were directly subjected to NIST 14 database to search for the matching compounds by comparing their mass spectra.

4. Conclusions

The present study was designed to determine the effect of cultivation region on the accumulation of saponins and volatile compounds in Radix Bupleuri. As a proof of concept, forty-two batches of Radix Bupleuri samples were harvested from seven regions in northwest China and processed to extract saikosaponins and volatile compounds, which were analyzed by HPLC-MS and GC-MS, respectively. The results of quantitative analysis showed that the cultivation region made a significant difference on the content of SSa, SSc, SSd, SSe, and SSf, which were determined through an established HPLC-MRM/MS method. The Radix Bupleuri grown in SA county had the highest content of saikosaponins among all of the collected samples. In addition, the HPLC-MS and GC-MS datasets contained variables that related to the cultivation regions. The Radix Bupleuri samples were able to be discriminated based on their cultivation regions using multivariate statistical analysis of the chromatography-based MS datasets. PCA and HCA confirmed significant differences between samples of Radix Bupleuri cultivated in different provinces, whereas samples from the same province showed a significant similarity to each other. Twenty-eight saponins and fifty-eight volatile compounds were identified as the differentially accumulated components that contributed significantly to the discrimination of cultivation regions. These results suggest the approach in the present study will prove useful in discriminating the cultivation regions of Radix Bupleuri. Moreover, the cultivation region is one of the critical factors affecting the quality of Radix Bupleuri, and volatile compounds are also important indexes for its quality assessment. Considerably more work will need to be done to elucidate the effect of regional difference on the active components in Radix Bupleuri from the perspective of plant growth and metabolic pathways combined with climate and geographical factors.

Supplementary Materials

The following supporting information can be downloaded at: https://www.mdpi.com/article/10.3390/molecules27154830/s1, Figure S1: Optimization of the parameters of extraction time (A), concentration of solvent (B), and solid-liquid ratio (C) for the developed ultrasonic extraction method investigated in different conditions; Figure S2: Permutation tests of PLS-DA models derived from the HPLC-MS datasets of saikosaponins (A) and the GC-MS datasets of volatile compounds (B) in the Radix Bupleuri samples; Table S1: The contents of the five and total saikosaponins in Radix Bupleuri that were cultivated in different regions; Table S2: ANOVA of the effects of cultivation region on saikosaponin content.

Author Contributions

Conceptualization, Z.W., H.Z. and Y.X. (Yang Xiu); Formal analysis, H.Z. and Y.X. (Yusheng Xiao); Funding acquisition, S.L. and Y.X. (Yang Xiu); Methodology, Z.W., L.T. and M.Z.; Software, H.Z.; Supervision, S.L.; Validation, Z.W., H.Z. and M.Z.; Writing—original draft, Z.W. and H.Z.; Writing—review and editing, Y.X. (Yang Xiu). Z.W. and H.Z. contributed equally to this paper. All authors have read and agreed to the published version of the manuscript.

Funding

This work was funded by the Science and Technology Development Plan of Jilin Province of China (20200201093JC and 20210204098YY) and the National Natural Science Foundation of China (21475012).

Institutional Review Board Statement

Not applicable.

Informed Consent Statement

Not applicable.

Data Availability Statement

Not applicable.

Conflicts of Interest

The authors declare no conflict of interest.

References

  1. Jiang, H.; Yang, L.; Hou, A.; Zhang, J.; Wang, S.; Man, W.; Zheng, S.; Yu, H.; Wang, X.; Yang, B.; et al. Botany, traditional uses, phytochemistry, analytical methods, processing, pharmacology and pharmacokinetics of Bupleuri Radix: A systematic review. Biomed. Pharmacother. 2020, 131, 110679. [Google Scholar] [CrossRef] [PubMed]
  2. Li, X.; Li, X.; Huang, N.; Liu, R.; Sun, R. A comprehensive review and perspectives on pharmacology and toxicology of saikosaponins. Phytomedicine 2018, 50, 73–87. [Google Scholar] [CrossRef]
  3. Yang, L.; Zhao, Y.; Zhang, Q.; Cheng, L.; Han, M.; Ren, Y.; Yang, L. Effects of drought-re-watering-drought on the photosynthesis physiology and secondary metabolite production of Bupleurum chinense DC. Plant Cell Rep. 2019, 38, 1181–1197. [Google Scholar] [CrossRef]
  4. Yang, L.-L.; Yang, L.; Yang, X.; Zhang, T.; Lan, Y.-M.; Zhao, Y.; Han, M.; Yang, L.-M. Drought stress induces biosynthesis of flavonoids in leaves and saikosaponins in roots of Bupleurum chinense DC. Phytochemistry 2020, 177, 112434. [Google Scholar] [CrossRef]
  5. Zhang, W.; Gong, J.; Zhao, J.; Li, Y.; Liu, M.; Yang, L.; Yang, B.; Zhang, Z. What degree of light deficiency is suitable for saikosaponin accumulation by Bupleurum chinense DC. Ind. Crop. Prod. 2018, 122, 392–401. [Google Scholar] [CrossRef]
  6. Sun, P.; Li, Y.; Wei, S.; Zhao, T.; Wang, Y.; Song, C.; Xue, L.; Wang, F.; Xiao, L.; Wu, J.; et al. Pharmacological Effects and Chemical Constituents of Bupleururn. Mini-Rev. Med. Chem. 2019, 19, 34–55. [Google Scholar] [CrossRef]
  7. Xia, Z.; Liu, X.; Tong, L.; Wang, H.; Feng, M.; Xi, X.; He, P.; Qin, X. Comparison of chemical constituents of Bupleurum marginatum var. stenophyllum and Bupleurum chinense DC. using UHPLC-Q-TOF-MS based on a metabonomics approach. Biomed. Chromatogr. 2021, 35, e5133. [Google Scholar] [CrossRef]
  8. Lu, C.N.; Yuan, Z.G.; Zhang, X.L.; Yan, R.; Zhao, Y.Q.; Liao, M.; Chen, J.X. Saikosaponin a and its epimer saikosaponin d exhibit anti-inflammatory activity by suppressing activation of NF-κB signaling pathway. Int. J. Immunopharmacol. 2012, 14, 121–126. [Google Scholar] [CrossRef]
  9. Wang, A.; Mi, L.; Zhang, Z.; Hu, M.; Zhao, Z.; Liu, B.; Li, Y.; Zheng, S. Saikosaponin A improved depression -like behavior and inhibited hippocampal neuronal apoptosis after cerebral ischemia through p-CREB/BDNF pathway. Behav. Brain Res. 2021, 403, 113138. [Google Scholar] [CrossRef] [PubMed]
  10. Kim, S.O.; Park, J.Y.; Jeon, S.Y.; Yang, C.H.; Kim, M.R. Saikosaponin a, an active compound of Radix Bupleuri, attenuates inflammation in hypertrophied 3T3-L1 adipocytes via ERK/NF-κB signaling pathways. Int. J. Mol. Cell. Med. 2015, 35, 1126–1132. [Google Scholar] [CrossRef] [Green Version]
  11. Wang, B.F.; Dai, Z.J.; Wang, X.J.; Bai, M.H.; Lin, S.; Ma, H.B.; Wang, Y.L.; Song, L.Q.; Ma, X.L.; Zan, Y.; et al. Saikosaponin-d increases the radiosensitivity of smmc-7721 hepatocellular carcinoma cells by adjusting the g0/g1 and g2/m checkpoints of the cell cycle. BMC Complem. Altern. Med. 2013, 13, 263. [Google Scholar] [CrossRef] [PubMed] [Green Version]
  12. Liu, W.; Cheng, X.; Kang, R.; Wang, Y.; Guo, X.; Jing, W.; Wei, F.; Ma, S. Corrigendum: Systematic Characterization and Identification of Saikosaponins in Extracts from Bupleurum marginatum var. stenophyllum Using UPLC-PDA-Q/TOF-MS. Front. Chem. 2022, 10, 867617. [Google Scholar] [CrossRef] [PubMed]
  13. The State Pharmacopoeia Commission of P. R. China. Pharmacopoeia of the People’s Repubilic of China; Chemical Industry Press: Beijing, China, 2020; Volume 1, p. 232. [Google Scholar]
  14. Ashour, M.L.; Wink, M. Genus Bupleurum: A review of its phytochemistry, pharmacology and modes of action. J. Pharm. Pharmacol. 2011, 63, 305–321. [Google Scholar] [CrossRef] [PubMed]
  15. Liu, S.; Lu, S.; Su, Y.; Guo, Y. Analysis of Volatile Compounds in Radix Bupleuri Injection by GC-MS-MS. Chromatographia 2011, 74, 497–502. [Google Scholar] [CrossRef]
  16. Chen, W.; Balan, P.; Popovich, D.G. Ginsenosides analysis of New Zealand-grown forest Panax ginseng by LC-QTOF-MS/MS. J. Ginseng Res. 2020, 44, 552–562. [Google Scholar] [CrossRef]
  17. Zhao, H.; Wang, Q.; Sun, X.; Li, X.; Miao, R.; Wu, D.; Liu, S.; Xiu, Y. Discrimination of Ginseng Origins and Identification of Ginsenoside Markers Based on HPLC-MS Combined with Multivariate Statistical Analysis. Chem. J. Chin. Univ.-Chin. 2019, 40, 246–253. [Google Scholar] [CrossRef]
  18. Xiu, Y.; Li, X.; Sun, X.; Xiao, D.; Miao, R.; Zhao, H.; Liu, S. Simultaneous determination and difference evaluation of 14 ginsenosides in Panax ginseng roots cultivated in different areas and ages by high-performance liquid chromatography coupled with triple quadrupole mass spectrometer in the multiple reaction-monitoring mode combined with multivariate statistical analysis. J. Ginseng Res. 2019, 43, 508–516. [Google Scholar] [CrossRef]
  19. Li, X.Q.; He, Z.G.; Bi, K.S.; Song, Z.H.; Xu, L. Essential oil analyses of the root oils of 10 Bupleurum species from China. J. Essent. Oil Res. 2007, 19, 234–238. [Google Scholar] [CrossRef]
  20. Tykheev, Z.A.; Taraskin, V.V.; Radnaeva, L.D.; Zhang, F.Q.; Chen, S.L. Composition of Lipids from Roots of Bupleurum scorzonerifolium and B. chinense. Chem. Nat. Compd+ 2017, 53, 937–938. [Google Scholar] [CrossRef]
  21. Saracoglu, H.T.; Zengin, G.; Akin, M.; Aktumsek, A. Evaluation of oil content and fatty acid composition of five endemic Bupleurum species growing in the Central Anatolia region of Turkey. Nat. Prod. Res. 2012, 26, 1188–1194. [Google Scholar] [CrossRef]
  22. Tykheev, Z.A.; Zhigzhitzhapova, S.V.; Zhang, F.; Taraskin, V.V.; Anenkhonov, O.A.; Radnaeva, L.D.; Chen, S. Constituents of Essential Oil and Lipid Fraction from the Aerial Part of Bupleurum scorzonerifolium Willd. (Apiaceae) from Different Habitats. Molecules 2018, 23, 1496. [Google Scholar] [CrossRef] [PubMed] [Green Version]
  23. Xiu, Y.; Zhao, H.; Gao, Y.; Liu, W.; Liu, S. Chemical transformation of ginsenoside Re by a heteropoly acid investigated using HPLC-MSn/HRMS. New J. Chem. 2016, 40, 9073–9080. [Google Scholar] [CrossRef]
  24. Chen, J.F.; Guo, X.Y.; Song, Y.L.; Zhao, M.B.; Tu, P.F.; Jiang, Y. MRM-based strategy for the homolog-focused detection of minor ginsenosides from notoginseng total saponins by ultra-performance liquid chromatography coupled with hybrid triple quadrupole-linear ion trap mass spectrometry. RSC Adv. 2016, 6, 96376–96388. [Google Scholar] [CrossRef]
  25. Yen, M.H.; Lin, C.C.; Yen, C.M. The immunomodulatory effect of saikosaponin derivatives and the root extract of Bupleurum kaoi in mice. Phytother. Res. 1995, 9, 351–358. [Google Scholar] [CrossRef]
  26. Liu, C.T.; Wu, C.Y.; Weng, Y.M.; Tseng, C.Y. Ultrasound-assisted extraction methodology as a tool to improve the antioxidant properties of herbal drug Xiao-chia-hu-tang. J. Ethnopharmacol. 2005, 99, 293–300. [Google Scholar] [CrossRef]
  27. Meng, J.; Chen, X.F.; Yang, W.Y.; Song, J.H.; Zhang, Y.; Li, Z.F.; Yang, X.W.; Yang, Z.G. Gas chromatography-mass spectrometry analysis of essential oils from five parts of Chaihu (Radix Bupleuri Chinensis). J. Tradit. Chin. Med. 2014, 34, 741–748. [Google Scholar] [CrossRef]
  28. Xing, J.; Sun, H.M.; Li, Z.Y.; Qin, X.M. Comparison of Volatile Components between Raw and Vinegar Baked Radix Bupleuri by GC-MS Based Metabolic Fingerprinting Approach. Evid.-Based Complement. Altern. Med. 2015, 2015, 653791. [Google Scholar] [CrossRef] [PubMed] [Green Version]
  29. Shan, S.M.; Luo, J.G.; Huang, F.; Kong, L.Y. Chemical characteristics combined with bioactivity for comprehensive evaluation of Panax ginseng C.A. Meyer in different ages and seasons based on HPLC-DAD and chemometric methods. J. Pharmaceut. Biomed. 2014, 89, 76–82. [Google Scholar] [CrossRef]
  30. Lei, T.; Chen, S.; Wang, K.; Zhang, D.; Dong, L.; Lv, C.; Wang, J.; Lu, J. Characterization and discrimination of raw and vinegar-baked Bupleuri radix based on UHPLC-Q-TOF-MS coupled with multivariate statistical analysis. Biomed. Chromatogr. 2018, 32, e4044. [Google Scholar] [CrossRef]
  31. Zhu, L.; Liang, Z.T.; Yi, T.; Ma, Y.; Zhao, Z.Z.; Guo, B.L.; Zhang, J.Y.; Chen, H.B. Comparison of chemical profiles between the root and aerial parts from three Bupleurum species based on a UHPLC-QTOF-MS metabolomics approach. BMC Complement. Altern. Med. 2017, 17, 305. [Google Scholar] [CrossRef] [Green Version]
  32. Huang, H.Q.; Zhang, X.; Lin, M.; Shen, Y.H.; Yan, S.K.; Zhang, W.D. Characterization and identification of saikosaponins in crude extracts from three Bupleurum species using LC-ESI-MS. J. Sep. Sci. 2008, 31, 3190–3201. [Google Scholar] [CrossRef] [PubMed]
Figure 1. Structure types of saikosaponins.
Molecules 27 04830 g001
Figure 2. Total ion chromatogram of the saikosaponin extraction of SA Radix Bupleuri sample detected by HPLC-MS in full scan mode (A), and MS/MS spectrum of the [M-H] ion at m/z 927.5 of peak 2 (B).
Molecules 27 04830 g002
Figure 3. Boxplots of the SSa and SSd (A), SSc, SSe, and SSf (B), and total saikosaponin (C) contents in Radix Bupleuri harvested from different cultivation regions.
Molecules 27 04830 g003
Figure 4. HPLC-MS analysis of the saikosaponins (A) and GC-MS analysis of the volatile compounds (B) in the Radix Bupleuri samples from different cultivation regions.
Molecules 27 04830 g004
Figure 5. PCA score plots of Radix Bupleuri cultivated in different regions derived from the HPLC-MS datasets of saikosaponins (A) and the GC-MS datasets of volatile compounds (B).
Molecules 27 04830 g005
Figure 6. Dendrograms of Radix Bupleuri samples cultivated in different regions constructed by HCA with the HPLC-MS datasets of saikosaponins (A) and the GC-MS datasets of volatile compounds (B).
Molecules 27 04830 g006
Figure 7. PLS-DA scores plots derived from the HPLC-MS datasets of saikosaponins (A) and the GC-MS datasets of volatile compounds (B) in Radix Bupleuri cultivated in different regions.
Molecules 27 04830 g007
Figure 8. Loading plots of PLS-DA models derived from the HPLC-MS datasets of saikosaponins (A) and the GC-MS datasets of volatile compounds (B) in Radix Bupleuri.
Molecules 27 04830 g008
Table 1. Chemical information and major product ions of the five saikosaponins.
PeaktR (min)IdentificationMeasured MassMolecular FormulaProduct Ions
16.83SSc926.5C48H78O17925.5 [M-H], 779.5 [M-Rha-H], 763.5 [M-Glc-H], 617.4 [M-Rha-Glc-H], 455.6 [M-Rha-2Glc-H]
27.69SSf928.5C48H80O17927.5 [M-H], 781.5 [M-Fuc-H], 619.4 [M-Fuc-Glc-H], 457.4 [M-Fuc-2Glc-H]
310.39SSa780.5C42H68O13779.5 [M-H], 617.4 [M-Glc-H], 471.4 [M-Glc-Fuc-H]
412.81SSe764.5C42H68O12763.5 [M-H], 601.4 [M-Glc-H], 455.4 [M-Rha-2Glc-H]
514.22SSd780.5C42H68O13779.5 [M-H], 617.4 [M-Glc-H], 471.6 [M-Glc-Fuc-H]
Table 2. Calibration curve, R2, and linear range of the five saikosaponins detected by the HPLC-MRM/MS method.
SaikosaponinCalibration CurveR2Linear Range
(μg/mL)
LOD
(μg/mL)
LOQ
(μg/mL)
SSay = 13,888.3 + 92,655.3x0.99860.1–100.00.0090.030
SScy = 64,383 + 755,798x0.99740.05–10.00.0060.020
SSdy = 36,478.4 + 89,231.8x0.99530.1–100.00.0150.050
SSey = 133,789 + 313,062x0.99490.03–3.00.0090.030
SSfy = 46,408.3 + 909,911x0.99660.05–10.00.0050.017
Table 3. Precision, repeatability, stability, and recovery of the five saikosaponins detected by the HPLC-MRM/MS method.
SaikosaponinIntraday Precision RSD (n = 9, %)Interday Precision RSD (n = 6, %)Repeatability RSD (n = 6, %)Stability RSD (n = 7, %)Recovery (%)/RSD (n = 3, %)
80%100%120%
SSa2.931.782.041.98101.32/1.57101.96/2.0399.63/2.19
SSc2.061.901.681.53100.91/1.95102.46/1.4795.55/2.09
SSd1.532.231.461.46101.13/1.32102.45/1.2298.10/1.82
SSe3.142.773.233.2897.47/1.65103.20/2.5998.46/1.48
SSf3.453.233.182.8998.83/2.61102.05/1.7896.12/2.57
Table 4. Information on the differential saponins from Radix Bupleuri cultivated in different regions analyzed by HPLC-MS.
No.tR (min)VIPCompound Name[M-H] Ion (m/z)Fragment Ions (m/z)Molecular FormulaReferences
14.012.03′,4′-dimethoxy
quercetin
329314, 299C18H34O5[30]
24.171.3hydroxy-SSc or its isomer943811, 649, 503, 471, 453C48H80O18[12]
34.491.6rotundioside w941795, 777C48H78O18[31]
44.861.6hydroxy-SSa797635, 559, 489C42H70O14[12]
56.573.3SSi925779, 763, 617C48H78O17[12]
66.693.3SSc971925, 779, 763, 617, 455C48H78O17[12]
76.771.2rotundioside n941779, 763, 618C48H78O18[31]
87.141.7hydroxy-SSd797635, 559, 489C42H70O14[12]
97.565.2SSf973927, 781, 765, 619, 457C48H80O17[12]
108.721.3rotundioside p943811, 649, 503, 471C48H80O18[12]
119.364.22″-O-acetyl SSb3853811, 793, 649C45H74O15[32]
1210.332.5SSa825779, 617, 541, 471C42H68O13[12]
1310.513.4SSb2825779, 617, 541, 471C42H68O13[12]
1411.115.2isomer of SSf927781, 765, 619C48H80O17[12]
1511.281.6chinoposaponin XVIII941779, 617C48H78O18[7]
1611.431.22″-O-acetyl SSa821779, 761, 617C44H70O14[12]
1711.491.0diacetyl SSa863821, 761C46H72O15[30]
1811.541.53″-O-acetyl SSa821779, 761, 617,
541, 471
C44H70O14[30]
1911.661.5malonyl-SSa865821, 779, 761, 617C45H70O16[7]
2011.8512.0SSb1825779, 617, 471C42H68O13[12]
2111.892.33β, 23, 28-trihydroxyolean-11, 13(18)-diene-16-one 3-O-β-D-glucopyranosyl-(1-3)-β-D-fucopyranoside777615, 539, 469, 437C42H66O13[12]
2211.923.6acetyl SSa821779, 617C44H70O14[31]
2312.753.9SSe809763, 601, 455C42H68O12[12]
2413.841.23″-O-acetyl SSb2821779, 761, 617C44H70O14[12]
2514.142.4SSd825779, 617C42H68O13[12]
2615.511.5malonyl-SSd865821, 779, 761, 617C45H70O16[32]
2716.071.0diacetyl SSd863821, 779, 76C46H72O15[30]
2816.131.56″-O-acetyl SSd821779, 761, 617C44H70O14[12]
Table 5. Information on the differential volatile compounds from Radix Bupleuri cultivated in different regions analyzed by GC-MS.
No.tR (min)VIPCompound NameM+• Ion (m/z)Molecular Formula
12.021.4L-isoleucine130.1C6H13NO2
22.021.43, 4-dimethyl-1-hexene111.2C8H16
32.551.2cyclobutene, 2-propenylidene91.1C7H8
42.561.0n-hexane85.2C6H14C6H14
52.851.62, 2-dimethyl heptane127.3C9H20
62.881.62-(1-methylbutyl)-oxirane113.2C7H14O
74.031.3chloromethyl 2-chloroundecanoate268.2C12H22Cl2O2
84.031.32, 4, 6-trimethyl-heptane141.3C10H22
94.071.12, 5, 6-trimethyl-decane183.4C13H28
104.071.1trimethylene oxide57.1C3H6O
114.401.1hexyl-oxirane71.1C4H8O
124.401.1D-sphingosine298.5C18H37NO2
134.401.11-methyl-4-(1-methylethenyl)-
2-cyclohexene
135.2C10H16
144.81.2phenacyl thiocyanate176.2C9H7NOS
154.951.62-butenoic acid, 3-methylbutyl ester155.2C9H16O2
164.951.55-methyl-2-hexanamine114.2C7H17N
175.022.0α-pinene135.2C10H16
185.051.74-octyl acetate171.3C10H20O2
195.051.74, 4-dimethyl-1-hexene111.2C8H16
205.051.7ethyl-cyclohexane111.2C8H16
215.091.4di-t-butylacetylene137.3C10H18
225.241.44-methyl-cyclopentadecanone237.4C16H30O
235.361.3trans-4, 5-epoxydecane155.3C10H20O
245.811.77-methylene-tridecane195.4C14H28
255.811.7benzyl 2-chloroethyl sulfone217.7C9H11ClO2S
265.871.7n-nonane267.5C19H40
276.101.0acetophenone119.2C8H8O
286.162.01-nitro-2-octanone172.2C8H15NO3
296.172.11-heptadecyne235.4C17H32
306.191.1cis-linaloloxide169.3C10H18O2
316.311.6heptanoic acid128.2C7H13O2
326.351.6cyclopropylacetic acid99.1C5H8O2
336.861.21-(3, 7-dimethyl-1-octenyl)-cyclopropanol195.3C13H24O
346.901.4benzyl nitrile116.2C8H7N
357.311.11-(ethenylthio)-octane171.3C10H20S
367.321.01, 2, 3, 4, 5-cyclopentanepentol149.1C5H10O5
377.611.11, 4-dimethyl-adamantane163.3C12H20
387.901.41-tridecanol199.4C13H28O
398.031.11-pentanol87.2C5H12O
408.111.3methyl-cycloheptane111.2C8H16
418.111.31, 2-dimethyl-cyclohexane111.2C8H16
428.361.12, 4-bis(diazo)adamantane187.2C10H12N4
438.361.1isopulegol153.3C10H18O
448.61.9cyclopentadecanol225.4C15H30O
458.681.32, 5-diethylphenol149.2C10H14O
468.691.1thymol149.2C10H14O
478.701.03-methyl-5-(1-methylethyl)-phenol methylcarbamate206.3C12H17NO2
489.111.12-carbonitrile-cyclopentanone108.1C6H7NO
499.181.52-undecenal167.3C11H20O
509.681.3n-decanoic acid171.3C10H20O2
519.681.3cubenol221.4C15H26O
529.701.13-methyl-heptanedioic acid dimethyl ester201.2C10H18O4
539.731.3chamigrene203.4C15H24
549.801.0cyclodecane139.3C10H20
559.941.415(S)-hydroxy-(5Z, 8Z, 11Z, 13E)-
eicosatetraenoic acid
319.5C20H32O3
569.951.01, 8-cyclopentadecadiyne201.3C15H22
5723.22.912, 15-octadecadienoic acid, methyl ester293.5C19H34O2
5824.063.1linoleic acid ethyl ester307.5C20H36O2
Table 6. The ion pair list of the precursor ions, product ions and collision energy of the five saikosaponins.
SaikosaponinPrecursor Ion (m/z)Product Ion I (m/z)/Collision Energy (eV)Product Ion II (m/z)/Collision
Energy (eV)
SSa779.5439.6/52.0617.3/32.2
SSc971.5779.3/38.9925.4/23.7
SSd779.5439.2/55.0617.3/33.1
SSe809.5601.3/33.0763.3/21.3
SSf973.5781.3/39.9927.4/23.4
Publisher’s Note: MDPI stays neutral with regard to jurisdictional claims in published maps and institutional affiliations.

