Abstract
Untargeted metabolomics approaches are emerging as powerful tools for the quality evaluation and authenticity of food and beverages and have been applied to wine science. However, most fail to report the method validation, quality assurance and/or quality control applied, as well as the assessment through the metabolomics-methodology pipeline. Knowledge of Mexican viticulture, enology and wine science remains scarce, thus untargeted metabolomics approaches arise as a suitable tool. The aim of this study is to validate an untargeted HS-SPME-GC-qTOF/MS method, with attention to data processing to characterize Cabernet Sauvignon wines from two vineyards and two vintages. Validation parameters for targeted methods are applied in conjunction with the development of a recursive analysis of data. The combination of some parameters for targeted studies (repeatability and reproducibility < 20% RSD; linearity > 0.99; retention-time reproducibility < 0.5% RSD; match-identification factor < 2.0% RSD) with recursive analysis of data (101 entities detected) warrants that both chromatographic and spectrometry-processing data were under control and provided high-quality results, which in turn differentiate wine samples according to site and vintage. It also shows potential biomarkers that can be identified. This is a step forward in the pursuit of Mexican wine characterization that could be used as an authentication tool.
1. Introduction
As demand increases, knowledge about food and beverage quality and authenticity also grows. Untargeted metabolomics approaches are emerging as powerful tools [1,2,3]. Metabolomics comprise the analysis of all metabolites (low-molecular-weight molecules) present in a cell, organism or system, accomplished preferentially, in a single analysis [4]. Experimentally, metabolomics analysis represents a great challenge because of its premise, particularly untargeted methods with the purpose of measuring as many metabolites as possible, while chemical identity is not necessary before data acquisition [5]. Targeted method guidelines are constantly updated; however, metabolomics method validation is complicated and revised guidelines of minimum reporting standards for untargeted studies are needed [6,7]. Consequently, the metabolomics community is encouraging the implementation and communication of quality assurance and quality control in untargeted metabolomics studies [8,9,10,11,12].
In recent years, metabolomics approaches have been applied in wine science for quality determination in order to evaluate the influence of different enological practices, microbial fermentation behavior and terroir. However, most have not reported the method validation, quality assurance and/or quality control applied, as well as assessment through the metabolomics-methodology pipeline [13,14,15,16,17,18,19,20,21], for more examples see [2]. The untargeted metabolomics-methods pipeline consists of four main steps, as proposed by Brown et al. [22]: (1) experimental design and metadata capture; (2) data preprocessing; (3) cleaned data; and (4) data to knowledge, or as recently expressed: (1) sample collection and processing; (2) data acquisition; (3) data processing; and (4) data interpretation [5,23]. Consequently, in order to obtain significant and reproducible data, each step needs to be controlled. Several guidelines have been reported to ensure method validation in different matrices [5,10,24,25,26]; recently, a pipeline for an untargeted HS-SPME GC-qTOF/MS-method workflow to analyze wine samples was proposed [27]. Here, we describe a recursive analysis as an alternative method for data mining.
While Mexico is considered the oldest wine-growing region in the Americas, knowledge of its viticulture, enology and wine science remains scarce [28]. Currently, Baja California State produces 75% of Mexican wine [29], mainly in Ensenada, where the second-oldest Mexican vineyard was planted in Santo Tomás Valley. Wine consumption and production in Mexico has increased in recent years, although Mexican wine remains insufficient to meet demand [30]. Hence, in 2018 an initiative to increase wine production and foster research in wine sciences was approved [31], as well as a commercial brand (Vino Mexicano) to promote Mexican wine quality. Hopefully, the characterization of wines will provide the industry with a tool to regulate and guarantee quality and authenticity of Mexican wines [32]. Thus, untargeted metabolomics approaches emerge as a suitable tool to support this initiative. Therefore, the objective of this study is to characterize and differentiate Cabernet Sauvignon wines from two different vintages and vineyards using an untargeted HS-SPME GC-QTOF-MS-validated method.
2. Results
2.1. Method Validation and Data Acquisition
The untargeted analysis objective is to determine as many metabolites as possible; therefore, highly repeatable and reproducible data are required. However, it has been reported that it is not clear how exhaustive and reliable current raw data processing is [12]. Therefore, although complicated, it is clear that method validation and quality analysis are needed. In order to validate the method, guidelines for targeted methods were included (Repeatability, Reproducibility, Linearity, LOD and LOQ). Although these parameters had to be determined for each targeted metabolite, in untargeted methods it is suggested to select metabolites that are present in samples, have similar chemical properties and molecular mass and are distributed along the runtime of the acquisition method [10]. Based on this, the chemical standards α-Pinene, β-Pinene, p-Cymene and 2-Undecanone were selected (Supplementary Materials Table S1).
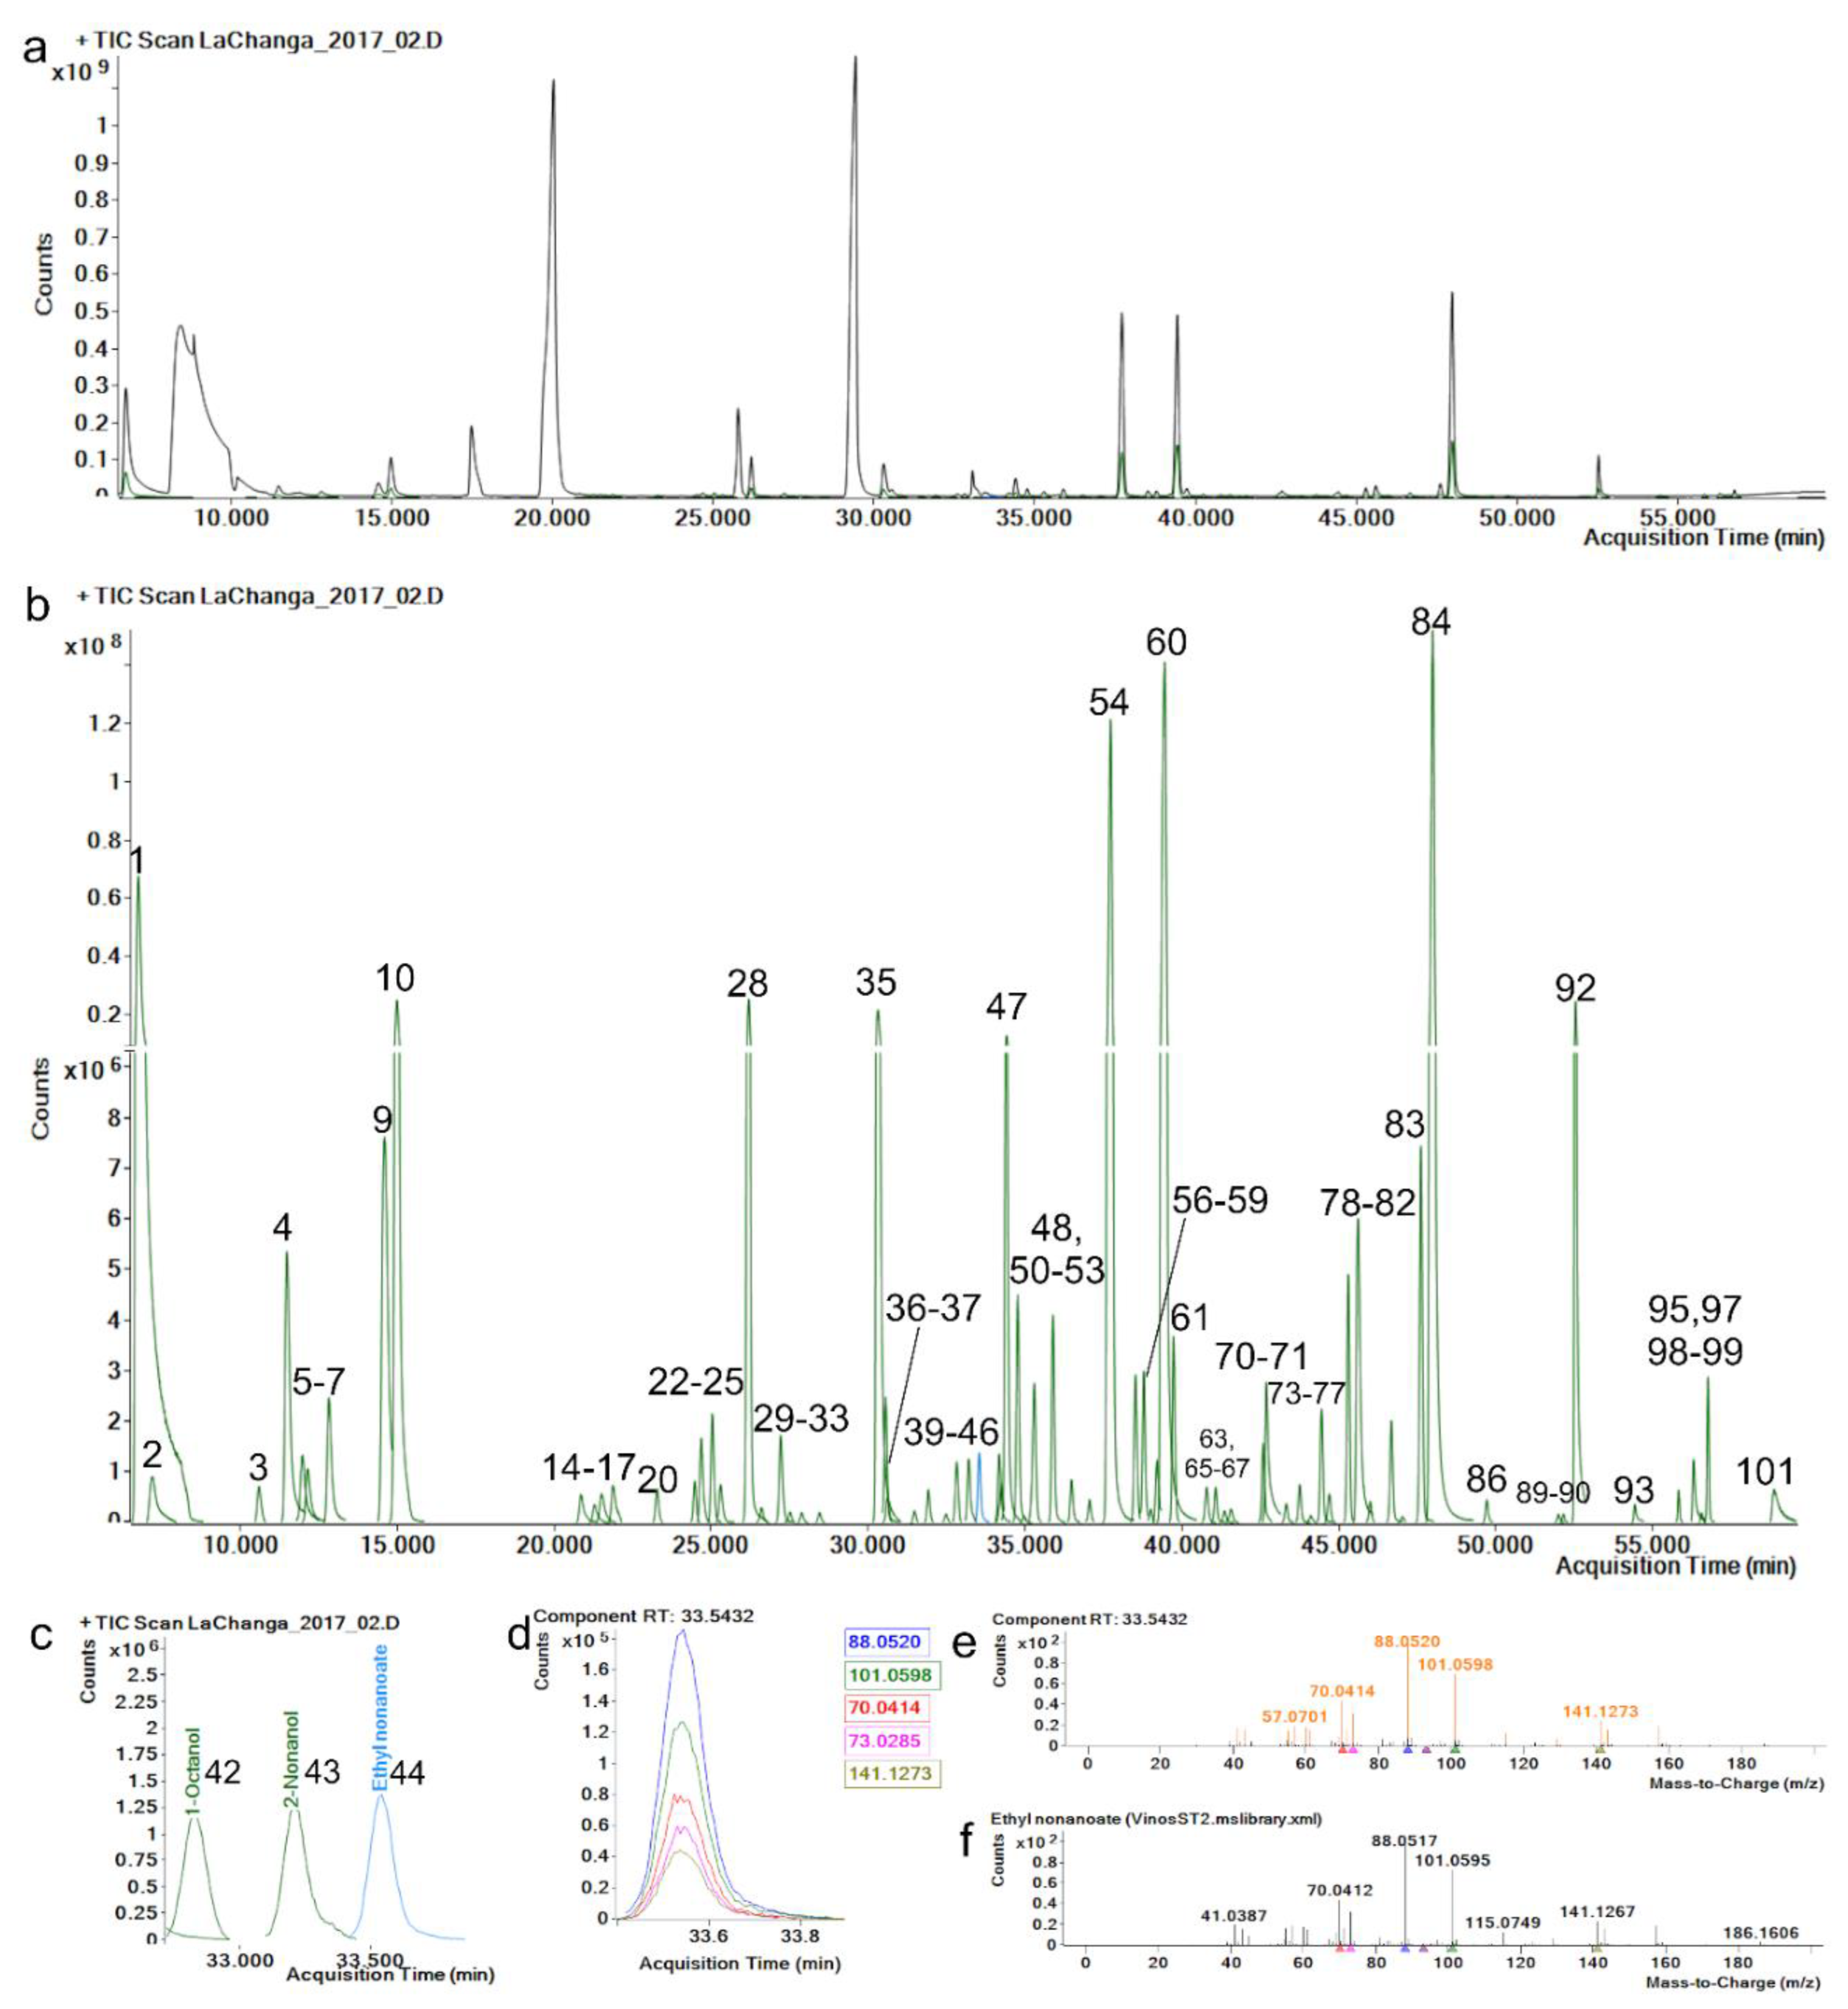
The repeatability and reproducibility of the extracted component area of each level and metabolite were <20.0% RSD (Supplementary Materials Table S1), complying with recommended criteria [33]. The retention-time (RT) reproducibility of all standards was <0.5% RSD, where maximum variation (SD) was of 0.09 min (5.4 s); this minimal variation enhances alignment across samples and identification by default. Hence, a match-factor penalty is applied in method identification if the RT variation is greater than 12 s. Match-factor reproducibility was <2.0% RSD, which can be related to mass-fragmentation spectrum stability which depends on mass-spectrum comparison and mass accuracy. Mass accuracy in the five most abundant fragments of each standard was <5 ppm (Figure 1e,f), which allowed match factors greater than 80 on all metabolite identifications.
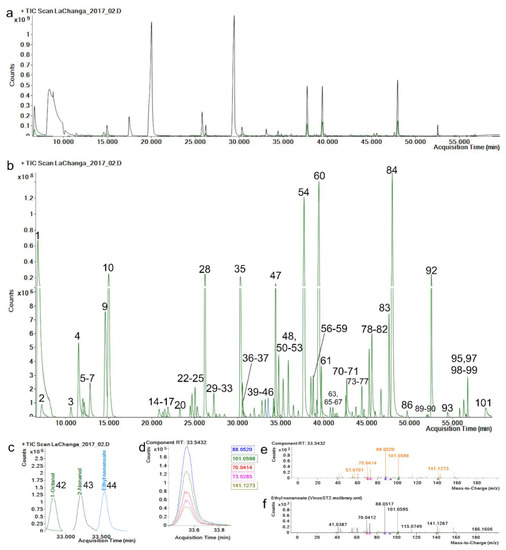
Figure 1.
(a) Total ion chromatogram (TIC, black) and (b) extracted components (green) identified (see Table 1) by manual recursive analysis. (c) Enlarged ethyl nonanoate peak. (d) Ethyl nonanoate ion peaks; each color represents an ion, exact mass is represented in the same color. (e) Ethyl nonanoate mass-spectrum fragmentation-pattern comparison, orange: acquired spectrum, (f) black: library spectrum.
Selectivity was assessed with the method capability to successfully discriminate between isomers α-Pinene and β-Pinene (136.125 g/moL) by retention time and mass fragmentation spectrum. Selectivity is an important quality to enable component extraction in the data-processing phase [10]. LOD concentrations were below 0.2 ng/L for each standard and LOQ were 2.5 ng/L (Supplementary Materials Table S1), indicating a high sensitivity in the method for detecting low-abundance components. Even though these parameters cannot be used to quantify other metabolites in untargeted methods [34], this method still provides an overview of metabolites’ chromatographic behavior. Interestingly, p-Cymene and 2-Undecanone could be used as an internal control for SPME fiber’s life span. As a sign of fiber deterioration, p-Cymene splits in two chromatographic peaks and 2-Undecanone abundances greatly decrease (data not shown).
An advantage of using a wine-spiked pool as matrix for method validation was that 74 compounds were identified, allowing the calculation of their extracted-area reproducibility ≤ 15.0% RSD (Supplementary Materials Table S2). Figure 1a shows a typical total ion chromatogram (TIC) of wine components; however, components present in most abundant chromatographic peaks could not be identified because of ion saturation and/or ion peak aberrancy. Thus, a method with split desorption must be performed to identify these metabolites. Since our interest resides in the low-abundance (Figure 1b and Table 1) metabolites present in wines, and the method was able to separate and extract them (Figure 1c,d), we decided to work with a splitless method to analyze samples. Consequently, method validation demonstrated that the extracted components’ area, RT and match factor were reproducible and unaffected by the concentration required for successful data processing/mining, data identification and data interpretation/analysis.

Table 1.
Compounds present in both vintages’ and vineyards’ red wines.
2.2. Quality Control
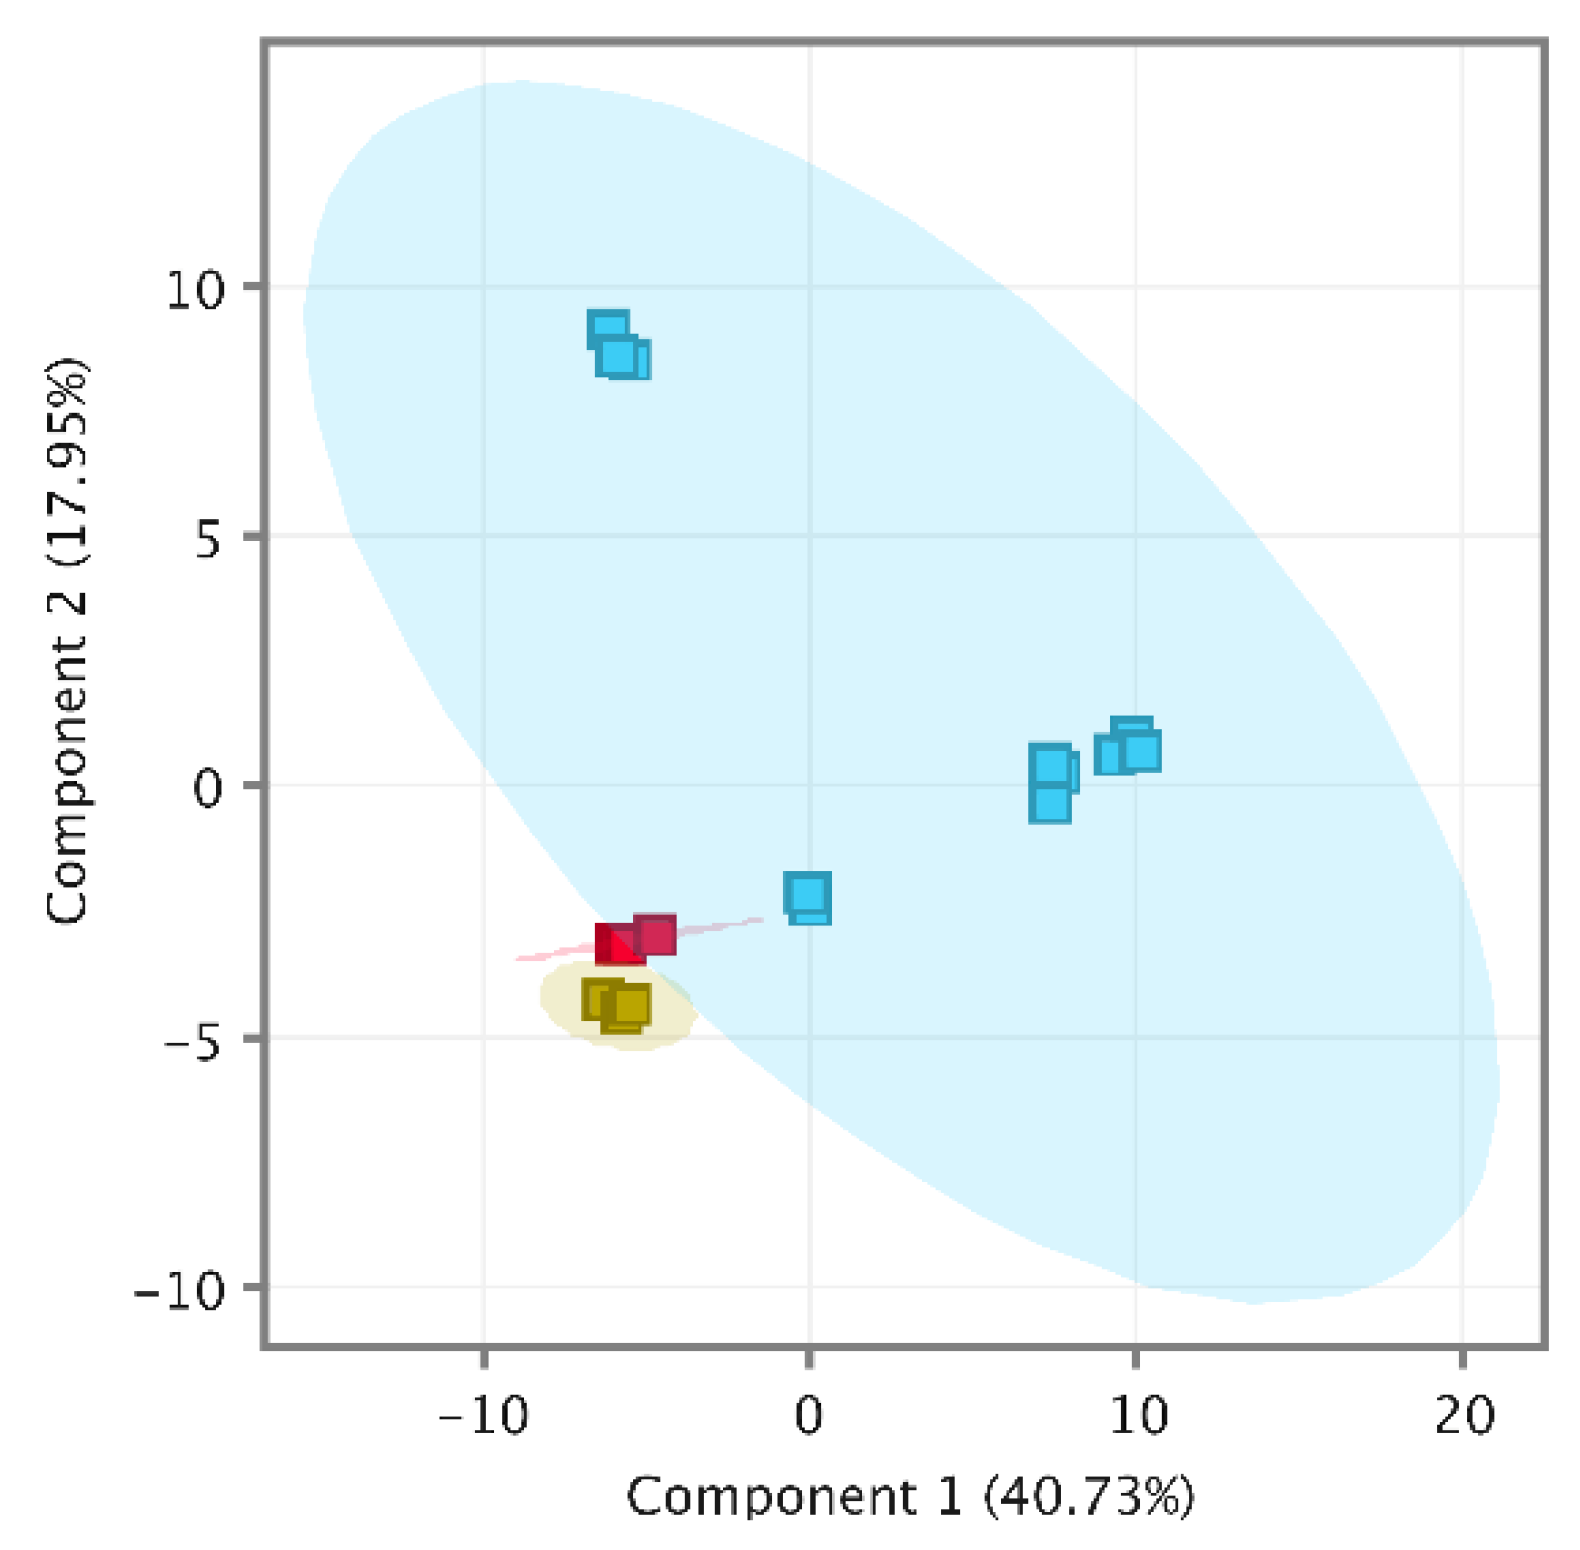
Recursive analysis successfully identified 74 compounds in a pooled wine (PW) and 76 in spiked pooled wine (PWS). Interestingly, isobutyl acetate (116.1583 g/moL) was identified in the PW (RT 10.65 min) but not in spiked samples. It seems that the method could not extract the isobutyl acetate component peak from the spiked α-pinene component peak. Moreover, it appears to include a p-cymene carryover of 0.06 ng/L which is less than 20% of LOQ, the acceptance criteria recommended by the FDA [33] for targeted analysis. Overall quality-control analysis was performed using MPP (MassHunter Workstation, Agilent Technologies, Santa Clara, CA, USA) by importing CEF files of PW, PWS and wine samples. The quality-control PCA (Principal Component Analysis) included a total of 109 entities and was clustered tightly out of all QC samples from wine samples, as shown in Figure 2; therefore, the data set was considered to be of high quality [5] and we proceeded to data interpretation.
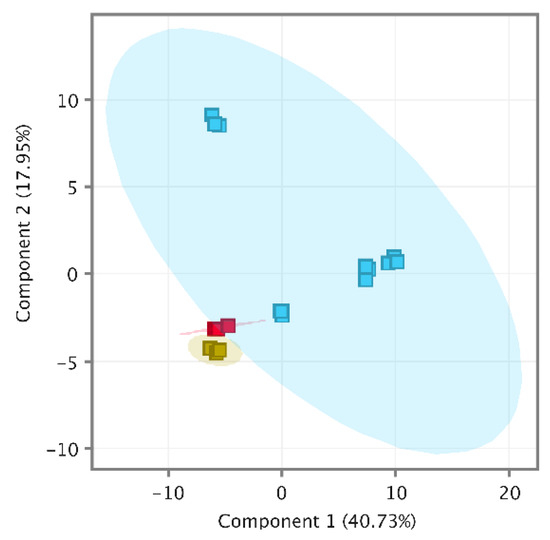
Figure 2.
PCA of quality-control samples, PW (yellow), PWS (red) and samples (blue).
2.3. Wine Characterization
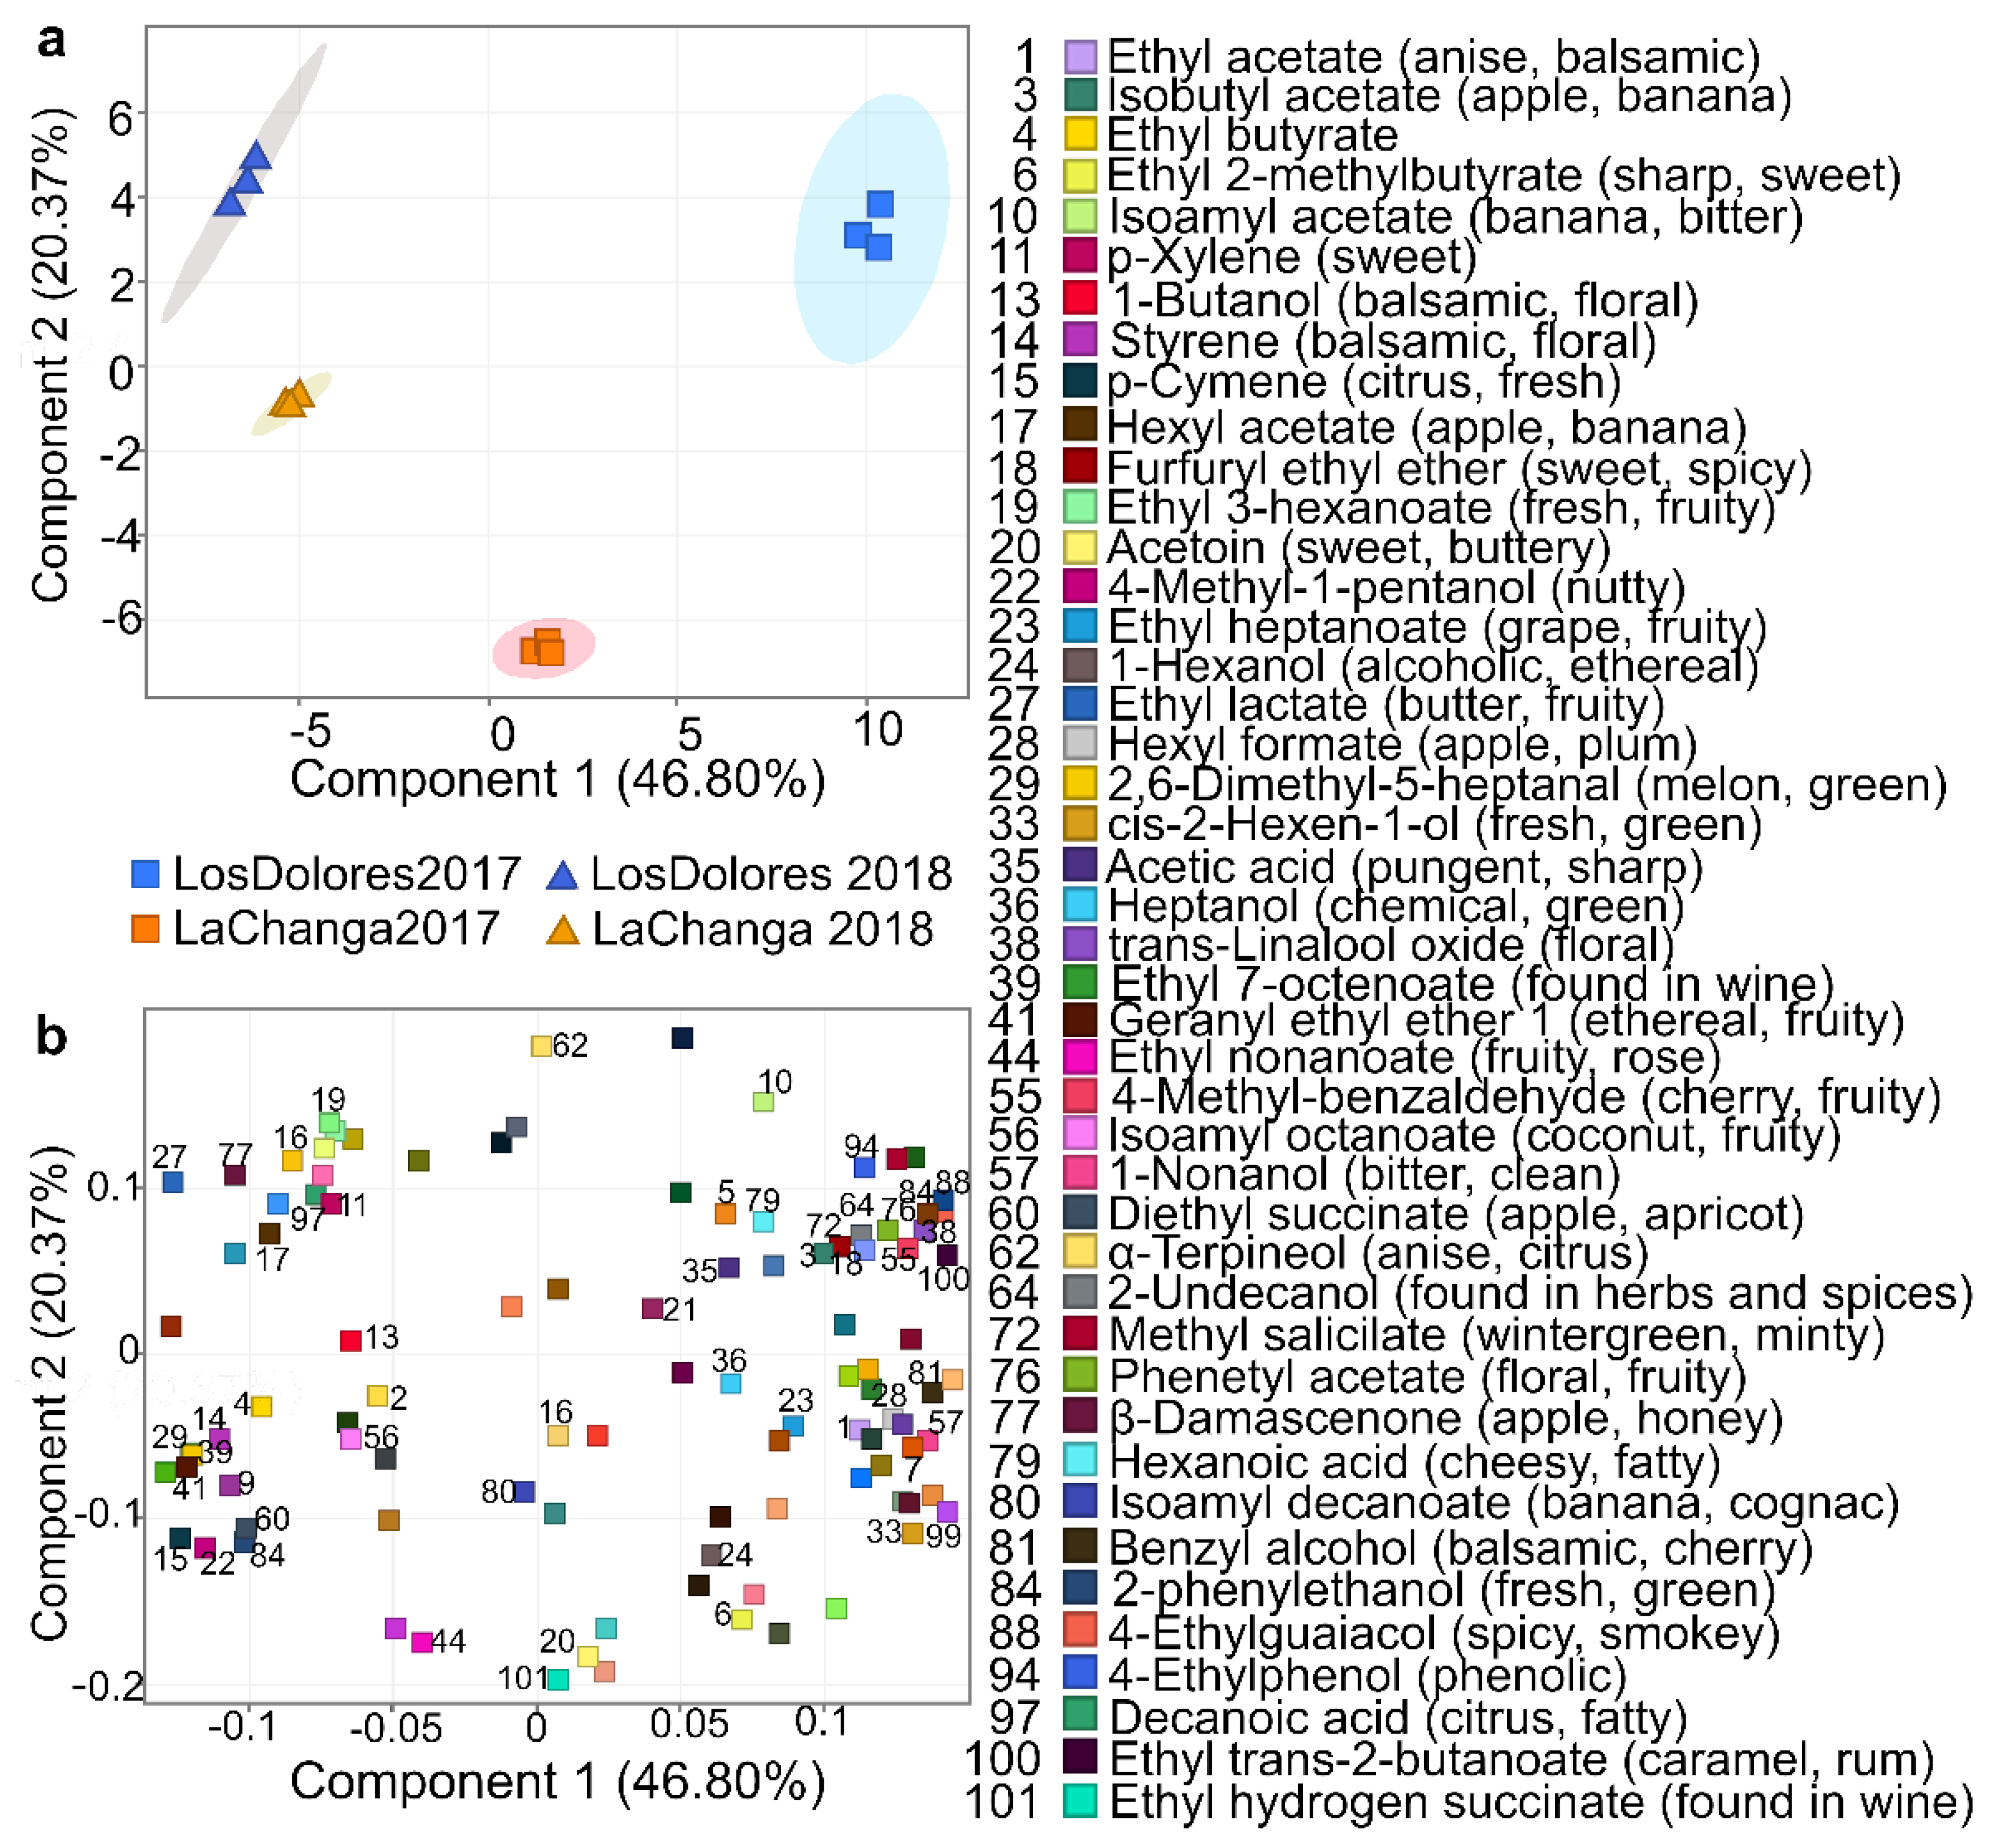
Recursive analysis extracted and identified 77, 75, 78 and 73 metabolites in wines from La Changa 2017 and 2018 and Los Dolores 2017 and 2018, respectively (Table 1). PCA included 101 metabolites (Table 1), where the first three components explained 86.71% of total variance (data not shown); furthermore, using the first two components (67.02% of total variance) allowed the clustering of wines by vineyard and vintage (Figure 3a) with a metabolite distribution shown in Figure 3b (PCA loadings). To elucidate PC1 and PC2’s meaning, a closer glance at metabolites near to wine-clustering areas was required; PC1 appears to be related to variables depending upon vintage, while PC2 allows the separation of wines by typology, and therefore is associated with wine quality or/and sensorial profile.
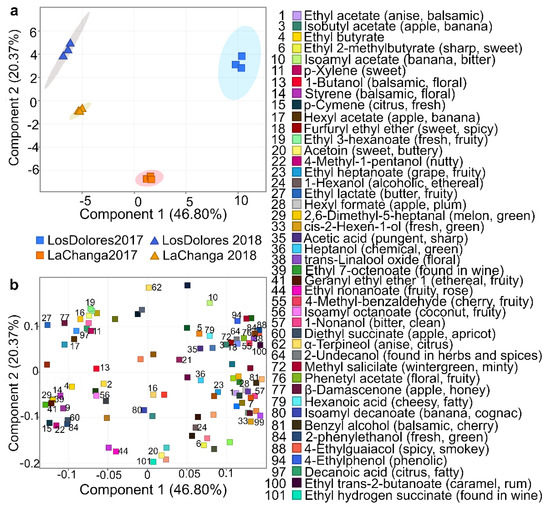
Figure 3.
Principal component analysis (PCA). (a) grouping vineyards (blue: Los Dolores, yellow: La Changa) and vintages (■: 2017, ▲: 2018); and (b) compound distribution, identifying those that contributed greatly to sample differentiation.
Regarding PC2 (Figure 3), some of its positive loadings such as 4-ethylguaiacol (compound #88 Table 1) and 4-ethylphenol (#94) contribute with undesirable aromas and have been reported in wines affected with Brettanomyces [35]. However, 2-undecanol (#64), 4-methylbenzaldehyde (#55), furfuryl ethyl ether (#18), methyl salicylate (#72) and trans-linalool oxide (#38) have been associated with spicy notes or found in spices, with roasted nuts, cooked beef and blackberry aromas; isoamyl acetate (#10) has banana and balsamic notes and α-terpineol (#62) has anise and citrus. At the same time, some of its negative PC loadings—metabolites such as monoethyl succinate (#101), ethyl nonanoate (#44), acetoin (#20), diphenyl ether (#87) and isobutyl hexanoate (#26)—have desirable sensorial properties and are reported as sweet and fruity [36].
Further analysis on PCA-loading distribution (Figure 3b) showed that metabolites at PC1- and PC2-negative loadings have fruity and citrus descriptors; those at PC1-negative and PC2-positive loadings are described as fresh, sweet, floral and fruity; while those at PC1-positive and PC2-negative loadings are predominantly floral and sweet notes. PC1- and PC2-positive loadings are less desirable, with descriptors such as alcoholic, balsamic and phenolic [36]. Based on these descriptors it could be inferred that the 2018 vintages from both vineyards have fruitier, more citrus, sweeter and fresher notes than the 2017 vintage, and Los Dolores 2017 presents floral notes. According to these results, La Changa 2017 could be the most-balanced wine as it is positioned almost at the center of the PCA (Figure 3a); however, sensorial analysis is required to confirm these assumptions. In addition, some putatively identified (level 2) and unknown (level 4) components have potential use as biomarkers for vineyard and vintage classification; consequently, their elucidation is required [7].
Additional data analysis (Figure 4) showed five potential markers for vintage differentiation. Compounds cis-2-Hexen-1-ol (#33), Unknown 38.9824 (RI 1432; ions 43.0543, 71.0852, 57.0699, 70.0774, 55.0543 m/z; C6H12O) and Unknown 41.3476 (RI 1754; ions 163.1114, 145.1008, 164.1161, 73.0645, 45.0335 m/z; C11H12O3) were unique to 2017 wines. Ethyl lactate (#27) and octyl ether (#68) were only present in 2018 wines (Figure 4 and Table 1). Interestingly, 54 compounds are shared by vineyards and vintages, which ideally, could indicate a metabolomic fingerprint of Santo Tomás Valley; however, extensive sampling and further analysis is needed to conclude this. Nevertheless, 24 of those compounds (Table 2) were decisive in vintage differentiation (p < 0.05). Styrene (#14), methyl octanoate (#30), β-damascenone (#77), decanoic acid (#97) and Unknown 51.9854 (RI 2072, ions 85.0290, 69.0696, 41.0386, 71.0488, 43.0179, C15H26O3) were distinctive in the 2018 vintage; meanwhile, 19 compounds were distinctive for 2017. Additionally, in the 2018 vintage, ethyl 3-methylbutyrate (#7), 1-octanol (#42), ethyl phenylacetate (#73) and 2,4-di-tert-buthylphenol (#99) decreased 3- to 5-fold (FC > 3.0, p < 0.001).
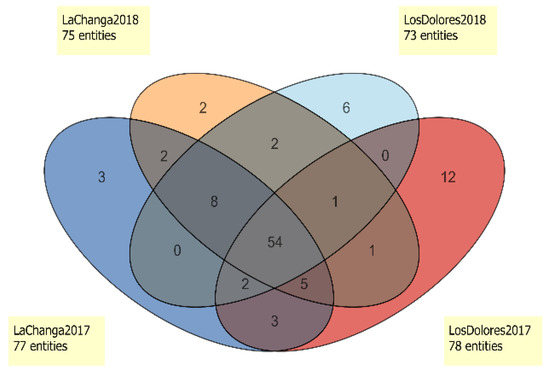
Figure 4.
Venn diagram of entities present in La Changa 2017 (dark blue), La Changa 2018 (orange), Los Dolores 2017 (red) and Los Dolores 2018 (light blue).
Table 2.
Decisive metabolites for vintage differentiation.
Interestingly, 2,4-di-tert-buthylphenol (#99) was 5-fold higher in the 2017 vintage than in 2018. To our knowledge, it has not been reported in Cabernet Sauvignon wines; however, was detected with the same abundance in red and white wines from Portugal [37]. Furthermore, Marselan wines (Cabernet Sauvignon × Grenache varieties) inoculated with S. cerevisiae presented higher concentrations of 2,4-di-tert-buthylphenol than in spontaneously fermented wines [38]. Persimmon-inoculated wines showed similar behavior [39]. This compound has antifungal and antioxidant characteristics [40] but no aromatic properties have been reported yet. Moreover, the compound was first detected at the end of alcoholic fermentation in the 2017 vintage and increased after malolactic fermentation (data not shown). Although produced by non-Saccharomyces yeasts [41] and lactic-acid bacteria [40], 2,4-di-tert-buthylphenol could be a potential marker in vintage differentiation as microbial terroir cannot be discarded.
The Venn diagram (Figure 4) showed that 54 compounds were present in all wines and enabled the selection of unique compounds for each one. Los Dolores 2017 wine presented 12 distinctive compounds (4-methyl benzaldehyde, trans-linalool oxide (furanoid), ethyl trans-2-butanoate, furfuryl ethyl ether, 4-ethylguaiacol, 4-ethylphenol, methyl salicylate, 2-undecanol and Unknowns 13.2265; 29.3449; 48.8990 and 52.3099), and Los Dolores 2018 wines presented only six (p-xylene, diphenyl ether, isobutyl hexanoate, ethyl ether hexanoic acid and Unknown 16.5912). La Changa 2017 wines presented three unique compounds (ethyl hydrogen succinate, acetoin and Unknown 54.4274), and the 2018 vintage presented two (1-butanol and 4,1,1-dimethyl-trans-cyclohexanol). However, compounds such as ethyl nonanoate and Unknown 54.4273 (RI 2194, ions 149.0441; 105.0692; 104.0615; 133.0128: 150.0449 m/z, formula C8H7NO2) were found only in wines from La Changa vineyard. This set of compounds could be used as potential markers to identify wines from La Changa vineyard, although as stated before, a larger sample size must be analyzed for confirmation.
Reports have estimated that 62% of metabolites present in wine remain unidentified and target metabolomics cannot resolve this drawback [2], thus generating a free library with reliable data of unknown metabolites (accurate mass spectrum, RI, RT and potential formula) that could enable their rapid identification. This feature should be added as part of the minimum reporting standard procedure [7] to enhance probability and move identification levels upward. Furthermore, it will provide a robust and comprehensive workflow report that could improve reproducibility of results and the exchange of experimental data among research groups [5].
3. Conclusions
Metabolomics studies urgently require establishing guidelines for validation of untargeted methods, particularly for complex matrices such as beverages. Here, we used parameters for targeted experiments combined with recursive analysis of data for quality assurance to show that both chromatographic and spectrometry-processing data were under control and complied with certain guidelines. During validation, an accurate mass library, VinoST2.mslibrary.xml, was created, and included the retention index, retention time and CAS number of metabolites that were putatively identified, and the exact mass and molecular formula of those classified as unknowns.
Recursive analysis of metabolite data and PCA successfully differentiated Cabernet Sauvignon wines from two vineyards and two vintages and gave an approximation of their aromatic notes. In addition, potential markers of vineyard and vintage were pointed out, and a profile of 54 compounds was described in all Cabernet Sauvignon wines from Santo Tomás Valley. This effort constitutes an advance in the pursuit of Mexican wine characterization that could be used as an authentication tool.
4. Materials and Methods
4.1. Samples
Cabernet Sauvignon wines of vintages 2017 and 2018 from two different vineyards were collected from 55,000 L stainless steel tanks, bottled (750 mL, sealed with natural cork) and stored horizontally at room temperature until sample processing. Vineyard-management practices of La Changa and Los Dolores vineyards, from Bodegas de Santo Tomás (Ensenada, B.C., Mexico, 31°34′ N, 116°24′ W, elevation 180 m.a.s.l.) were the same in both sites and along those two vintages, as well their vinification process. For quality-control (QC) purposes a subset of samples was pooled (vintages 2015, 2016 and 2017; PW), aliquoted and stored at −50 °C until needed.
4.2. Data Acquisition
Samples were analyzed using a 7890B GC System (Agilent Technologies, Santa Clara, CA, USA) coupled to a 7200 mass spectrometer with quadrupole-time-of-flight (MS-qTOF) (Agilent Technologies, Santa Clara, CA, USA), with an autosampler PAL3 System (CTC Analytics AG, Zwingen, Switzerland) and a head-space solid-phase micro-extraction (HS-SPME) module with 50/30 μm DVB/CAR/PDMS Stable Flex Supelco fiber (Agilent Technologies, Santa Clara, CA, USA) [42]. Three grams of NaCl were added to 10 mL of sample in a 20 mL amber vial sealed with an aluminum cap and an 18 mm blue PTFE/silicone septum (Agilent Technologies, Santa Clara, CA, USA), as described [43]. Modified parameters for extraction [44], separation [45] and detection are summarized in Table 3. Mass calibration was performed at the beginning and after running three samples, to ensure mass accuracy.
Table 3.
Data-acquisition parameters.
4.3. Method Validation
To validate the data-acquisition method, repeatability, reproducibility, linearity and limits of detection (LOD) and quantification (LOQ), the chromatographic standards α-Pinene and p-Cymene from Honeywell Fluka™ (Morristown, NJ, USA) and, β-Pinene (99%) and 2-Undecanone (99%) from Sigma-Aldrich (St. Louis, MO, USA) were used. Validation parameters were performed in a pooled-wine (PW) matrix to prevent matrix interferences. Concentration range of α-Pinene and β-Pinene was 1.56 (L1) to 25.00 (L5) ng/L with 1:1 factor, while p-Cymene and 2-Undecanone was 0.31 (L1) to 5.00 ng/L (L5) with the same factor. Repeatability was determined using a five-level curve by triplicate on day one. Reproducibility was calculated with a three-level curve (L1, L3 and L5), also in triplicate, on the second day of work. Mean, standard deviation (SD) and relative standard deviation (%RSD) were calculated for each level to determine repeatability and reproducibility. Linearity was determined by the correlation coefficient (r) of five-level standard curves and PW as a blank sample (matrix sample without standards). LOD and LOQ were determined from ten injections of L1 in three different days (Supplementary Materials, Table S1) and calculated using Agilent MassHunter WorkStation Quantitative Analysis version 10.0 (Agilent Technologies, Santa Clara, CA, USA).
4.4. Quality Control
Quality control was assessed by monitoring pooled samples of Cabernet Sauvignon wines from Santo Tomás. Every batch sequence of injections included a PW, PWS with standards at L4 concentration (Supplementary Materials Table S1) and samples from both vintages and vineyards. Injections were randomized, analyzed in triplicate (Supplementary Materials Table S3) and processed by recursive analysis as described in the Data Processing section.
4.5. Data Processing/Mining and Identification
4.5.1. Data Processing/Mining
Data processing/mining of raw data was an exhaustive and crucial step for untargeted analysis; this process must generate a holistic and reliable representation of the metabolites present in each sample [5]. Data processing was performed in two steps in order to generate a recursive analysis (as pretreatment to ease data interpretation/analysis of complex matrices) using Agilent MassHunter WorkStation Unknowns Analysis software version 10.0. All data acquired were converted to the SureMass format (only data acquired in profile mode can be converted). First step for recursive analysis was to extract and identify most of components in the QC pool to create an internal library (see Internal library); second step was recursive analysis (described later). Component extraction was performed using SureMass deconvolution with a retention-time (RT) window factor of 300, a 5 SNR (signal-to-noise ratio), extraction window of ±10 ppm, threshold of 25% in component shape, a minimum of four ion peaks for extraction and a maximum of 10 ion peaks to store. Area and height filters were not applied because the aim of this study was to also include minor compounds, which resulted in an exhaustive manual/visual analysis of ion-peak shapes. Extracted components were identified with Accurate Mass Flavors Database [46] and NIST 17, as described below.
4.5.2. Retention Index
Retention indices (RI) were calculated using 50 ng/L C8-C40 Alkanes calibration standard (Sigma-Aldrich, St. Louis, MO, USA). Liquid injection (1 μL) in manual mode was used to improve the signal acquired. Acquired data was processed as indicated above and identified with NIST 17 library, then exported in library format. Agilent MassHunter WorkStation Library Editor 10.0 was used to activate only “Compound name”, “CAS#”, “Retention Index” and “Retention Time” columns, in that order, and saved in a CSV (comma-separated values) format to create the RT calibration file, which contains alkanes RI to be used in recursive analysis to calculate the RI of unknown components.
4.5.3. Internal Library
For data reduction and to decrease false positives and false negatives, QC-pooled sample was analyzed to generate an internal library for recursive analysis. Components extracted were identified with Accurate Mass Flavors Database [46] and NIST 17. Identification method (level 2, as proposed by Sumner et al. [33] included spectral search with a minimum match factor of 70, performing an exact-mass comparison, starting at 30 m/z, with accuracy < 20 Δppm. Once automatic identification was carried out, manual/visual analysis was completed (components identified as fiber and column materials were eliminated). Putatively identified compounds were assigned when ion peaks, mass-fragmentation spectrum and RI matched (ΔRI < 30) libraries’ components. If one of these parameters did not comply, the component was exported as library file and identified as Unknown + RT (min). With this method, an exact-mass library, VinoST2.mslibrary.xml (available at https://www.ciad.mx/VinosMxDB, accessed: 6 November 2019), was created and includes RT and RI of a total of 93 compounds, with 25 of them identified as Unknowns (m/z shown in Supplementary Materials, Table S4).
4.5.4. Recursive Analysis
VinoST2.mslibrary.xml library was added to recursive-analysis method using RT as a match factor with a trapezoidal penalty range of 18 s and a penalty-free range of 12 s, in order to align components across samples. Libraries Flavors-14-mslibrary.xml and NIST 17 were added and used without RT as a match factor to identify components not present in QC sample, using the same parameters applied to internal library creation and then adding them to it. RT calibration file was also included to calculate RIs. In order to identify a given compound with the internal library, the component of interest had to be present in the three replicates and match the compound fragmentation spectra, RI and RT (Figure 1). Once all samples were analyzed and their compounds identified, AllBestHits script was run to export the data in CEF format (Compound Exchange Format).
4.6. Data Interpretation/Analysis
Data interpretation/analysis was performed using Agilent MassHunter WorkStation Mass Profiler Professional (MPP) version 15.0. Identified components’ data were imported and grouped by vineyard (La Changa and Los Dolores) and vintage (2017 and 2018), considering a 2 × 2 factorial design, then transformed with the median of the baseline of all samples and used to perform a principal-component analysis (PCA) on all entities and samples where variance and covariance matrix method was used. A Venn diagram was performed with entities’ lists of wines from both vineyards and vintages. From this, all entities in both vineyards were selected to perform a moderated t-test (p-value cut-off of 0.05 and Benjamini–Hochberg as multiple testing correction, FC > 1.1) comparing vintages. Moreover, a 2-way ANOVA was performed, pairing conditions between vintages and vineyards.
Supplementary Materials
The following supporting information can be downloaded online: Supplementary Material—Validated results, identified compounds in pool QC tables, batch sequence and Unknowns entities m/z; Table S1 contains repeatability, reproducibility, linearity (r), limit of detection (LOD) and limit of quantification (LOQ) determinations; Table S2 shows RT, RI, CAS# and %RSD of 74 compounds identified in pool QC; Table S3 shows the batch sequence used to acquire vineyard and vintage data; Table S4 contains m/z of 25 unknown entities detected.
Author Contributions
L.V.-M. and A.C.-M. conceived and designed research; A.C.-M. conducted experiments, analyzed data and wrote the manuscript; H.G.-R. and A.A.G. reviewed statistical analysis and edited the manuscript; L.V.-M. procured the funding. All authors have read and agreed to the published version of the manuscript.
Funding
This research was funded by the Institutional Analytical Platform of the Research Center in Food and Development (CIAD) under Project PAI-10363.
Institutional Review Board Statement
Not applicable.
Informed Consent Statement
Not applicable.
Data Availability Statement
Metabolomics raw data are available at MetaboLights (https://www.ebi.ac.uk/metabolights/ (accessed on 6 November 2019)) with accession number MTBLS1391. CURRENTLY IN CURATION. Exact-mass library VinoST2.mslibrary.xml can be downloaded from https://www.ciad.mx/VinosMxDB (accessed on 6 November 2019).
Acknowledgments
We thank the Mexican National Council of Science and Technology (CONACYT) for the PhD scholarship granted to the first author. We are also grateful to Bodegas de Santo Tomás (Ensenada, B.C., Mexico) for supplying samples and logistics, and particularly to enologist Laura Zamora for the confidence and support granted to our research.
Conflicts of Interest
The authors declare no conflict of interest.
References
- Lacalle-Bergeron, L.; Izquierdo-Sandoval, D.; Sancho, J.V.; López, F.J.; Hernández, F.; Portolés, T. Chromatography hyphenated to high resolution mass spectrometry in untargeted metabolomics for investigation of food (bio)markers. TrAC Trends Anal. Chem. 2021, 135, 116161. [Google Scholar] [CrossRef]
- Alañón, M.E.; Pérez-Coello, M.S.; Marina, M.L. Wine science in the metabolomics era. TrAC Trends Anal. Chem. 2015, 74, 1–20. [Google Scholar] [CrossRef]
- Klåvus, A.; Kokla, M.; Noerman, S.; Koistinen, V.M.; Tuomainen, M.; Zarei, I.; Meuronen, T.; Häkkinen, M.R.; Rummukainen, S.; Babu, A.F.; et al. “Notame”: Workflow for non-targeted LC-MS metabolic profiling. Metabolites 2020, 10, 135. [Google Scholar] [CrossRef] [PubMed] [Green Version]
- Dunn, W.B.; Ellis, D.I. Metabolomics: Current analytical platforms and methodologies. TrAC Trends Anal. Chem. 2005, 24, 285–294. [Google Scholar] [CrossRef]
- Broadhurst, D.; Goodacre, R.; Reinke, S.N.; Kuligowski, J.; Wilson, I.D.; Lewis, M.R.; Dunn, W.B. Guidelines and considerations for the use of system suitability and quality control samples in mass spectrometry assays applied in untargeted clinical metabolomic studies. Metabolomics 2018, 14, 72. [Google Scholar] [CrossRef] [Green Version]
- Spicer, R.A.; Salek, R.; Steinbeck, C. Comment: A decade after the metabolomics standards initiative it’s time for a revision. Sci. Data 2017, 4, 2–4. [Google Scholar] [CrossRef]
- Sumner, L.W.; Amberg, A.; Barrett, D.; Beale, M.H.; Beger, R.; Daykin, C.A.; Fan, T.W.-M.; Fiehn, O.; Goodacre, R.; Griffin, J.L.; et al. Proposed minimum reporting standards for chemical analysis. Metabolomics 2007, 3, 211–221. [Google Scholar] [CrossRef] [Green Version]
- Baran, R. Untargeted metabolomics suffers from incomplete raw data processing. Metabolomics 2017, 13, 107. [Google Scholar] [CrossRef]
- Beger, R.D.; Dunn, W.B.; Bandukwala, A.; Bethan, B.; Broadhurst, D.; Clish, C.B.; Dasari, S.; Derr, L.; Evans, A.; Fischer, S.; et al. Towards quality assurance and quality control in untargeted metabolomics studies. Metabolomics 2019, 15, 4. [Google Scholar] [CrossRef]
- Dudzik, D.; Barbas-bernardos, C.; García, A.; Barbas, C. Quality assurance procedures for mass spectrometry untargeted metabolomics a review. J. Pharm. Biomed. Anal. 2018, 147, 149–173. [Google Scholar] [CrossRef]
- Dunn, W.B.; Broadhurst, D.I.; Edison, A.; Guillou, C.; Viant, M.R.; Bearden, D.W.; Beger, R.D. Quality assurance and quality control processes: Summary of a metabolomics community questionnaire. Metabolomics 2017, 13, 50. [Google Scholar] [CrossRef]
- Martin, J.C.; Maillot, M.; Mazerolles, G.; Verdu, A.; Lyan, B.; Migné, C.; Defoort, C.; Canlet, C.; Junot, C.; Guillou, C.; et al. Can we trust untargeted metabolomics? Results of the metabo-ring initiative, a large-scale, multi-instrument inter-laboratory study. Metabolomics 2015, 11, 807–821. [Google Scholar] [CrossRef] [PubMed]
- Capece, A.; Romaniello, R.; Siesto, G.; Pietrafesa, R.; Massari, C.; Poeta, C.; Romano, P. Selection of indigenous saccharomyces cerevisiae strains for nero d’avola wine and evaluation of selected starter implantation in pilot fermentation. Int. J. Food Microbiol. 2010, 144, 187–192. [Google Scholar] [CrossRef] [PubMed]
- Robinson, A.L.; Boss, P.K.; Heymann, H.; Solomon, P.S.; Trengove, R.D. Development of a sensitive non-targeted method for characterizing the wine volatile profile using headspace solid-phase microextraction comprehensive two-dimensional gas chromatography time-of-flight mass spectrometry. J. Chromatogr. A 2011, 1218, 504–517. [Google Scholar] [CrossRef]
- Arapitsas, P.; Scholz, M.; Vrhovsek, U.; Di Blasi, S.; Biondi, A.; Masuero, D.; Perenzoni, D.; Rigo, A.; Mattivi, F. A metabolomic approach to the study of wine micro-oxygenation. PLoS ONE 2012, 7, e377783. [Google Scholar] [CrossRef]
- Arapitsas, P.; Speri, G.; Angeli, A.; Perenzoni, D.; Mattivi, F. The influence of storage on the ‘chemical age’ of red wines. Metabolomics 2014, 10, 816–832. [Google Scholar] [CrossRef]
- López-Rituerto, E.; Savorani, F.; Avenoza, A.; Busto, J.H.; Peregrina, J.M.; Engelsen, S.B. Investigations of la rioja terroir for wine production using 1H NMR metabolomics. J. Agric. Food Chem. 2012, 60, 3452–3461. [Google Scholar] [CrossRef]
- Castro, C.C.; Martins, R.C.; Teixeira, J.A.; Ferreira, A.C.S. Application of a high-throughput process analytical technology metabolomics pipeline to port wine forced ageing process. Food Chem. 2014, 143, 384–391. [Google Scholar] [CrossRef] [Green Version]
- Silva Ferreira, A.C.; Monforte, A.R.; Silva Teixeira, C.; Martins, R.; Fairbairn, S.; Bauer, F.F. Monitoring alcoholic fermentation: An untargeted approach. J. Agric. Food Chem. 2014, 62, 6784–6793. [Google Scholar] [CrossRef]
- Alves, Z.; Melo, A.; Figueiredo, A.R.; Coimbra, M.A.; Gomes, C.; Rocha, S.M. Exploring the saccharomyces cerevisiae volatile metabolome: Indigenous versus commercial strains. PLoS ONE 2015, 10, e0143641. [Google Scholar] [CrossRef] [Green Version]
- Boss, P.K.; Kalua, C.M.; Nicholson, E.L.; Maffei, S.M.; Böttcher, C.; Davies, C. Fermentation of grapes throughout development identifies stages critical to the development of wine volatile composition. Aust. J. Grape Wine Res. 2018, 24, 24–37. [Google Scholar] [CrossRef]
- Brown, M.; Dunn, W.B.; Ellis, D.I.; Goodacre, R.; Handl, J.; Knowles, J.D.; O’Hagan, S.; Spasić, I.; Kell, D.B. A metabolome pipeline: From concept to data to knowledge. Metabolomics 2005, 1, 39–51. [Google Scholar] [CrossRef]
- Jones, C.M.; Dunn, W.B.; Raftery, D.; Hartung, T.; Wilson, I.D.; Lewis, M.R.; Tayyari, F.; Baljit, K.; Souza, A.; Ntai, I.; et al. Metabolomics Quality Assurance and Quality Control Consortium (MQACC): Reference and Test Material Working Group; Metabolomics Quality Assurance and Quality Control Consortium (mQACC): Bethesda, MD, USA, 2018. [Google Scholar]
- Bletsou, A.A.; Jeon, J.; Hollender, J.; Archontaki, E.; Thomaidis, N.S. Targeted and non-targeted liquid chromatography-mass spectrometric workflows for identification of transformation products of emerging pollutants in the aquatic environment. TrAC Trends Anal. Chem. 2015, 66, 32–44. [Google Scholar] [CrossRef] [Green Version]
- Martínez-Bueno, M.J.; Gómez Ramos, M.J.; Bauer, A.; Fernández-Alba, A.R. An Overview of non-targeted screening strategies based on high resolution accurate mass spectrometry for the identification of migrants coming from plastic food packaging materials. TrAC Trends Anal. Chem. 2019, 110, 191–203. [Google Scholar] [CrossRef]
- Palermo, A.; Botre, F.; de la Torre, X.; Zamboni, N. Non-targeted LC-MS based metabolomics analysis of the urinary steroidal profile. Anal. Chim. Acta 2017, 964, 112–122. [Google Scholar] [CrossRef] [Green Version]
- Muñoz-Redondo, J.M.; Puertas, B.; Pereira-Caro, G.; Ordóñez-Díaz, J.L.; Ruiz-Moreno, M.J.; Cantos-Villar, E.; Moreno-Rojas, J.M. A statistical workflow to evaluate the modulation of wine metabolome and its contribution to the sensory attributes. Fermentation 2021, 7, 72. [Google Scholar] [CrossRef]
- Covarrubias, J.; Thach, L. Wines of Baja Mexico: A qualitative study examining viticulture, enology, and marketing practices. Wine Econ. Policy 2015, 4, 110–115. [Google Scholar] [CrossRef] [Green Version]
- Larios Córdova, H. Iniciativa Con Proyecto de Decreto Que Expide La Ley General de Fomento a La Industria Vitivinícola. 2016. Available online: https://infosen.senado.gob.mx/sgsp/gaceta/63/2/2017-04-25-1/assets/documentos/Inic_PAN_Ley_Industria_Vitivinicila.pdf (accessed on 20 October 2017).
- OIV. Estadísticas de México de 1995 a 2016. Available online: https://www.oiv.int/es/statistiques/recherche (accessed on 8 September 2019).
- DOF. El Pleno del Senado Aprobó la Ley General de Fomento a la Industria Vitivinícola. Available online: http://comunicacion.senado.gob.mx/index.php/informacion/boletines/39130-el-pleno-del-senado-aprobo-la-ley-general-de-fomento-a-la-industria-vitivinicola.html (accessed on 5 November 2017).
- CMV. Marca Colectiva. Available online: https://vinomexicano.org.mx/marca-colectiva/ (accessed on 10 January 2020).
- FDA. Bioanalytical Method Validation, Guidance for Industry. Available online: https://www.fda.gov/media/70858/download (accessed on 4 January 2022).
- Dashko, S.; Zhou, N.; Tinta, T.; Sivilotti, P. Use of non-conventional yeast improves the wine aroma profile of Ribolla Gialla. J. Ind. Microbiol. Biotechnol. 2015, 42, 997–1010. [Google Scholar] [CrossRef]
- Parker, M.; Capone, D.L.; Francis, I.L.; Herderich, M.J. Aroma precursors in grapes and wine: Flavor release during wine production and consumption. J. Agric. Food Chem. 2017, 66, 2281–2286. [Google Scholar] [CrossRef]
- Ramirez-Gaona, M.; Marcu, A.; Pon, A.; Guo, A.C.; Sajed, T.; Wishart, N.A.; Karu, N.; Feunang, Y.D.; Arndt, D.; Wishart, D.S. YMDB 2.0: A significantly expanded version of the yeast metabolome database. Nucleic Acids Res. 2017, 45, D440–D445. [Google Scholar] [CrossRef]
- Martins, N.; Garcia, R.; Mendes, D.; Costa Freitas, A.M.; da Silva, M.G.; Cabrita, M.J. An ancient winemaking technology: Exploring the volatile composition of amphora wines. LWT Food Sci. Technol. 2018, 96, 288–295. [Google Scholar] [CrossRef]
- Lu, Y.; Sun, F.; Wang, W.; Liu, Y.; Wang, J.; Sun, J.; Mu, J.; Gao, Z. Effects of spontaneous fermentation on the microorganisms diversity and volatile compounds during ‘Marselan’ from grape to wine. LWT Food Sci. Technol. 2020, 134, 110193. [Google Scholar] [CrossRef]
- Lu, Y.; Guan, X.; Li, R.; Wang, J.; Liu, Y.; Ma, Y.; Lv, J.; Wang, S.; Mu, J. Comparative study of microbial communities and volatile profiles during the inoculated and spontaneous fermentation of persimmon wine. Process Biochem. 2021, 100, 49–58. [Google Scholar] [CrossRef]
- Varsha, K.K.; Devendra, L.; Shilpa, G.; Priya, S.; Pandey, A.; Nampoothiri, K.M. 2,4-Di-Tert-Butyl phenol as the antifungal, antioxidant bioactive purified from a newly isolated Lactococcus sp. Int. J. Food Microbiol. 2015, 211, 44–50. [Google Scholar] [CrossRef] [PubMed]
- Yin, L.; Wang, C.; Zhu, X.; Ning, C.; Gao, L.; Zhang, J.; Wang, Y.; Huang, R. A multi-step screening approach of suitable non-saccharomyces yeast for the fermentation of hawthorn wine. LWT Food Sci. Technol. 2020, 127, 109432. [Google Scholar] [CrossRef]
- Mendes, B.; Gonalves, J.; Câmara, J.S. Effectiveness of high-throughput miniaturized sorbent- and solid phase microextraction techniques combined with gas chromatography-mass spectrometry analysis for a rapid screening of volatile and semi-volatile composition of wines—A comparative study. Talanta 2012, 88, 79–94. [Google Scholar] [CrossRef]
- Câmara, J.S.; Arminda Alves, M.; Marques, J.C. Development of headspace solid-phase microextraction-gas chromatography-mass spectrometry methodology for analysis of terpenoids in Madeira wines. Anal. Chim. Acta 2006, 555, 191–200. [Google Scholar] [CrossRef]
- Hjelmeland, A.K.; King, E.S.; Ebeler, S.E.; Heymann, H. Characterizing the chemical and sensory profiles of United States cabernet sauvignon wines and blends. Am. J. Enol. Vitic. 2013, 64, 169–179. [Google Scholar] [CrossRef]
- Wylie, P.; Hjelmeland, A.; Runnebaum, R.; Ebeler, S. Analysis of pinot noir wines by HS-SPME GC/Q-TOF: Correlating geographical origin with volatile aroma profiles. Planta Med. 2016, 82, OA49. [Google Scholar] [CrossRef] [Green Version]
- Baumann, S.; Conjelko, T.; Aronova, S.; Lafond, S.; David, F.; Ebeler, S.E. Accurate mass retention time locked flavor database by GC-TOF. In Proceedings of the American Society for Mass Spectrometry Annual Conference, Minneapolis, MN, USA, 9–13 June 2013; p. MP-685. [Google Scholar]

Publisher’s Note: MDPI stays neutral with regard to jurisdictional claims in published maps and institutional affiliations. |
© 2022 by the authors. Licensee MDPI, Basel, Switzerland. This article is an open access article distributed under the terms and conditions of the Creative Commons Attribution (CC BY) license (https://creativecommons.org/licenses/by/4.0/).