Article

Performance Exploration of Ni-Doped MoS2 in CO2 Hydrogenation to Methanol

1
State Key Laboratory of High-Efficiency Coal Utilization and Green Chemical Engineering, College of Chemistry and Chemical Engineering, Ningxia University, Yinchuan 750021, China
2
Guangdong Bangpu Recycling Technology Co., Ltd., Foshan 528000, China
3
College of Chemical Engineering, Qingdao University of Science & Technology, Qingdao 266042, China
*
Authors to whom correspondence should be addressed.
Molecules 2023, 28(15), 5796; https://doi.org/10.3390/molecules28155796
Submission received: 4 July 2023 / Revised: 23 July 2023 / Accepted: 26 July 2023 / Published: 1 August 2023
(This article belongs to the Special Issue Molecular Catalysts for CO2 Reduction)

Abstract

:
The preparation of methanol chemicals through CO2 and H2 gas is a positive measure to achieve carbon neutrality. However, developing catalysts with high selectivity remains a challenge due to the irreversible side reaction of reverse water gas shift (RWGS), and the low-temperature characteristics of CO2 hydrogenation to methanol. In-plane sulfur vacancies of MoS2 can be the catalytic active sites for CH3OH formation, but the edge vacancies are more inclined to the occurrence of methane. Therefore, MoS2 and a series of MoS2/Nix and MoS2/Cox catalysts doped with different amounts are prepared by a hydrothermal method. A variety of microscopic characterizations indicate that Ni and Co doping can form NiS2 and CoS2, the existence of these substances can prevent CO2 and H2 from contacting the edge S vacancies of MoS2, and the selectivity of the main product is improved. DFT calculation illustrates that the larger range of orbital hybridization between Ni and MoS2 leads to CO2 activation and the active hydrogen is more prone to surface migration. Under optimized preparation conditions, MoS2/Ni0.2 exhibits relatively good methanol selectivity. Therefore, this strategy of improving methanol selectivity through metal doping has reference significance for the subsequent research and development of such catalysts.

Graphical Abstract

1. Introduction

In the process of rapid human development, the excessive emission of carbon dioxide has led to a series of natural disasters such as global warming, continuous rise in sea levels, agricultural production reduction, and growing ocean acidification [1,2,3]. It is noteworthy that CO2 can be described as a cheap and abundant C1 material if carbon dioxide is captured by a reasonable means and formed into chemical products with high industrial application value (methanol, aromatics, etc.) [4,5,6]. Among the abundant chemicals mentioned above, methanol is the preferred choice for the direct catalytic reaction of CO2 gas to oxygenates because it can be considered an excellent precursor for some chemicals and a fuel substitute [7,8]. The efficient catalysis of CO2 to CH3OH is exothermic, and low temperatures favor equilibrium shifts in the product direction. However, the activation of the C–O inert bond in CO2 requires a high temperature [9]. Therefore, considering the thermodynamic and kinetic contradictions of this reaction, it is extremely important and urgent to prepare a reasonable catalyst for the conversion of CO2 and hydrogen into methanol under low-temperature conditions.
The catalyst systems mainly include Cu-based metal catalysts [10,11,12], precious metal catalysts [13,14], and metal oxide catalysts [15,16,17]. As is well known, with the birth of the industrialized Cu/ZnO/Al2O3 catalyst, copper-based catalysts are the most mature and deeply explored in the research field of CO2 to methanol. However, the active phase is poisoned and inactivated due to the H2O generated by the competitive side reaction of RWGS as well as the sulfur contained in the feed gas, which ultimately leads to poor stability. Precious metal catalysts are not suitable for large-scale applications due to their high price. Therefore, it is urgent to explore relevant catalysts with high conversion rates and high stability suitable for CO2 to methanol under a low-temperature reaction environment.
As a two-dimensional layered material similar to graphene, the surface atoms of MoS2 are almost completely exposed, so the atom utilization rate is greatly improved. The modifiability is strong, and the physical compatibility is high. There is a strong covalent bond between sulfur and molybdenum atoms, and the structure is stable. The H2 adsorption on the MoS2 surface is irreversible at low temperatures, indicating that MoS2 has a certain hydrogen storage capacity. Because of its structural advantages, MoS2 shows good chemical properties, so it has been widely applied in various catalytic areas such as electrochemistry, photochemistry, and thermochemistry. Combined with the structural similarity and strong conductivity of graphene, MoS2 supported on graphene shows better catalytic properties for CO2 to methane, and the selectivity of the main product is 95% [18,19]. The catalytic mechanism and performance of the Mo6S8 cluster for the chemical reaction between CO2 and H2 to obtain CH3OH are explored by density functional theory (DFT). Calculation results prove that the C–O cleavage contained in HxCO intermediates can be effectively promoted by MoS2 [20]. Thus, catalyzed by MoS2, the high selectivity of the methanol is explained. It is found that the CO2 conversion is 12.5% at a low temperature of 180 °C catalyzed by the novel MoS2. The selectivity to methanol is high (94.3%), and the stability is maintained for 3000 h without inactivation [21]. The study shows that the sulfur vacancies contained in the basal plane are conducive to methanol formation, while the edge sulfur vacancies are the active centers for the excessive hydrogenation of methane. From this perspective, edge S vacancies are meaningful for describing the CH3OH selectivity, and minimizing the generation of sulfur vacancies at edge locations will be a promising strategy for improving the methanol selectivity catalyzed by MoS2.
Metal doping is an effective and feasible method for improving the performance of catalysts for various catalytic reactions. In addition to being directly used as a reasonable catalyst for producing methanol from CO2 gas, MoS2 can also be used as a single-atom support. The Pt monomer supported by MoS2 that facilitates the methanol selectivity is 95.4% because of the synergistic impact between molybdenum disulfide and adjacent Pt monomers [22]. DFT analysis shows that the Co adatom-induced interstitial states play a major role in the breakage of CO2 into the product methanol. Therefore, it is theoretically inferred that a single Co atom supported on a monolayer of molybdenum disulfide is an excellent catalyst for catalyzing carbon dioxide into methanol. This work proves, from the perspective of theoretical knowledge, that single-atom catalysts are supported on MoS2 [23]. Encouraged by these reported results, herein, a kind of nanoscale MoS2/Ni and MoS2/Co catalysts with different proportions are prepared by hydrothermal method. Experimental exploration shows that the atomic doping of Ni and Co causes the structures of MoS2 monolayers to be confined with NiS2 and CoS2 that are formed by Ni, Co, and S, respectively. The embedded NiS2 and CoS2 can prevent the CO2 and H2 from approaching the edge sulfur vacancy, so the CH3OH selectivity is improved. As an experimental result, the optimal catalysis MoS2/Ni0.2 achieved a good methanol selectivity of 83.7%. Therefore, the methanol selectivity can be improved by the metal doping strategy.

2. Results and Discussions

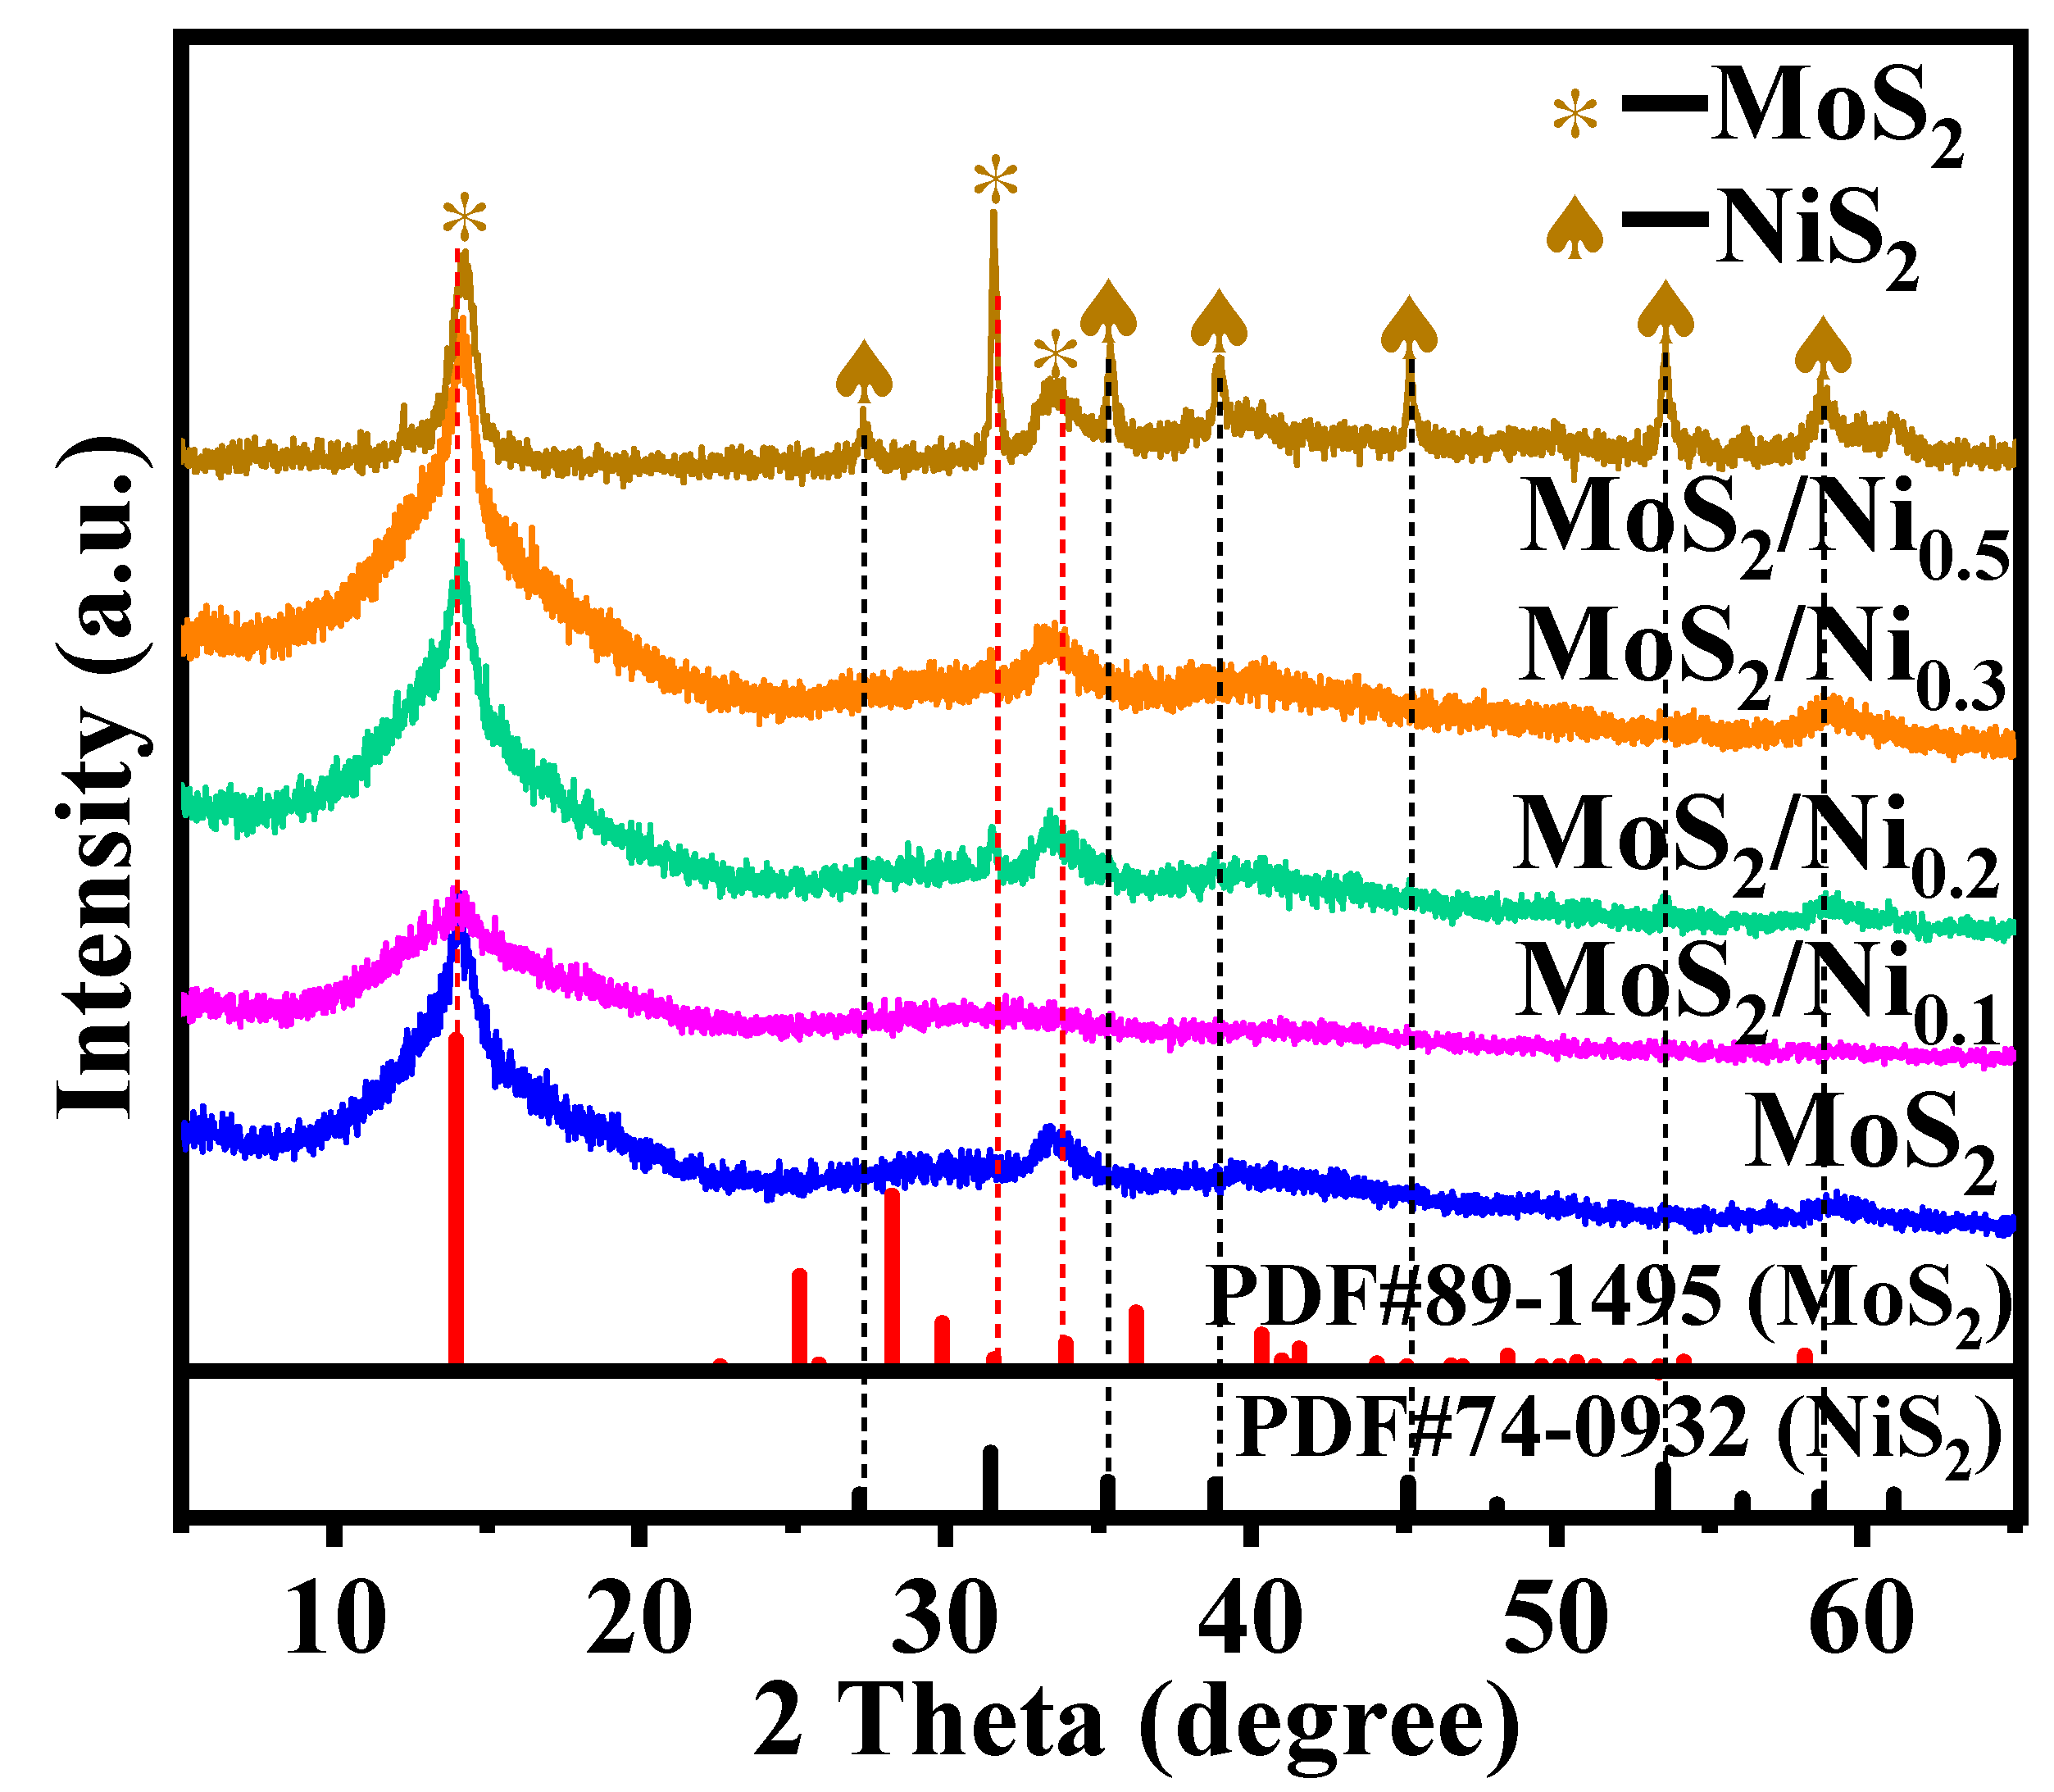
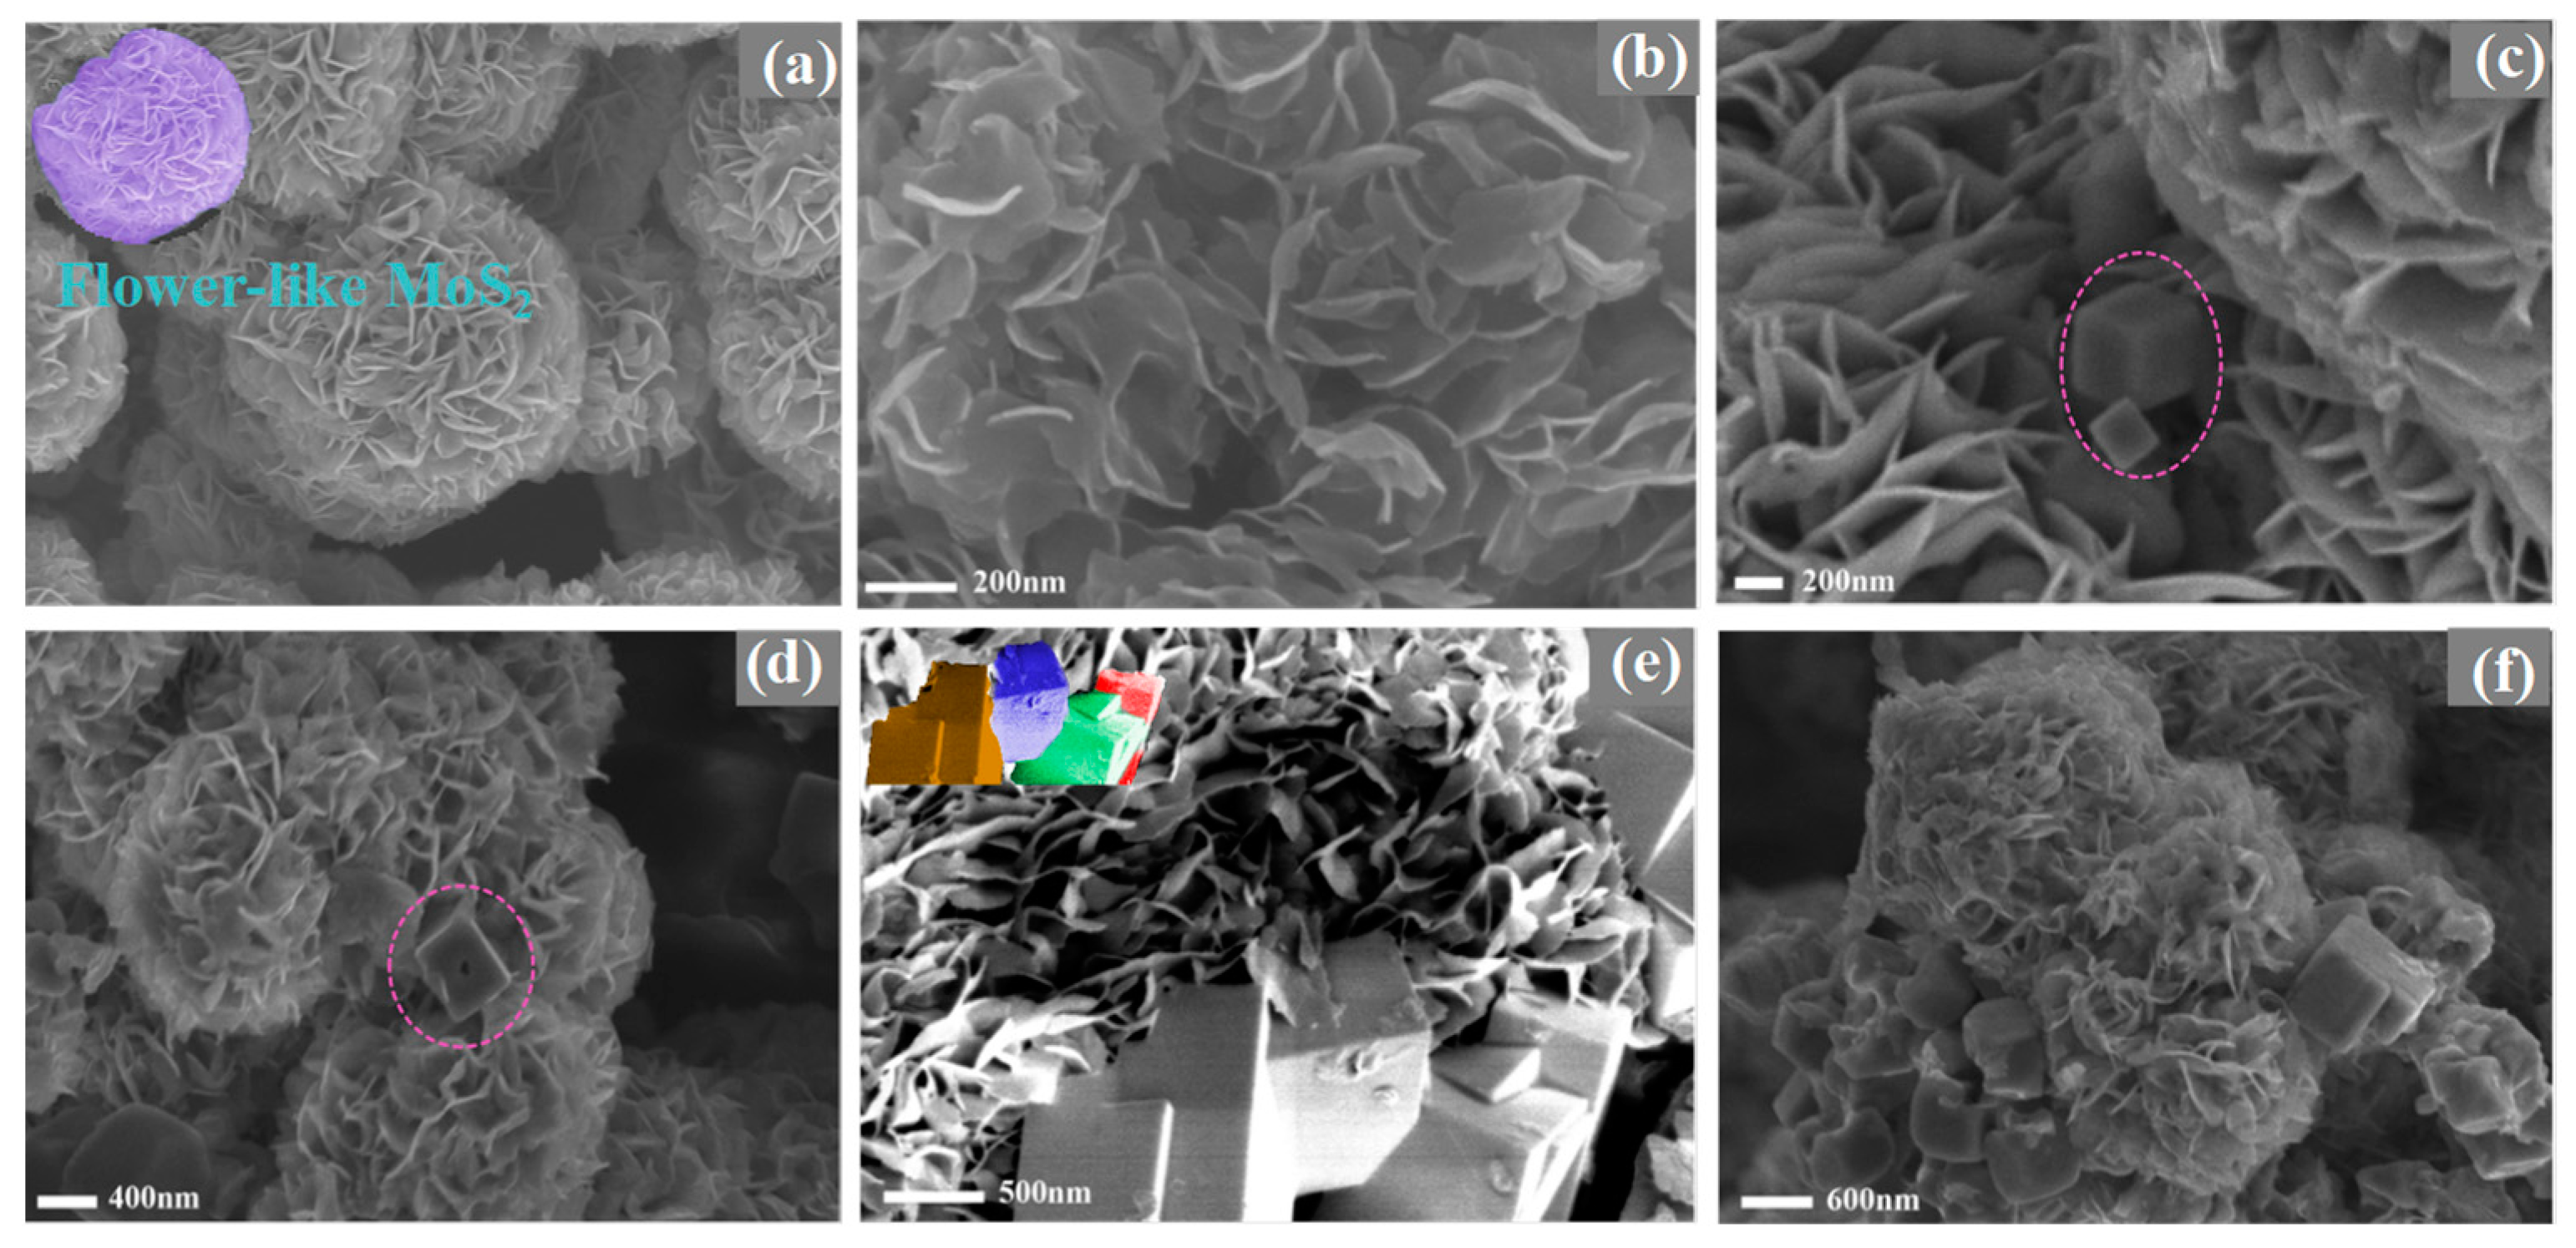
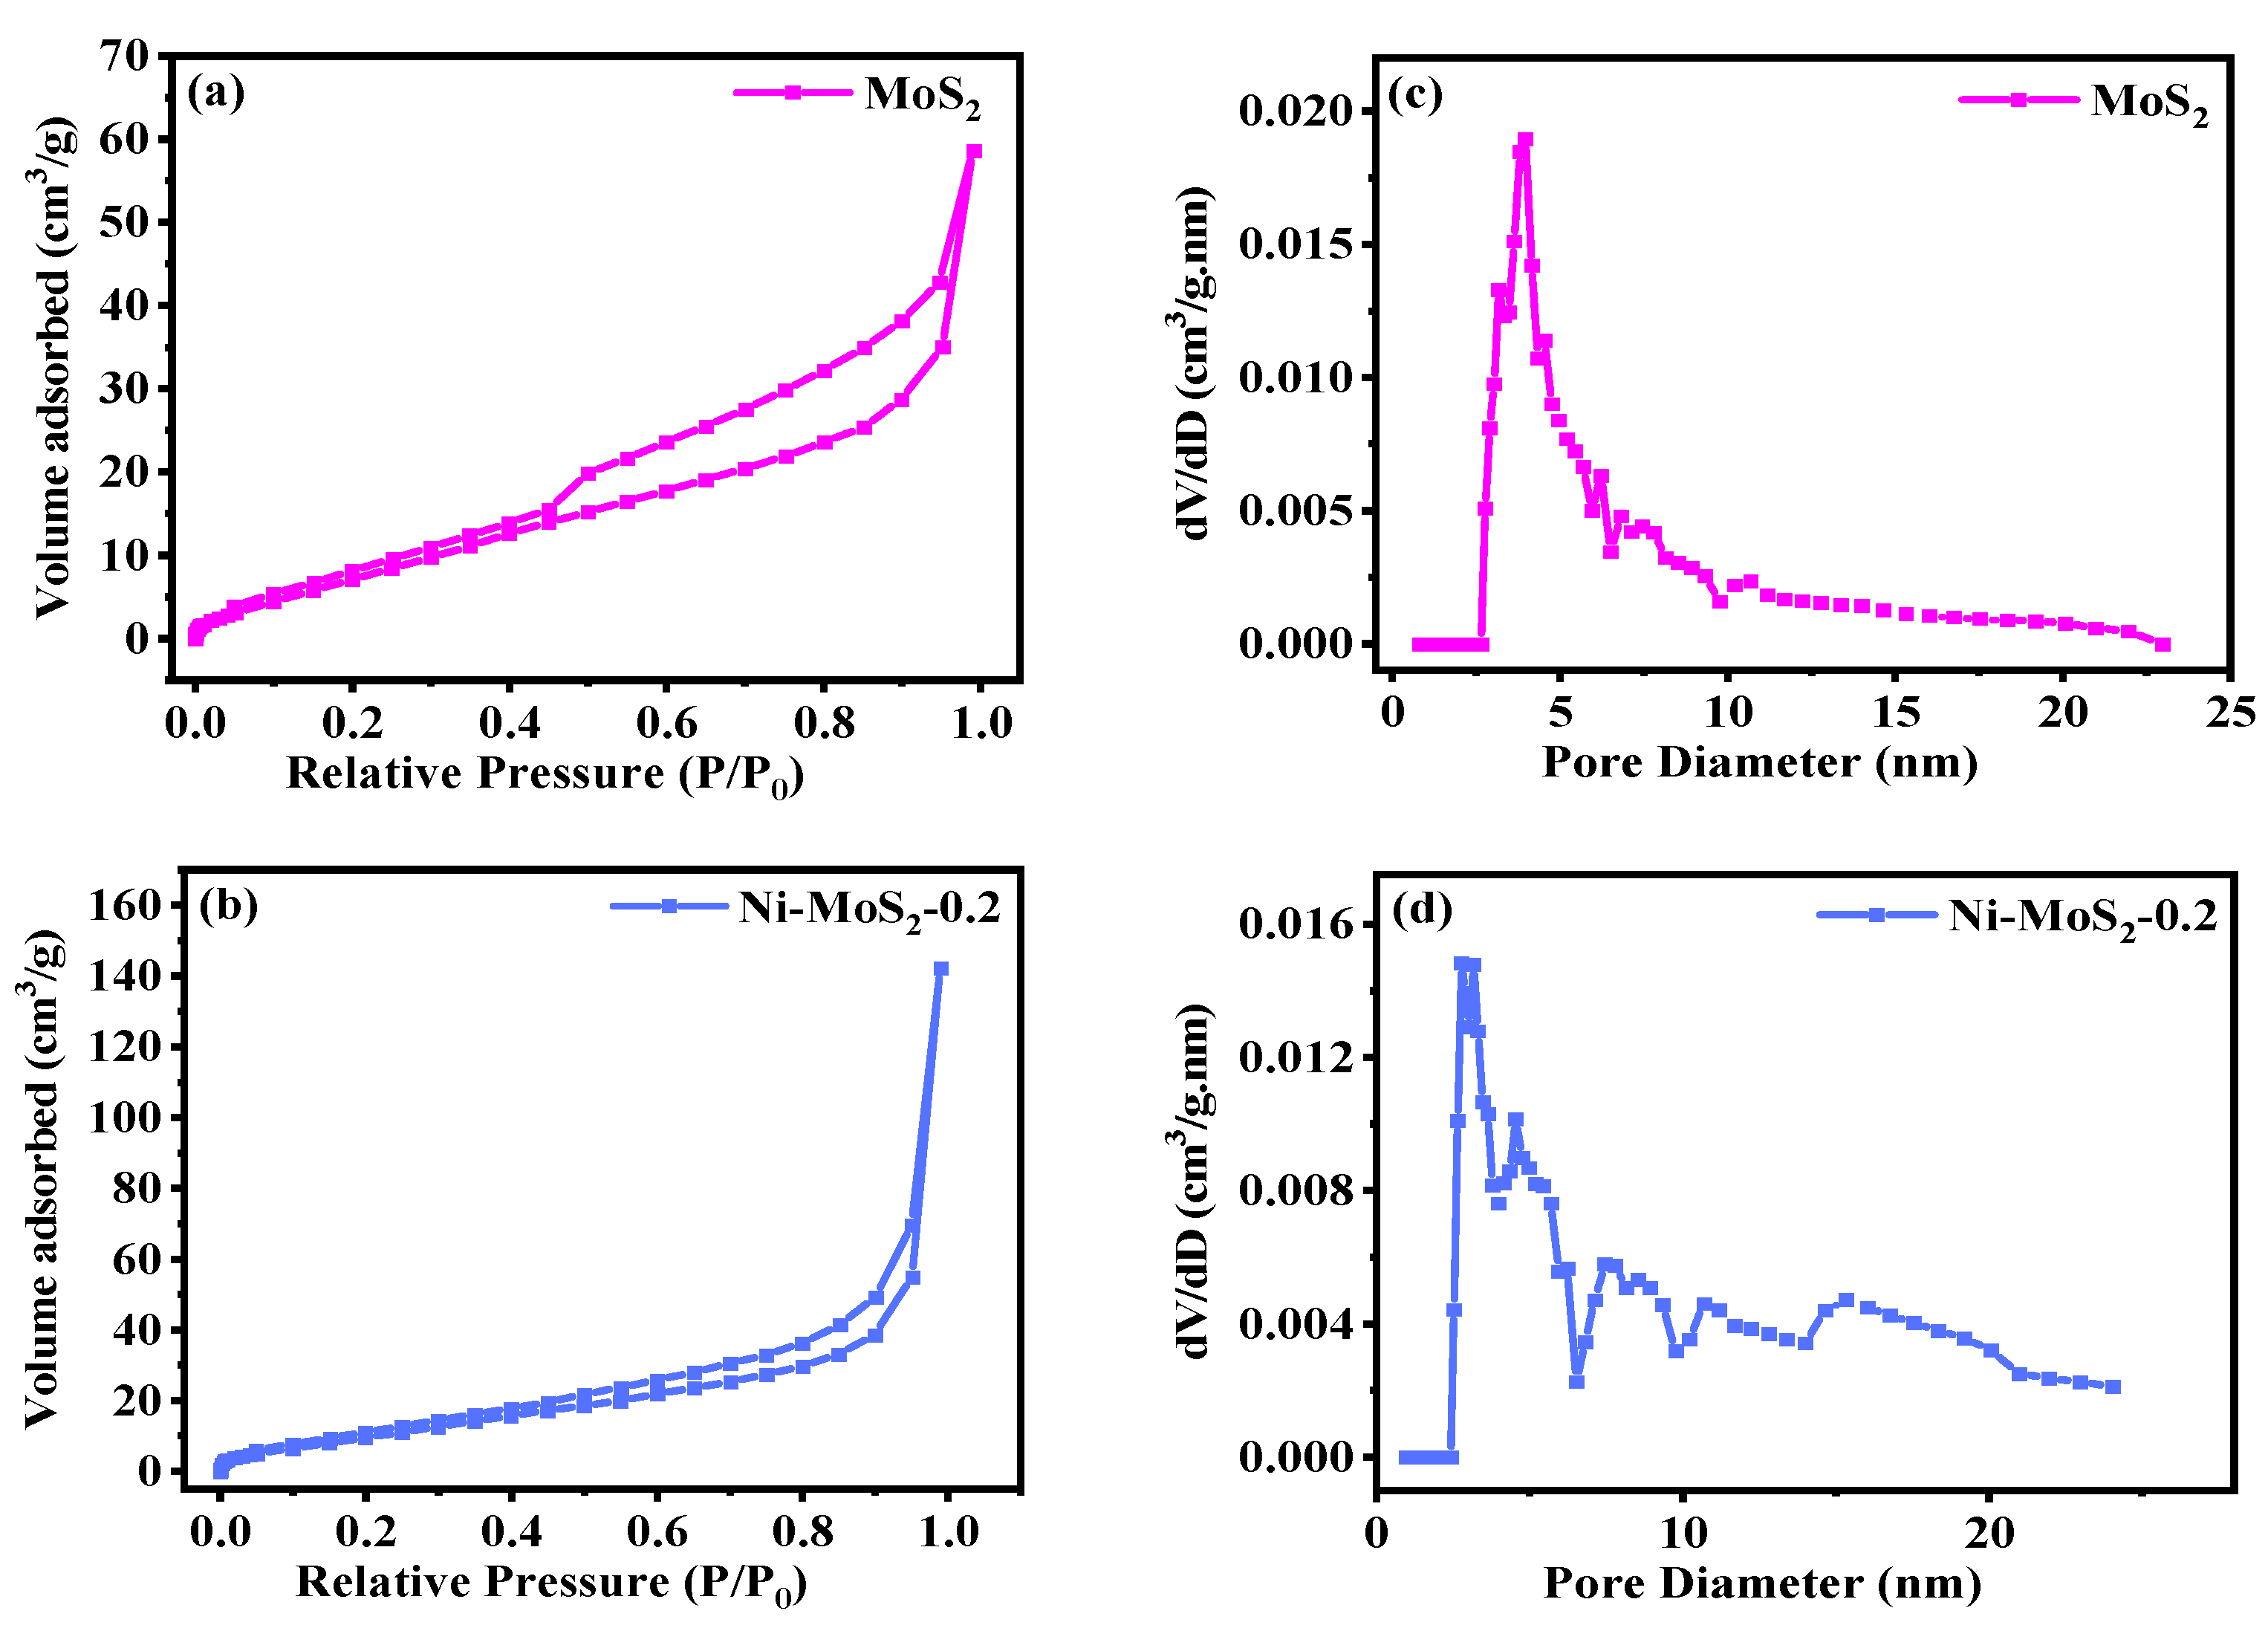
2.1. Exploration of Various Characterization Results

As depicted in Figure 1, the crystalline phase structure of pure MoS2 and Ni-doped samples is confirmed by XRD patterns. The pure MoS2 catalyst exhibits a stable hexagonal 2H-type crystal structure when the metal Ni is undoped, and the individual diffraction peaks corresponding to the (002) (100) (103) (110) crystal planes of PDF#89-1495 are visible. All illustrations are presented in the form of broad reflections of lower intensity, indicating the poor crystallinity of the coherent scattering in the nanometer range. Ni doping makes the (002) crystal plane of MoS2 broaden obviously, and the diffraction peak related to Ni is not observed, indicating that the excellent dispersibility of Ni doping is conducive to the reduction of catalyst grain size. The reduction of layers number in the MoS2 stack after metal doping can be explained by this important result [24]. In other words, the growth of MoS2 grains can be effectively suppressed by metal doping. As the doping amount of Ni increases to 0.2 mmol, the diffraction peak of MoS2 is enhanced, and a peak of NiS2 appears, which is because of the rapid binding of Ni ions with S2− that is produced by the decomposition of thiourea. With the further increase in Ni doping amount, the sharp diffraction peaks and smaller half widths of NiS2 and MoS2 indicate that their crystallinities become stronger and the grain sizes are increased. Different from Ni doping, because the electronegativity of the Co element is weaker than Ni in the same period, the chemical forces between Co and MoS2 are relatively weak, resulting in a worse dispersibility of Co doping than Ni, so the (002) crystal plane of MoS2 is higher than Ni doping (Figure S1).
To further demonstrate the apparent structures of pure MoS2 and the new catalysts formed by metal doping, scanning electronic microscopy (SEM) is analyzed. In MoS2 structure, six S atoms are tightly packed up and down to form a sixfold triangular prism, and the triangular prism voids are formed. Mo atoms are filled into these voids, resulting in a two-dimensional sheet. Monolayers of 2D flakes can stack through van der Waals forces and weak coordination bonds and form different types of interlayer voids. Therefore, as shown in Figure 2a,b, MoS2 is composed of abundant lamellar nanoflowers, and there are certain gaps between the layers, which is beneficial for deep adsorption of carbon dioxide gas and hydrogen with the catalyst. As depicted in Figure 2c, compared to pure MoS2, a small amount of doped Ni ions is quickly combined with the S2− that is generated by the decomposition of thiourea to form larger NiS2 particle cubes, with a trend of concave surfaces along the centerline. As the reaction progresses, the raw materials continue to react with these large cubes, forming newly exposed surfaces from the centerline of the cube surface and gradually extending towards the interior of the cube, so the smaller NiS2 volume cube particles are formed and separated.
When the Ni doping amount increases to 0.2 mmol, only irregular small particles are observed and are just filled at the outer edge of the MoS2 layer, resulting in an increasing in interlayer spacing and a reduction of layers number, so the particles are reduced (Figure 2d), which are consistent with the XRD results. On the one hand, the stacking height and voids are increased, and the multilayer stacking structure is more stable [25]. On the other hand, the benign increase in interlayer spacing is conducive to the deep adsorption of carbon dioxide and hydrogen molecules between the layers, the location of NiS2 leads to the exposure of less edge S vacancies, and, finally, the CH3OH selectivity is effectively promoted. With further doping of Ni, the sample exhibits unseparated cubic blocks or irregular particles, a large amount of NiS2 is accumulated and covers the surface of MoS2, and the CH3OH selectivity is reduced (Figure 2e,f). Therefore, the formation of NiS2 particles is an anti-Ostwald ripening evolution model of large particle splitting and small particle growth separation [26]. An appropriate amount of metal doping can effectively improve the CH3OH selectivity. On the contrary, excessive metal addition will cause a large area of NiS2 accumulation in the material surface layer, which will affect the catalytic performance. Similar situations have also occurred with Co doping (Figure S2).
The chemical states of elements of the best-performing MoS2/Ni0.2 catalyst are measured through X-ray photoelectron spectroscopy (XPS) for further study. The XPS measured spectra are shown in Figure 3, and all surface composition values are obtained from the spectral results. As displayed in Figure 3a, the Mo, S ratio in MoS2 conforms to the chemical formula, while the ratio of these two elements in MoS2/Ni0.2 is lower than the chemical formula. The spectrum of Ni 2p is composed of spin-orbit peaks at 853.2 eV and 870.8 eV of Ni 2p3/2 and Ni 2p1/2, respectively. An oscillatory satellite peak occurs from the Ni element, displaying the presence of Ni2+ (Figure 3b) [27]. The XPS spectrum related to Mo 3d region is displayed in Figure 3c. The binding energies at 232.0 eV and 229.1 eV are attributed to Mo 3d3/2 and Mo 3d5/2, respectively, proving that Mo appears with Mo4+ valence state in MoS2/Ni0.2. The characteristic peak at 226.1 eV corresponds to S 2s. This phenomenon is in agreement with the spectral phenomena of the Mo 3d region of molybdenum disulfide without Ni doping, which proves that the doping of Ni does not result in a fundamental change in the valence state of molybdenum and the successful formation of MoS2 in MoS2/Ni0.2 [28]. It is worth mentioning that the appearance of the Ni–Mo chemical bond confirms that there is a strong chemical force between MoS2 surfaces and Ni in the MoS2/Ni0.2 catalyst, which may weaken the Mo–S bond. XPS shows two strong S 2p peaks corresponding to binding energies at 163.2 eV as well as 161.8 eV for the S 2p1/2 and S 2p3/2 binding energies of S2− in the MoS2/Ni0.2 sample [29,30,31], which is attributed to the low surface coordination of sulfide ions and the lattice S of metal–sulfur bonds in NiS2 (Figure 3d) [32]. Therefore, the doping of Ni leads to the charge-density redistribution, the density of edge S vacancies is decreased, and the CH3OH selectivity is improved [33].
The chemical adsorption and effective catalysis of carbon dioxide are related to the alkalinity of the MoS2 surface [34,35]. To further explore the role of doped metals in the CO2 adsorption characteristics, the CO2–TPD results of MoS2/Nix (x = 0.1, 0.2, 0.3, 0.5) are shown in Figure 4. By comparing the desorption peak areas and peak positions of the four different Ni-doped catalysts, these materials have a certain adsorption capacity for acidic CO2 molecules. The CO2–TPD curve of MoS2/Nix (x = 0.3, 0.5) catalysts mainly contain medium-strength alkaline sites. The MoS2/Nix (x = 0.1, 0.2) catalyst exhibits three CO2 desorption regions, and the MoS2/Ni0.2 has the strongest alkaline site. The strong alkaline sites are closely related to methanol selectivity, which may lead to the MoS2/Ni0.2 catalyst having the best methanol selectivity [36]. As the amount of Ni added further increases, the desorption peak slowly becomes flat and wider, indicating that the bonding ability between CO2 and the catalyst is gradually weakened, and the catalytic performance decreased accordingly. This result indicates that an appropriate amount of Ni is doped on MoS2, with the effective acid–base interaction between the basic S–Mo and S–Ni functional groups of the catalyst and the acidic CO2 molecules. In addition, the dipole–dipole chemical interaction between carbon dioxide and the polar sites related to S functional groups also plays a key role in the adsorption level of CO2 gas, which has a positive effect on improving product selectivity [37].
However, excessive Ni doping results in ineffective contact between CO2 and catalyst sites. Interestingly, the peak shapes and peak areas of materials are also different with different Ni doping amounts, indicating that the CO2 adsorption is regulated by both the active component content and the MoS2 support. Similarly, the CO2–TPD curves of MoS2/Co catalysts prepared under the same conditions with different Co doping levels are shown in Figure S3. From the comparison chart of the adsorption level of the CO2 molecule, it can be seen that the four samples all have the corresponding desorption peaks in the intermediate and high-temperature regions. Although the strong alkaline site of MoS2/Co0.2 moves towards the high-temperature zone, the medium alkaline site moves towards the low-temperature zone. Thus, through CO2–TPD analysis, it can be deduced that MoS2/Ni0.2 is an ideal catalyst for carbon dioxide hydrogenation to methanol, which must be confirmed by activity evaluation.
The physical adsorption of hydrogen molecules on the catalyst surface is replaced by effective chemical adsorption at a certain temperature. Therefore, as shown in Figure 5, the reduction performance of the catalyst is studied through H2–TPR experiments. The active hydrogen rapidly migrates between adjacent S atoms to form H–S–H and the Mo or S edge is gradually reduced through “dissociation diffusion” [38,39]. Because of different particle shapes and dispersion levels in MoS2, different Ni doping differs in adsorption temperature and intensity. For MoS2/Ni0.1, one main peak appears at 324 °C [40]. With the suitable increase in metal doping, the double active sites are gradually enhanced, and the reduction energy consumption decreases, so that the reduction peaks of H2–TPR shift to the low-temperature direction. After the Ni doping amount is increased to 0.2 mmol, two well-separated peaks appear at 282 °C and 362 °C; the first peak significantly moves to lower reduction temperatures, and MoS2/Ni0.2 has the lowest reduction temperature, indicating that the metal sulfur bonds energy is reduced.
Combining XRD and SEM analysis, it is found that the strong interaction between doped metals and MoS2 is conducive to the dispersion of the catalyst and the reduction of catalyst particle size. The increased interlayer spacing of MoS2 results in an increase in Ni/Mo edge site. Hydrogen participates in the surface reaction, and the sulfur atom is reductively removed, resulting in an irreversible change of MoS2 structure. Thus, the Mo–S bond strength is weakened, the reducibility of MoS2 is enhanced, and a good reaction basis for the carbon dioxide hydrogen to methanol is provided [40]. The doping amount of Ni increased to 0.3 and 0.5 mmol, and the excessive and irregular accumulation of NiS2 is covered on the MoS2 surface. The reduction temperature is increased, and the reduction ability of the catalyst is weakened. Compared with MoS2/Cox catalysts, the MoS2/Co0.2 catalyst also has a good downward shift of the first peak position, but the reduction temperature is still higher than MoS2/Ni0.2 (Figure S4). Thus, the catalytic performance of Co-doped MoS2 may be lower than that of MoS2/NiX.
The specific surface area and pore size distribution of the material play an important role in the performance of the catalyst. The MoS2/Ni catalyst with Ni doping amount of 0.2 mmol and MoS2 catalyst are analyzed by N2 physical adsorption and desorption technology. The N2 adsorption and desorption trend and pore size distribution characteristics are listed in Figure 6 and Table 1. The adsorption isotherms of the MoS2 catalyst and MoS2/Ni0.2 catalyst belong to class VI isotherms. According to the standard classification of IUPAC, the characteristics of such isotherms reflect the characteristics of mesoporous materials (Figure 6a,b). When the relative pressure of P/P0 of MoS2 is 0.45~1.0, and the relative pressure of P/P0 of MoS2/Ni0.2 is 0.8~1.0, the adsorption capacity is improved. The pore size distribution ranges of the involved materials are shown in Figure 6c,d, which are obtained from the analysis of the pore size distribution curve. The highest point corresponding to the pore radius is greater than 2 nm, which further proves that both MoS2 and MoS2/Ni0.2 catalysts are mesoporous materials. Compared with MoS2, the MoS2/Ni0.2 catalyst exhibits a relatively smaller specific pore diameter as well as pore volume. It can be seen that the excellent CH3OH selectivity of MoS2/Ni0.2 may be due to its relatively small pore volume (0.090 cm3·g−1) and pore size (10.13 nm).

2.2. Performance of CO2 Feed Gas to CH3OH Conversion Catalyzed by MoS2, MoS2/Nix, and MoS2/Cox

Under the condition settings of 260 °C, 5 MPa, and 12,000 mL h−1 gcat−1 of gas hourly space velocity (GHSV), all catalytic evaluations are performed by a fixed-bed reactor, and the experimental results after testing are listed in Figure 7. As a comparative catalyst, the property of 2H-type MoS2 is studied first. The result shows that the CO2 conversion rate is 3.36% (Figure S5) and the methanol selectivity is 11.34%, and the main byproducts are methane and carbon monoxide. The catalytic characteristic of MoS2 for CO2 to product is well demonstrated by the experimental results, but the conversion and selectivity are expected to be improved. With the increase in Ni and Co doping amount, the CH3OH selectivity is also increased. When the Ni and Co doping amount is 0.2 nmol, the CH3OH of the catalyst MoS2/Ni0.2 and MoS2/Co0.2 reach the highest 83.73% and 73.82% (Figure 7). However, when the doping amount is further increased from 0.2 mmol to 0.3 mmol, the methanol selectivity shows a downward trend, because the appropriate proportion of Ni and Co addition leads to the blocking effect of edge S vacancies. On the contrary, excessive Ni and Co metals are doped, a large amount of NiS2 and CoS2 are stacked and covered on the reaction surface of the catalyst, the exposed sulfur vacancy active sites are blocked, and the catalytic performance is reduced. By comparing the CH3OH selectivity of Ni and Co-doped catalysts, it is determined that the catalytic property of the Ni-doped MoS2 catalyst slightly surpasses the Co-doped MoS2 catalyst.

2.3. Intermediates and Mechanisms Properties Involved in CO2 Hydrogenation to Methanol

2.3.1. Determination of Intermediates through In Situ Infrared Spectroscopy

The key adsorbents and intermediates included in the formation of methanol on the MoS2/Ni0.2 catalyst with the best performance are shown in Figure 8. The characteristic peak of CO2 gas appears at approximately 2350 cm−1 [41]. The peaks at 720 cm−1 and 907 cm−1 are attributed to O* characteristic and the peak intensity is obvious [21]. The vibration peak at 1080 cm−1 is attributed to the methoxy group (CH3O*) [42]. In situ DRIFTS experimental results show that the chemical bond of CO2 adsorbed on the MoS2/Ni0.2 surface is broken and forms CO* and O*, then CO* and dissociated H* react to form HCO* species. The generation of methoxy and methanol is due to subsequent gradual hydrogenation.

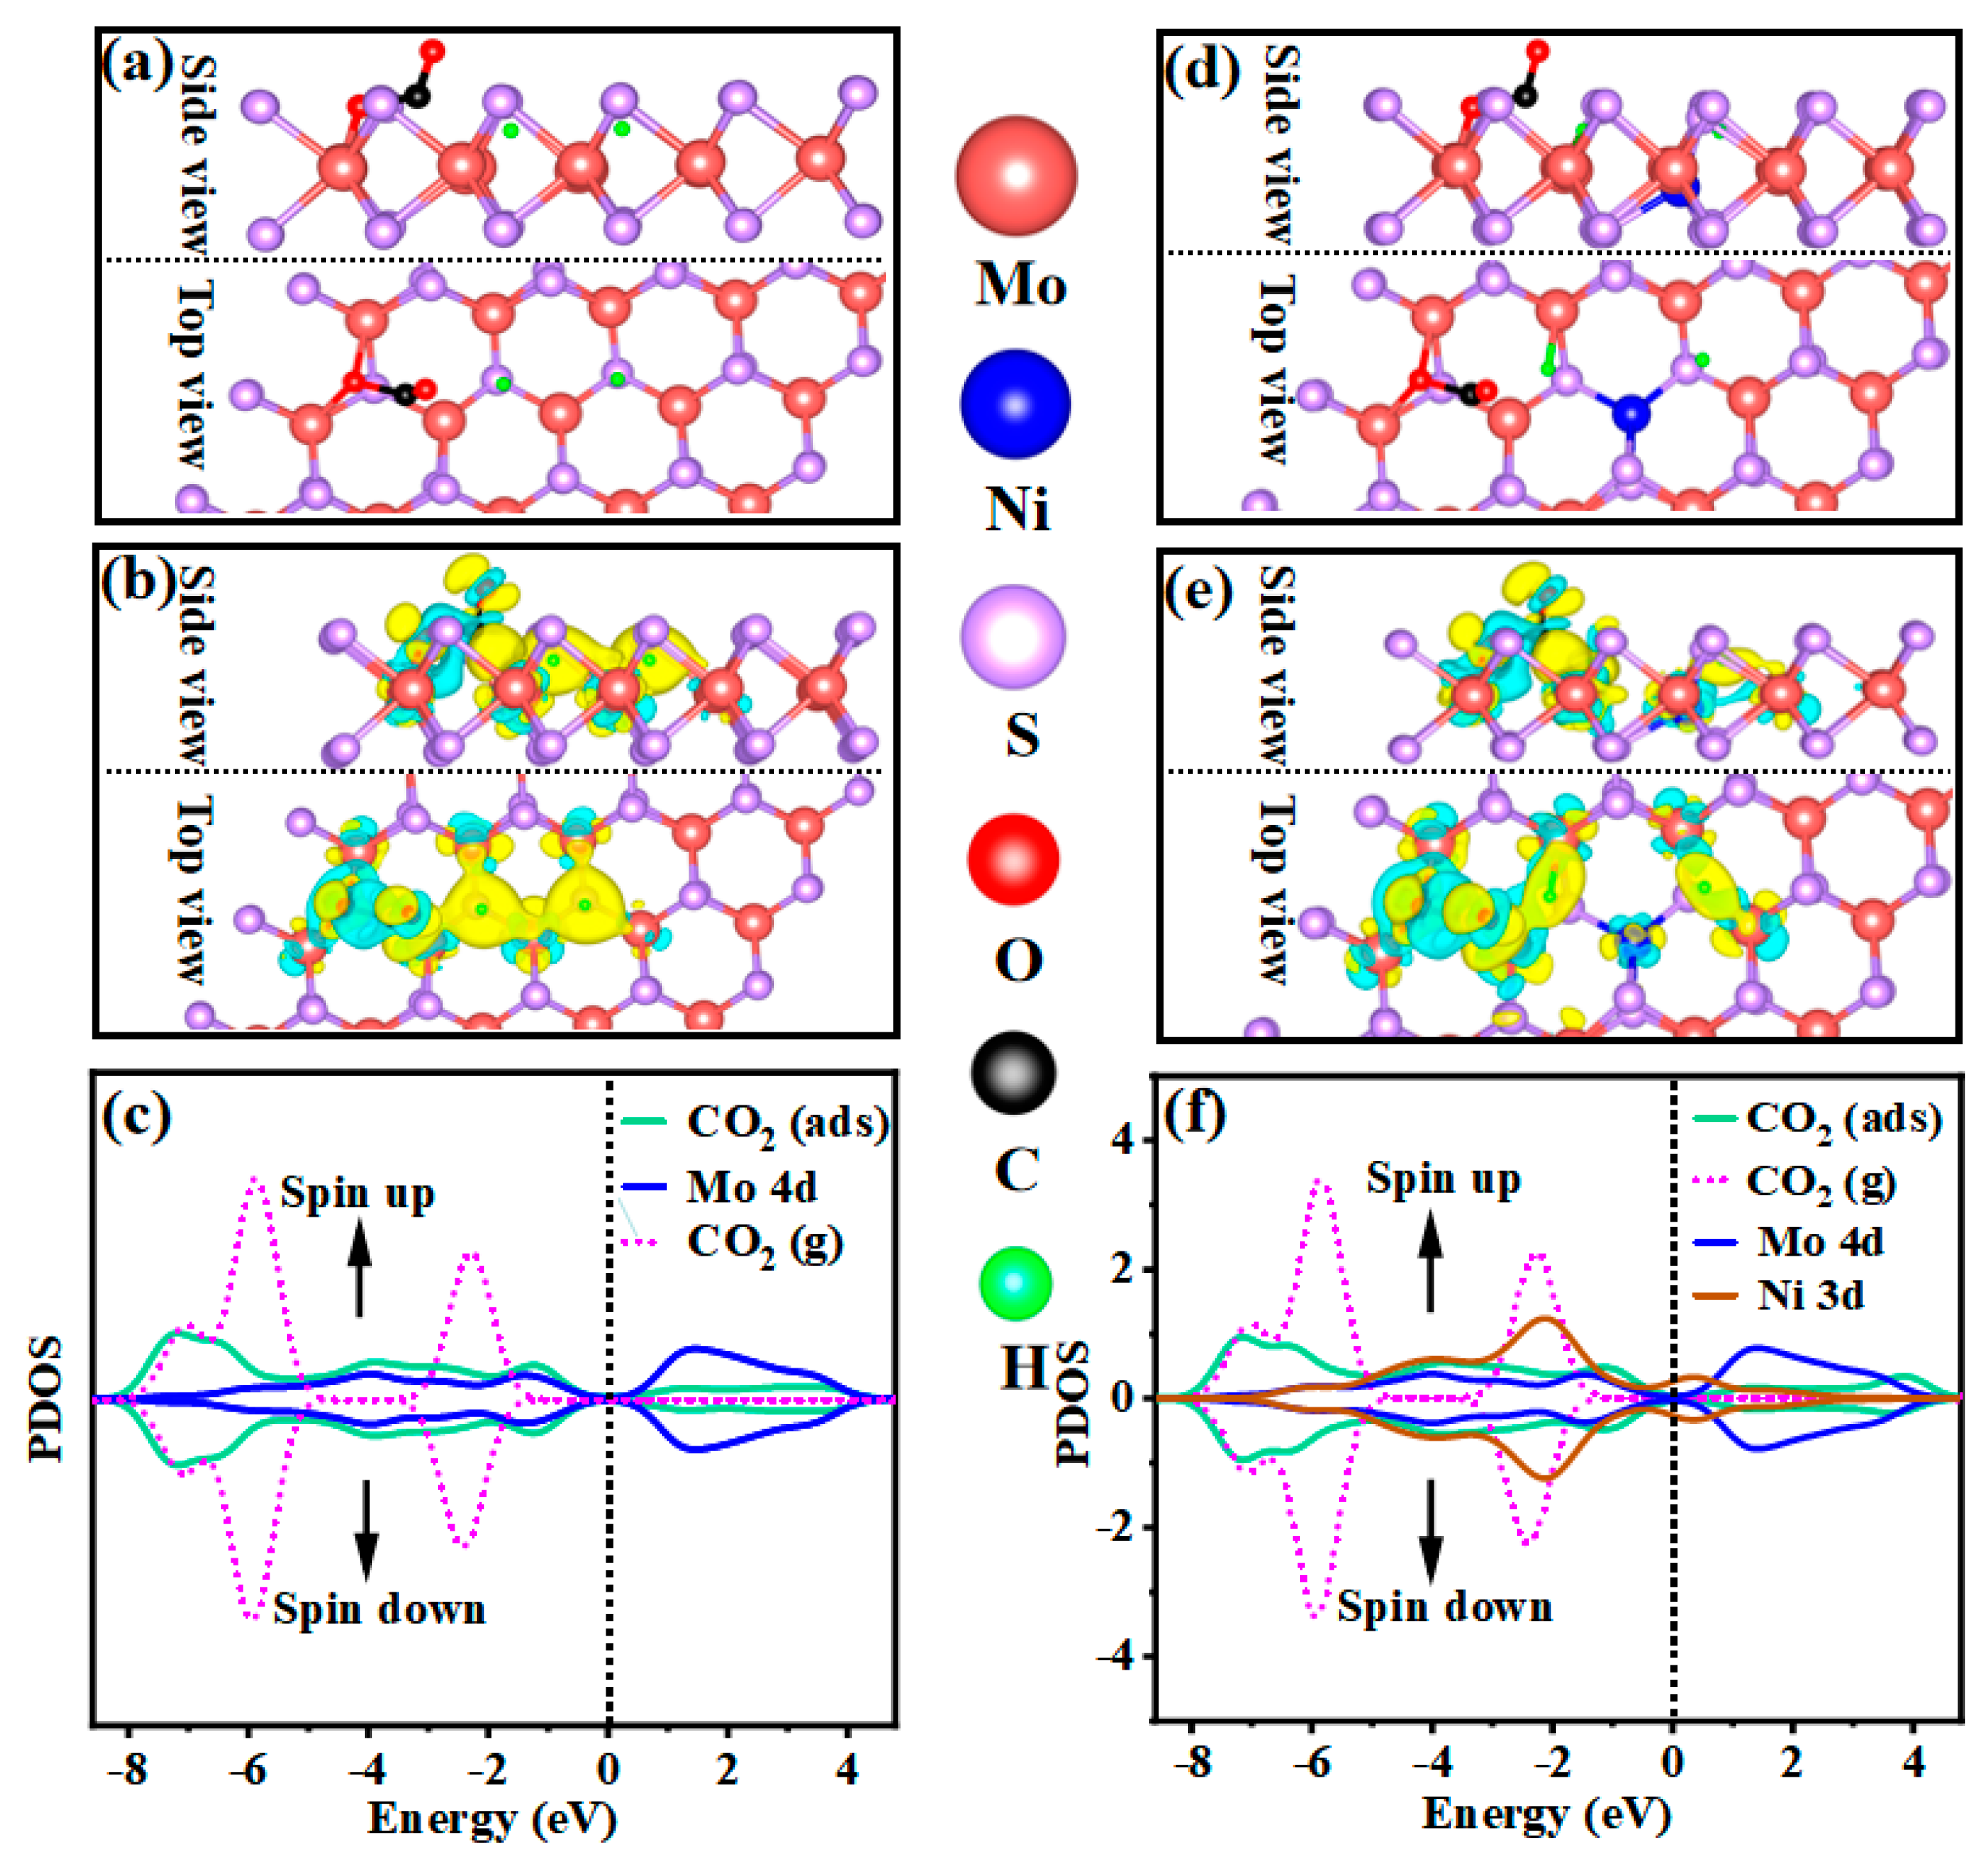
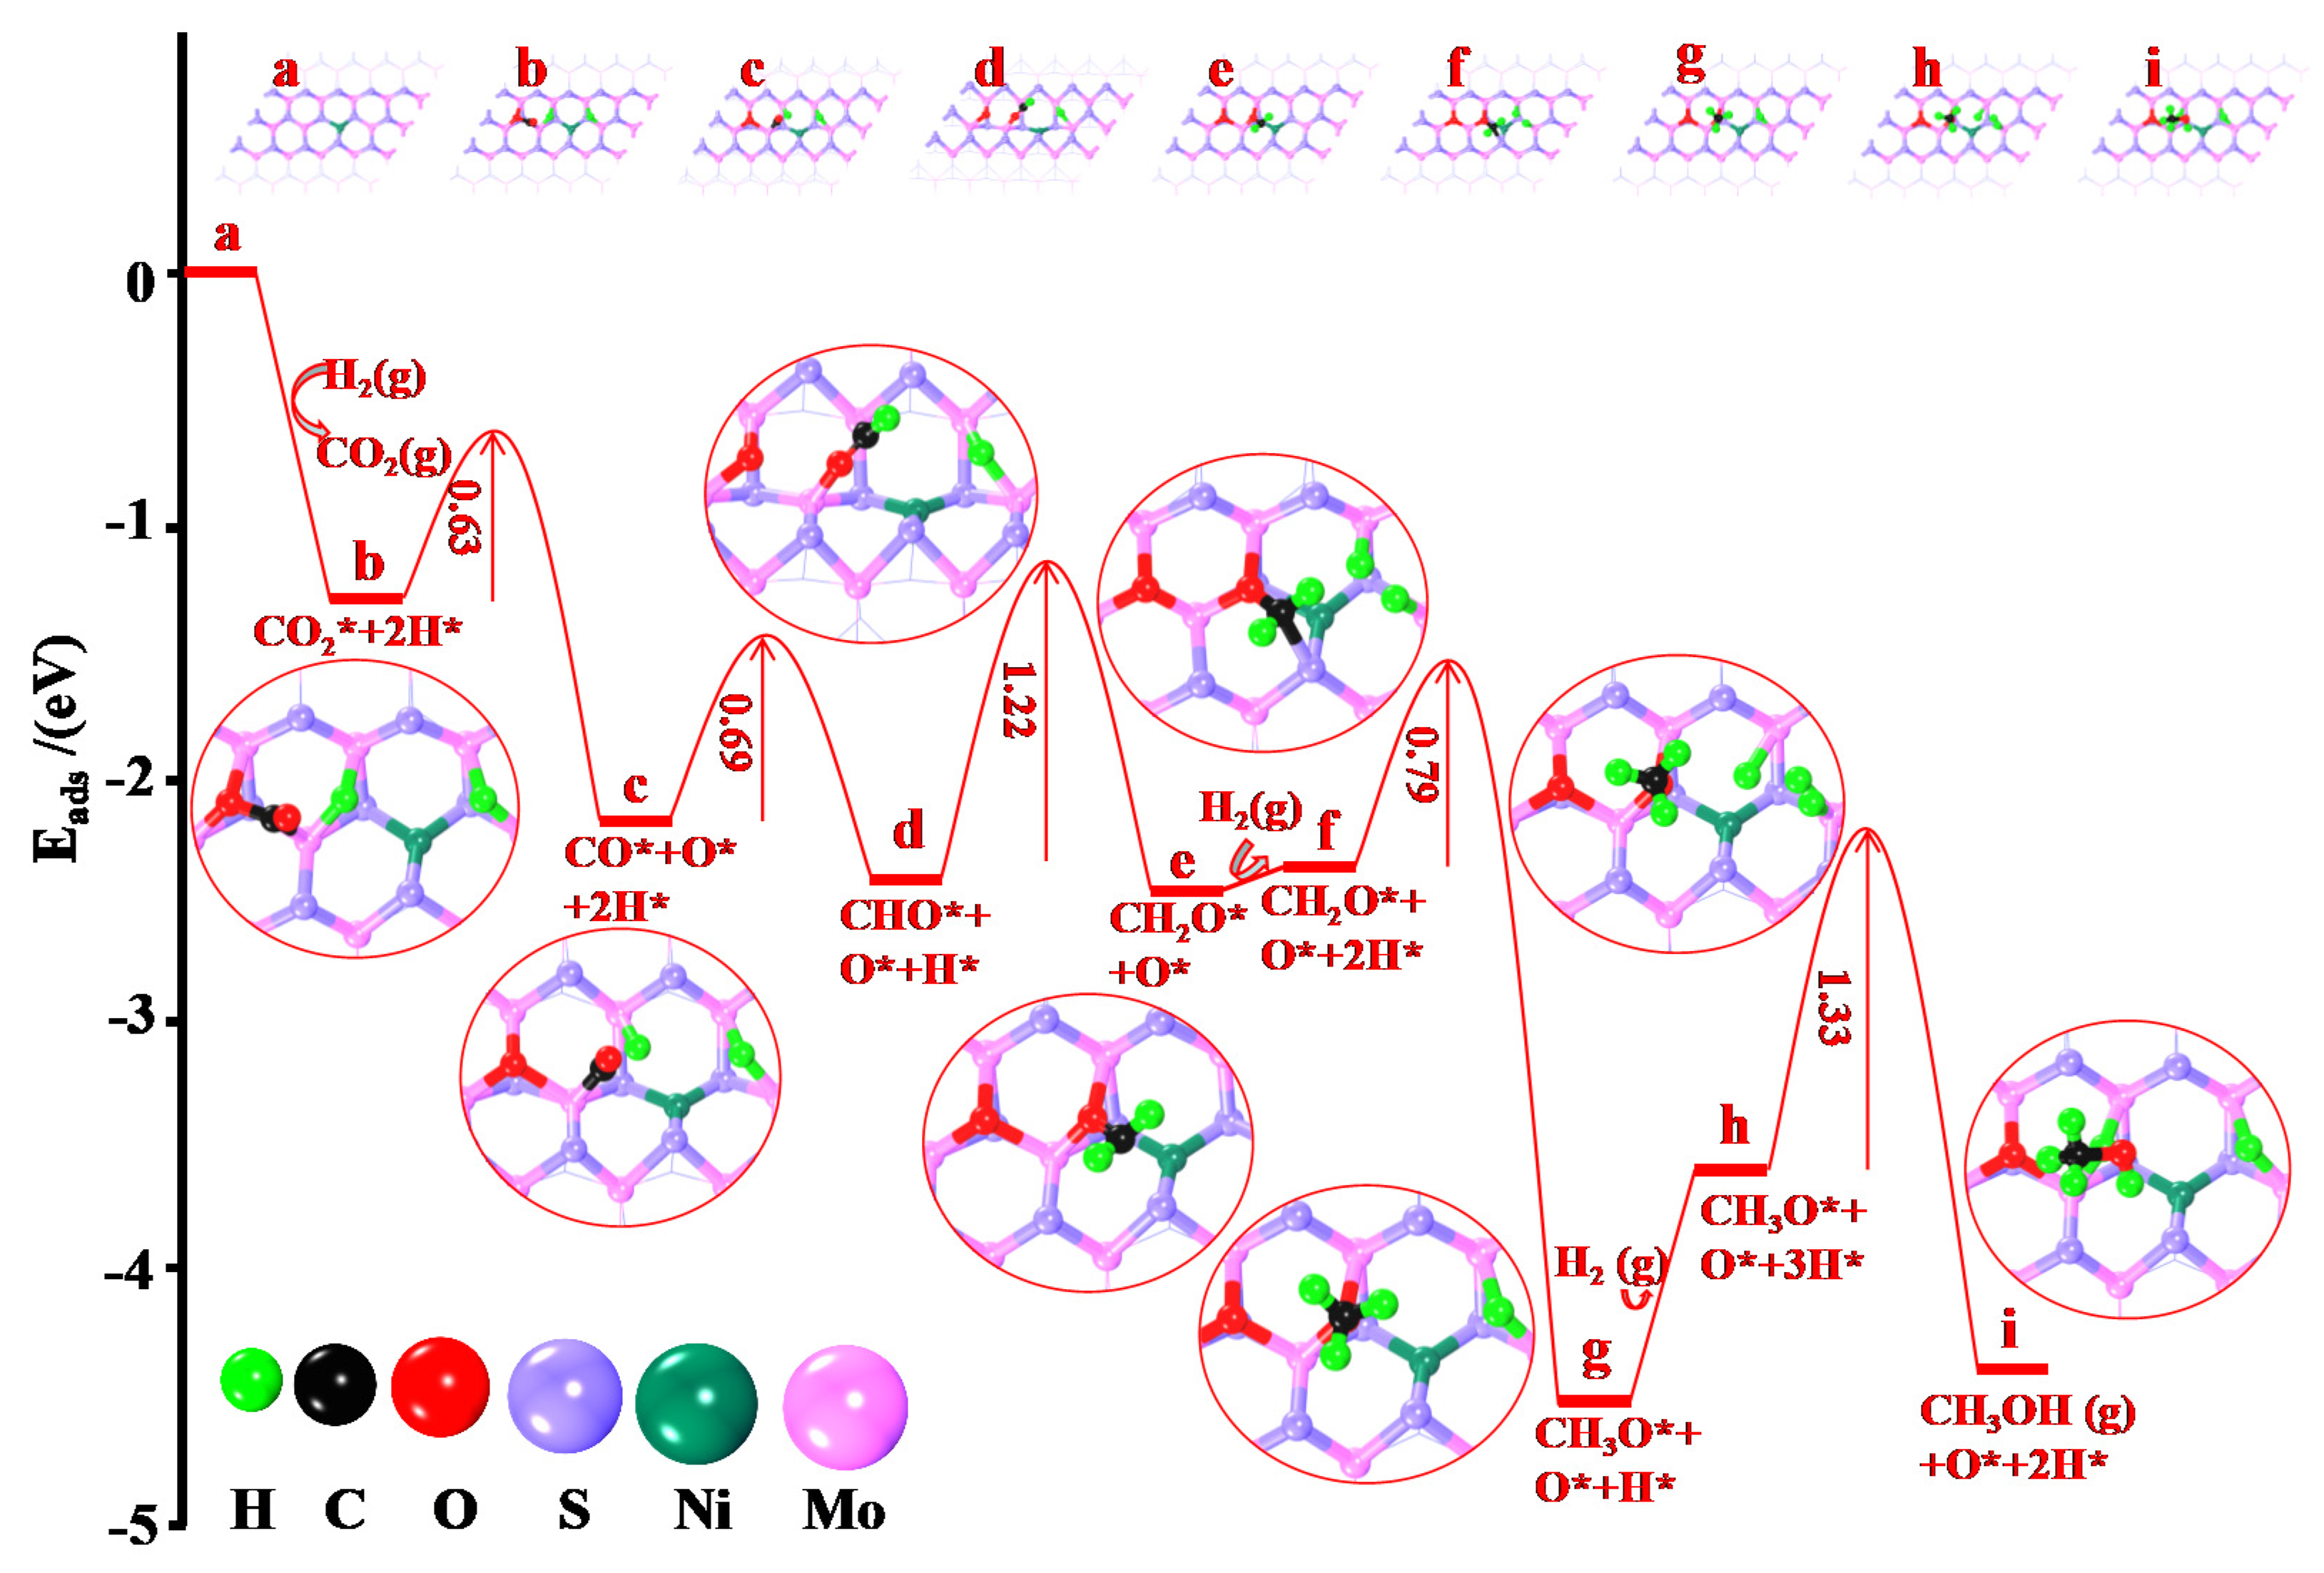
2.3.2. Determination of Mechanisms Properties through DFT Calculation

To provide a deeper explanation of metal doping in improving methanol selectivity, the reaction mechanisms of MoS2 and Ni/MoS2 are investigated by DFT theoretical calculations. The chemical adsorption of H2 and CO2 on the catalyst surface is determined as a prerequisite for subsequent reactions. Figure 9a shows the optimal adsorption structure for CO2 on the catalyst. The CO2 angle is from 180° to 120.20° and the O–C bond is elongated from 1.25 Å to 1.38 Å. The corresponding differential charge density (Figure 9b) confirms that Mo electrons are transferred to the adsorbed CO2. The corresponding PDOS analysis shows that the CO2 molecular orbital is not only shifted to a lower energy level after being adsorbed on the catalyst surface (Figure 9c), but also overlaps with the Mo 4d state after the CO2 gas becomes an adsorbed state on the MoS2 surface, proving the CO2 activation. As shown in Figure 9e, Ni doping leads to more unsaturated exposure of Mo, and the formed active hydrogen is more prone to surface migration. The interaction between Ni and the charge-rich center S in NiS2 gives it an appropriate affinity and bonding range. The local action of negative charge on the S atom and H2 occurs at the highest spin density position. The activation process involves the transfer of negative charge from the S atom to the H2 antibonding orbital σ*, the electron cloud distribution and orbital energy of the hydrogen molecule are changed, the four-center transition state is formed, the S–S and H–H bonds are weakened and heterocleaved, and the S–H bond is strengthened, which eventually leads to the breaking of the former and the formation of the latter. A larger range of orbital hybridization near the Fermi level (Figure 9f) makes the H2 bond break more thoroughly (Figure 9d). Combined with in situ infrared spectroscopy, the effective dissociation of hydrogen gas is conducive to the gradual hydrogenation of CO*, so the methanol selectivity is more highly catalyzed by MoS2/Ni0.2.
The chemically adsorbed CO2 is considered to have two reduction pathways: the formate pathway and CO hydrogenation. According to in situ DRIFTS spectra, CO2 hydrogenation catalyzed by MoS2/Ni tends to an oxidation–reduction pathway, and the optimal adsorption structures of different intermediates as well as barrier energy are shown in Figure 10. CO2 and H2 are directly dissociated into CO*, O*, and 2H* through the energy barrier of 0.63 eV. The large adsorption energy indicates that the interaction between CO* and MoS2 is very strong (Eads = −1.27 eV), and is more likely to undergo further reaction on the support without being released and forming CO gas. The calculation results indicate that CO* can be hydrogenated to CHO* by crossing only a potential barrier of 0.69 eV. It is evident that the carbon involved in CO is more susceptible to H proton attack than the oxygen atom, and forms CHO anchoring at the active site for subsequent hydrogenation reaction. The second hydrogenation step of CHO to CH2O needs a reaction barrier of 1.22 eV. The CH2O is further hydrogenated to CH3O, which just needs a barrier energy of 0.79 eV, and this hydrogenation process is exothermic, indicating that the CH3O is a beneficial intermediate. In the fourth hydrogenation reaction, CH3O can be reduced to CH3OH through an energy barrier of 1.33 eV (the decisive step of the reaction system) and easily desorbed from the catalyst surface. Therefore, based on the above mechanism exploration, methanol is the final product catalyzed by MoS2/Ni. Finally, the reaction mechanism is summarized as CO2* → CO* → CHO* → CH2O* → CH3O* → CH3OH.

3. Material and Methods

3.1. Materials

All the materials contained in the experiments are shown in Table 2.

3.2. Experimental Apparatus

All the instruments and types of equipment for experiments are shown in Table 3.

3.3. Preparation of MoS2, MoS2/Ni, and MoS2/Co Materials

MoS2/Ni and MoS2/Co are prepared by hydrothermal method. Firstly, 1 mmol ammonium molybdate tetrahydrate and thiourea (14 mmol) are transferred to distilled water (35 mL). To completely dissolve the reactants and form a homogeneous solution, the beaker containing the mixed reaction liquid should be placed on a magnetic suspension stirrer and stirred for 30 min. Different contents of nickel nitrate hexahydrate or cobalt nitrate hexahydrate are weighed and placed into the above solution to be completely dissolved. The thoroughly dissolved solution is poured into a hydrothermal kettle with Teflon-lined stainless steel, and the Teflon lid is tightly closed. The hydrothermal kettle is placed into a vacuum drying box, then reacted at 210 °C for 24 h. After the completion of catalyst preparation, the hydrothermal kettle is taken out and the temperature drops to cool down. The reacted substance is washed with deionized water 3 times and then washed again with anhydrous ethanol for the same process. Finally, the washed and centrifuged material is effectively dried by a drying oven, the drying temperature is 80 °C and the time is 12 h, and the final product sample is obtained. For experimental comparison, MoS2 is prepared by dissolving ammonium molybdate tetrahydrate (1 mmol) and thiourea (14 mmol) using the same preparation process as MoS2/Ni and MoS2/Co.

3.4. Characterization Methods

The crystal phase composition of the material is determined by a German BmkerD8 advanced X-ray diffractometer (XRD). The radiation source is Cu Kα rays, the tube voltage is 40 kV, and the tube current is 40 mA. The scanning range is 3–85°, and the scanning speed is 8°/min.
The specific surface area and the pore size distribution of the materials, are characterized by a Quanta Autosorb IQ automatic physical and chemical adsorption instrument. The adsorbate is N2, and the physical adsorption test is carried out under the condition of vacuum liquid nitrogen (−196 °C). Before the adsorption test, the samples needed to be degassed at a temperature of 200 °C for 6 h. The specific surface area is obtained by linear regression of the multipoint BET (Brunauer–Emmett–Teller) model, and the pore size distribution is obtained by the DFT model.
The microscopic morphology of the material is characterized by scanning electron microscopy (SEM) (Carl Zeiss Company, Jena, Germany) NanoPorts QUANTA250/QUANTA430.
The H2–TPR test is carried out on a chemisorption apparatus with automatic temperature (AutoChem II 2920) from Micromeritics Company, Georgia, USA. A 50–100 mg sample is weighed and placed in reaction tubes, and the test temperature rises from 25 °C to 300 °C with a rate of 10 °C/min for drying pretreatment, then cooled to 50 °C under He gas flow (30–50 mL/min) for 1 h. A 10% H2/Ar mixture is passed into the reaction tube with a fixed gas flow rate (30–50 mL/min) for 1 h to be saturated, and then switched to Ar with the same gas flow to eliminate weak physical adsorption of H2. Finally, the tested catalyst is heated to 500 °C in Ar atmosphere (heating rate is 10 °C/min) and desorbed, and the desorbed gas is detected by TCD.
The CO2–TPD test is carried out on a chemical adsorber (AutoChem II 2920) from Micromeritics, USA, which is a fully automatic temperature program. A 50–100 mg sample is weighed and placed in reaction tubes, and the test temperature is increased from 25 °C to 300 °C (heating rate 10 °C/min) for drying pretreatment, then cooled to 50 °C under He gas flow (30–50 mL/min) for 1 h. A 10% CO2/He mixture is passed into the reaction tube at a certain gas flow rate is 30–50 mL/min for 1 h to be saturated, and then switched to He at a certain gas flow rate of 30–50 mL/min for 1 h to eliminate weak physical adsorption of carbon dioxide on the surface. The last step involves heating the catalyst to 700 °C at a heating rate (10 °C/min) in He atmosphere and desorbed, and the desorbed gas is detected by TCD.
A Thermo Scientific K-Alpha spectrometer (Thermo Fisher Scientific, Waltham, MA, USA) used for the XPS test, and the content and valence state of catalyst surface substances are analyzed under the excitation source of Al Kα rays (hv = 1486.6 eV). A suitable amount of the pressed catalyst is connected to the corresponding sample tray in a standardized manner and placed in the sample detection chamber of the Thermo Scientific K-Alpha XPS instrument. The sample is sent to the analysis chamber when the indoor pressure of the sample chamber reaches the standard value (less than 2.0 × 10⁻⁷ bar). The important test conditions include spot size (400 μm), work voltage (12 kV), and filament current (6 mA).
Diffuse reflectance infrared Fourier transform spectroscopy (DRIFTS) analysis is performed by Thermo Nicolet iS20 (Thermo Fisher Scientific, Shanghai, China) which has a liquid-nitrogen-cooled mercury cadmium-telluride (MCT) detector. Firstly, the catalyst is reduced at room temperature for 30 min under a pure N2 (20 mL/min) atmosphere. The background spectra are obtained under N2 blowing. Six batches of DRIFTS characterization are performed on the pretreated catalyst. Mixed CO2 and H2 (CO2:H2 = 1:3) are introduced into the chamber at 150 °C, 180 °C, 200 °C, 220 °C, 240 °C, and 260 °C for 30 min.

3.5. Catalytic Performance Test

As shown in Figure 11, the catalytic characteristic for the reaction of CO2 to CH3OH is measured on fixed-bed equipment. A certain amount of catalyst (0.2 g) and 0.4 g of quartz sand (40–60 mesh) are mixed uniformly and loaded into the constant temperature zone in the middle of the reaction tube (8 mm internal diameter). Before the performance is evaluated, the catalyst is pretreated in situ with 10 mL/min H2/N2 for 3 h under test conditions of 0.1 MPa and 300 °C. After reduction, the feed gas (H2:CO2 = 3:1) is transmitted through the reactor and fully contacts the catalyst. The subsequent reactions are performed under 5 MPa, a temperature range from 180 °C to 260 °C, and GHSV is maintained at 12,000 mL h−1 gcat−1. The gas phase product is detected by Agilent 8890 (Agilent Technologies (China) Co., Ltd, Beijing, China) online chromatography, and the composition and content of the product are determined according to the peak time of the product in the chromatographic column. The specific amounts of CO2, CO, CH4, and H2 included in the reaction product are monitored online by MolSieve 5A (Agilent Technologies (China) Co., Ltd, Beijing, China) packed column (TCD). Organic compounds such as CH4 and CH3OH in the reaction product are detected online by HP-PLOT Q-packed column (FID).

3.6. Calculation Methods for Reactant Conversion as Well as Product Selectivity

The reactant conversion is calculated using the normalization method, and the formulas for CO2 conversion and selectivity of all products are shown in Equations (1) and (2).
X C O 2 = f C O A C O + i f C H 4 A C H 4 + f C H 3 O H A C H 3 O H f C O 2 A C O 2 + f C O A C O + i f C H 4 A C H 4 + f C H 3 O H A C H 3 O H
i = f C H 4 T C D A C H 4 T C D f CH 4 FID A CH 4 FID
S C H 3 O H = f C H 3 O H A C H 3 O H f C O A C O + i f C H 4 A C H 4 + f C H 3 O H A C H 3 O H
X(CO2): CO2 conversion, Sel (CH3OH): CH3OH selectivity, A: peak area, f: correction factor, i: conversion factor.
The correction factor values for each component in tail gas are shown in Table 4.

3.7. Calculation Methods

The Vienna Ab Initio Simulation Package (VASP) is used to calculate the relevant properties of the MoS2/Ni system [21]. Exchange correlation is measured through Perdew–Burke–Ernzerhof (PBE) method [43]. The plane-wave cut-off energy is 400 eV and the Monkhorst–Pack k-point sampling is 1 × 1 × 1 for the structural optimization involved in this system, while the electronic performance is calculated with the larger k-point of 3 × 3 × 1 [44]. A reasonable initial model is constructed as a 5 × 5 supercell with a vacuum thickness of 15 Å, and the size of the calculation model is 15.83 × 15.83 Å. Structural convergences are completed with Hellmann–Feynman residual force convergences between each atom below 0.02 eV/Å. A CI-NEB method is used to search the transition state involved in each elementary reaction [45]. The adsorption energy of the reactant on the catalyst surface (Eads) is represented by Equation (4):
Eads = EAB − EA − ESM
where EAB is the energy value of the reaction system where small reactant molecules are adsorbed on the material surface, EA is the energy of material structure before adsorption, and ESM is the energy possessed by reactant molecules adsorbed on the catalyst surface.

4. Conclusions

In conclusion, the MoS2 catalyst is prepared by hydrothermal synthesis and doped with different amounts of Ni and Co metal to obtain MoS2/Ni and MoS2/Co composite catalyst materials. The catalytic properties of these materials in CO2 hydrogenation to CH3OH are investigated.
Compared with 2H-MoS2, under the optimal reaction conditions, the MoS2/Ni0.2 composite catalyst shows excellent product selectivity for methanol. Thus, the high methanol selectivity from CO2 and H2 gas is achieved.
Through the analysis of XRD, XPS, BET, H2–TPR SEM, and CO2–TPD characterization results of MoS2, Ni/MoS2, and Co/MoS2 composite catalysts with different metal loading ratios, it is confirmed that the addition of Ni, Co metals are beneficial for blocking more edge S vacancies, and, thus, the CH3OH selectivity is higher. Through metal doping, the H2 consumption and CO2 adsorption are improved, indicating that the ability to activate H2 and CO2 is improved.
In situ DRIFTS spectra and DFT calculation confirmed that the hydrogenation of CO2 to methanol on MoS2/Ni catalyst follows an oxidation–reduction pathway. CO2 is activated into CO* and gradually hydrogenated to form methoxy groups; ultimately, methanol is generated. The improvement of CH3OH selectivity by metal doping involved in this paper has insight significance for subsequent related research.

Supplementary Materials

The following supporting information can be downloaded at: https://www.mdpi.com/article/10.3390/molecules28155796/s1, Figure S1: XRD results of MoS2/Cox (x is the addition amount of Co(NO3)2·6H2O, x = 0, 0.1, 0.2, 0.3, 0.5 (mmol)); Figure S2: SEM photograph of MoS2/Cox (x is the addition amount of Co(NO3)2·6H2O, x = 0, 0.1, 0.2, 0.3, 0.5 (mmol)) (a) MoS2/Co0.1, (b) MoS2/Co0.2, (c) MoS2/Co0.3, (d) MoS2/Co0.5; Figure S3: CO2 adsorption characteristic curve of MoS2/Cox (x is the addition amount of Co(NO3)2·6H2O, x = 0.1, 0.2, 0.3, 0.5 (mmol)); Figure S4: H2-TPR reduction curve of MoS2/Cox (x is the addition amount of Co(NO3)2·6H2O, x = 0.1, 0.2, 0.3, 0.5 (mmol)); Figure S5: CO2 conversion rate of MoS2, MoS2/Nix and MoS2/Cox catalysts.

Author Contributions

Conceptualization, investigation, writing—original draft, writing—review and editing, Y.Y.; investigation, resources, data curation, L.Q.; formal analysis, Z.G.; writing—review and editing, T.G.; software, D.Z.; methodology, Y.H.; writing—review and editing and funding acquisition, J.M.; writing—review and editing, project administration, funding acquisition, Q.G. All authors have read and agreed to the published version of the manuscript.

Funding

All authors are grateful for strong support from the Natural Science Foundation Project of Ningxia (2022AAC01001), the Key Research and Development Program of Ningxia (2022BSB03054), the Joint Funds of the National Natural Science Foundation of China (U20A20124) and Shandong Provincial Natural Science Foundation (ZR2020MB144).

Institutional Review Board Statement

Not applicable.

Informed Consent Statement

Not applicable.

Data Availability Statement

Not applicable.

Conflicts of Interest

The authors declare no conflict of interest.

Sample Availability

Not applicable.

References

  1. Wei, J.; Yao, R.W.; Han, Y.; Ge, Q.J.; Sun, J. Towards the development of the emerging process of CO2 heterogenous hydrogenation into high-value unsaturated heavy hydrocarbons. Chem. Soc. Rev. 2021, 50, 10764–10805. [Google Scholar] [CrossRef]
  2. Jiang, X.; Nie, X.; Guo, X.; Song, C.; Chen, J.G. Recent advances in carbon dioxide hydrogenation to methanol via heterogeneous catalysis. Chem. Rev. 2020, 120, 7984–8034. [Google Scholar] [PubMed]
  3. Freeman, B.W.J.; Evans, C.D.; Musarika, S.; Morrison, R.; Newman, T.R.; Page, S.E.; Wiggs, G.F.S.; Bell, N.G.A.; Styles, D.; Wen, Y.; et al. Responsible agriculture must adapt to the wetland character of mid-latitude peatlands. Glob. Chang. Biol. 2022, 28, 3795–3811. [Google Scholar] [CrossRef]
  4. Asare Bediako, B.B.; Qian, Q.; Han, B. Synthesis of C2+ Chemicals from CO2 and H2 via C-C Bond Formation. Acc. Chem. Res. 2021, 54, 2467–2476. [Google Scholar] [CrossRef] [PubMed]
  5. Wang, D.; Xie, Z.; Porosoff, M.D.; Chen, J.G. Recent advances in carbon dioxide hydrogenation to produce olefins and aromatics. Chem 2021, 7, 2277–2311. [Google Scholar] [CrossRef]
  6. Ma, W.; Hu, J.; Zhou, L.; Wu, Y.; Geng, J.; Hu, X. Efficient hydrogenation of CO2 to formic acid in water without consumption of a base. Green Chem. 2022, 24, 6727–6732. [Google Scholar] [CrossRef]
  7. Sharma, P.; Sebastian, J.; Ghosh, S.; Creaser, D.; Olsson, L. Recent advances in hydrogenation of CO2 into hydrocarbons via methanol intermediate over heterogeneous catalysts. Catal. Sci. Technol. 2021, 11, 1665–1697. [Google Scholar] [CrossRef]
  8. Zhang, Y.; Mu, Z.; Wei, Y.; Zhu, Z.; Du, R.; Liu, S. Comprehensive study on unregulated emissions of heavy-duty SI pure methanol engine with EGR. Fuel 2022, 320, 123974. [Google Scholar] [CrossRef]
  9. Chein, R.; Chen, W.; Chyuan Ong, H.; Loke Show, P.; Singh, Y. Analysis of methanol synthesis using CO2 hydrogenation and syngas produced from biogas-based reforming processes. Chem. Eng. J. 2021, 426, 130835. [Google Scholar] [CrossRef]
  10. Murthy, P.S.; Liang, W.; Jiang, Y.; Huang, J. Cu-Based nanocatalysts for CO2 hydrogenation to methanol. Energy Fuels 2021, 35, 8558–8584. [Google Scholar] [CrossRef]
  11. Cored, J.; Lopes, C.W.; Liu, L.; Soriano, J.; Agostini, G.; Solsona, B.; Sánchez-Tovar, R.; Concepción, P. Cu-Ga3+-doped wurtzite ZnO interface as driving force for enhanced methanol production in co-precipitated Cu/ZnO/Ga2O3 catalysts. J. Catal. 2022, 407, 149–161. [Google Scholar] [CrossRef]
  12. Bahri, S.; Pathak, S.; Singhahluwalia, A.; Malav, P.; Upadhyayula, S. Meta-analysis approach for understanding the characteristics of CO2 reduction catalysts for renewable fuel production. J. Clean. Prod. 2022, 339, 130653. [Google Scholar] [CrossRef]
  13. Khobragade, R.; Roškarič, M.; Žerjav, G.; Košiček, M.; Zavašnik, J.; Van de Velde, N.; Jerman, I.; Tušar, N.N.; Pintar, A. Exploring the effect of morphology and surface properties of nanoshaped Pd/CeO2 catalysts on CO2 hydrogenation to methanol. Appl. Catal. A Gen. 2021, 627, 118394. [Google Scholar] [CrossRef]
  14. Gholinejad, M.; Khosravi, F.; Afrasi, M.; Sansano, J.M.; Nájera, C. Applications of bimetallic PdCu catalysts. Catal. Sci. Technol. 2021, 11, 2272–2652. [Google Scholar] [CrossRef]
  15. Xu, D.; Hong, X.; Liu, G. Highly dispersed metal doping to ZnZr oxide catalyst for CO2 hydrogenation to methanol: Insight into hydrogen spillover. J. Catal. 2021, 393, 207–214. [Google Scholar] [CrossRef]
  16. Shi, Y.; Su, W.; Kong, L.; Wang, J.; Lv, P.; Hao, J.; Gao, X.; Yu, G. The homojunction formed by h-In2O3(110) and c-In2O3(440) promotes carbon dioxide hydrogenation to methanol on graphene oxide modified In2O3. J. Colloid Interface Sci. 2022, 623, 1048–1062. [Google Scholar] [CrossRef]
  17. Sun, K.; Zhang, Z.; Shen, C.; Rui, N.; Liu, C. The feasibility study of the indium oxide supported silver catalyst for selective hydrogenation of CO2 to methanol. Green Energy Environ. 2022, 7, 807–817. [Google Scholar] [CrossRef]
  18. Primo, A.; He, J.; Jurca, B.; Cojocaru, B.; Bucur, C.; Parvulescu, V.I.; Garcia, H. CO2 methanation catalyzed by oriented MoS2 nanoplatelets supported on few layers graphene. Appl. Catal. B Environ. 2019, 245, 351–359. [Google Scholar] [CrossRef]
  19. Prašnikar, A.; Likozar, B. Sulphur poisoning, water vapour and nitrogen dilution effects on copper-based catalyst dynamics, stability and deactivation during CO2 reduction reactions to methanol. React. Chem. Eng. 2022, 7, 1073–1082. [Google Scholar] [CrossRef]
  20. Liu, P.; Choi, Y.; Yang, Y.; White, M.G. Methanol Synthesis from H2 and CO2 on a Mo6S8 Cluster: A Density Functional Study. J. Phys. Chem. A 2010, 114, 3888–3895. [Google Scholar] [CrossRef]
  21. Hu, J.; Yu, L.; Deng, J.; Wang, Y.; Cheng, K.; Ma, C.; Zhang, Q.; Wen, W.; Yu, S.; Pan, Y.; et al. Sulfur vacancy-rich MoS2 as a catalyst for the hydrogenation of CO2 to methanol. Nat. Catal. 2021, 4, 242–250. [Google Scholar] [CrossRef]
  22. Li, H.; Wang, L.; Dai, Y.; Pu, Z.; Lao, Z.; Chen, Y.; Wang, M.; Zheng, X.; Zhu, J.; Zhang, W.; et al. Synergetic interaction between neighbouring platinum monomers in CO2 hydrogenation. Nat. Nanotechnol. 2018, 13, 411–417. [Google Scholar] [CrossRef] [PubMed]
  23. Lu, Z.; Cheng, Y.; Li, S.; Yang, Z.; Wu, R. CO2 thermoreduction to methanol on the MoS2 supported single Co atom catalyst: A DFT study. Appl. Surf. Sci. 2020, 528, 147047. [Google Scholar] [CrossRef]
  24. Kresse, G.; Hafner, J. Ab initio molecular-dynamics liquid-metal-amorphous-semiconductor simulation of the transition in germanium. Phys. Rev. B 1994, 49, 14251–14269. [Google Scholar] [CrossRef]
  25. Blochl, P.E. Projector augmented-wave method. Phys. Rev. B 1994, 50, 17953–17979. [Google Scholar] [CrossRef] [PubMed] [Green Version]
  26. Monkhorst, H.J.; Pack, J.D. Special points for Brillonin-zone integrations. Phys. Rev. B 1976, 13, 5188–5192. [Google Scholar] [CrossRef]
  27. Zhang, R.; Ma, S.; Wang, Q.; Xiao, C.; Zhang, C.; Gao, T. Interstitial diffusion of a helium atom in bulk Li4SiO4 crystal from first-principles calculations. Ceram. Int. 2020, 46, 8192–8199. [Google Scholar] [CrossRef]
  28. Djamil, J.; Segler, S.A.; Dabrowski, A.; Bensch, W.; Lotnyk, A.; Schürmann, U.; Kienle, L.; Hansen, S.; Beweries, T. The influence of carbon content on the structure and properties of MoSxCy photocatalysts for light-driven hydrogen generation. Dalton Trans. 2013, 42, 1287–1292. [Google Scholar] [CrossRef]
  29. Berhault, G.; Perez De La Rosa, M.; Mehta, A.; Yácaman, M.J.; Chianelli, R.R. The single-layered morphology of supported MoS2-based catalysts-the role of the cobalt promoter and its effects in the hydrodesulfurization of dibenzothiophene. Appl. Catal. A Gen. 2008, 345, 80–88. [Google Scholar] [CrossRef]
  30. Huang, Z.; Su, M.; Yang, Q.; Li, Z.; Chen, S.; Li, Y.; Zhou, X.; Li, F.; Song, Y. A general patterning approach by manipulating the evolution of two-dimensional liquid foams. Nat. Commun. 2017, 8, 1–9. [Google Scholar] [CrossRef] [Green Version]
  31. Liu, Y.; Zhao, D.; Liu, H.; Umar, A.; Wu, X. High performance hybrid supercapacitor based on hierarchical MoS2/Ni3S2 metal chalcogenide. Chin. Chem. Lett. 2019, 30, 1105–1110. [Google Scholar] [CrossRef]
  32. Cao, H.; Wang, H.; Huang, Y.; Sun, Y.; Shi, S.; Tang, M. Quantification of gold (III) in solution and with a test stripe via the quenching of the fluorescence of molybdenum disulfide quantum dots. Microchim. Acta 2017, 184, 91–100. [Google Scholar] [CrossRef]
  33. Zhao, G.; Zhang, Y.; Yang, L.; Jiang, Y.; Zhang, Y.; Hong, W.; Tian, Y.; Zhao, H.; Hu, J.; Zhou, L.; et al. Nickel chelate derived NiS2 decorated with bifunctional carbon: An efficient strategy to promote sodium storage performance. Adv. Funct. Mater. 2018, 28, 1803690. [Google Scholar] [CrossRef]
  34. Lin, Q.; Dong, X.; Wang, Y.; Zheng, N.; Zhao, Y.; Xu, W.; Ding, T. Molybdenum disulfide with enlarged interlayer spacing decorated on reduced graphene oxide for efficient electrocatalytic hydrogen evolution. J. Mater. Sci. 2020, 55, 6637–6647. [Google Scholar] [CrossRef]
  35. Yin, X.; Sun, G.; Song, A.; Wang, L.; Wang, Y.; Dong, H.; Shao, G. A novel structure of Ni-(MoS2/GO) composite coatings deposited on Ni foam under supergravity field as efficient hydrogen evolution reaction catalysts in alkaline solution. Electrochim. Acta 2017, 249, 52–63. [Google Scholar] [CrossRef]
  36. Tang, Y.; Wang, Y.; Wang, X.; Li, S.; Huang, W.; Dong, L.; Liu, C.; Li, Y.; Lan, Y. Molybdenum Disulfide/Nitrogen-Doped reduced graphene oxide nanocomposite with enlarged interlayer spacing for electrocatalytic hydrogen evolution. Adv. Energy Mater. 2016, 6, 1600116. [Google Scholar] [CrossRef]
  37. Yang, S.; Wang, Y.; Zhang, H.; Zhang, Y.; Liu, L.; Fang, L.; Yang, X.; Gu, X.; Wang, Y. Unique three-dimensional Mo2C@MoS2 heterojunction nanostructure with S vacancies as outstanding all-pH range electrocatalyst for hydrogen evolution. J. Catal. 2019, 371, 20–26. [Google Scholar] [CrossRef]
  38. Ma, Y.; Wang, J.; Goodman, K.R.; Head, A.R.; Tong, X.; Stacchiola, D.J.; White, M.G. Reactivity of a zirconia-copper inverse catalyst for CO2 hydrogenation. J. Phys. Chem. C 2020, 124, 22158–22172. [Google Scholar] [CrossRef]
  39. Liu, T.; Xu, D.; Wu, D.; Liu, G.; Hong, X. Spinel ZnFe2O4 regulates copper sites for CO2 hydrogenation to methanol. ACS Sustain. Chem. Eng. 2021, 9, 4033–4041. [Google Scholar] [CrossRef]
  40. Gao, P.; Li, F.; Zhan, H.; Zhao, N.; Xiao, F.; Wei, W.; Zhong, L.; Sun, Y. Fluorine-modified Cu/Zn/Al/Zr catalysts via hydrotalcite-like precursors for CO2 hydrogenation to methanol. Catal. Commun. 2014, 50, 78–82. [Google Scholar] [CrossRef]
  41. Kiciński, W.; Szala, M.; Bystrzejewski, M. Sulfur-doped porous carbons: Synthesis and applications. Carbon 2014, 68, 1–32. [Google Scholar] [CrossRef]
  42. Sun, M.; Adjaye, J.; Nelson, A.E. Theoretical investigations of the structures and properties of molybdenum-based sulfide catalysts. Appl. Catal. A Gen. 2004, 263, 131–143. [Google Scholar] [CrossRef]
  43. Yoosuk, B.; Kim, J.H.; Song, C.; Ngamcharussrivichai, C.; Prasassarakich, P. Highly active MoS2, CoMoS2 and NiMoS2 unsupported catalysts prepared by hydrothermal synthesis for hydrodesulfurization of 4,6-dimethyldibenzothiophene. Catal. Today 2008, 130, 14–23. [Google Scholar] [CrossRef]
  44. Park, K.; Kim, T. Interactive mechanism of plasma-assisted CO2 capture for calcium looping cycle via in-situ DRIFTS. J. CO2 Util. 2022, 56, 101800. [Google Scholar] [CrossRef]
  45. Wang, W.; Qu, Z.; Song, L.; Fu, Q. An investigation of Zr/Ce ratio influencing the catalytic performance of CuO/Ce1-Zr O2 catalyst for CO2 hydrogenation to CH3OH. J. Energy Chem. 2020, 47, 18–28. [Google Scholar] [CrossRef]
Figure 1. XRD results of MoS2/Nix (x is the addition amount of Ni(NO3)2·6H2O; x = 0, 0.1, 0.2, 0.3, 0.5 mmol). Blue, pink, green, orange, brown indicate MoS2; MoS2/Ni0.1, MoS2/Ni0.2, MoS2/Ni0.3, MoS2/Ni0.5.
Molecules 28 05796 g001
Figure 2. SEM photograph of MoS2/Nix (x is the addition amount of Ni(NO3)2·6H2O; x = 0, 0.1, 0.2, 0.3, 0.5 mmol). (a) MoS2/Ni0, (b) MoS2/Ni0, (c) MoS2/Ni0.1, (d)MoS2/Ni0.2, (e) MoS2/Ni0.3, (f) MoS2/Ni0.5. The circles indicate NiS2.
Molecules 28 05796 g002
Figure 3. XPS spectrum of MoS2/Ni0.2 catalyst. (a) XPS survey, (b) Ni 2p, (c) Mo 3d, (d) S 2p.
Molecules 28 05796 g003
Figure 4. CO2 adsorption characteristic curve of MoS2/Nix (x is the addition amount of Ni(NO3)2·6H2O; x = 0.1, 0.2, 0.3, 0.5 mmol).
Molecules 28 05796 g004
Figure 5. H2–TPR reduction curve of MoS2/Nix (x is the addition amount of Ni(NO3)2·6H2O; x = 0.1, 0.2, 0.3, 0.5 mmol).
Molecules 28 05796 g005
Figure 6. N2 desorption curve (a,b) and pore size distribution (c,d) of MoS2 and MoS2/Ni0.2.
Molecules 28 05796 g006
Figure 7. CH3OH selectivity of MoS2, MoS2/Nix, and MoS2/Cox catalysts.
Molecules 28 05796 g007
Figure 8. In situ DRIFTS spectra of MoS2/Ni0.2 catalyst from 150 °C to 260 °C; the feed gas is CO2 and H2 (H2:CO2 = 3:1). * represents the adsorbed species on catalyst surface.
Molecules 28 05796 g008
Figure 9. (a,d) Top and side views of the optimal adsorption structures of CO2 on MoS2 and MoS2/Ni. (b,e) The electron transfer between MoS2, MoS2/Ni surfaces, and CO2 based on differential charge density analysis. The blue and yellow colors express electron depletion and accumulation, respectively. (c,f) The PDOS of MoS2, MoS2/Ni, and CO2 (g represents the CO2 gas, ads represent the CO2 gas is adsorbed on MoS2 surface); the vertical dotted line at zero represents Fermi level.
Molecules 28 05796 g009
Figure 10. The geometry structures and adsorbed energies of CH3OH formation on MoS2/Ni surface. * represents the adsorbed species on catalyst surface.
Molecules 28 05796 g010
Figure 11. The fixed-bed reaction evaluation device.
Molecules 28 05796 g011
Table 1. Measurement results of pore structure parameters and specific surface area.
SampleBET Specific Surface Area (m2·g−1)Surface Pore Diameter (nm)Pore Volume (cm3·g−1)
MoS241.7020.650.214
MoS2/Ni0.240.7310.130.090
Table 2. Experimental reagents and gas raw materials.
Chemical Reagent NameChemical FormulaSpecificationManufacturer
Cobalt nitrate hexahydrateCo(NO3)2·6H2OAnalytical pure ARSinopharm group chemical reagent Co., Ltd. (Shanghai, China)
Nickel nitrate hexahydrateNi(NO3)2·6H2OAnalytical pure ARSinopharm group chemical reagent Co., Ltd.
Ammonium molybdate tetrahydrate(NH4)6Mo7O24·4H2OAnalytical pure ARSinopharm group chemical reagent Co., Ltd.
ThioureaCH4N2SAnalytical pure ARTianjin damao chemical reagent factory (Tianjin, China)
Quartz sandSiO2Analytical pure ARShanghai mclean biochemical technology Co., Ltd. (Shanghai, China)
Raw gasH2/CO2/N272/24/4 (molar ratio)Ningxia guangli comprehensive trading Co., Ltd. (Yinchuan, China)
Reducing gasH2/N2H2/N2 = 30/70Beijing yanan weiye gas Co., Ltd. (Beijing, China)
High purity nitrogenN299.999%Ningxia guangli comprehensive Trading Co., Ltd.
High purity heliumHe99.999%Ningxia guangli comprehensive trading Co., Ltd.
AirAir100%air generator (Yinchuan, China)
Table 3. Instruments and types of equipment for experiments.
Equipment NameInstrument ModelManufacturer
Carbon dioxide catalytic conversion evaluation deviceΦ240 × Φ22 × Φ510Beijing Kunlun yongtai Technology Co., Ltd. (Beijing, China)
Gas chromatographAgilent GC8890Agilent Technologies (China) Co., Ltd. (Beijing, China)
Electric heating constant temperature blast drying ovenGZX-9240MBEShanghai boxun industrial Co., Ltd. medical equipment factory (Shanghai, China)
Tube furnaceTL1200Nanjing boyuntong instrument technology Co., Ltd. (Nanjing, China)
Desktop high-speed centrifugeH/T16MMHunan hercy instrument equipment Co., Ltd. (Changsha, China)
Magnetic stirrerDF-101SShandong juancheng hualu electric heating instrument Co., Ltd. (Heze, China)
Powder tablet press35 mmHefei kejing material technology Co., Ltd. (Hefei, China)
Electronic balancePL602Mettler toledo Instruments Ltd. (Zurich, Switzerland)
Hydrogen generatorSPH-300Beijing China HP analytical technology research institute (Beijing, China)
Air generatorSPB-3Beijing China HP analytical technology research institute
Column (TCD)HP-PLOT QAgilent Technologies (China) Co., Ltd. (Beijing, China)
Column (FID)MolSieve 5AAgilent Technologies (China) Co., Ltd.
Table 4. Correction factor value of components in tail gas.
Component iCO2COCH3OHCH4-TCDCH4-FID
Correction factor fi1.061.242.131.661
Disclaimer/Publisher’s Note: The statements, opinions and data contained in all publications are solely those of the individual author(s) and contributor(s) and not of MDPI and/or the editor(s). MDPI and/or the editor(s) disclaim responsibility for any injury to people or property resulting from any ideas, methods, instructions or products referred to in the content.

