
Field-Flow Fractionation in Molecular Biology and Biotechnology

 ,
,  ,
,  and
and 
Abstract
:1. Introduction
1.1. FFF Techniques

| Technique | Separation Based on Analytes: | Typical Size Range | Main Applications | |
|---|---|---|---|---|
| FlFFF | Hydrodynamic diffusion coefficient | 1 nm–20 μm | Proteins, polysaccharides, lipids, nanoparticles, micelles, vesicles, organelles, polymers | [30,31] |
| ElFFF | Electrophoretic mobility, size | 1 nm–1 μm | Nanoparticles, proteins, viruses, bacteria | [19,32] |
| ThFFF | Thermal diffusivity, size | 5 nm–10 μm | Polymers, gels, nanoparticles | [33] |
| GrFFF | Size, density | 1–100 μm | Cells, bacteria, organelles | [5] |
| SdFFF | Size, density | 10 nm–50 μm | Cells, bacteria, organelles | [5] |
| MgFFF | Magnetic properties | 10–20 μm | Magnetic nanoparticles | [34] |
| DlFFF | Size, dielectric properties | 1–20 μm | Cells | [27] |
1.2. FFF and SEC Complementarity
1.3. Detectors (Online Coupling)
1.3.1. Multiangle Light Scattering (MALS) and Dynamic Light Scattering (DLS)
1.3.2. Differential Refractive Index (dRI) Detector
1.3.3. Fluorescence Detector (FLD)
1.3.4. MS Detectors
1.3.5. Novel Couplings
1.4. FFF and Offline Characterization
1.5. Interaction Studies and Immunoassay Development
2. Applications
2.1. Protein Analysis
2.2. Nucleic Acids Analysis
2.3. Polysaccharides
2.4. Lipoproteins and Liposomes
2.4.1. Lipoproteins
2.4.2. Liposomes
2.5. Subcellular Structures: Organelles and Exosomes
2.5.1. Organelles
2.5.2. Exosomes
2.6. Viruses and VLPs
2.7. Cells and Bacteria
2.7.1. Cells
2.7.2. Bacteria
2.7.3. FFF-MS Coupling for the Analysis of Bacteria and Cells
2.8. Engineered and Naturally Occurring Nanoparticles (ENPs/NNPs) for Nanomedicine
2.8.1. ENPs
2.8.2. NNPs
3. Conclusions
- (1)
- Versatility in terms of both mobile phase and injectable sample that allows working under conditions as close to native conditions as possible;
- (2)
- The absence of a stationary phase prevents unwanted interactions.
Author Contributions
Funding
Institutional Review Board Statement
Informed Consent Statement
Data Availability Statement
Conflicts of Interest
References
- Schimpf, M.E.; Caldwell, K.; Giddings, J.C. Field-Flow Fractionation Handbook; John Wiley & Sons: Hoboken, NJ, USA, 2000. [Google Scholar]
- Marassi, V.; Macis, M.; Giordani, S.; Ferrazzano, L.; Tolomelli, A.; Roda, B.; Zattoni, A.; Ricci, A.; Reschiglian, P.; Cabri, W. Application of Af4-Multidetection to Liraglutide in Its Formulation: Preserving and Representing Native Aggregation. Molecules 2022, 27, 5485. [Google Scholar] [CrossRef] [PubMed]
- Yang, J.; Huang, Y.; Wang, X.-B.; Becker, F.F.; Gascoyne, P.R. Cell separation on microfabricated electrodes using dielectrophoretic/gravitational field-flow fractionation. Anal. Chem. 1999, 71, 911–918. [Google Scholar] [CrossRef] [PubMed]
- Yohannes, G.; Jussila, M.; Hartonen, K.; Riekkola, M.-L. Asymmetrical flow field-flow fractionation technique for separation and characterization of biopolymers and bioparticles. J. Chromatogr. A 2011, 1218, 4104–4116. [Google Scholar] [CrossRef] [PubMed]
- Reschiglian, P.; Zattoni, A.; Roda, B.; Michelini, E.; Roda, A. Field-flow fractionation and biotechnology. TRENDS Biotechnol. 2005, 23, 475–483. [Google Scholar] [CrossRef] [PubMed]
- Ko, M.; Choi, H.J.; Kim, J.Y.; Kim, I.H.; Kim, S.O.; Moon, M.H. Optimization for size separation of graphene oxide sheets by flow/hyperlayer field-flow fractionation. J. Chromatogr. A 2022, 1681, 463475. [Google Scholar] [CrossRef]
- Giddings, J.C. Retention (steric) inversion in field-flow fractionation: Practical implications in particle size, density and shape analysis. Analyst 1993, 118, 1487–1494. [Google Scholar] [CrossRef]
- Martin, M.; Reynaud, R. Polymer analysis by thermal field-flow fractionation. Anal. Chem. 1980, 52, 2293–2298. [Google Scholar] [CrossRef]
- Lou, J.; Myers, M.N.; Calvin Giddings, J. Separation of polysaccharides by thermal field-flow fractionation. J. Liq. Chromatogr. Relat. Technol. 1994, 17, 3239–3260. [Google Scholar] [CrossRef]
- Wahlund, K.-G. Flow field-flow fractionation: Critical overview. J. Chromatogr. A 2013, 1287, 97–112. [Google Scholar] [CrossRef]
- Zattoni, A.; Roda, B.; Borghi, F.; Marassi, V.; Reschiglian, P. Flow field-flow fractionation for the analysis of nanoparticles used in drug delivery. J. Pharm. Biomed. Anal. 2014, 87, 53–61. [Google Scholar] [CrossRef]
- Fuentes, C.; Choi, J.; Zielke, C.; Peñarrieta, J.M.; Lee, S.; Nilsson, L. Comparison between conventional and frit-inlet channels in separation of biopolymers by asymmetric flow field-flow fractionation. Analyst 2019, 144, 4559–4568. [Google Scholar] [CrossRef] [PubMed]
- Shin, S.Y.; Seo, J.W.; Kim, J.Y.; Williams, P.S.; Moon, M.H. Flow Field-Flow Fractionation with a Thickness-Tapered Channel. Anal. Chem. 2022, 94, 14460–14466. [Google Scholar] [CrossRef] [PubMed]
- Marassi, V.; Roda, B.; Casolari, S.; Ortelli, S.; Blosi, M.; Zattoni, A.; Costa, A.L.; Reschiglian, P. Hollow-fiber flow field-flow fractionation and multi-angle light scattering as a new analytical solution for quality control in pharmaceutical nanotechnology. Microchem. J. 2018, 136, 149–156. [Google Scholar] [CrossRef]
- Rambaldi, D.C.; Zattoni, A.; Casolari, S.; Reschiglian, P.; Roessner, D.; Johann, C. An Analytical Method for Size and Shape Characterization of Blood Lipoproteins. Clin. Chem. 2007, 53, 2026–2029. [Google Scholar] [CrossRef]
- Marassi, V.; Beretti, F.; Roda, B.; Alessandrini, A.; Facci, P.; Maraldi, T.; Zattoni, A.; Reschiglian, P.; Portolani, M. A new approach for the separation, characterization and testing of potential prionoid protein aggregates through hollow-fiber flow field-flow fractionation and multi-angle light scattering. Anal. Chim. Acta 2019, 1087, 121–130. [Google Scholar] [CrossRef]
- Lee, J.Y.; Byeon, S.K.; Moon, M.H. Profiling of oxidized phospholipids in lipoproteins from patients with coronary artery disease by hollow fiber flow field-flow fractionation and nanoflow liquid chromatography–tandem mass spectrometry. Anal. Chem. 2015, 87, 1266–1273. [Google Scholar] [CrossRef]
- Tri, N.; Caldwell, K.; Beckett, R. Development of electrical field-flow fractionation. Anal. Chem. 2000, 72, 1823–1829. [Google Scholar] [CrossRef]
- Zhang, X.; Li, Y.; Shen, S.; Lee, S.; Dou, H. Field-flow fractionation: A gentle separation and characterization technique in biomedicine. TrAC Trends Anal. Chem. 2018, 108, 231–238. [Google Scholar] [CrossRef]
- Johann, C.; Elsenberg, S.; Schuch, H.; Rösch, U. Instrument and method to determine the electrophoretic mobility of nanoparticles and proteins by combining electrical and flow field-flow fractionation. Anal. Chem. 2015, 87, 4292–4298. [Google Scholar] [CrossRef]
- Choi, J.; Fuentes, C.; Fransson, J.; Wahlgren, M.; Nilsson, L. Separation and zeta-potential determination of proteins and their oligomers using electrical asymmetrical flow field-flow fractionation (EAF4). J. Chromatogr. A 2020, 1633, 461625. [Google Scholar] [CrossRef]
- Giddings, J.C.; Yang, F.J.; Myers, M.N. Sedimentation field-flow fractionation. Anal. Chem. 1974, 46, 1917–1924. [Google Scholar] [CrossRef]
- Reschiglian, P.; Torsi, G. Determination of particle size distribution by gravitational field-flow fractionation: Dimensional characterization of silica particles. Chromatographia 1995, 40, 467–473. [Google Scholar] [CrossRef]
- Contado, C.; Reschiglian, P.; Faccini, S.; Zattoni, A.; Dondi, F. Continuous split-flow thin cell and gravitational field-flow fractionation of wheat starch particles. J. Chromatogr. A 2000, 871, 449–460. [Google Scholar] [CrossRef] [PubMed]
- Williams, P.S.; Carpino, F.; Zborowski, M. Characterization of magnetic nanoparticles using programmed quadrupole magnetic field-flow fractionation. Philos. Trans. R. Soc. A Math. Phys. Eng. Sci. 2010, 368, 4419–4437. [Google Scholar] [CrossRef]
- Williams, P.S.; Carpino, F.; Zborowski, M. Magnetic nanoparticle drug carriers and their study by quadrupole magnetic field-flow fractionation. Mol. Pharm. 2009, 6, 1290–1306. [Google Scholar] [CrossRef] [PubMed]
- Waheed, W.; Sharaf, O.Z.; Alazzam, A.; Abu-Nada, E. Dielectrophoresis-field flow fractionation for separation of particles: A critical review. J. Chromatogr. A 2021, 1637, 461799. [Google Scholar] [CrossRef]
- Semyonov, S.; Maslow, K. Acoustic field-flow fractionation. J. Chromatogr. A 1988, 446, 151–156. [Google Scholar] [CrossRef]
- Hwang, J.Y.; Youn, S.; Yang, I.-H. Gravitational field flow fractionation: Enhancing the resolution power by using an acoustic force field. Anal. Chim. Acta 2019, 1047, 238–247. [Google Scholar] [CrossRef]
- Wu, Z.; Zhao, W.; Yin, Y.; Wei, Y.; Liu, Y.; Zhu, N.; Tan, Z.; Zhang, Q.; Liu, J. Separation and characterization of biomacromolecules, bionanoparticles, and biomicroparticles using flow field-flow fractionation: Current applications and prospects. TrAC Trends Anal. Chem. 2023, 164, 117114. [Google Scholar] [CrossRef]
- Qureshi, R.N.; Kok, W.T. Application of flow field-flow fractionation for the characterization of macromolecules of biological interest: A review. Anal. Bioanal. Chem. 2011, 399, 1401–1411. [Google Scholar] [CrossRef]
- Plavchak, C.L.; Smith, W.C.; Bria, C.R.; Williams, S.K.R. New advances and applications in field-flow fractionation. Annu. Rev. Anal. Chem. 2021, 14, 257–279. [Google Scholar] [CrossRef] [PubMed]
- Ratanathanawongs Williams, S.K.; Lee, D. Field-flow fractionation of proteins, polysaccharides, synthetic polymers, and supramolecular assemblies. J. Sep. Sci. 2006, 29, 1720–1732. [Google Scholar] [CrossRef] [PubMed]
- Fazlali, F.; Hajian, A.; Daryanavard, S.M.; Bagheri, H. Separation and isolation of magnetic nanomaterials. In Magnetic Nanomaterials in Analytical Chemistry; Elsevier: Amsterdam, The Netherlands, 2021; pp. 23–37. [Google Scholar]
- Brusotti, G.; Calleri, E.; Colombo, R.; Massolini, G.; Rinaldi, F.; Temporini, C. Advances on size exclusion chromatography and applications on the analysis of protein biopharmaceuticals and protein aggregates: A mini review. Chromatographia 2018, 81, 3–23. [Google Scholar] [CrossRef]
- Sidhom, K.; Obi, P.O.; Saleem, A. A review of exosomal isolation methods: Is size exclusion chromatography the best option? Int. J. Mol. Sci. 2020, 21, 6466. [Google Scholar] [CrossRef] [PubMed]
- Manning, R.R.; Holcomb, R.E.; Wilson, G.A.; Henry, C.S.; Manning, M.C. Review of orthogonal methods to SEC for quantitation and characterization of protein aggregates. BioPharm Int. 2014, 27, 32–39. [Google Scholar]
- Wittgren, B.; Wahlund, K.-G. Fast molecular mass and size characterization of polysaccharides using asymmetrical flow field-flow fractionation-multiangle light scattering. J. Chromatogr. A 1997, 760, 205–218. [Google Scholar] [CrossRef]
- Thielking, H.; Kulicke, W.M. Determination of the structural parameters of aqueous polymer solutions in the molecular, partially aggregated, and particulate states by means of FFFF/MALLS. J. Microcolumn Sep. 1998, 10, 51–56. [Google Scholar] [CrossRef]
- Marassi, V.; Maggio, S.; Battistelli, M.; Stocchi, V.; Zattoni, A.; Reschiglian, P.; Guescini, M.; Roda, B. An ultracentrifugation–hollow-fiber flow field-flow fractionation orthogonal approach for the purification and mapping of extracellular vesicle subtypes. J. Chromatogr. A 2021, 1638, 461861. [Google Scholar] [CrossRef]
- Zielke, C.; Stradner, A.; Nilsson, L. Characterization of cereal β-glucan extracts: Conformation and structural aspects. Food Hydrocoll. 2018, 79, 218–227. [Google Scholar] [CrossRef]
- Fuentes, C.; Perez-Rea, D.; Bergenståhl, B.; Carballo, S.; Sjöö, M.; Nilsson, L. Physicochemical and structural properties of starch from five Andean crops grown in Bolivia. Int. J. Biol. Macromol. 2019, 125, 829–838. [Google Scholar] [CrossRef]
- Hackley, V.A.; Clogston, J.D. Measuring the hydrodynamic size of nanoparticles in aqueous media using batch-mode dynamic light scattering. In Characterization of Nanoparticles Intended for Drug Delivery; Springer: Berlin/Heidelberg, Germany, 2011; pp. 35–52. [Google Scholar]
- Hupfeld, S.; Ausbacher, D.; Brandl, M. Asymmetric flow field-flow fractionation of liposomes: 2. Concentration detection and adsorptive loss phenomena. J. Sep. Sci. 2009, 32, 3555–3561. [Google Scholar] [CrossRef] [PubMed]
- Leeman, M.; Choi, J.; Hansson, S.; Storm, M.U.; Nilsson, L. Proteins and antibodies in serum, plasma, and whole blood—Size characterization using asymmetrical flow field-flow fractionation (AF4). Anal. Bioanal. Chem. 2018, 410, 4867–4873. [Google Scholar] [CrossRef] [PubMed]
- Mudalige, T.K.; Qu, H.; Van Haute, D.; Ansar, S.M.; Linder, S.W. Capillary electrophoresis and asymmetric flow field-flow fractionation for size-based separation of engineered metallic nanoparticles: A critical comparative review. TrAC Trends Anal. Chem. 2018, 106, 202–212. [Google Scholar] [CrossRef]
- Bednar, A.J.; Poda, A.R.; Mitrano, D.; Kennedy, A.J.; Gray, E.P.; Ranville, J.F.; Hayes, C.A.; Crocker, F.H.; Steevens, J.A. Comparison of on-line detectors for field flow fractionation analysis of nanomaterials. Talanta 2013, 104, 140–148. [Google Scholar] [CrossRef] [PubMed]
- Ferreira, H.S.; Moreira-Alvarez, B.; Bustos, A.R.M.; Encinar, J.R.; Costa-Fernandez, J.M.; Sanz-Medel, A. Capabilities of asymmetrical flow field–Flow fractionation on-line coupled to different detectors for characterization of water-stabilized quantum dots bioconjugated to biomolecules. Talanta 2020, 206, 120228. [Google Scholar] [CrossRef]
- Baalousha, M.; Stolpe, B.; Lead, J. Flow field-flow fractionation for the analysis and characterization of natural colloids and manufactured nanoparticles in environmental systems: A critical review. J. Chromatogr. A 2011, 1218, 4078–4103. [Google Scholar] [CrossRef]
- Yang, I.; Kim, K.H.; Lee, J.Y.; Moon, M.H. On-line miniaturized asymmetrical flow field-flow fractionation-electrospray ionization-tandem mass spectrometry with selected reaction monitoring for quantitative analysis of phospholipids in plasma lipoproteins. J. Chromatogr. A 2014, 1324, 224–230. [Google Scholar] [CrossRef]
- Kim, S.T.; Cho, H.-R.; Jung, E.C.; Cha, W.; Baik, M.-H.; Lee, S. Asymmetrical flow field-flow fractionation coupled with a liquid waveguide capillary cell for monitoring natural colloids in groundwater. Appl. Geochem. 2017, 87, 102–107. [Google Scholar] [CrossRef]
- Schwaferts, C.; Sogne, V.; Welz, R.; Meier, F.; Klein, T.; Niessner, R.; Elsner, M.; Ivleva, N.P. Nanoplastic analysis by online coupling of Raman microscopy and field-flow fractionation enabled by optical tweezers. Anal. Chem. 2020, 92, 5813–5820. [Google Scholar] [CrossRef]
- Huclier-Markai, S.; Grivaud-Le Du, A.; N’tsiba, E.; Montavon, G.; Mougin-Degraef, M.; Barbet, J. Coupling a gamma-ray detector with asymmetrical flow field flow fractionation (AF4): Application to a drug-delivery system for alpha-therapy. J. Chromatogr. A 2018, 1573, 107–114. [Google Scholar] [CrossRef]
- Adkins, G.B.; Sun, E.; Coreas, R.; Zhong, W. Asymmetrical flow field flow fractionation coupled to nanoparticle tracking analysis for rapid online characterization of nanomaterials. Anal. Chem. 2020, 92, 7071–7078. [Google Scholar] [CrossRef] [PubMed]
- Sitar, S.; Kejžar, A.; Pahovnik, D.; Kogej, K.; Tušek-Žnidarič, M.; Lenassi, M.; Žagar, E. Size characterization and quantification of exosomes by asymmetrical-flow field-flow fractionation. Anal. Chem. 2015, 87, 9225–9233. [Google Scholar] [CrossRef] [PubMed]
- Kato, H.; Nakamura, A.; Banno, H. Determination of number-based size distribution of silica particles using centrifugal field-flow fractionation. J. Chromatogr. A 2019, 1602, 409–418. [Google Scholar] [CrossRef]
- Yang, J.S.; Lee, J.Y.; Moon, M.H. High speed size sorting of subcellular organelles by flow field-flow fractionation. Anal. Chem. 2015, 87, 6342–6348. [Google Scholar] [CrossRef]
- Zattoni, A.; Rambaldi, D.C.; Casolari, S.; Roda, B.; Reschiglian, P. Tandem hollow-fiber flow field-flow fractionation. J. Chromatogr. A 2011, 1218, 4132–4137. [Google Scholar] [CrossRef]
- Ventouri, I.K.; Loeber, S.; Somsen, G.W.; Schoenmakers, P.J.; Astefanei, A. Field-flow fractionation for molecular-interaction studies of labile and complex systems: A critical review. Anal. Chim. Acta 2021, 1193, 339396. [Google Scholar] [CrossRef]
- Roda, A.; Mirasoli, M.; Melucci, D.; Reschiglian, P. Toward multianalyte immunoassays: A flow-assisted, solid-phase format with chemiluminescence detection. Clin. Chem. 2005, 51, 1993–1995. [Google Scholar] [CrossRef]
- Reschiglian, P.; Zattoni, A.; Melucci, D.; Roda, B.; Guardigli, M.; Roda, A. Flow field-flow fractionation with chemiluminescence detection for flow-assisted, multianalyte assays in heterogeneous phase. J. Sep. Sci. 2003, 26, 1417–1421. [Google Scholar] [CrossRef]
- Li, J.; Zhong, W. A two-dimensional suspension array system by coupling field flow fractionation to flow cytometry. J. Chromatogr. A 2008, 1183, 143–149. [Google Scholar] [CrossRef]
- Magliulo, M.; Simoni, P.; Guardigli, M.; Michelini, E.; Luciani, M.; Lelli, R.; Roda, A. A rapid multiplexed chemiluminescent immunoassay for the detection of Escherichia coli O157: H7, Yersinia enterocolitica, Salmonella typhimurium, and Listeria monocytogenes pathogen bacteria. J. Agric. Food Chem. 2007, 55, 4933–4939. [Google Scholar] [CrossRef]
- Caldwell, K.D.; Kesner, L.F.; Myers, M.N.; Giddings, J.C. Electrical field-flow fractionation of proteins. Science 1972, 176, 296–298. [Google Scholar] [CrossRef] [PubMed]
- Stevenson, S.G.; Ueno, T.; Preston, K.R. Automated frit inlet/frit outlet flow field-flow fractionation for protein characterization with emphasis on polymeric wheat proteins. Anal. Chem. 1999, 71, 8–14. [Google Scholar] [CrossRef] [PubMed]
- An, J.-H.; Lee, G.-Y.; Song, J.-H.; Lee, D.-W.; Kim, Y.-S. Properties of malonyl-CoA decarboxylase from Rhizobium trifolii. BMB Rep. 1999, 32, 414–418. [Google Scholar]
- Park, I.; Paeng, K.-J.; Yoon, Y.; Song, J.-H.; Moon, M.H. Separation and selective detection of lipoprotein particles of patients with coronary artery disease by frit-inlet asymmetrical flow field-flow fractionation. J. Chromatogr. B 2002, 780, 415–422. [Google Scholar] [CrossRef]
- Siripinyanond, A.; Barnes, R.M. Flow field-flow fractionation-inductively coupled plasma mass spectrometry and metal speciation in proteins: A feasibility study. J. Anal. At. Spectrom. 1999, 14, 1527–1531. [Google Scholar] [CrossRef]
- Bouzas-Ramos, D.; García-Alonso, J.I.; Costa-Fernández, J.M.; Ruiz Encinar, J. Quantitative Assessment of Individual Populations Present in Nanoparticle–Antibody Conjugate Mixtures Using AF4-ICP-MS/MS. Anal. Chem. 2019, 91, 3567–3574. [Google Scholar] [CrossRef]
- Reschiglian, P.; Zattoni, A.; Roda, B.; Cinque, L.; Parisi, D.; Roda, A.; Dal Piaz, F.; Moon, M.H.; Min, B.R. On-line hollow-fiber flow field-flow fractionation-electrospray ionization/time-of-flight mass spectrometry of intact proteins. Anal. Chem. 2005, 77, 47–56. [Google Scholar] [CrossRef]
- Kang, D.; Oh, S.; Reschiglian, P.; Moon, M.H. Separation of mitochondria by flow field-flow fractionation for proteomic analysis. Analyst 2008, 133, 505–515. [Google Scholar] [CrossRef]
- Kim, K.H.; Moon, M.H. High Speed Two-Dimensional Protein Separation without Gel by Isoelectric Focusing− Asymmetrical Flow Field Flow Fractionation: Application to Urinary Proteome. J. Proteome Res. 2009, 8, 4272–4278. [Google Scholar] [CrossRef]
- Zaman, M.; Ahmad, E.; Qadeer, A.; Rabbani, G.; Khan, R.H. Nanoparticles in relation to peptide and protein aggregation. Int. J. Nanomed. 2014, 9, 899. [Google Scholar]
- Athanasios, A.; Charalampos, V.; Vasileios, T. Protein-protein interaction (PPI) network: Recent advances in drug discovery. Curr. Drug Metab. 2017, 18, 5–10. [Google Scholar] [CrossRef] [PubMed]
- Ngounou Wetie, A.G.; Sokolowska, I.; Woods, A.G.; Roy, U.; Loo, J.A.; Darie, C.C. Investigation of stable and transient protein–protein interactions: Past, present, and future. Proteomics 2013, 13, 538–557. [Google Scholar] [CrossRef] [PubMed]
- Rao, V.S.; Srinivas, K.; Sujini, G.; Kumar, G. Protein-protein interaction detection: Methods and analysis. Int. J. Proteom. 2014, 2014, 147648. [Google Scholar] [CrossRef]
- Fukuda, J.; Iwura, T.; Yanagihara, S.; Kano, K. Separation and quantification of monoclonal-antibody aggregates by hollow-fiber-flow field-flow fractionation. Anal. Bioanal. Chem. 2014, 406, 6257–6264. [Google Scholar] [CrossRef] [PubMed]
- Reschiglian, P.; Roda, B.; Zattoni, A.; Tanase, M.; Marassi, V.; Serani, S. Hollow-fiber flow field-flow fractionation with multi-angle laser scattering detection for aggregation studies of therapeutic proteins. Anal. Bioanal. Chem. 2014, 406, 1619–1627. [Google Scholar] [CrossRef]
- Chou, R.Y.-T.; Pollastrini, J.; Dillon, T.M.; Bondarenko, P.V.; Tam, L.-T.T.; Miller, J.; Moxness, M.; Cao, S. Field-Flow Fractionation for Assessing Biomolecular Interactions in Solution. In Field-Flow Fractionation in Biopolymer Analysis; Springer: Berlin/Heidelberg, Germany, 2012; pp. 113–126. [Google Scholar]
- Pollastrini, J.; Dillon, T.M.; Bondarenko, P.; Chou, R.Y.-T. Field flow fractionation for assessing neonatal Fc receptor and Fcγ receptor binding to monoclonal antibodies in solution. Anal. Biochem. 2011, 414, 88–98. [Google Scholar] [CrossRef] [PubMed]
- Ventouri, I.K.; Astefanei, A.; Kaal, E.R.; Haselberg, R.; Somsen, G.W.; Schoenmakers, P.J. Asymmetrical flow field-flow fractionation to probe the dynamic association equilibria of β-D-galactosidase. J. Chromatogr. A 2021, 1635, 461719. [Google Scholar] [CrossRef]
- Bria, C.R.; Williams, S.K.R. Impact of asymmetrical flow field-flow fractionation on protein aggregates stability. J. Chromatogr. A 2016, 1465, 155–164. [Google Scholar] [CrossRef]
- Marassi, V.; De Marchis, F.; Roda, B.; Bellucci, M.; Capecchi, A.; Reschiglian, P.; Pompa, A.; Zattoni, A. Perspectives on protein biopolymers: Miniaturized flow field-flow fractionation-assisted characterization of a single-cysteine mutated phaseolin expressed in transplastomic tobacco plants. J. Chromatogr. A 2021, 1637, 461806. [Google Scholar] [CrossRef]
- Akash, M.S.H.; Rehman, K.; Tariq, M.; Chen, S. Development of therapeutic proteins: Advances and challenges. Turk. J. Biol. 2015, 39, 343–358. [Google Scholar] [CrossRef]
- Marioli, M.; Kok, W.T. Recovery, overloading, and protein interactions in asymmetrical flow field-flow fractionation. Anal. Bioanal. Chem. 2019, 411, 2327–2338. [Google Scholar] [CrossRef] [PubMed]
- Wahlund, P.-O.; Lorenzen, N.; Rischel, C. Screening for protein–protein interactions with asymmetrical flow field-flow fractionation. J. Pharm. Sci. 2021, 110, 2336–2339. [Google Scholar] [CrossRef] [PubMed]
- Marassi, V.; Roda, B.; Zattoni, A.; Tanase, M.; Reschiglian, P. Hollow fiber flow field-flow fractionation and size-exclusion chromatography with multi-angle light scattering detection: A complementary approach in biopharmaceutical industry. J. Chromatogr. A 2014, 1372, 196–203. [Google Scholar] [CrossRef] [PubMed]
- Carpenter, J.F.; Randolph, T.W.; Jiskoot, W.; Crommelin, D.J.; Middaugh, C.R.; Winter, G. Potential inaccurate quantitation and sizing of protein aggregates by size exclusion chromatography: Essential need to use orthogonal methods to assure the quality of therapeutic protein products. J. Pharm. Sci. 2010, 99, 2200–2208. [Google Scholar] [CrossRef]
- Frederiksen, T.M.; Sønderby, P.; Ryberg, L.A.; Harris, P.; Bukrinski, J.T.; Scharff-Poulsen, A.M.; Elf-Lind, M.N.; Peters, G.H. Oligomerization of a glucagon-like peptide 1 analog: Bridging experiment and simulations. Biophys. J. 2015, 109, 1202–1213. [Google Scholar] [CrossRef]
- Bria, C.R.; Jones, J.; Charlesworth, A.; Williams, S.K.R. Probing submicron aggregation kinetics of an IgG protein by asymmetrical flow field-flow fractionation. J. Pharm. Sci. 2016, 105, 31–39. [Google Scholar] [CrossRef]
- Borzova, V.A.; Markossian, K.A.; Chebotareva, N.A.; Kleymenov, S.Y.; Poliansky, N.B.; Muranov, K.O.; Stein-Margolina, V.A.; Shubin, V.V.; Markov, D.I.; Kurganov, B.I. Kinetics of thermal denaturation and aggregation of bovine serum albumin. PLoS ONE 2016, 11, e0153495. [Google Scholar] [CrossRef]
- Borzova, V.A.; Markossian, K.A.; Kara, D.A.; Kurganov, B. Kinetic regime of dithiothreitol-induced aggregation of bovine serum albumin. Int. J. Biol. Macromol. 2015, 80, 130–138. [Google Scholar] [CrossRef]
- Borzova, V.A.; Markossian, K.A.; Kleymenov, S.Y.; Kurganov, B.I. A change in the aggregation pathway of bovine serum albumin in the presence of arginine and its derivatives. Sci. Rep. 2017, 7, 3984. [Google Scholar] [CrossRef]
- Yie, J.; Wang, W.; Deng, L.; Tam, L.T.; Stevens, J.; Chen, M.M.; Li, Y.; Xu, J.; Lindberg, R.; Hecht, R. Understanding the Physical Interactions in the FGF21/FGFR/β-Klotho Complex: Structural Requirements and Implications in FGF21 Signaling. Chem. Biol. Drug Des. 2012, 79, 398–410. [Google Scholar] [CrossRef]
- Abbate, R.A.; Raak, N.; Boye, S.; Janke, A.; Rohm, H.; Jaros, D.; Lederer, A. Asymmetric flow field flow fractionation for the investigation of caseins cross-linked by microbial transglutaminase. Food Hydrocoll. 2019, 92, 117–124. [Google Scholar] [CrossRef]
- Guyomarc’h, F.; Violleau, F.; Surel, O.; Famelart, M.-H. Characterization of heat-induced changes in skim milk using asymmetrical flow field-flow fractionation coupled with multiangle laser light scattering. J. Agric. Food Chem. 2010, 58, 12592–12601. [Google Scholar] [CrossRef]
- Dou, H.; Magnusson, E.; Choi, J.; Duan, F.; Nilsson, L.; Lee, S. Study on aggregation behavior of low density lipoprotein in hen egg yolk plasma by asymmetrical flow field-flow fractionation coupled with multiple detectors. Food Chem. 2016, 192, 228–234. [Google Scholar] [CrossRef] [PubMed]
- Marassi, V.; Giordani, S.; Reschiglian, P.; Roda, B.; Zattoni, A. Tracking heme-protein interactions in healthy and pathological human serum in native conditions by miniaturized FFF-multidetection. Appl. Sci. 2022, 12, 6762. [Google Scholar] [CrossRef]
- Zappi, A.; Marassi, V.; Giordani, S.; Kassouf, N.; Roda, B.; Zattoni, A.; Reschiglian, P.; Melucci, D. Extracting Information and Enhancing the Quality of Separation Data: A Review on Chemometrics-Assisted Analysis of Volatile, Soluble and Colloidal Samples. Chemosensors 2023, 11, 45. [Google Scholar] [CrossRef]
- Bro, R.; Smilde, A.K. Principal component analysis. Anal. Methods 2014, 6, 2812–2831. [Google Scholar] [CrossRef]
- Osorio-Macías, D.E.; Bolinsson, H.; Linares-Pasten, J.A.; Ferrer-Gallego, R.; Choi, J.; Peñarrieta, J.M.; Bergenståhl, B. Characterization on the impact of different clarifiers on the white wine colloids using Asymmetrical Flow Field-Flow Fractionation. Food Chem. 2022, 381, 132123. [Google Scholar] [CrossRef]
- Zappi, A.; Marassi, V.; Kassouf, N.; Giordani, S.; Pasqualucci, G.; Garbini, D.; Roda, B.; Zattoni, A.; Reschiglian, P.; Melucci, D. A Green Analytical Method Combined with Chemometrics for Traceability of Tomato Sauce Based on Colloidal and Volatile Fingerprinting. Molecules 2022, 27, 5507. [Google Scholar] [CrossRef]
- Kenta, S.; Raikos, V.; Vagena, A.; Sevastos, D.; Kapolos, J.; Koliadima, A.; Karaiskakis, G. Kinetic study of aggregation of milk protein and/or surfactant-stabilized oil-in-water emulsions by Sedimentation Field-Flow Fractionation. J. Chromatogr. A 2013, 1305, 221–229. [Google Scholar] [CrossRef]
- Roma-Rodrigues, C.; Rivas-García, L.; Baptista, P.V.; Fernandes, A.R. Gene therapy in cancer treatment: Why go nano? Pharmaceutics 2020, 12, 233. [Google Scholar] [CrossRef]
- Edwards, G.B.; Muthurajan, U.M.; Bowerman, S.; Luger, K. Analytical Ultracentrifugation (AUC): An Overview of the Application of Fluorescence and Absorbance AUC to the Study of Biological Macromolecules. Curr. Protoc. Mol. Biol. 2020, 133, e131. [Google Scholar] [CrossRef]
- Ashby, J.; Schachermeyer, S.; Duan, Y.; Jimenez, L.A.; Zhong, W. Probing and quantifying DNA–protein interactions with asymmetrical flow field-flow fractionation. J. Chromatogr. A 2014, 1358, 217–224. [Google Scholar] [CrossRef]
- Wang, L.; Lee, J.Y.; Gao, L.; Yin, J.; Duan, Y.; Jimenez, L.A.; Adkins, G.B.; Ren, W.; Li, L.; Fang, J. A DNA aptamer for binding and inhibition of DNA methyltransferase 1. Nucleic Acids Res. 2019, 47, 11527–11537. [Google Scholar] [CrossRef] [PubMed]
- Schallinger, L.; Yau, W.; Kirkland, J. Sedimentation field flow fractionation of DNA’s. Science 1984, 225, 434–437. [Google Scholar] [CrossRef] [PubMed]
- Litzen, A.; Wahlund, K.-G. Improved separation speed and efficiency for proteins, nucleic acids and viruses in asymmetrical flow field flow fractionation. J. Chromatogr. A 1989, 476, 413–421. [Google Scholar] [CrossRef] [PubMed]
- Liu, M.K.; Giddings, J.C. Separation and measurement of diffusion coefficients of linear and circular DNAs by flow field-flow fractionation. Macromolecules 1993, 26, 3576–3588. [Google Scholar] [CrossRef]
- Chartrain, M.; Salmon, P.M.; Robinson, D.K.; Buckland, B.C. Metabolic engineering and directed evolution for the production of pharmaceuticals. Curr. Opin. Biotechnol. 2000, 11, 209–214. [Google Scholar] [CrossRef] [PubMed]
- Nilsson, M.; Kallio, P.T.; Bailey, J.E.; Bülow, L.; Wahlund, K.G. Expression of Vitreoscilla Hemoglobin in Escherichiacoli Enhances Ribosome and tRNA Levels: A Flow Field-Flow Fractionation Study. Biotechnol. Prog. 1999, 15, 158–163. [Google Scholar] [CrossRef]
- Arfvidsson, C.; Wahlund, K.-G. Time-minimized determination of ribosome and tRNA levels in bacterial cells using flow field–flow fractionation. Anal. Biochem. 2003, 313, 76–85. [Google Scholar] [CrossRef]
- Ewert, K.K.; Zidovska, A.; Ahmad, A.; Bouxsein, N.F.; Evans, H.M.; McAllister, C.S.; Samuel, C.E.; Safinya, C.R. Cationic liposome–nucleic acid complexes for gene delivery and silencing: Pathways and mechanisms for plasmid DNA and siRNA. In Nucleic Acid Transfection; Springer: Berlin/Heidelberg, Germany, 2010; pp. 191–226. [Google Scholar]
- Lee, H.; Williams, S.K.R.; Allison, S.D.; Anchordoquy, T.J. Analysis of self-assembled cationic lipid− DNA gene carrier complexes using flow field-flow fractionation and light scattering. Anal. Chem. 2001, 73, 837–843. [Google Scholar] [CrossRef]
- Nischwitz, V.; Stelmaszyk, L.; Piel, S.; Tiehm, A. Cascade Filtration With PCR Detection and Field-Flow-Fractionation Online With ICP-MS for the Characterization of DNA Interaction With Suspended Particulate Matter. Front. Chem. 2022, 10, 919442. [Google Scholar] [CrossRef] [PubMed]
- Schachermeyer, S.; Ashby, J.; Zhong, W. Aptamer–protein binding detected by asymmetric flow field flow fractionation. J. Chromatogr. A 2013, 1295, 107–113. [Google Scholar] [CrossRef]
- McKeague, M.; De Girolamo, A.; Valenzano, S.; Pascale, M.; Ruscito, A.; Velu, R.; Frost, N.R.; Hill, K.; Smith, M.; McConnell, E.M. Comprehensive analytical comparison of strategies used for small molecule aptamer evaluation. Anal. Chem. 2015, 87, 8608–8612. [Google Scholar] [CrossRef]
- Kotlarek, D.; Curti, F.; Vorobii, M.; Corradini, R.; Careri, M.; Knoll, W.; Rodriguez-Emmenegger, C.; Dostálek, J. Surface plasmon resonance-based aptasensor for direct monitoring of thrombin in a minimally processed human blood. Sens. Actuators B Chem. 2020, 320, 128380. [Google Scholar] [CrossRef]
- Chang, A.L.; McKeague, M.; Liang, J.C.; Smolke, C.D. Kinetic and equilibrium binding characterization of aptamers to small molecules using a label-free, sensitive, and scalable platform. Anal. Chem. 2014, 86, 3273–3278. [Google Scholar] [CrossRef]
- Nowak, P.M.; Śpiewak, K.; Woźniakiewicz, M.; Kościelniak, P. Minimizing the impact of Joule heating as a prerequisite for the reliable analysis of metal-protein complexes by capillary electrophoresis. J. Chromatogr. A 2017, 1495, 83–87. [Google Scholar] [CrossRef] [PubMed]
- Marassi, V.; Mattarozzi, M.; Toma, L.; Giordani, S.; Ronda, L.; Roda, B.; Zattoni, A.; Reschiglian, P.; Careri, M. FFF-based high-throughput sequence shortlisting to support the development of aptamer-based analytical strategies. Anal. Bioanal. Chem. 2022, 414, 5519–5527. [Google Scholar] [CrossRef] [PubMed]
- Yalpani, M. Polysaccharides: Syntheses, Modifications and Structure/Property Relations; Elsevier: Amsterdam, The Netherlands, 2013. [Google Scholar]
- Johann, C. Field-flow fractionation with multiangle light scattering. Pharm. Technol. Eur. 2005, 17, 31–33. [Google Scholar]
- Van Bruijnsvoort, M.; Wahlund, K.-G.; Nilsson, G.; Kok, W.T. Retention behaviour of amylopectins in asymmetrical flow field-flow fractionation studied by multi-angle light scattering detection. J. Chromatogr. A 2001, 925, 171–182. [Google Scholar] [CrossRef]
- Muñoz-Almagro, N.; Rico-Rodriguez, F.; Villamiel, M.; Montilla, A. Pectin characterisation using size exclusion chromatography: A comparison of ELS and RI detection. Food Chem. 2018, 252, 271–276. [Google Scholar] [CrossRef]
- Zielke, C.; Lu, Y.; Poinsot, R.; Nilsson, L. Interaction between cereal β-glucan and proteins in solution and at interfaces. Colloids Surf. B Biointerfaces 2018, 162, 256–264. [Google Scholar] [CrossRef] [PubMed]
- Wankar, J.; Bonvicini, F.; Benkovics, G.; Marassi, V.; Malanga, M.; Fenyvesi, E.; Gentilomi, G.A.; Reschiglian, P.; Roda, B.; Manet, I. Widening the therapeutic perspectives of clofazimine by its loading in sulfobutylether β-cyclodextrin nanocarriers: Nanomolar ic50 values against mdr s. Epidermidis. Mol. Pharm. 2018, 15, 3823–3836. [Google Scholar] [CrossRef] [PubMed]
- Ortiz-Tafoya, M.; Rolland-Sabaté, A.; Garnier, C.; Valadez-García, J.; Tecante, A. Thermal, conformational and rheological properties of κ-carrageenan-sodium stearoyl lactylate gels and solutions. Carbohydr. Polym. 2018, 193, 289–297. [Google Scholar] [CrossRef] [PubMed]
- González-Espinosa, Y.; Sabagh, B.; Moldenhauer, E.; Clarke, P.; Goycoolea, F. Characterisation of chitosan molecular weight distribution by multi-detection asymmetric flow-field flow fractionation (AF4) and SEC. Int. J. Biol. Macromol. 2019, 136, 911–919. [Google Scholar] [CrossRef] [PubMed]
- Kim, B.; Woo, S.; Park, Y.-S.; Hwang, E.; Moon, M.H. Ionic strength effect on molecular structure of hyaluronic acid investigated by flow field-flow fractionation and multiangle light scattering. Anal. Bioanal. Chem. 2015, 407, 1327–1334. [Google Scholar] [CrossRef] [PubMed]
- Fuentes, C.; Castañeda, R.; Rengel, F.; Peñarrieta, J.M.; Nilsson, L. Characterization of molecular properties of wheat starch from three different types of breads using asymmetric flow field-flow fractionation (AF4). Food Chem. 2019, 298, 125090. [Google Scholar] [CrossRef]
- Chen, X.; Zhang, W.; Dou, Y.; Song, T.; Shen, S.; Dou, H. Applications of asymmetrical flow field-flow fractionation for separation and characterization of polysaccharides: A review. J. Chromatogr. A 2021, 1635, 461726. [Google Scholar] [CrossRef]
- Guo, P.; Li, Y.; An, J.; Shen, S.; Dou, H. Study on structure-function of starch by asymmetrical flow field-flow fractionation coupled with multiple detectors: A review. Carbohydr. Polym. 2019, 226, 115330. [Google Scholar] [CrossRef]
- Dou, H.; Zhou, B.; Jang, H.-D.; Lee, S. Study on antidiabetic activity of wheat and barley starch using asymmetrical flow field-flow fractionation coupled with multiangle light scattering. J. Chromatogr. A 2014, 1340, 115–120. [Google Scholar] [CrossRef]
- Zhang, W.; Wang, J.; Guo, P.; Dai, S.; Zhang, X.; Meng, M.; Shen, S.; Zhang, A.; Dou, H. Study on the retrogradation behavior of starch by asymmetrical flow field-flow fractionation coupled with multiple detectors. Food Chem. 2019, 277, 674–681. [Google Scholar] [CrossRef]
- Zhang, H.; Chang, H.; Neuzil, P. DEP-on-a-chip: Dielectrophoresis applied to microfluidic platforms. Micromachines 2019, 10, 423. [Google Scholar] [CrossRef] [PubMed]
- Gołębiowski, A.; Kowalkowski, T.; Buszewski, B. Molecular parameters of low methoxylated pectin affected by gelation with copper and cadmium cations. Bioact. Carbohydr. Diet. Fibre 2020, 21, 100211. [Google Scholar] [CrossRef]
- Rolland-Sabaté, A.; Guilois, S.; Grimaud, F.; Lancelon-Pin, C.; Roussel, X.; Laguerre, S.; Viksø-Nielsen, A.; Putaux, J.-L.; D’Hulst, C.; Potocki-Véronèse, G. Characterization of hyperbranched glycopolymers produced in vitro using enzymes. Anal. Bioanal. Chem. 2014, 406, 1607–1618. [Google Scholar] [CrossRef]
- Austin, M.A.; Rodriguez, B.L.; McKnight, B.; McNeely, M.J.; Edwards, K.L.; Curb, J.D.; Sharp, D.S. Low-density lipoprotein particle size, triglycerides, and high-density lipoprotein cholesterol as risk factors for coronary heart disease in older Japanese-American men. Am. J. Cardiol. 2000, 86, 412–416. [Google Scholar] [CrossRef]
- Hsieh, J.-Y.; Chang, C.-T.; Huang, M.T.; Chang, C.-M.; Chen, C.-Y.; Shen, M.-Y.; Liao, H.-Y.; Wang, G.-J.; Chen, C.-H.; Chen, C.-J. Biochemical and functional characterization of charge-defined subfractions of high-density lipoprotein from normal adults. Anal. Chem. 2013, 85, 11440–11448. [Google Scholar] [CrossRef]
- Scheffer, P.G.; Bakker, S.J.; Heine, R.J.; Teerlink, T. Measurement of low-density lipoprotein particle size by high-performance gel-filtration chromatography. Clin. Chem. 1997, 43, 1904–1912. [Google Scholar] [CrossRef]
- Bobály, B.; Beck, A.; Fekete, J.; Guillarme, D.; Fekete, S. Systematic evaluation of mobile phase additives for the LC–MS characterization of therapeutic proteins. Talanta 2015, 136, 60–67. [Google Scholar] [CrossRef]
- Li, P.; Giddings, J.C. Isolation and measurement of colloids in human plasma by membrane-selective flow field-flow fractionation: Lipoproteins and pharmaceutical colloids. J. Pharm. Sci. 1996, 85, 895–898. [Google Scholar] [CrossRef] [PubMed]
- Bria, C.R.; Afshinnia, F.; Skelly, P.W.; Rajendiran, T.M.; Kayampilly, P.; Thomas, T.P.; Andreev, V.P.; Pennathur, S.; Kim Ratanathanawongs Williams, S. Asymmetrical flow field-flow fractionation for improved characterization of human plasma lipoproteins. Anal. Bioanal. Chem. 2019, 411, 777–786. [Google Scholar] [CrossRef]
- Ehara, S.; Ueda, M.; Naruko, T.; Haze, K.; Itoh, A.; Otsuka, M.; Komatsu, R.; Matsuo, T.; Itabe, H.; Takano, T. Elevated levels of oxidized low density lipoprotein show a positive relationship with the severity of acute coronary syndromes. Circulation 2001, 103, 1955–1960. [Google Scholar] [CrossRef]
- Watson, A.D.; Leitinger, N.; Navab, M.; Faull, K.F.; Hörkkö, S.; Witztum, J.L.; Palinski, W.; Schwenke, D.; Salomon, R.G.; Sha, W. Structural identification by mass spectrometry of oxidized phospholipids in minimally oxidized low density lipoprotein that induce monocyte/endothelial interactions and evidence for their presence in vivo. J. Biol. Chem. 1997, 272, 13597–13607. [Google Scholar] [CrossRef] [PubMed]
- Kim, S.H.; Yang, J.S.; Lee, J.C.; Lee, J.-Y.; Lee, J.-Y.; Kim, E.; Moon, M.H. Lipidomic alterations in lipoproteins of patients with mild cognitive impairment and Alzheimer’s disease by asymmetrical flow field-flow fractionation and nanoflow ultrahigh performance liquid chromatography-tandem mass spectrometry. J. Chromatogr. A 2018, 1568, 91–100. [Google Scholar] [CrossRef] [PubMed]
- Rambaldi, D.C.; Reschiglian, P.; Zattoni, A.; Johann, C. Enzymatic determination of cholesterol and triglycerides in serum lipoprotein profiles by asymmetrical flow field-flow fractionation with on-line, dual detection. Anal. Chim. Acta 2009, 654, 64–70. [Google Scholar] [CrossRef] [PubMed]
- Liu, P.; Chen, G.; Zhang, J. A review of liposomes as a drug delivery system: Current status of approved products, regulatory environments, and future perspectives. Molecules 2022, 27, 1372. [Google Scholar] [CrossRef] [PubMed]
- Sercombe, L.; Veerati, T.; Moheimani, F.; Wu, S.Y.; Sood, A.K.; Hua, S. Advances and challenges of liposome assisted drug delivery. Front. Pharmacol. 2015, 6, 286. [Google Scholar] [CrossRef] [PubMed]
- Caputo, F.; Mehn, D.; Clogston, J.; Rösslein, M.; Prina-Mello, A.; Borgos, S.; Gioria, S.; Calzolai, L. Asymmetric-flow field-flow fractionation for measuring particle size, drug loading and (in) stability of nanopharmaceuticals. The joint view of European Union Nanomedicine Characterization Laboratory and National Cancer Institute-Nanotechnology Characterization Laboratory. J. Chromatogr. A 2021, 1635, 461767. [Google Scholar]
- Hupfeld, S.; Moen, H.H.; Ausbacher, D.; Haas, H.; Brandl, M. Liposome fractionation and size analysis by asymmetrical flow field-flow fractionation/multi-angle light scattering: Influence of ionic strength and osmotic pressure of the carrier liquid. Chem. Phys. Lipids 2010, 163, 141–147. [Google Scholar] [CrossRef]
- Kaluđerović, G.N.; Dietrich, A.; Kommera, H.; Kuntsche, J.; Mäder, K.; Mueller, T.; Paschke, R. Liposomes as vehicles for water insoluble platinum-based potential drug: 2-(4-(Tetrahydro-2H-pyran-2-yloxy)-undecyl)-propane-1, 3-diamminedichloroplatinum (II). Eur. J. Med. Chem. 2012, 54, 567–572. [Google Scholar] [CrossRef]
- Kang, D.Y.; Kim, M.J.; Kim, S.T.; Oh, K.S.; Yuk, S.H.; Lee, S. Size characterization of drug-loaded polymeric core/shell nanoparticles using asymmetrical flow field-flow fractionation. Anal. Bioanal. Chem. 2008, 390, 2183–2188. [Google Scholar] [CrossRef]
- Evjen, T.J.; Hupfeld, S.; Barnert, S.; Fossheim, S.; Schubert, R.; Brandl, M. Physicochemical characterization of liposomes after ultrasound exposure–mechanisms of drug release. J. Pharm. Biomed. Anal. 2013, 78, 118–122. [Google Scholar] [CrossRef]
- Li, S.; Nickels, J.; Palmer, A.F. Liposome-encapsulated actin–hemoglobin (LEAcHb) artificial blood substitutes. Biomaterials 2005, 26, 3759–3769. [Google Scholar] [CrossRef]
- Decker, C.; Fahr, A.; Kuntsche, J.; May, S. Selective partitioning of cholesterol and a model drug into liposomes of varying size. Chem. Phys. Lipids 2012, 165, 520–529. [Google Scholar] [CrossRef] [PubMed]
- Sitar, S.; Vezočnik, V.; Maček, P.; Kogej, K.; Pahovnik, D.; Žagar, E. Pitfalls in size characterization of soft particles by dynamic light scattering online coupled to asymmetrical flow field-flow fractionation. Anal. Chem. 2017, 89, 11744–11752. [Google Scholar] [CrossRef] [PubMed]
- Caputo, F.; Arnould, A.; Bacia, M.; Ling, W.L.; Rustique, E.; Texier, I.; Mello, A.P.; Couffin, A.-C. Measuring particle size distribution by asymmetric flow field flow fractionation: A powerful method for the preclinical characterization of lipid-based nanoparticles. Mol. Pharm. 2019, 16, 756–767. [Google Scholar] [CrossRef]
- Parot, J.; Caputo, F.; Mehn, D.; Hackley, V.A.; Calzolai, L. Physical characterization of liposomal drug formulations using multi-detector asymmetrical-flow field flow fractionation. J. Control. Release 2020, 320, 495–510. [Google Scholar] [CrossRef]
- Ansar, S.M.; Mudalige, T. Characterization of doxorubicin liposomal formulations for size-based distribution of drug and excipients using asymmetric-flow field-flow fractionation (AF4) and liquid chromatography-mass spectrometry (LC-MS). Int. J. Pharm. 2020, 574, 118906. [Google Scholar] [CrossRef]
- Van Haute, D.; Jiang, W.; Mudalige, T. Evaluation of size-based distribution of drug and excipient in amphotericin B liposomal formulation. Int. J. Pharm. 2019, 569, 118603. [Google Scholar] [CrossRef]
- Jahn, A.; Vreeland, W.N.; DeVoe, D.L.; Locascio, L.E.; Gaitan, M. Microfluidic directed formation of liposomes of controlled size. Langmuir 2007, 23, 6289–6293. [Google Scholar] [CrossRef]
- Satori, C.P.; Kostal, V.; Arriaga, E.A. Review on recent advances in the analysis of isolated organelles. Anal. Chim. Acta 2012, 753, 8–18. [Google Scholar] [CrossRef]
- Dunkley, T.P.; Hester, S.; Shadforth, I.P.; Runions, J.; Weimar, T.; Hanton, S.L.; Griffin, J.L.; Bessant, C.; Brandizzi, F.; Hawes, C. Mapping the Arabidopsis organelle proteome. Proc. Natl. Acad. Sci. USA 2006, 103, 6518–6523. [Google Scholar] [CrossRef]
- Yang, J.S.; Lee, J.C.; Byeon, S.K.; Rha, K.H.; Moon, M.H. Size Dependent Lipidomic Analysis of Urinary Exosomes from Patients with Prostate Cancer by Flow Field-Flow Fractionation and Nanoflow Liquid Chromatography-Tandem Mass Spectrometry. Anal. Chem. 2017, 89, 2488–2496. [Google Scholar] [CrossRef] [PubMed]
- Mozersky, S.M.; Caldwell, K.D.; Jones, S.B.; Maleeff, B.E.; Barford, R.A. Sedimentation field flow fractionation of mitochondrial and microsomal membranes from corn roots. Anal. Biochem. 1988, 172, 113–123. [Google Scholar] [CrossRef] [PubMed]
- Lu, H.; Gaudet, S.; Schmidt, M.A.; Jensen, K.F. A microfabricated device for subcellular organelle sorting. Anal. Chem. 2004, 76, 5705–5712. [Google Scholar] [CrossRef] [PubMed]
- Nilsson, M.; Birnbaum, S.; Wahlund, K.-G. Determination of relative amounts of ribosome and subunits in Escherichia coli using asymmetrical flow field-flow fractionation. J. Biochem. Biophys. Methods 1996, 33, 9–23. [Google Scholar] [CrossRef] [PubMed]
- Petersen, K.E.; Manangon, E.; Hood, J.L.; Wickline, S.A.; Fernandez, D.P.; Johnson, W.P.; Gale, B.K. A review of exosome separation techniques and characterization of B16-F10 mouse melanoma exosomes with AF4-UV-MALS-DLS-TEM. Anal. Bioanal. Chem. 2014, 406, 7855–7866. [Google Scholar] [CrossRef]
- Böing, A.N.; Van Der Pol, E.; Grootemaat, A.E.; Coumans, F.A.; Sturk, A.; Nieuwland, R. Single-step isolation of extracellular vesicles by size-exclusion chromatography. J. Extracell. Vesicles 2014, 3, 23430. [Google Scholar] [CrossRef]
- Baranyai, T.; Herczeg, K.; Onódi, Z.; Voszka, I.; Módos, K.; Marton, N.; Nagy, G.; Maeger, I.; Wood, M.J.; El Andaloussi, S. Isolation of exosomes from blood plasma: Qualitative and quantitative comparison of ultracentrifugation and size exclusion chromatography methods. PLoS ONE 2015, 10, e0145686. [Google Scholar] [CrossRef]
- Weng, Y.; Sui, Z.; Shan, Y.; Hu, Y.; Chen, Y.; Zhang, L.; Zhang, Y. Effective isolation of exosomes with polyethylene glycol from cell culture supernatant for in-depth proteome profiling. Analyst 2016, 141, 4640–4646. [Google Scholar] [CrossRef]
- Greening, D.W.; Xu, R.; Ji, H.; Tauro, B.J.; Simpson, R.J. A protocol for exosome isolation and characterization: Evaluation of ultracentrifugation, density-gradient separation, and immunoaffinity capture methods. In Proteomic Profiling; Springer: Berlin/Heidelberg, Germany, 2015; pp. 179–209. [Google Scholar]
- Tauro, B.J.; Greening, D.W.; Mathias, R.A.; Ji, H.; Mathivanan, S.; Scott, A.M.; Simpson, R.J. Comparison of ultracentrifugation, density gradient separation, and immunoaffinity capture methods for isolating human colon cancer cell line LIM1863-derived exosomes. Methods 2012, 56, 293–304. [Google Scholar] [CrossRef]
- Kim, Y.B.; Yang, J.S.; Lee, G.B.; Moon, M.H. Evaluation of exosome separation from human serum by frit-inlet asymmetrical flow field-flow fractionation and multiangle light scattering. Anal. Chim. Acta 2020, 1124, 137–145. [Google Scholar] [CrossRef]
- Zhang, H.; Freitas, D.; Kim, H.S.; Fabijanic, K.; Li, Z.; Chen, H.; Mark, M.T.; Molina, H.; Martin, A.B.; Bojmar, L. Identification of distinct nanoparticles and subsets of extracellular vesicles by asymmetric flow field-flow fractionation. Nat. Cell Biol. 2018, 20, 332–343. [Google Scholar] [CrossRef]
- Kang, D.; Oh, S.; Ahn, S.-M.; Lee, B.-H.; Moon, M.H. Proteomic analysis of exosomes from human neural stem cells by flow field-flow fractionation and nanoflow liquid chromatography–tandem mass spectrometry. J. Proteome Res. 2008, 7, 3475–3480. [Google Scholar] [CrossRef] [PubMed]
- Petersen, K.E.; Shiri, F.; White, T.; Bardi, G.T.; Sant, H.; Gale, B.K.; Hood, J.L. Exosome isolation: Cyclical electrical field flow fractionation in low-ionic-strength fluids. Anal. Chem. 2018, 90, 12783–12790. [Google Scholar] [CrossRef] [PubMed]
- Wu, B.; Chen, X.; Wang, J.; Qing, X.; Wang, Z.; Ding, X.; Xie, Z.; Niu, L.; Guo, X.; Cai, T. Separation and characterization of extracellular vesicles from human plasma by asymmetrical flow field-flow fractionation. Anal. Chim. Acta 2020, 1127, 234–245. [Google Scholar] [CrossRef]
- Kim, Y.B.; Lee, G.B.; Moon, M.H. Size Separation of Exosomes and Microvesicles Using Flow Field-Flow Fractionation/Multiangle Light Scattering and Lipidomic Comparison. Anal. Chem. 2022, 94, 8958–8965. [Google Scholar] [CrossRef]
- Qian, C.; Liu, X.; Xu, Q.; Wang, Z.; Chen, J.; Li, T.; Zheng, Q.; Yu, H.; Gu, Y.; Li, S. Recent progress on the versatility of virus-like particles. Vaccines 2020, 8, 139. [Google Scholar] [CrossRef] [PubMed]
- Nooraei, S.; Bahrulolum, H.; Hoseini, Z.S.; Katalani, C.; Hajizade, A.; Easton, A.J.; Ahmadian, G. Virus-like particles: Preparation, immunogenicity and their roles as nanovaccines and drug nanocarriers. J. Nanobiotechnol. 2021, 19, 59. [Google Scholar] [CrossRef]
- Kondylis, P.; Schlicksup, C.J.; Zlotnick, A.; Jacobson, S.C. Analytical techniques to characterize the structure, properties, and assembly of virus capsids. Anal. Chem. 2018, 91, 622–636. [Google Scholar] [CrossRef] [PubMed]
- Hermens, W.T.; Brake, O.T.; Dijkhuizen, P.A.; Sonnemans, M.A.; Grimm, D.; Kleinschmidt, J.A.; Verhaagen, J. Purification of recombinant adeno-associated virus by iodixanol gradient ultracentrifugation allows rapid and reproducible preparation of vector stocks for gene transfer in the nervous system. Hum. Gene Ther. 1999, 10, 1885–1891. [Google Scholar] [CrossRef]
- Wright, J.F.; Le, T.; Prado, J.; Bahr-Davidson, J.; Smith, P.H.; Zhen, Z.; Sommer, J.M.; Pierce, G.F.; Qu, G. Identification of factors that contribute to recombinant AAV2 particle aggregation and methods to prevent its occurrence during vector purification and formulation. Mol. Ther. 2005, 12, 171–178. [Google Scholar] [CrossRef] [PubMed]
- Levitzky, N.; Smith, E.; Lachman, O.; Luria, N.; Mizrahi, Y.; Bakelman, H.; Sela, N.; Laskar, O.; Milrot, E.; Dombrovsky, A. The bumblebee Bombus terrestris carries a primary inoculum of Tomato brown rugose fruit virus contributing to disease spread in tomatoes. PLoS ONE 2019, 14, e0210871. [Google Scholar] [CrossRef]
- Giddings, J.C.; Yang, F.J.; Myers, M.N. Application of sedimentation field-flow fractionation to biological particles: Molecular weights and separation. Sep. Sci. 1975, 10, 133–149. [Google Scholar] [CrossRef]
- Caldwell, K.D.; Nguyen, T.T.; Giddings, J.C.; Mazzone, H.M. Field-flow fractionation of alkali-liberated nuclear polyhedrosis virus from gypsy moth Lymantria dispar Linnaeus. J. Virol. Methods 1980, 1, 241–256. [Google Scholar] [CrossRef]
- Caldwell, K.D.; Karaiskakis, G.; Giddings, J.C. Characterization of T4D virus by sedimentation field-flow fractionation. J. Chromatogr. A 1981, 215, 323–332. [Google Scholar] [CrossRef]
- Yonker, C.R.; Caldwell, K.D.; Giddings, J.C.; Van Etten, J.L. Physical characterization of PBCV virus by sedimentation field flow fractionation. J. Virol. Methods 1985, 11, 145–160. [Google Scholar] [CrossRef]
- Giddings, J.C.; Yang, F.J.; Myers, M.N. Flow field-flow fractionation: New method for separating, purifying, and characterizing the diffusivity of viruses. J. Virol. 1977, 21, 131–138. [Google Scholar] [CrossRef]
- Wei, Z.; Mcevoy, M.; Razinkov, V.; Polozova, A.; Li, E.; Casas-Finet, J.; Tous, G.I.; Balu, P.; Pan, A.A.; Mehta, H. Biophysical characterization of influenza virus subpopulations using field flow fractionation and multiangle light scattering: Correlation of particle counts, size distribution and infectivity. J. Virol. Methods 2007, 144, 122–132. [Google Scholar] [CrossRef]
- Chuan, Y.P.; Fan, Y.Y.; Lua, L.H.; Middelberg, A.P. Virus assembly occurs following a pH-or Ca2+-triggered switch in the thermodynamic attraction between structural protein capsomeres. J. R. Soc. Interface 2010, 7, 409–421. [Google Scholar] [CrossRef]
- Chen, Y.; Zhang, Y.; Zhou, Y.; Luo, J.; Su, Z. Asymmetrical flow field-flow fractionation coupled with multi-angle laser light scattering for stability comparison of virus-like particles in different solution environments. Vaccine 2016, 34, 3164–3170. [Google Scholar] [CrossRef]
- Eskelin, K.; Poranen, M.M.; Oksanen, H.M. Asymmetrical flow field-flow fractionation on virus and virus-like particle applications. Microorganisms 2019, 7, 555. [Google Scholar] [CrossRef]
- Liew, M.W.; Chuan, Y.P.; Middelberg, A.P. High-yield and scalable cell-free assembly of virus-like particles by dilution. Biochem. Eng. J. 2012, 67, 88–96. [Google Scholar] [CrossRef]
- Citkowicz, A.; Petry, H.; Harkins, R.N.; Ast, O.; Cashion, L.; Goldmann, C.; Bringmann, P.; Plummer, K.; Larsen, B.R. Characterization of virus-like particle assembly for DNA delivery using asymmetrical flow field-flow fractionation and light scattering. Anal. Biochem. 2008, 376, 163–172. [Google Scholar] [CrossRef] [PubMed]
- Shiri, F.; Petersen, K.E.; Romanov, V.; Zou, Q.; Gale, B.K. Characterization and differential retention of Q beta bacteriophage virus-like particles using cyclical electrical field–flow fractionation and asymmetrical flow field–flow fractionation. Anal. Bioanal. Chem. 2020, 412, 1563–1572. [Google Scholar] [CrossRef] [PubMed]
- Fischer, A. The use of monoclonal antibodies in allogeneic bone marrow transplantation. Br. J. Haematol. 1993, 83, 531–534. [Google Scholar] [CrossRef] [PubMed]
- Pant, P.K.; Tao, H.; Beilharz, E.J.; Ballinger, D.G.; Cox, D.R.; Frazer, K.A. Analysis of allelic differential expression in human white blood cells. Genome Res. 2006, 16, 331–339. [Google Scholar] [CrossRef]
- Bauer, J. Advances in cell separation: Recent developments in counterflow centrifugal elutriation and continuous flow cell separation. J. Chromatogr. B Biomed. Sci. Appl. 1999, 722, 55–69. [Google Scholar] [CrossRef]
- Golovanov, M. Electrophoresis of cells at a physiological ionic strength. In Cell Electrophoresis; CRC Press: Boca Raton, FL, USA, 2020; pp. 181–196. [Google Scholar]
- Villas, B. Flow cytometry: An overview. Cell Vis. J. Anal. Morphol. 1998, 5, 56–61. [Google Scholar]
- Handgretinger, R.; Lang, P.; Schumm, M.; Taylor, G.; Neu, S.; Koscielnak, E.; Niethammer, D.; Klingebiel, T. Isolation and transplantation of autologous peripheral CD34+ progenitor cells highly purified by magnetic-activated cell sorting. Bone Marrow Transplant. 1998, 21, 987–993. [Google Scholar] [CrossRef]
- Mavrou, A.; Colialexi, A.; Tsangaris, G.T.; Antsaklis, A.; Panagiotopoulou, P.; Tsenghi, C.; Metaxotoy, C. Fetal cells in maternal blood: Isolation by magnetic cell sorting and confirmation by immunophenotyping and FISH. In Vivo 1998, 12, 195–200. [Google Scholar]
- Hoffstetter-Kuhn, S.; Rösler, T.; Ehrat, M.; Widmer, H.M. Characterization of yeast cultivations by steric sedimentation field-flow fractionation. Anal. Biochem. 1992, 206, 300–308. [Google Scholar] [CrossRef]
- Caldwell, K.D.; Cheng, Z.-Q.; Hradecky, P.; Giddings, J.C. Separation of human and animal cells by steric field-flow fractionation. Cell Biophys. 1984, 6, 233–251. [Google Scholar] [CrossRef] [PubMed]
- Naves, T.; Battu, S.; Jauberteau, M.-O.; Cardot, P.J.; Ratinaud, M.-H.; Verdier, M. Autophagic subpopulation sorting by sedimentation field-flow fractionation. Anal. Chem. 2012, 84, 8748–8755. [Google Scholar] [CrossRef] [PubMed]
- Metreau, J.M.; Gallet, S.; Cardot, P.J.; Le Maire, V.; Dumas, F.; Hernvann, A.; Loric, S. Sedimentation field-flow fractionation of cellular species. Anal. Biochem. 1997, 251, 178–186. [Google Scholar] [CrossRef]
- Assidjo, E.; P Cardot, P.J. Sedimentation field-flow fractionation at gravitational field of red blood cells: Systematic studies of injection conditions. J. Liq. Chromatogr. Relat. Technol. 1997, 20, 2579–2597. [Google Scholar] [CrossRef]
- Chianea, T.; Cardot, P.J.; Assidjo, E.; Monteil, J.; Clarot, I.; Krausz, P. Field-and flow-dependent trapping of red blood cells on polycarbonate accumulation wall in sedimentation field-flow fractionation. J. Chromatogr. B Biomed. Sci. Appl. 1999, 734, 91–99. [Google Scholar] [CrossRef] [PubMed]
- Battu, S.; Roux, A.; Delebasee, S.; Bosgiraud, C.; Cardot, P.J. Sedimentation field-flow fractionation device cleaning, decontamination and sterilization procedures for cellular analysis. J. Chromatogr. B Biomed. Sci. Appl. 2001, 751, 131–141. [Google Scholar] [CrossRef]
- Mitais, N.; Bessette, B.; Gobron, S.; Cardot, P.; Jauberteau, M.; Battu, S.; Lalloué, F. Kinetics of chemically mediated neurodegeneration/neuroregeneration of mouse olfactory epithelium: Monitoring by hyperlayer sedimentation field flow fractionation. Anal. Bioanal. Chem. 2014, 406, 1671–1681. [Google Scholar] [CrossRef]
- Bertrand, J.; Liagre, B.; Bégaud-Grimaud, G.; Jauberteau, M.; Beneytout, J.-L.; Cardot, P.; Battu, S. Analysis of relationship between cell cycle stage and apoptosis induction in K562 cells by sedimentation field-flow fractionation. J. Chromatogr. B 2009, 877, 1155–1161. [Google Scholar] [CrossRef]
- Corbiere, C.; Battu, S.; Liagre, B.; Cardot, P.; Beneytout, J. SdFFF monitoring of cellular apoptosis induction by diosgenin and different inducers in the human 1547 osteosarcoma cell line. J. Chromatogr. B 2004, 808, 255–262. [Google Scholar] [CrossRef]
- Mélin, C.; Perraud, A.; Christou, N.; Bibes, R.; Cardot, P.; Jauberteau, M.-O.; Battu, S.; Mathonnet, M. New ex-ovo colorectal-cancer models from different SdFFF-sorted tumor-initiating cells. Anal. Bioanal. Chem. 2015, 407, 8433–8443. [Google Scholar] [CrossRef]
- Battu, S.; Elyaman, W.; Hugon, J.; Cardot, P.J. Cortical cell elution by sedimentation field-flow fractionation. Biochim. Biophys. Acta (BBA)-Gen. Subj. 2001, 1528, 89–96. [Google Scholar] [CrossRef]
- Léger, D.Y.; Liagre, B.; Cardot, P.J.P.; Beneytout, J.-L.; Battu, S. Diosgenin dose-dependent apoptosis and differentiation induction in human erythroleukemia cell line and sedimentation field-flow fractionation monitoring. Anal. Biochem. 2004, 335, 267–278. [Google Scholar] [CrossRef]
- Leger, D.; Battu, S.; Liagre, B.; Beneytout, J.; Cardot, P. Megakaryocyte cell sorting from diosgenin-differentiated human erythroleukemia cells by sedimentation field-flow fractionation. Anal. Biochem. 2006, 355, 19–28. [Google Scholar] [CrossRef] [PubMed]
- Bégaud-Grimaud, G.; Battu, S.; Liagre, B.; Leger, D.; Beneytout, J.; Cardot, P. Pre-apoptotic sub-population cell sorting from diosgenin apoptosis induced 1547 cells by Sedimentation Field-Flow Fractionation: The effect of channel thickness on sorting performance. J. Chromatogr. A 2006, 1128, 194–202. [Google Scholar] [CrossRef] [PubMed]
- Cardot, P.; Battu, S.; Sarrazin, R. Field-flow fractionation separation device with a separation channel and a counter channel. Ep Pat. 2006, 2006, 1679124. [Google Scholar]
- Merino-Dugay, A.; Cardot, P.J.; Czok, M.; Guernet, M.; Andreux, J. Monitoring of an experimental red blood cell pathology with gravitational field-flow fractionation. J. Chromatogr. B Biomed. Sci. Appl. 1992, 579, 73–83. [Google Scholar] [CrossRef] [PubMed]
- Tong, X.; Caldwell, K.D. Separation and characterization of red blood cells with different membrane deformability using steric field-flow fractionation. J. Chromatogr. B Biomed. Sci. Appl. 1995, 674, 39–47. [Google Scholar] [CrossRef]
- Sanz, R.; Puignou, L.; Reschiglian, P.; Galceran, M. Gravitational field-flow fractionation for the characterisation of active dry wine yeast. J. Chromatogr. A 2001, 919, 339–347. [Google Scholar] [CrossRef] [PubMed]
- Sanz, R.; Torsello, B.; Reschiglian, P.; Puignou, L.; Galceran, M. Improved performance of gravitational field-flow fractionation for screening wine-making yeast varieties. J. Chromatogr. A 2002, 966, 135–143. [Google Scholar] [CrossRef] [PubMed]
- Sanz, R.; Puignou, L.; Galceran, M.T.; Reschiglian, P.; Zattoni, A.; Melucci, D. Coupling gravitational and flow field-flow fractionation, and size-distribution analysis of whole yeast cells. Anal. Bioanal. Chem. 2004, 379, 1068–1075. [Google Scholar] [CrossRef]
- Garcia, L.P.; Jurado, R.S.; Huguet, M.G. Method and Apparatus for Determining Cell Viability. Patent PCT/ES2004/000492, 4 November 2004. [Google Scholar]
- Lattuada, D.; Roda, B.; Pignatari, C.; Magni, R.; Colombo, F.; Cattaneo, A.; Zattoni, A.; Cetin, I.; Reschiglian, P.; Bolis, G. A tag-less method for direct isolation of human umbilical vein endothelial cells by gravitational field-flow fractionation. Anal. Bioanal. Chem. 2013, 405, 977–984. [Google Scholar] [CrossRef]
- Roda, B.; Reschiglian, P.; Zattoni, A.; Tazzari, P.L.; Buzzi, M.; Ricci, F.; Bontadini, A. Human lymphocyte sorting by gravitational field-flow fractionation. Anal. Bioanal. Chem. 2008, 392, 137–145. [Google Scholar] [CrossRef]
- Rajabzadeh, N.; Fathi, E.; Farahzadi, R. Stem cell-based regenerative medicine. Stem Cell Investig. 2019, 6, 19. [Google Scholar] [CrossRef]
- Urbánková, E.; Vacek, A.; Chmelík, J. Micropreparation of hemopoietic stem cells from the mouse bone marrow suspension by gravitational field-flow fractionation. J. Chromatogr. B Biomed. Sci. Appl. 1996, 687, 449–452. [Google Scholar] [CrossRef]
- Lautrette, C.; Cardot, P.; Vermot-Desroches, C.; Wijdenes, J.; Jauberteau, M.; Battu, S. Sedimentation field flow fractionation purification of immature neural cells from a human tumor neuroblastoma cell line. J. Chromatogr. B 2003, 791, 149–160. [Google Scholar] [CrossRef]
- Guglielmi, L.; Battu, S.; Le Bert, M.; Faucher, J.; Cardot, P.; Denizot, Y. Mouse embryonic stem cell sorting for the generation of transgenic mice by sedimentation field-flow fractionation. Anal. Chem. 2004, 76, 1580–1585. [Google Scholar] [CrossRef]
- Mélin, C.; Perraud, A.; Du Puch, C.B.M.; Loum, E.; Giraud, S.; Cardot, P.; Jauberteau, M.-O.; Lautrette, C.; Battu, S.; Mathonnet, M. Sedimentation field flow fractionation monitoring of in vitro enrichment in cancer stem cells by specific serum-free culture medium. J. Chromatogr. B 2014, 963, 40–46. [Google Scholar] [CrossRef]
- Vedrenne, N.; Sarrazy, V.; Richard, L.; Bordeau, N.; Battu, S.; Billet, F.; Desmoulière, A. Isolation of astrocytes displaying Myofibroblast properties and present in multiple sclerosis lesions. Neurochem. Res. 2017, 42, 2427–2434. [Google Scholar] [CrossRef] [PubMed]
- Vedrenne, N.; Sarrazy, V.; Battu, S.; Bordeau, N.; Richard, L.; Billet, F.; Coronas, V.; Desmoulière, A. Neural stem cell properties of an astrocyte subpopulation sorted by sedimentation field-flow fractionation. Rejuvenation Res. 2016, 19, 362–372. [Google Scholar] [CrossRef]
- Faye, P.-A.; Vedrenne, N.; De la Cruz-Morcillo, M.A.; Barrot, C.-C.c.; Richard, L.; Bourthoumieu, S.; Sturtz, F.; Funalot, B.; Lia, A.-S.; Battu, S. New method for sorting endothelial and neural progenitors from human induced pluripotent stem cells by sedimentation field flow fractionation. Anal. Chem. 2016, 88, 6696–6702. [Google Scholar] [CrossRef]
- Lacroix, A.; Deluche, E.; Zhang, L.Y.; Dalmay, C.; Mélin, C.; Leroy, J.; Babay, M.; Morand Du Puch, C.; Giraud, S.; Bessette, B.; et al. A new label-free approach to glioblastoma cancer stem cell sorting and detection. Anal. Chem. 2019, 91, 8948–8957. [Google Scholar] [CrossRef]
- Brunel, A.; Hombourger, S.; Barthout, E.; Battu, S.; Kögel, D.; Antonietti, P.; Deluche, E.; Saada, S.; Durand, S.; Lalloué, F.; et al. Autophagy inhibition reinforces stemness together with exit from dormancy of polydisperse glioblastoma stem cells. Aging 2021, 13, 18106. [Google Scholar] [CrossRef] [PubMed]
- Saydé, T.; Manczak, R.; Saada, S.; Bégaud, G.; Bessette, B.; Lespes, G.; Le Coustumer, P.; Gaudin, K.; Dalmay, C.; Pothier, A.; et al. Characterization of glioblastoma cancer stem cells sorted by sedimentation field-flow fractionation using an ultrahigh-frequency range dielectrophoresis biosensor. Anal. Chem. 2021, 93, 12664–12671. [Google Scholar] [CrossRef] [PubMed]
- Hervieu, C.; Verdier, M.; Barthout, E.; Bégaud, G.; Christou, N.; Sage, M.; Pannequin, J.; Battu, S.; Mathonnet, M. A Label-Free Cell Sorting Approach to Highlight the Impact of Intratumoral Cellular Heterogeneity and Cancer Stem Cells on Response to Therapies. Cells 2022, 11, 2264. [Google Scholar] [CrossRef]
- Roda, B.; Lanzoni, G.; Alviano, F.; Zattoni, A.; Costa, R.; Di Carlo, A.; Marchionni, C.; Franchina, M.; Ricci, F.; Tazzari, P.L. A novel stem cell tag-less sorting method. Stem Cell Rev. Rep. 2009, 5, 420–427. [Google Scholar] [CrossRef] [PubMed]
- Zia, S.; Roda, B.; Zannini, C.; Alviano, F.; Bonsi, L.; Govoni, M.; Vivarelli, L.; Fazio, N.; Dallari, D.; Reschiglian, P. Quality Control Platform for the Standardization of a Regenerative Medicine Product. Bioengineering 2022, 9, 142. [Google Scholar] [CrossRef]
- Rossi, M.; Alviano, F.; Myrtaj, B.; Zia, S.; Righi, S.; Pizzuti, V.; Paris, F.; Roda, B.; Zattoni, A.; Bonsi, L. The Medium Obtained from the Culture of Hodgkin Lymphoma Cells Affects the Biophysical Characteristics of a Fibroblast Cell Model. Bioengineering 2023, 10, 197. [Google Scholar] [CrossRef]
- Falzarano, M.S.; Grilli, A.; Zia, S.; Fang, M.; Rossi, R.; Gualandi, F.; Rimessi, P.; El Dani, R.; Fabris, M.; Lu, Z. RNA-seq in DMD urinary stem cells recognized muscle-related transcription signatures and addressed the identification of atypical mutations by whole-genome sequencing. Hum. Genet. Genom. Adv. 2022, 3, 100054. [Google Scholar] [CrossRef]
- Zia, S.; Roda, B.; Maggio, A.; Marrazzo, P.; Pizzuti, V.; Alviano, F.; Bonsi, L.; Marassi, V.; Zattoni, A.; Reschiglian, P. Celector®: An Innovative Technology for Quality Control of Living Cells. Appl. Sci. 2022, 12, 9967. [Google Scholar] [CrossRef]
- Zia, S.; Cavallo, C.; Vigliotta, I.; Parisi, V.; Grigolo, B.; Buda, R.; Marrazzo, P.; Alviano, F.; Bonsi, L.; Zattoni, A. Effective label-free sorting of multipotent mesenchymal stem cells from clinical bone marrow samples. Bioengineering 2022, 9, 49. [Google Scholar] [CrossRef]
- Zia, S.; Martini, G.; Pizzuti, V.; Maggio, A.; Simonazzi, G.; Reschiglian, P.; Bonsi, L.; Alviano, F.; Roda, B.; Zattoni, A. A New Predictive Technology for Perinatal Stem Cell Isolation Suited for Cell Therapy Approaches. Micromachines 2021, 12, 782. [Google Scholar] [CrossRef]
- Casciaro, F.; Zia, S.; Forcato, M.; Zavatti, M.; Beretti, F.; Bertucci, E.; Zattoni, A.; Reschiglian, P.; Alviano, F.; Bonsi, L. Unravelling heterogeneity of amplified human amniotic fluid stem cells sub-populations. Cells 2021, 10, 158. [Google Scholar] [CrossRef] [PubMed]
- Reschiglian, P.; Zattoni, A.; Roda, B.; Cinque, L.; Melucci, D.; Min, B.R.; Moon, M.H. Hyperlayer hollow-fiber flow field-flow fractionation of cells. J. Chromatogr. A 2003, 985, 519–529. [Google Scholar] [CrossRef] [PubMed]
- Giddings, J.C.; Barman, B.N.; Liu, M.-K. Separation of Cells by Field-Flow Fractionation; ACS Publications: Washington, DC, USA, 1991. [Google Scholar]
- Gascoyne, P.; Satayavivad, J.; Ruchirawat, M. Microfluidic approaches to malaria detection. Acta Trop. 2004, 89, 357–369. [Google Scholar] [CrossRef] [PubMed]
- Pui-ock, S.; Ruchirawat, M.; Gascoyne, P. Dielectrophoretic field-flow fractionation system for detection of aquatic toxicants. Anal. Chem. 2008, 80, 7727–7734. [Google Scholar] [CrossRef] [PubMed]
- Vykoukal, J.; Vykoukal, D.M.; Freyberg, S.; Alt, E.U.; Gascoyne, P.R. Enrichment of putative stem cells from adipose tissue using dielectrophoretic field-flow fractionation. Lab Chip 2008, 8, 1386–1393. [Google Scholar] [CrossRef] [PubMed]
- Vykoukal, J.; Yang, J.; Becker, F.F.; Gascoyne, P.R.; Krulevitch, P.; Ackler, H.; Hamilton, J. A combined dielectrophoretic and field-flow fractionation microsystem for biomedical separation and analysis. In Proceedings of Micro Total Analysis Systems 2000; Springer: Dordrecht, The Netherlands, 2000; pp. 127–130. [Google Scholar]
- Wang, X.-B.; Yang, J.; Huang, Y.; Vykoukal, J.; Becker, F.F.; Gascoyne, P.R. Cell separation by dielectrophoretic field-flow-fractionation. Anal. Chem. 2000, 72, 832–839. [Google Scholar] [CrossRef]
- Huang, Y.; Yang, J.; Wang, X.-B.; Becker, F.F.; Gascoyne, P.R. The removal of human breast cancer cells from hematopoietic CD34+ stem cells by dielectrophoretic field-flow-fractionation. J. Hematother. Stem Cell Res. 1999, 8, 481–490. [Google Scholar] [CrossRef]
- Gascoyne, P.R.; Noshari, J.; Anderson, T.J.; Becker, F.F. Isolation of rare cells from cell mixtures by dielectrophoresis. Electrophoresis 2009, 30, 1388–1398. [Google Scholar] [CrossRef]
- Merino, A.; Bories, C.; Gantier, J.-C.; Cardot, P.J. Isolation of microfilariae from blood by gravitational field-flow fractionation. J. Chromatogr. B Biomed. Sci. Appl. 1991, 572, 291–301. [Google Scholar] [CrossRef]
- Khoshmanesh, A.; Sharma, R.; Beckett, R. Biomass of sediment bacteria by sedimentation field-flow fractionation. J. Environ. Eng. 2001, 127, 19–25. [Google Scholar] [CrossRef]
- Gallet, S.; Metreau, J.M.; Loiseau, P.M.; Bories, C.; Cardot, P.J. Isolation of bloodstream trypanosomes by sedimentation field-flow fractionation. J. Microcolumn Sep. 1997, 9, 469–477. [Google Scholar] [CrossRef]
- Janča, J.; Kašpárková, V.; Halabalová, V.; Šimek, L.; Růžička, J.; Barošová, E. Micro-thermal field-flow fractionation of bacteria. J. Chromatogr. B 2007, 852, 512–518. [Google Scholar] [CrossRef] [PubMed]
- Gascoyne, P.; Mahidol, C.; Ruchirawat, M.; Satayavivad, J.; Watcharasit, P.; Becker, F.F. Microsample preparation by dielectrophoresis: Isolation of malaria. Lab Chip 2002, 2, 70–75. [Google Scholar] [CrossRef]
- Lee, H.; Williams, S.K.R.; Wahl, K.L.; Valentine, N.B. Analysis of whole bacterial cells by flow field-flow fractionation and matrix-assisted laser desorption/ionization time-of-flight mass spectrometry. Anal. Chem. 2003, 75, 2746–2752. [Google Scholar] [CrossRef] [PubMed]
- Reschiglian, P.; Zattoni, A.; Cinque, L.; Roda, B.; Dal Piaz, F.; Roda, A.; Moon, M.H.; Min, B.R. Hollow-fiber flow field-flow fractionation for whole bacteria analysis by matrix-assisted laser desorption/ionization time-of-flight mass spectrometry. Anal. Chem. 2004, 76, 2103–2111. [Google Scholar] [CrossRef] [PubMed]
- Jackson, B.P.; Ranville, J.F.; Neal, A.L. Application of flow field flow fractionation-ICPMS for the study of uranium binding in bacterial cell suspensions. Anal. Chem. 2005, 77, 1393–1397. [Google Scholar] [CrossRef]
- Pornwilard, M.-M.; Siripinyanond, A. Field-flow fractionation with inductively coupled plasma mass spectrometry: Past, present, and future. J. Anal. At. Spectrom. 2014, 29, 1739–1752. [Google Scholar]
- Loosli, F.; Wang, J.; Sikder, M.; Afshinnia, K.; Baalousha, M. Analysis of engineered nanomaterials (Ag, CeO2 and Fe2O3) in spiked surface waters at environmentally relevant particle concentrations. Sci. Total Environ. 2020, 715, 136927. [Google Scholar] [CrossRef]
- Barber, A.; Kly, S.; Moffitt, M.G.; Rand, L.; Ranville, J.F. Coupling single particle ICP-MS with field-flow fractionation for characterizing metal nanoparticles contained in nanoplastic colloids. Environ. Sci. Nano 2020, 7, 514–524. [Google Scholar] [CrossRef]
- Nikzamir, M.; Akbarzadeh, A.; Panahi, Y. An overview on nanoparticles used in biomedicine and their cytotoxicity. J. Drug Deliv. Sci. Technol. 2021, 61, 102316. [Google Scholar] [CrossRef]
- Railean-Plugaru, V.; Pomastowski, P.; Kowalkowski, T.; Sprynskyy, M.; Buszewski, B. Physicochemical study of natural fractionated biocolloid by asymmetric flow field-flow fractionation in tandem with various complementary techniques using biologically synthesized silver nanocomposites. Anal. Bioanal. Chem. 2018, 410, 2837–2847. [Google Scholar] [CrossRef] [PubMed]
- Marassi, V.; Wang, J.; Giordani, S.; Roda, B.; Reschiglian, P.; Zattoni, A. Quality control and purification of ready-to-use conjugated Gold nanoparticles to ensure effectiveness in biosensing. Front. Sens. 2022, 3, 1087115. [Google Scholar]
- Lee, J.; Goda, E.S.; Choi, J.; Park, J.; Lee, S. Synthesis and characterization of elution behavior of nonspherical gold nanoparticles in asymmetrical flow field-flow fractionation (AsFlFFF). J. Nanopart. Res. 2020, 22, 256. [Google Scholar] [CrossRef]
- Loeschner, K.; Navratilova, J.; Legros, S.; Wagner, S.; Grombe, R.; Snell, J.; Von der Kammer, F.; Larsen, E.H. Optimization and evaluation of asymmetric flow field-flow fractionation of silver nanoparticles. J. Chromatogr. A 2013, 1272, 116–125. [Google Scholar] [CrossRef] [PubMed]
- Amde, M.; Tan, Z.-Q.; Liu, J. Separation and size characterization of zinc oxide nanoparticles in environmental waters using asymmetrical flow field-flow fractionation. Talanta 2019, 200, 357–365. [Google Scholar] [CrossRef]
- Roda, B.; Marassi, V.; Zattoni, A.; Borghi, F.; Anand, R.; Agostoni, V.; Gref, R.; Reschiglian, P.; Monti, S. Flow field-flow fractionation and multi-angle light scattering as a powerful tool for the characterization and stability evaluation of drug-loaded metal–organic framework nanoparticles. Anal. Bioanal. Chem. 2018, 410, 5245–5253. [Google Scholar] [CrossRef]
- Gigault, J.; Grassl, B. Improving the understanding of fullerene (nC60) aggregate structures: Fractal dimension characterization by static light scattering coupled to asymmetrical flow field flow fractionation. J. Colloid Interface Sci. 2017, 502, 193–200. [Google Scholar] [CrossRef]
- Moquin, A.; Neibert, K.D.; Maysinger, D.; Winnik, F.M. Quantum dot agglomerates in biological media and their characterization by asymmetrical flow field-flow fractionation. Eur. J. Pharm. Biopharm. 2015, 89, 290–299. [Google Scholar] [CrossRef]
- Correia, M.; Loeschner, K. Detection of nanoplastics in food by asymmetric flow field-flow fractionation coupled to multi-angle light scattering: Possibilities, challenges and analytical limitations. Anal. Bioanal. Chem. 2018, 410, 5603–5615. [Google Scholar] [CrossRef]
- Gigault, J.; El Hadri, H.; Reynaud, S.; Deniau, E.; Grassl, B. Asymmetrical flow field flow fractionation methods to characterize submicron particles: Application to carbon-based aggregates and nanoplastics. Anal. Bioanal. Chem. 2017, 409, 6761–6769. [Google Scholar] [CrossRef] [PubMed]
- Marassi, V.; Casolari, S.; Panzavolta, S.; Bonvicini, F.; Gentilomi, G.A.; Giordani, S.; Zattoni, A.; Reschiglian, P.; Roda, B. Synthesis Monitoring, Characterization and Cleanup of Ag-Polydopamine Nanoparticles Used as Antibacterial Agents with Field-Flow Fractionation. Antibiotics 2022, 11, 358. [Google Scholar] [CrossRef] [PubMed]
- Lopez-Sanz, S.; Fariñas, N.R.; Martín-Doimeadios, R.d.C.R.; Rios, A. Analytical strategy based on asymmetric flow field flow fractionation hyphenated to ICP-MS and complementary techniques to study gold nanoparticles transformations in cell culture medium. Anal. Chim. Acta 2019, 1053, 178–185. [Google Scholar] [CrossRef] [PubMed]
- Bai, Q.; Yin, Y.; Liu, Y.; Jiang, H.; Wu, M.; Wang, W.; Tan, Z.; Liu, J.; Moon, M.H.; Xing, B. Flow field-flow fractionation hyphenated with inductively coupled plasma mass spectrometry: A robust technique for characterization of engineered elemental metal nanoparticles in the environment. Appl. Spectrosc. Rev. 2021, 58, 110–131. [Google Scholar] [CrossRef]
- Faucher, S.; Charron, G.; Lützen, E.; Le Coustumer, P.; Schaumlöffel, D.; Sivry, Y.; Lespes, G. Characterization of polymer-coated CdSe/ZnS quantum dots and investigation of their behaviour in soil solution at relevant concentration by asymmetric flow field-flow fractionation–multi angle light scattering–inductively coupled plasma-mass spectrometry. Anal. Chim. Acta 2018, 1028, 104–112. [Google Scholar] [CrossRef]
- Garcia-Cortes, M.; Sotelo González, E.; Fernández-Argüelles, M.a.T.; Encinar, J.R.; Costa-Fernández, J.M.; Sanz-Medel, A. Capping of Mn-doped ZnS quantum dots with DHLA for their stabilization in aqueous media: Determination of the nanoparticle number concentration and surface ligand density. Langmuir 2017, 33, 6333–6341. [Google Scholar] [CrossRef]
- Marassi, V.; Di Cristo, L.; Smith, S.G.; Ortelli, S.; Blosi, M.; Costa, A.L.; Reschiglian, P.; Volkov, Y.; Prina-Mello, A. Silver nanoparticles as a medical device in healthcare settings: A five-step approach for candidate screening of coating agents. R. Soc. Open Sci. 2018, 5, 171113. [Google Scholar] [CrossRef]
- Sánchez-García, L.; Bolea, E.; Laborda, F.; Cubel, C.; Ferrer, P.; Gianolio, D.; Da Silva, I.; Castillo, J. Size determination and quantification of engineered cerium oxide nanoparticles by flow field-flow fractionation coupled to inductively coupled plasma mass spectrometry. J. Chromatogr. A 2016, 1438, 205–215. [Google Scholar] [CrossRef]
- Marassi, V.; Casolari, S.; Roda, B.; Zattoni, A.; Reschiglian, P.; Panzavolta, S.; Tofail, S.A.; Ortelli, S.; Delpivo, C.; Blosi, M. Hollow-fiber flow field-flow fractionation and multi-angle light scattering investigation of the size, shape and metal-release of silver nanoparticles in aqueous medium for nano-risk assessment. J. Pharm. Biomed. Anal. 2015, 106, 92–99. [Google Scholar] [CrossRef]
- Tan, Z.-Q.; Yin, Y.-G.; Guo, X.-R.; Amde, M.; Moon, M.H.; Liu, J.-F.; Jiang, G.-B. Tracking the transformation of nanoparticulate and ionic silver at environmentally relevant concentration levels by hollow fiber flow field-flow fractionation coupled to ICPMS. Environ. Sci. Technol. 2017, 51, 12369–12376. [Google Scholar] [CrossRef]
- Tan, Z.; Chen, Q.; Yin, Y.; Liu, Y.; Lin, Y.; Bai, Q.; Wu, M.; Yao, W.; Xu, S.; Liu, J. Tracking the dissolution behavior of zinc oxide nanoparticles in skimmed milk powder solutions. Food Chem. 2021, 365, 130520. [Google Scholar] [CrossRef] [PubMed]
- Marassi, V.; Zanoni, I.; Ortelli, S.; Giordani, S.; Reschiglian, P.; Roda, B.; Zattoni, A.; Ravagli, C.; Cappiello, L.; Baldi, G. Native Study of the Behaviour of Magnetite Nanoparticles for Hyperthermia Treatment during the Initial Moments of Intravenous Administration. Pharmaceutics 2022, 14, 2810. [Google Scholar] [CrossRef] [PubMed]
- Smith, W.C.; Morse, J.R.; Bria, C.R.; Schaak, R.E.; Williams, S.K.R. Composition-Based Separation of Pt–Fe3O4 Hybrid Nanoparticles by Thermal Field-Flow Fractionation. ACS Appl. Nano Mater. 2018, 1, 6435–6443. [Google Scholar] [CrossRef]
- Greyling, G.; Lederer, A.; Pasch, H. Thermal Field-Flow Fractionation for the Investigation of the Thermoresponsive Nature of Star and Linear Polystyrene. Macromol. Chem. Phys. 2018, 219, 1800417. [Google Scholar] [CrossRef]
- Greyling, G.; Pasch, H. Thermal Field-Flow Fractionation of Polymers; Springer: Berlin/Heidelberg, Germany, 2019; Volume 1. [Google Scholar]
- Eslahian, K.A.; Maskos, M. Hofmeister effect in thermal field-flow fractionation of colloidal aqueous dispersions. Colloids Surf. A Physicochem. Eng. Asp. 2012, 413, 65–70. [Google Scholar] [CrossRef]
- Staub, A.; Guillarme, D.; Schappler, J.; Veuthey, J.-L.; Rudaz, S. Intact protein analysis in the biopharmaceutical field. J. Pharm. Biomed. Anal. 2011, 55, 810–822. [Google Scholar] [CrossRef]
- Dou, H.; Kim, B.-J.; Choi, S.-H.; Jung, E.C.; Lee, S. Effect of size of Fe3O4 magnetic nanoparticles on electrochemical performance of screen printed electrode using sedimentation field-flow fractionation. J. Nanopart. Res. 2014, 16, 2679. [Google Scholar] [CrossRef]
- Xu, M.; Yim, W.; Zhou, J.; Zhou, J.; Jin, Z.; Moore, C.; Borum, R.; Jorns, A.; Jokerst, J.V. The application of organic nanomaterials for bioimaging, drug delivery, and therapy: Spanning various domains. IEEE Nanotechnol. Mag. 2021, 15, 8–28. [Google Scholar] [CrossRef]
- Schadlich, A.; Caysa, H.; Mueller, T.; Tenambergen, F.; Rose, C.; Göpferich, A.; Kuntsche, J.; Mäder, K. Tumor accumulation of NIR fluorescent PEG–PLA nanoparticles: Impact of particle size and human xenograft tumor model. ACS Nano 2011, 5, 8710–8720. [Google Scholar] [CrossRef]
- Schädlich, A.; Rose, C.; Kuntsche, J.; Caysa, H.; Mueller, T.; Göpferich, A.; Mäder, K. How stealthy are PEG-PLA nanoparticles? An NIR in vivo study combined with detailed size measurements. Pharm. Res. 2011, 28, 1995–2007. [Google Scholar] [CrossRef]
- Augsten, C.; Mäder, K. Measuring particle size distributions of degrading nanospheres consisting of PLGA using asymmetrical Flow Field-Flow Fractionation. In Proceedings of the 12th International Symposium on Field-Flow Fractionation, Brno, Czech Republic, 28–30 August 2005; p. 30. [Google Scholar]
- Lee, S.; Kwen, H.D.; Lee, S.K.; Nehete, S.V. Study on elution behavior of poly (amidoamine) dendrimers and their interaction with bovine serum albumin in asymmetrical flow field-flow fractionation. Anal. Bioanal. Chem. 2010, 396, 1581–1588. [Google Scholar] [CrossRef] [PubMed]
- Boye, S.; Appelhans, D.; Boyko, V.; Zschoche, S.; Komber, H.; Friedel, P.; Formanek, P.; Janke, A.; Voit, B.; Lederer, A. pH-triggered aggregate shape of different generations lysine-dendronized maleimide copolymers with maltose shell. Biomacromolecules 2012, 13, 4222–4235. [Google Scholar] [CrossRef] [PubMed]
- Oh, J.K.; Drumright, R.; Siegwart, D.J.; Matyjaszewski, K. The development of microgels/nanogels for drug delivery applications. Prog. Polym. Sci. 2008, 33, 448–477. [Google Scholar] [CrossRef]
- Ekkelenkamp, A.E.; Elzes, M.R.; Engbersen, J.F.; Paulusse, J.M. Responsive crosslinked polymer nanogels for imaging and therapeutics delivery. J. Mater. Chem. B 2018, 6, 210–235. [Google Scholar] [CrossRef] [PubMed]
- Smeets, N.M.; Hoare, T. Designing responsive microgels for drug delivery applications. J. Polym. Sci. Part A Polym. Chem. 2013, 51, 3027–3043. [Google Scholar] [CrossRef]
- Smith, M.H.; South, A.B.; Gaulding, J.C.; Lyon, L.A. Monitoring the erosion of hydrolytically-degradable nanogels via multiangle light scattering coupled to asymmetrical flow field-flow fractionation. Anal. Chem. 2010, 82, 523–530. [Google Scholar] [CrossRef]
- Niezabitowska, E.; Town, A.R.; Sabagh, B.; Moctezuma, M.D.M.; Kearns, V.R.; Spain, S.G.; Rannard, S.P.; McDonald, T.O. Insights into the internal structures of nanogels using a versatile asymmetric-flow field-flow fractionation method. Nanoscale Adv. 2020, 2, 4713–4721. [Google Scholar] [CrossRef]
- Gaulding, J.C.; South, A.B.; Lyon, L.A. Hydrolytically degradable shells on thermoresponsive microgels. Colloid Polym. Sci. 2013, 291, 99–107. [Google Scholar] [CrossRef]
- Shimoda, A.; Sawada, S.-i.; Kano, A.; Maruyama, A.; Moquin, A.; Winnik, F.M.; Akiyoshi, K. Dual crosslinked hydrogel nanoparticles by nanogel bottom-up method for sustained-release delivery. Colloids Surf. B Biointerfaces 2012, 99, 38–44. [Google Scholar] [CrossRef]
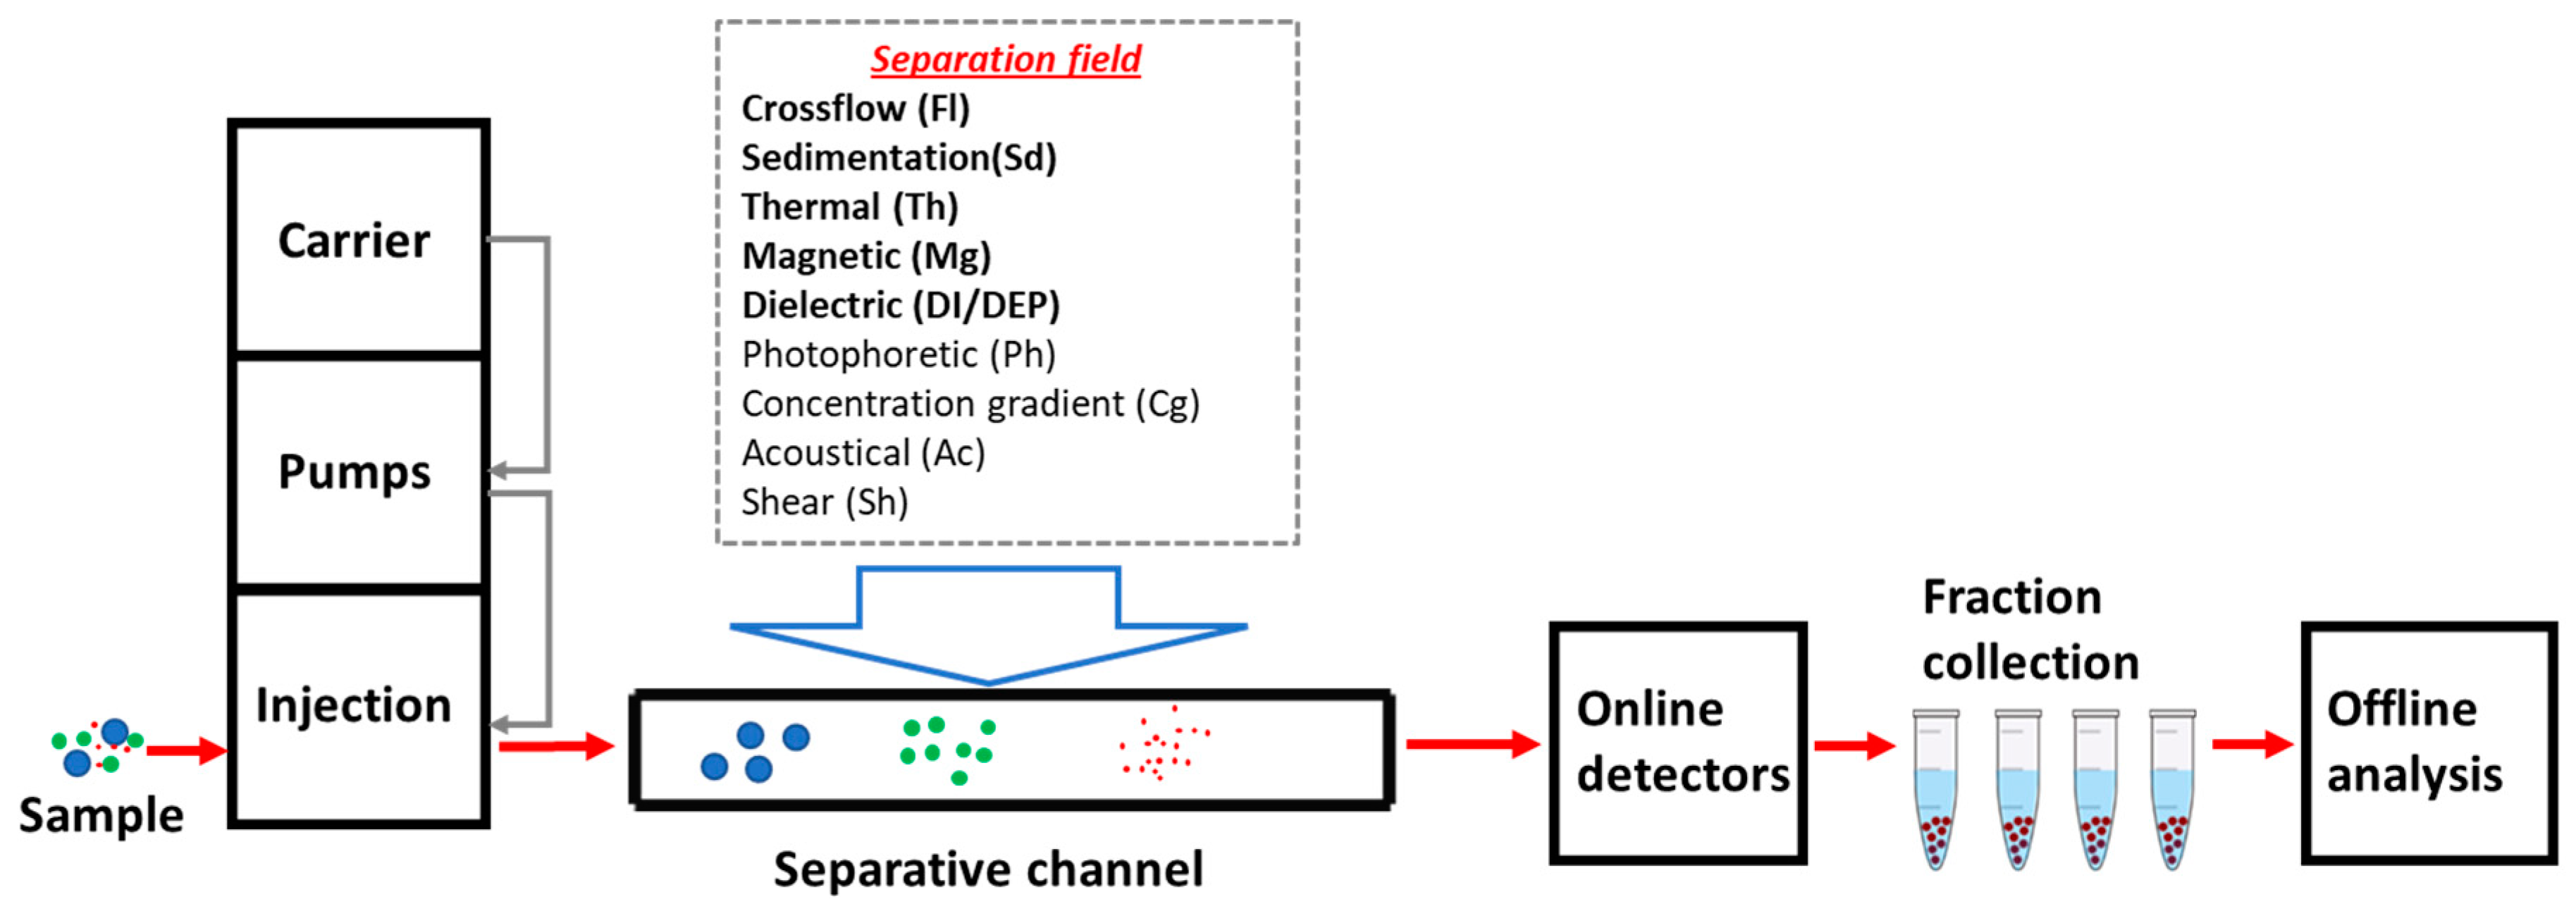
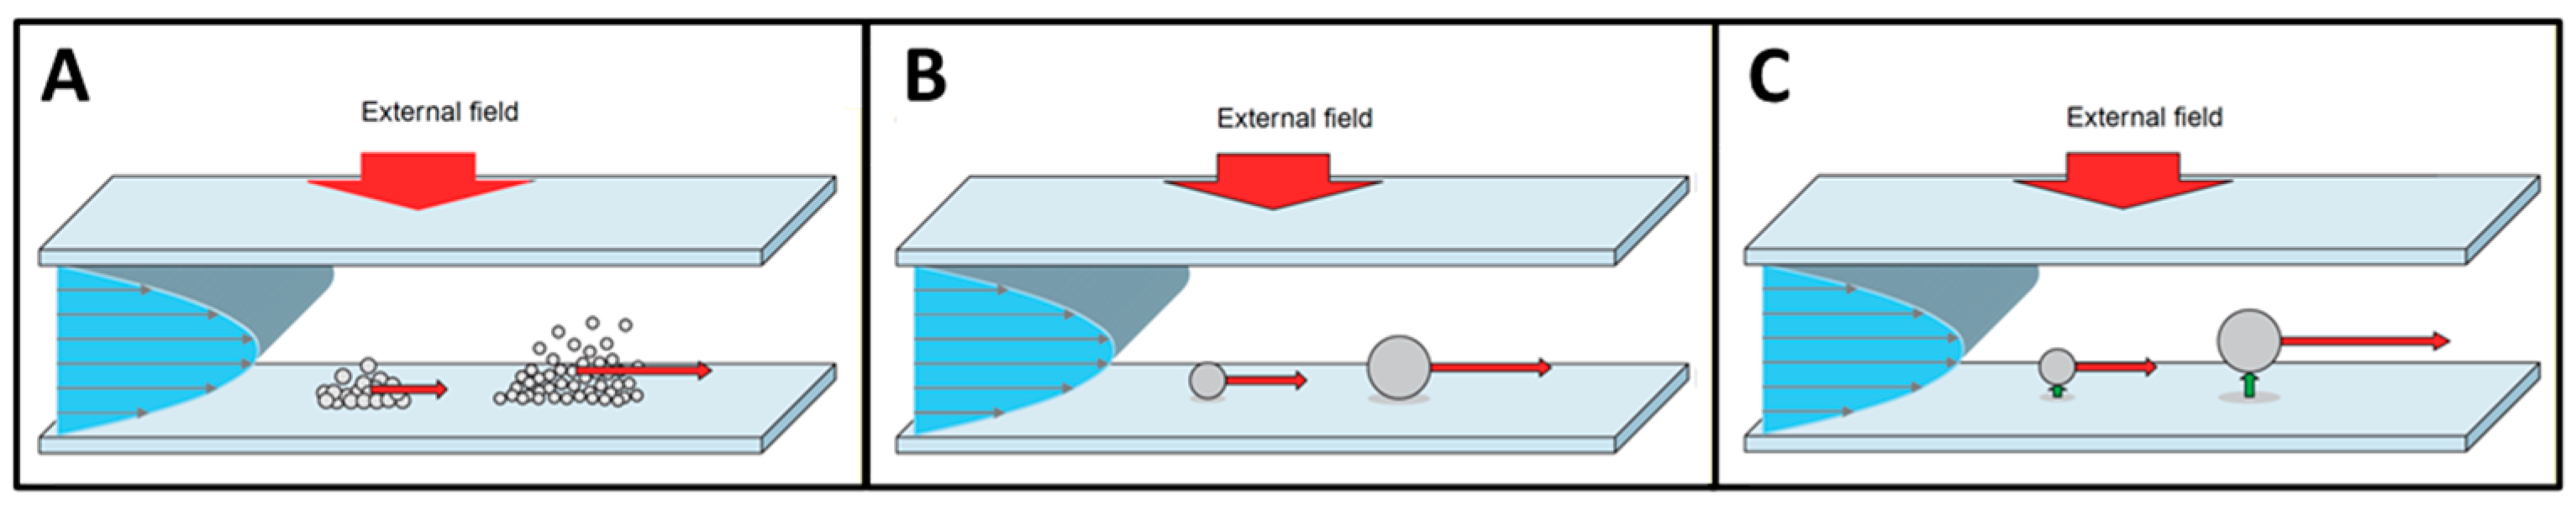


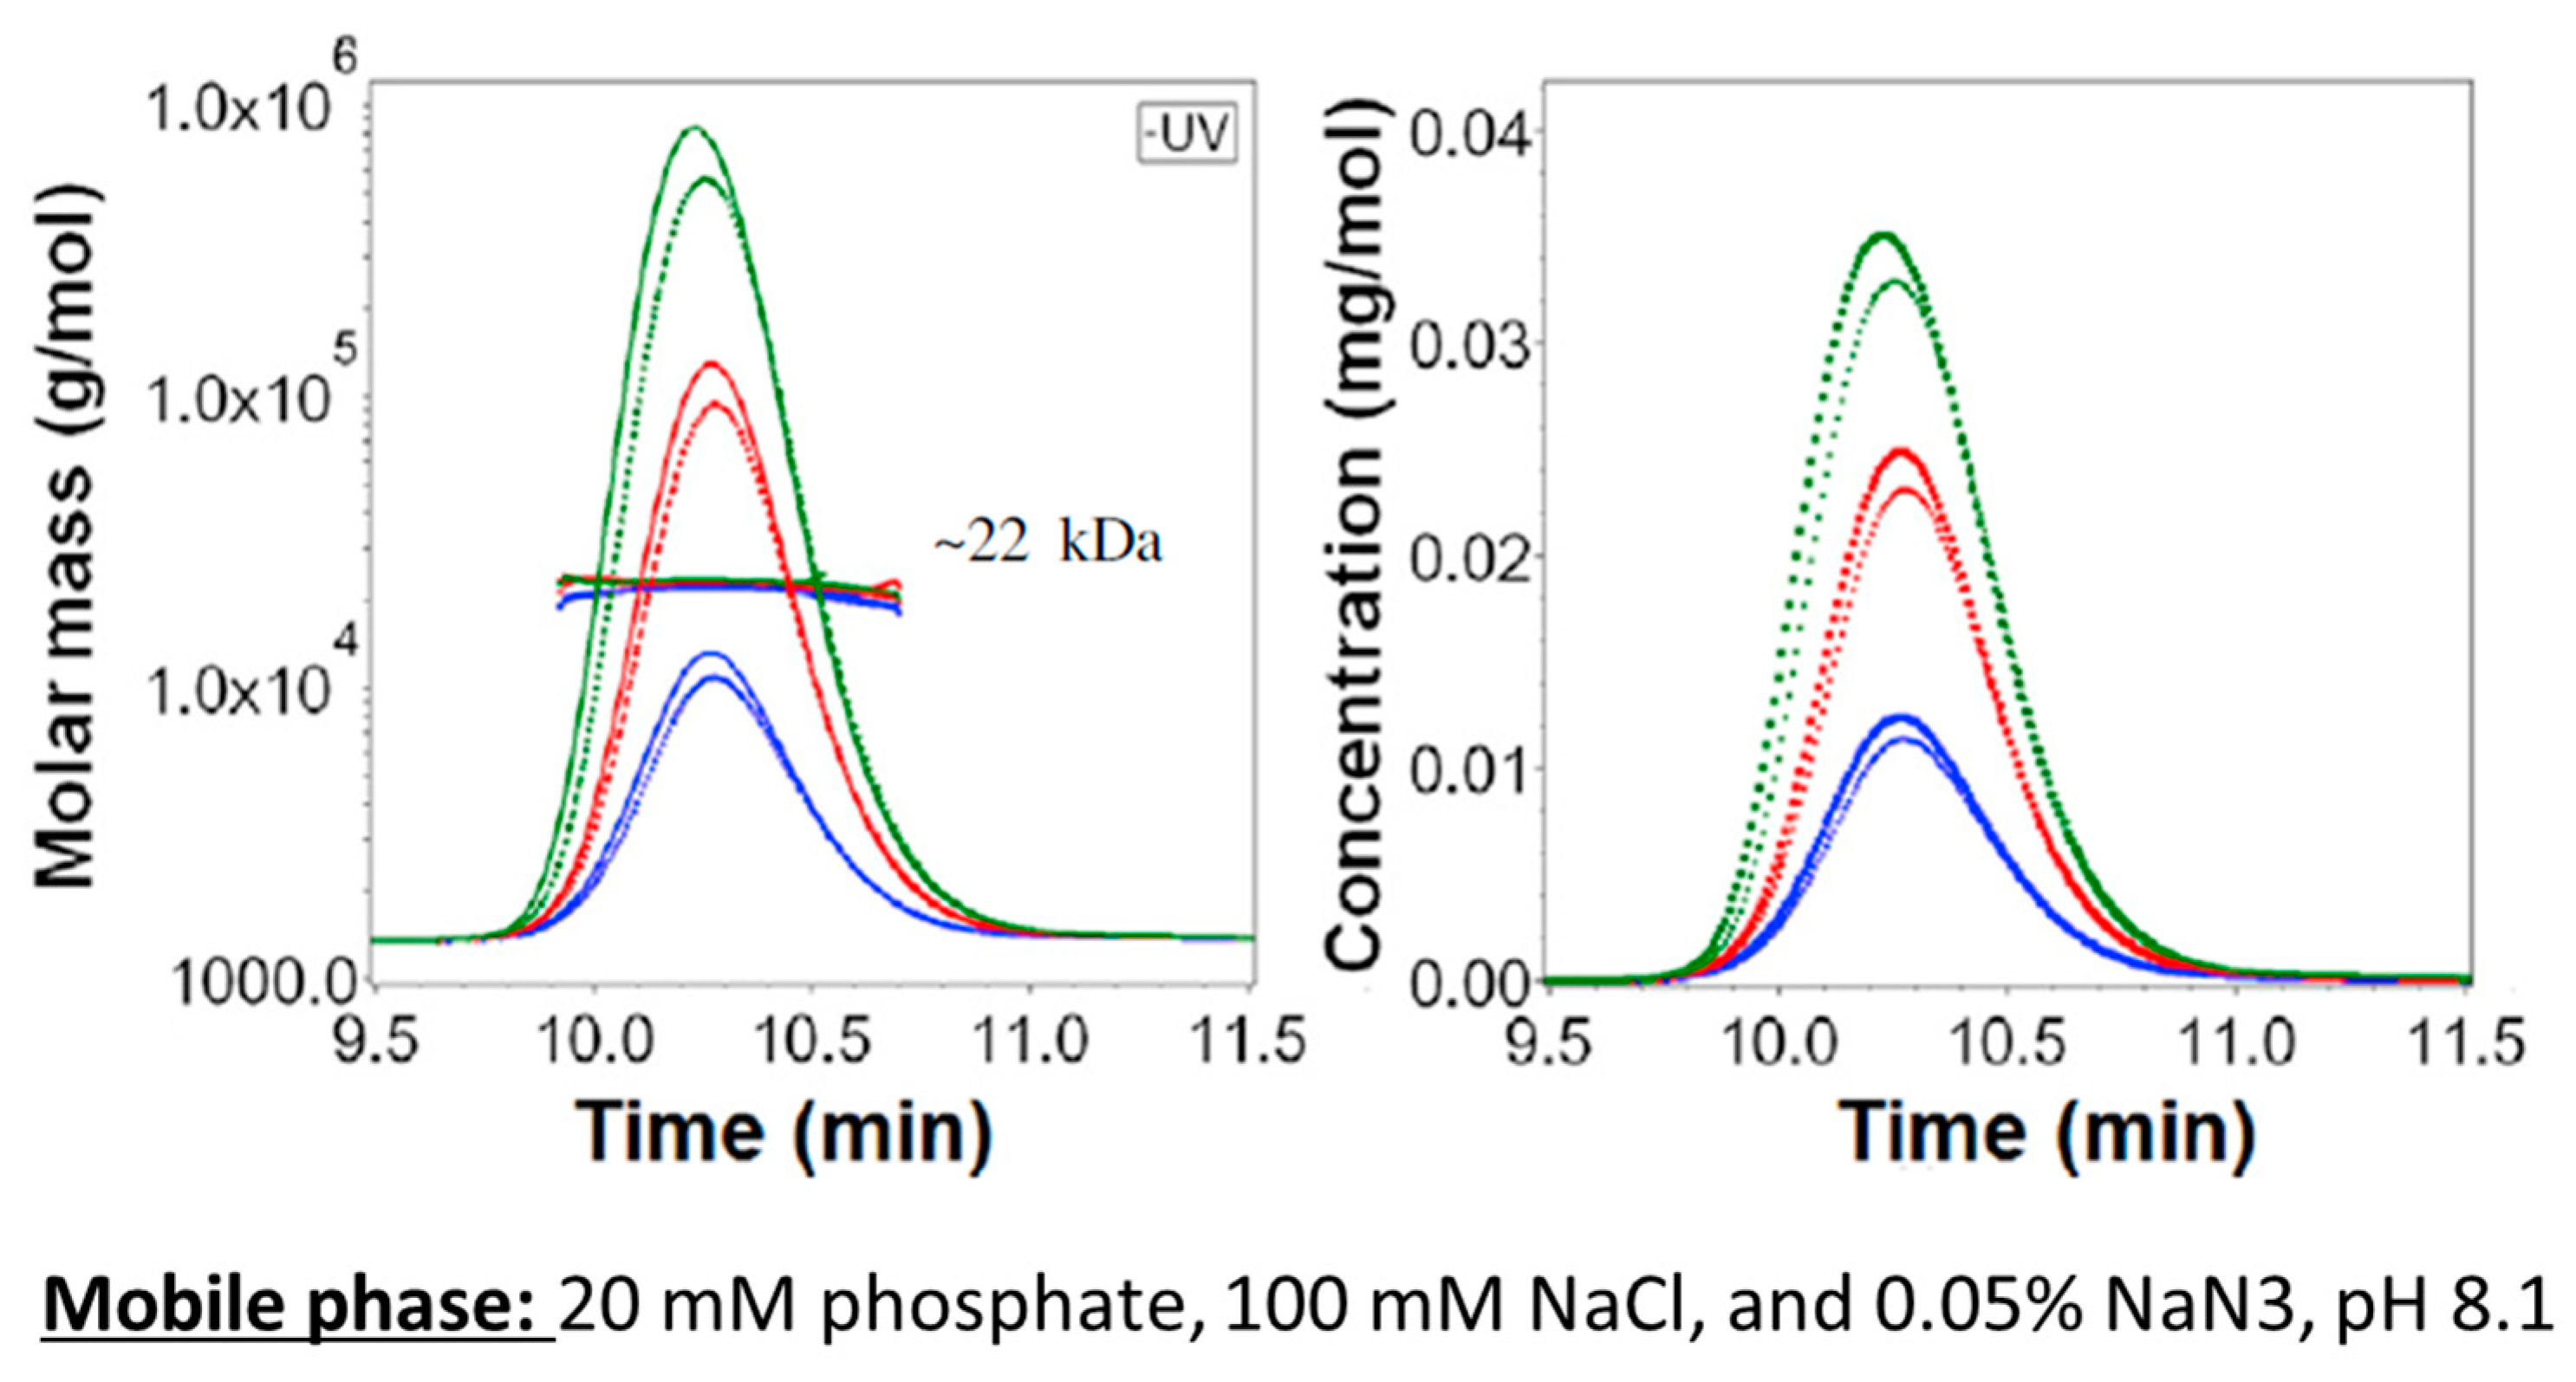
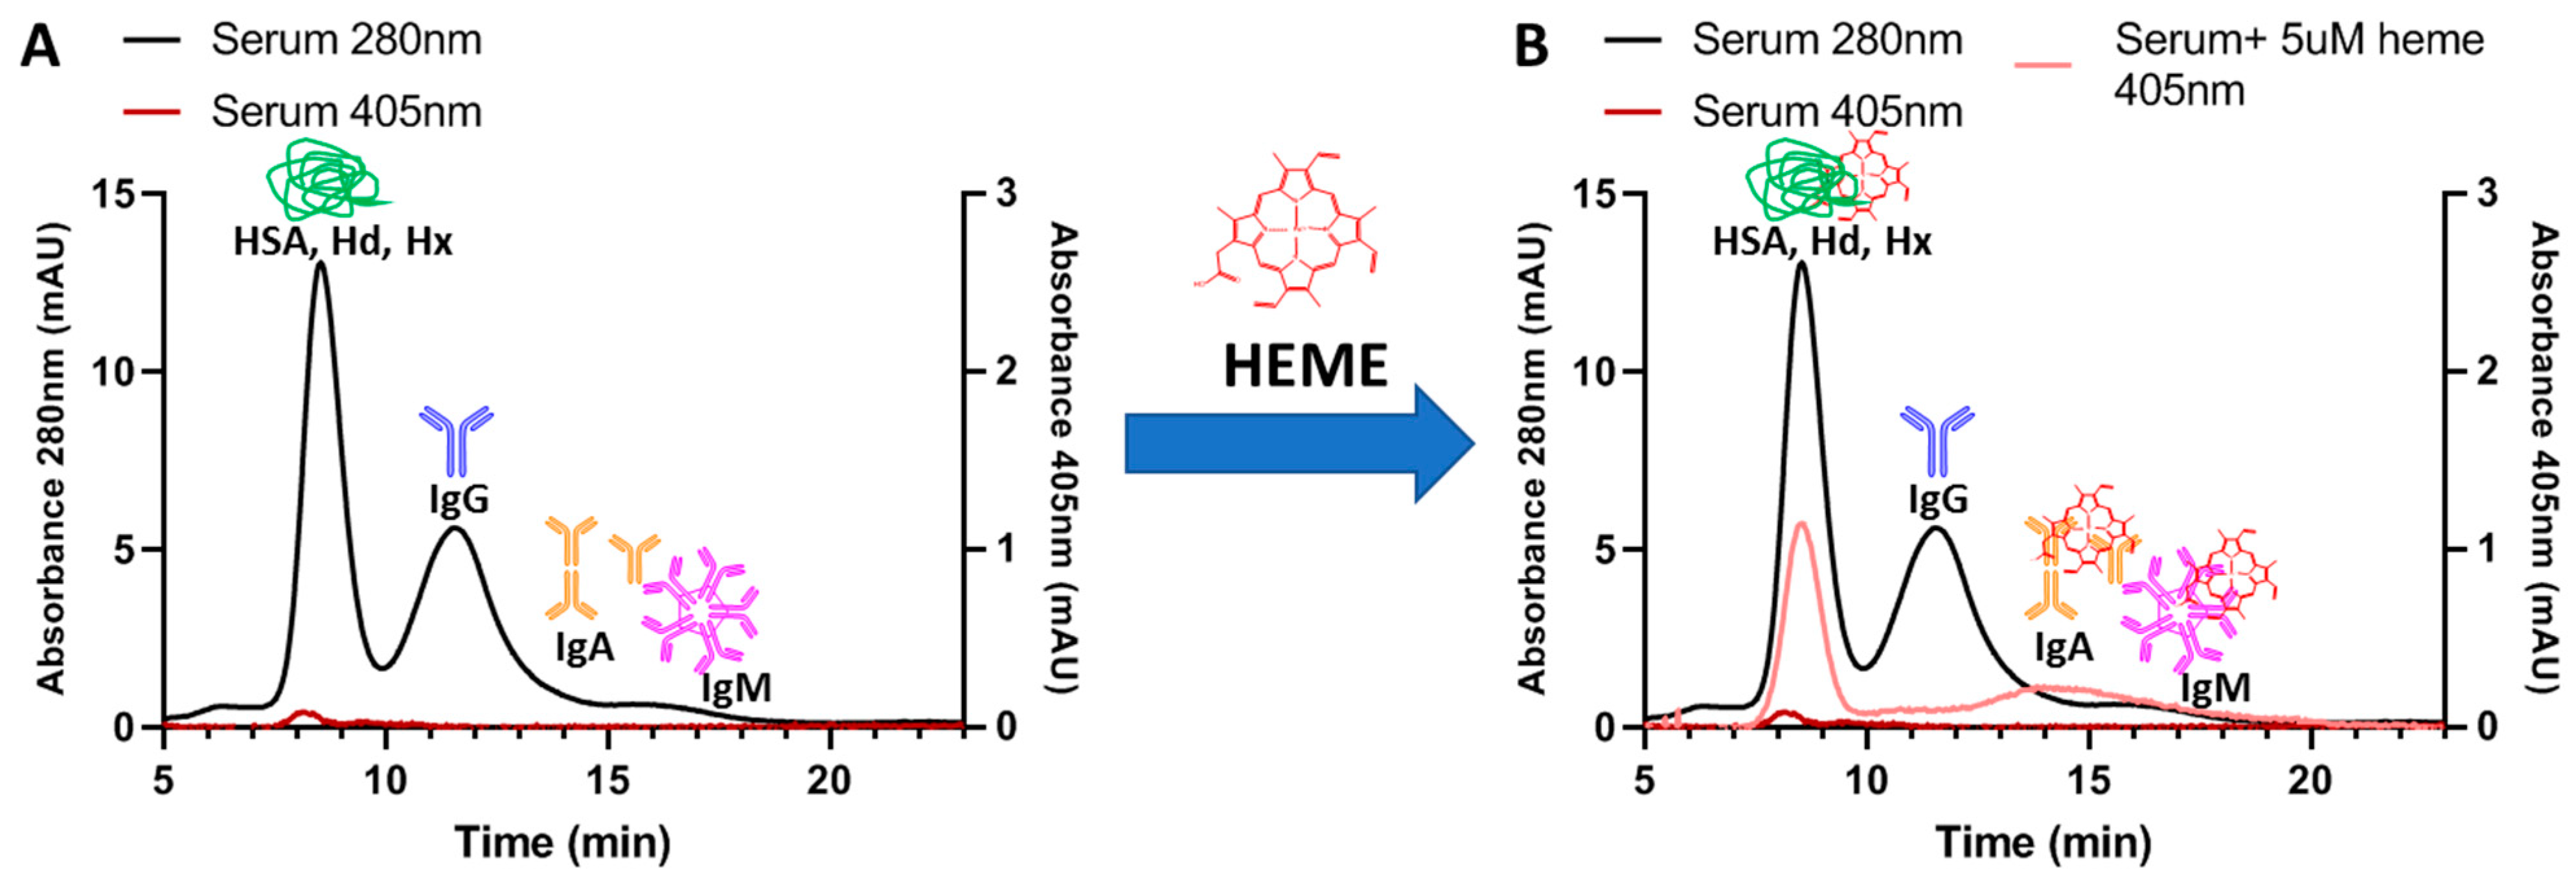
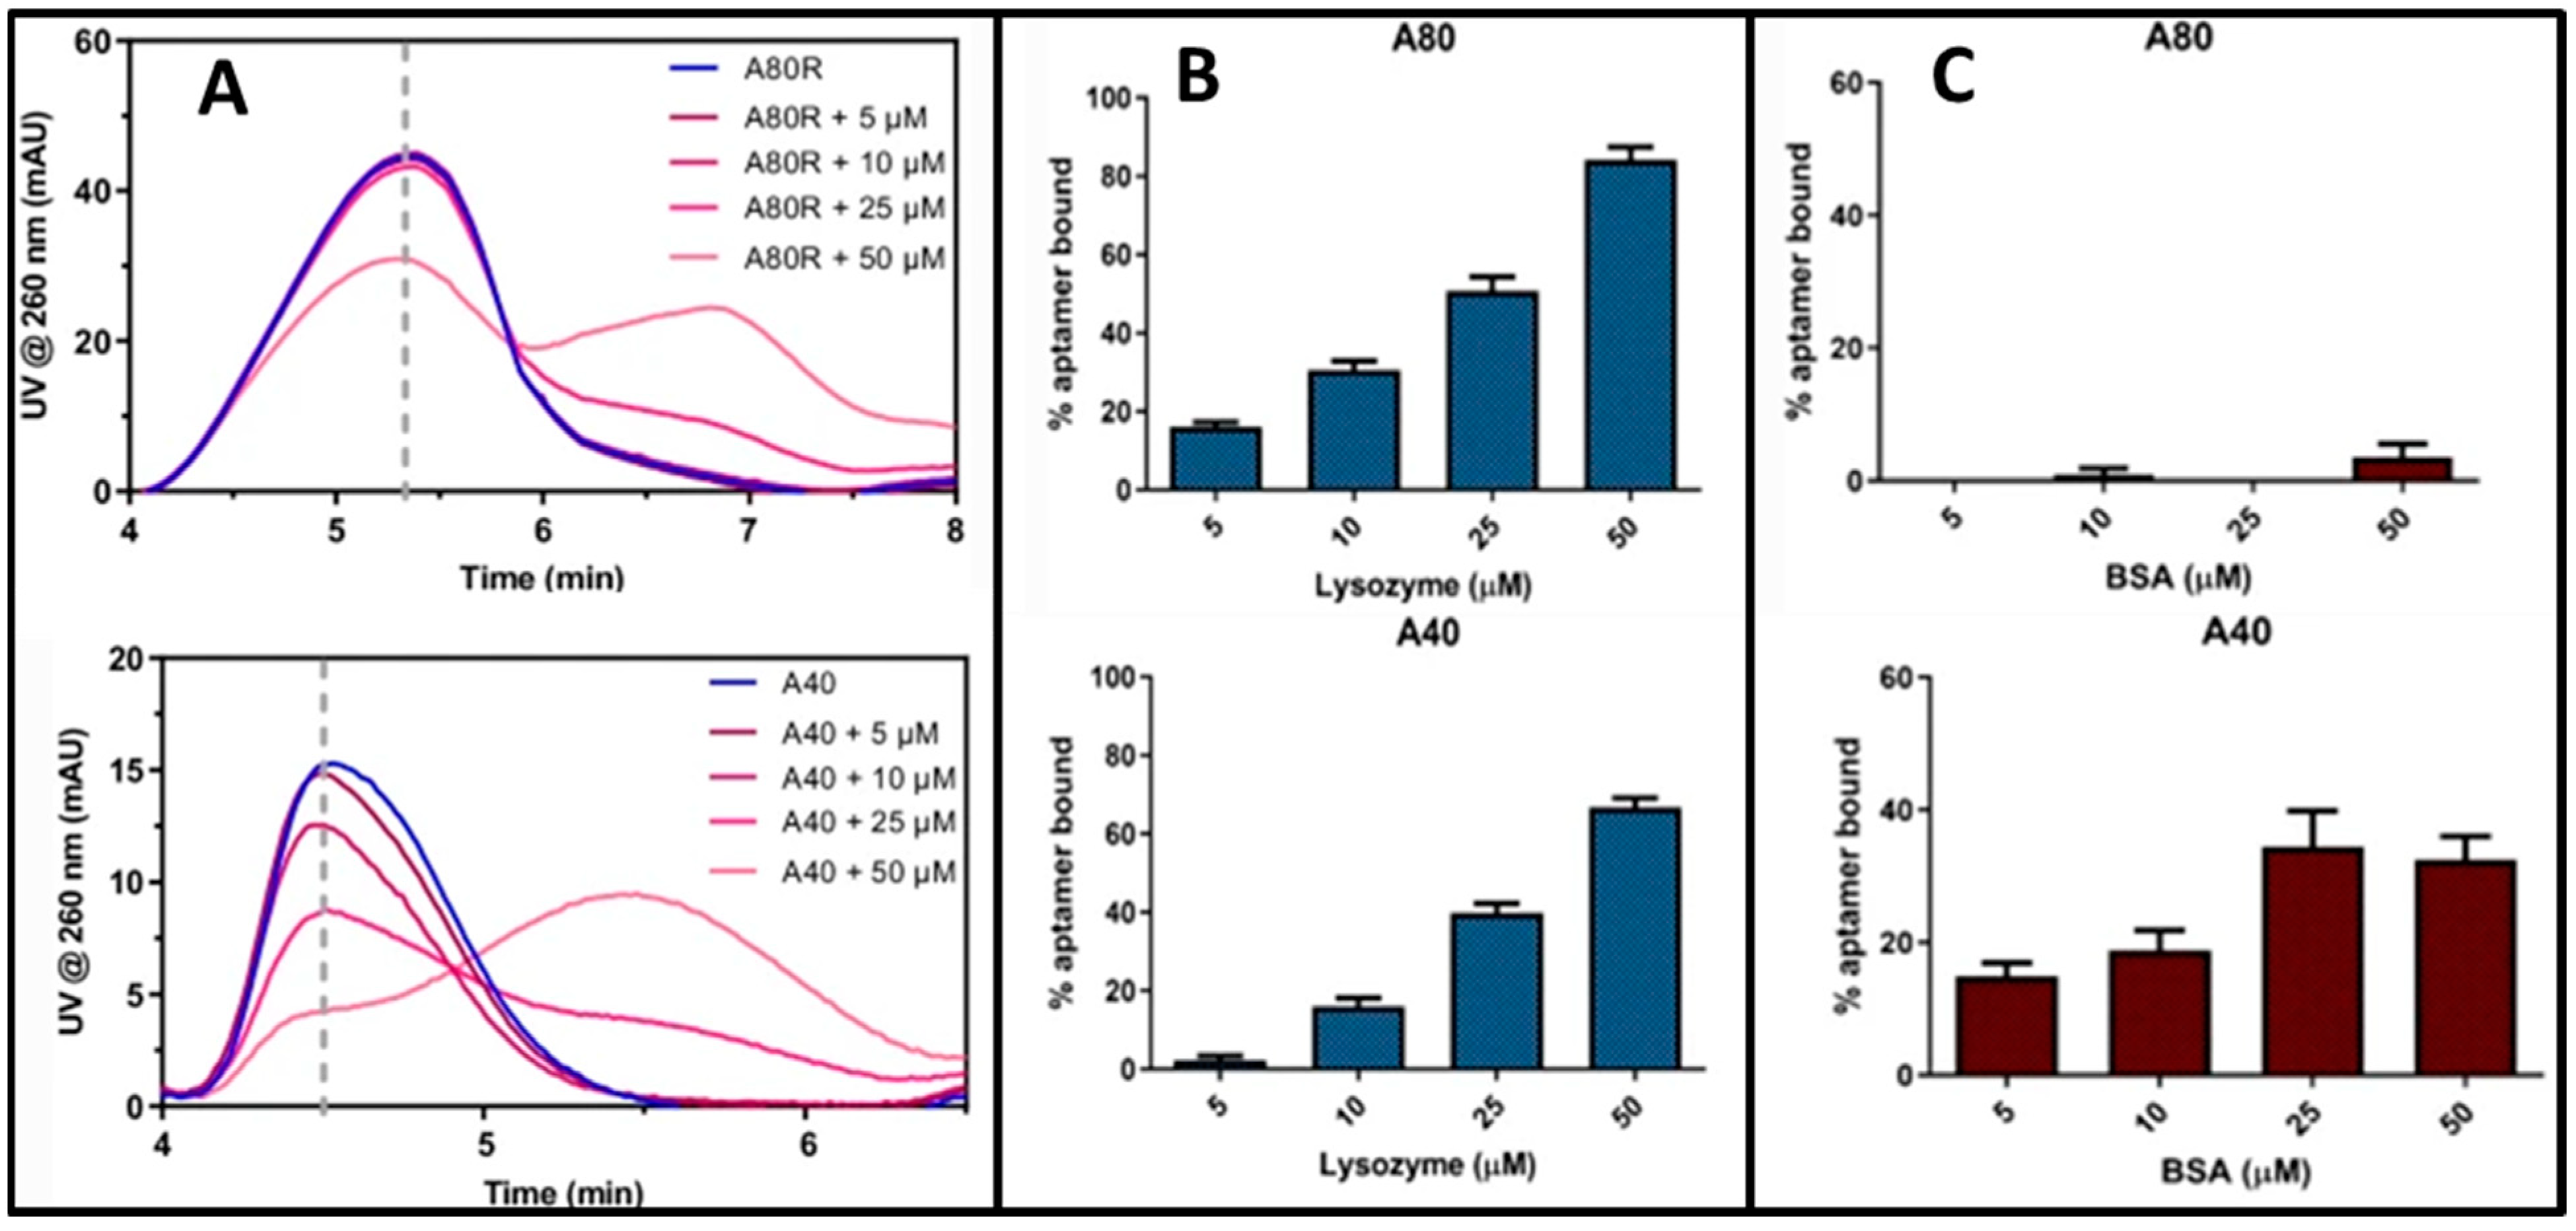
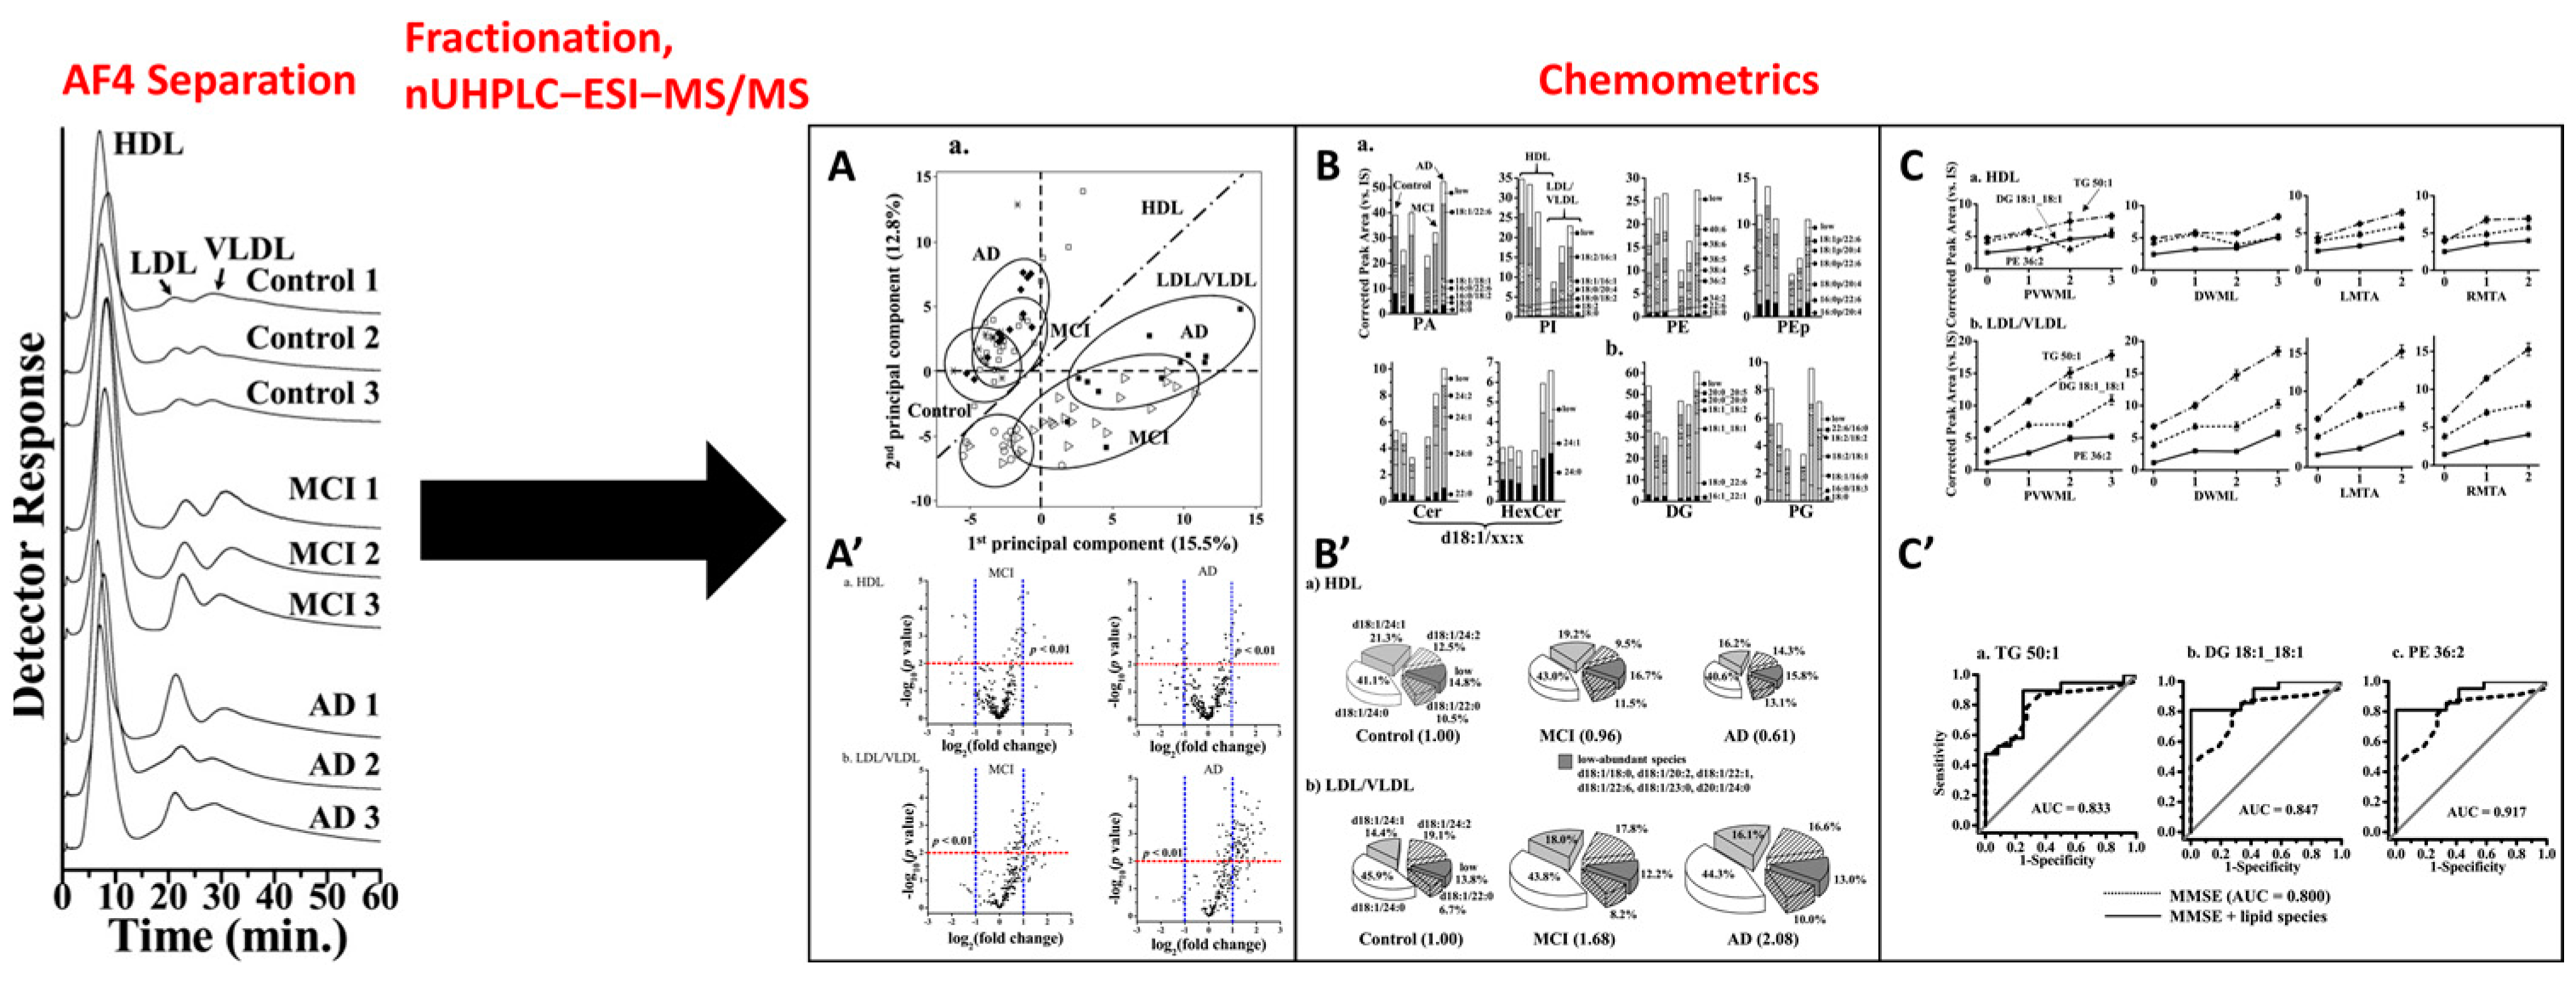

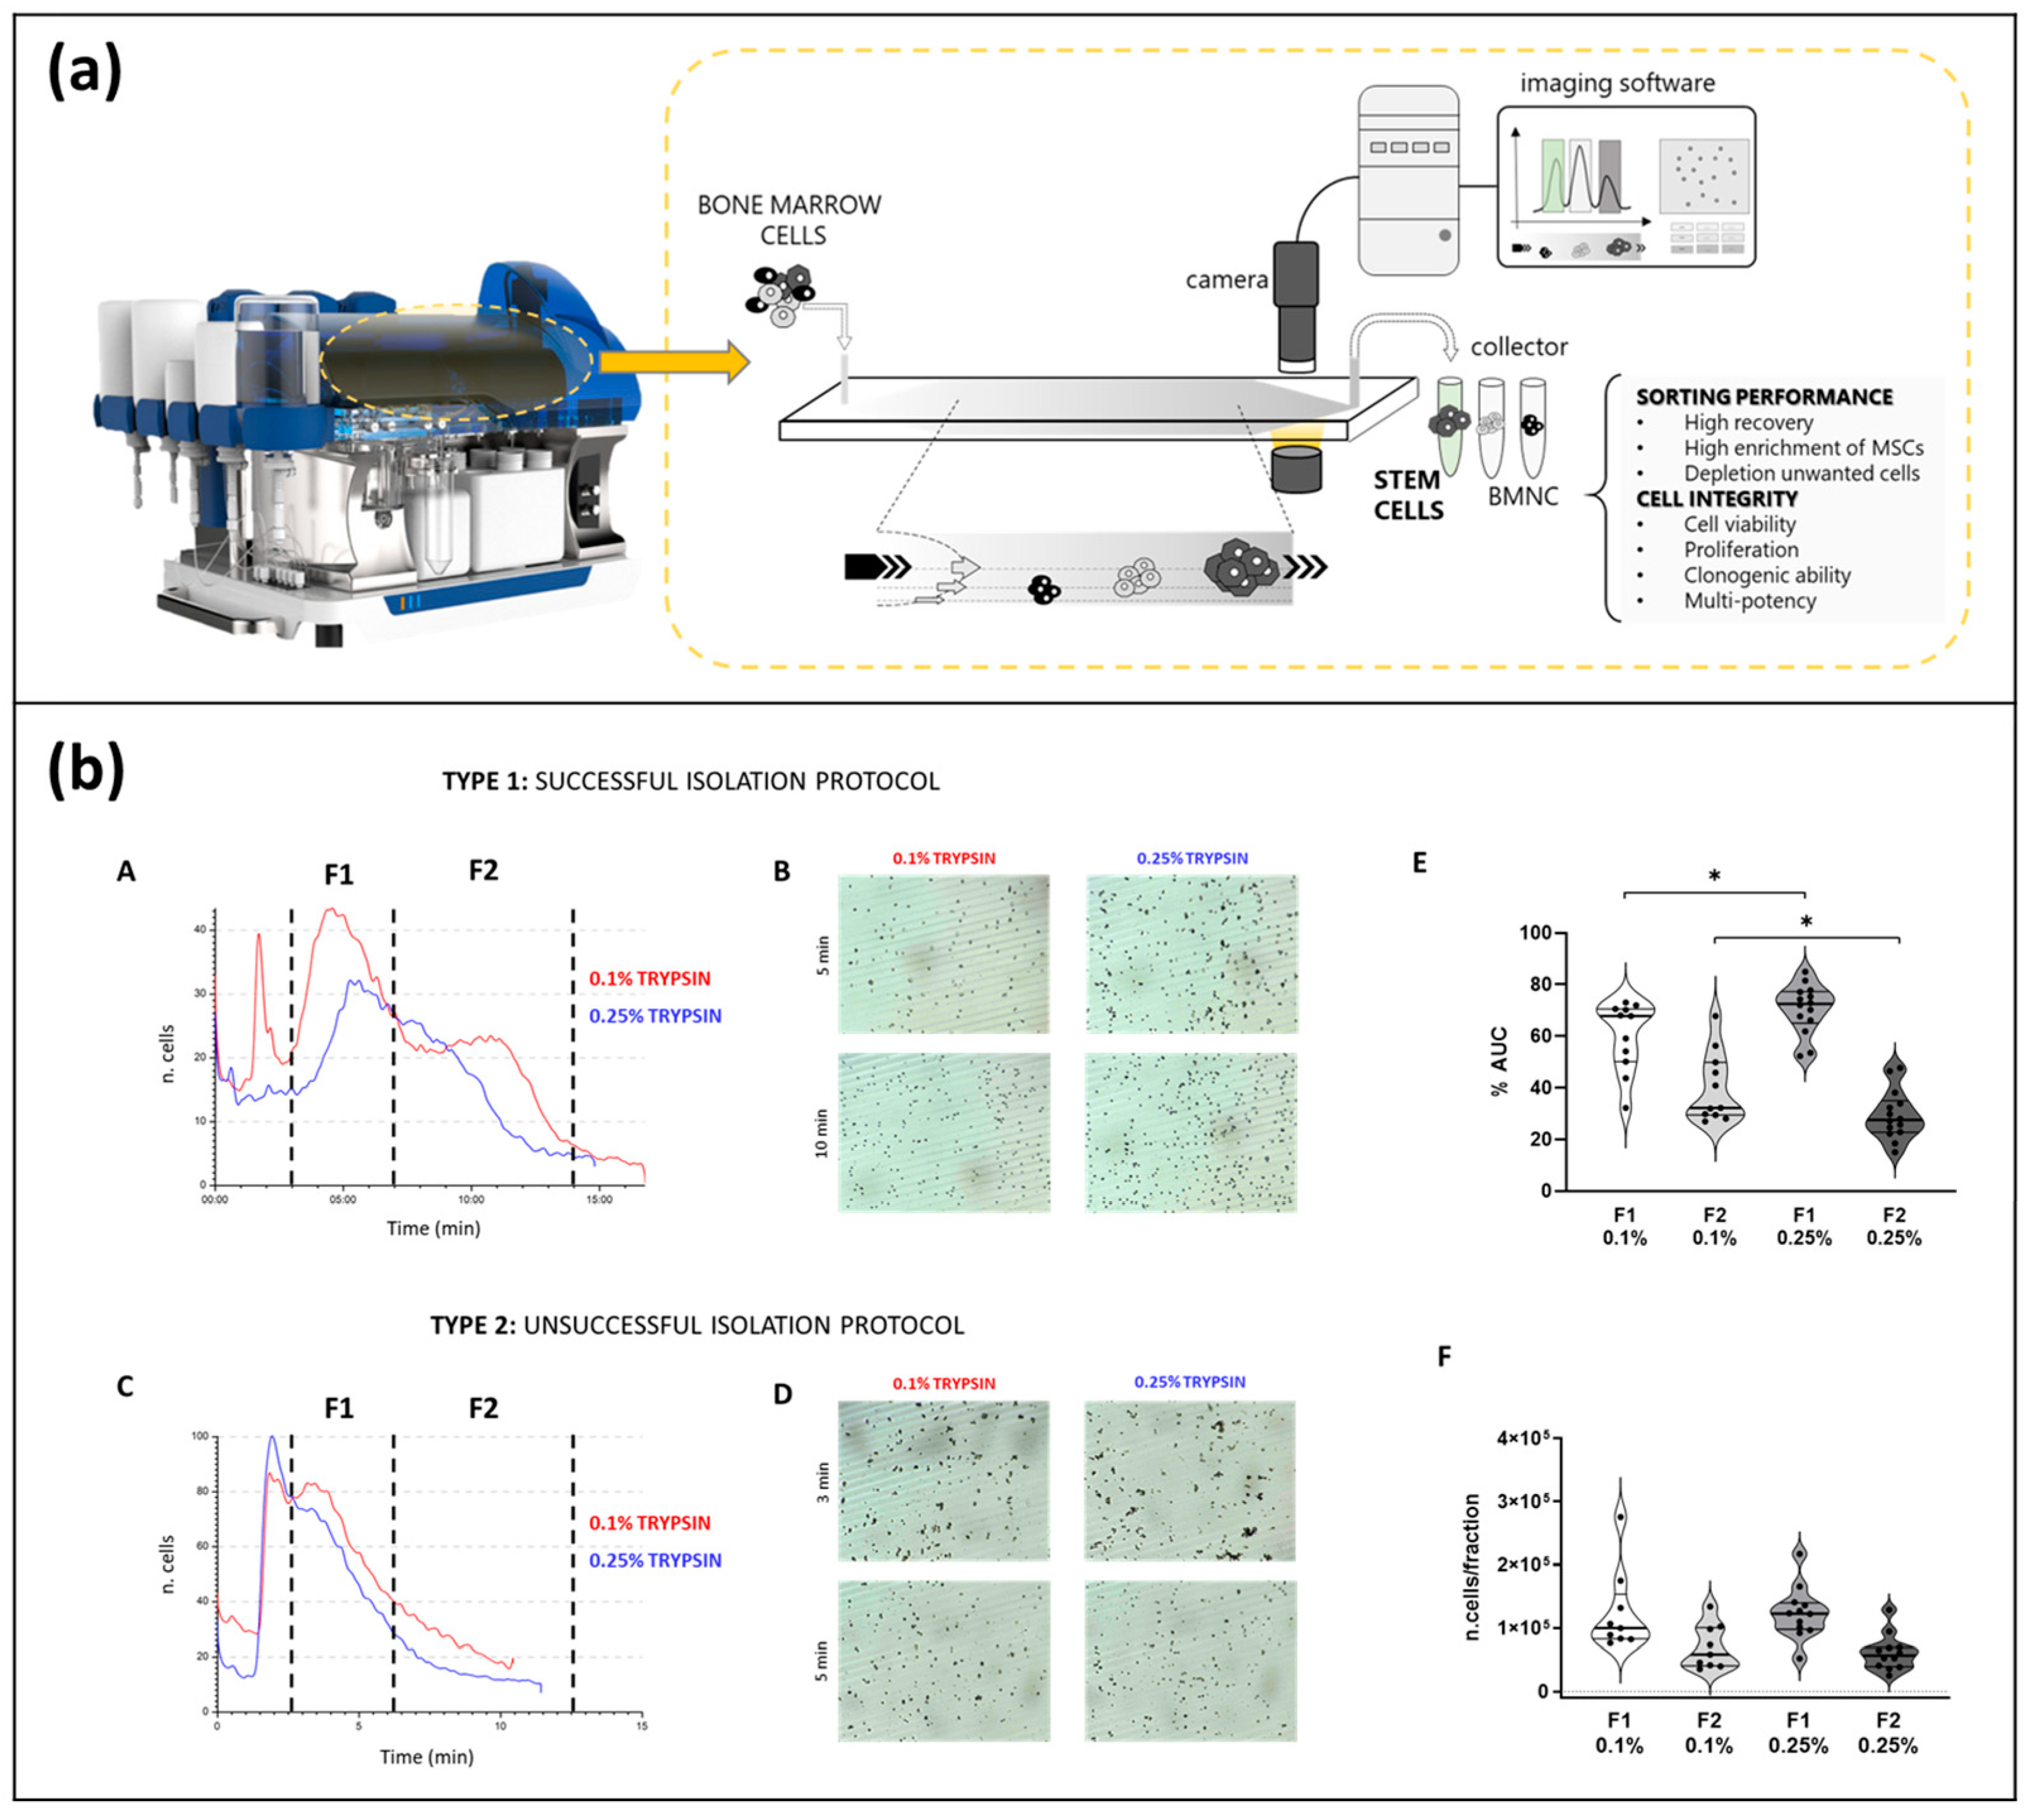
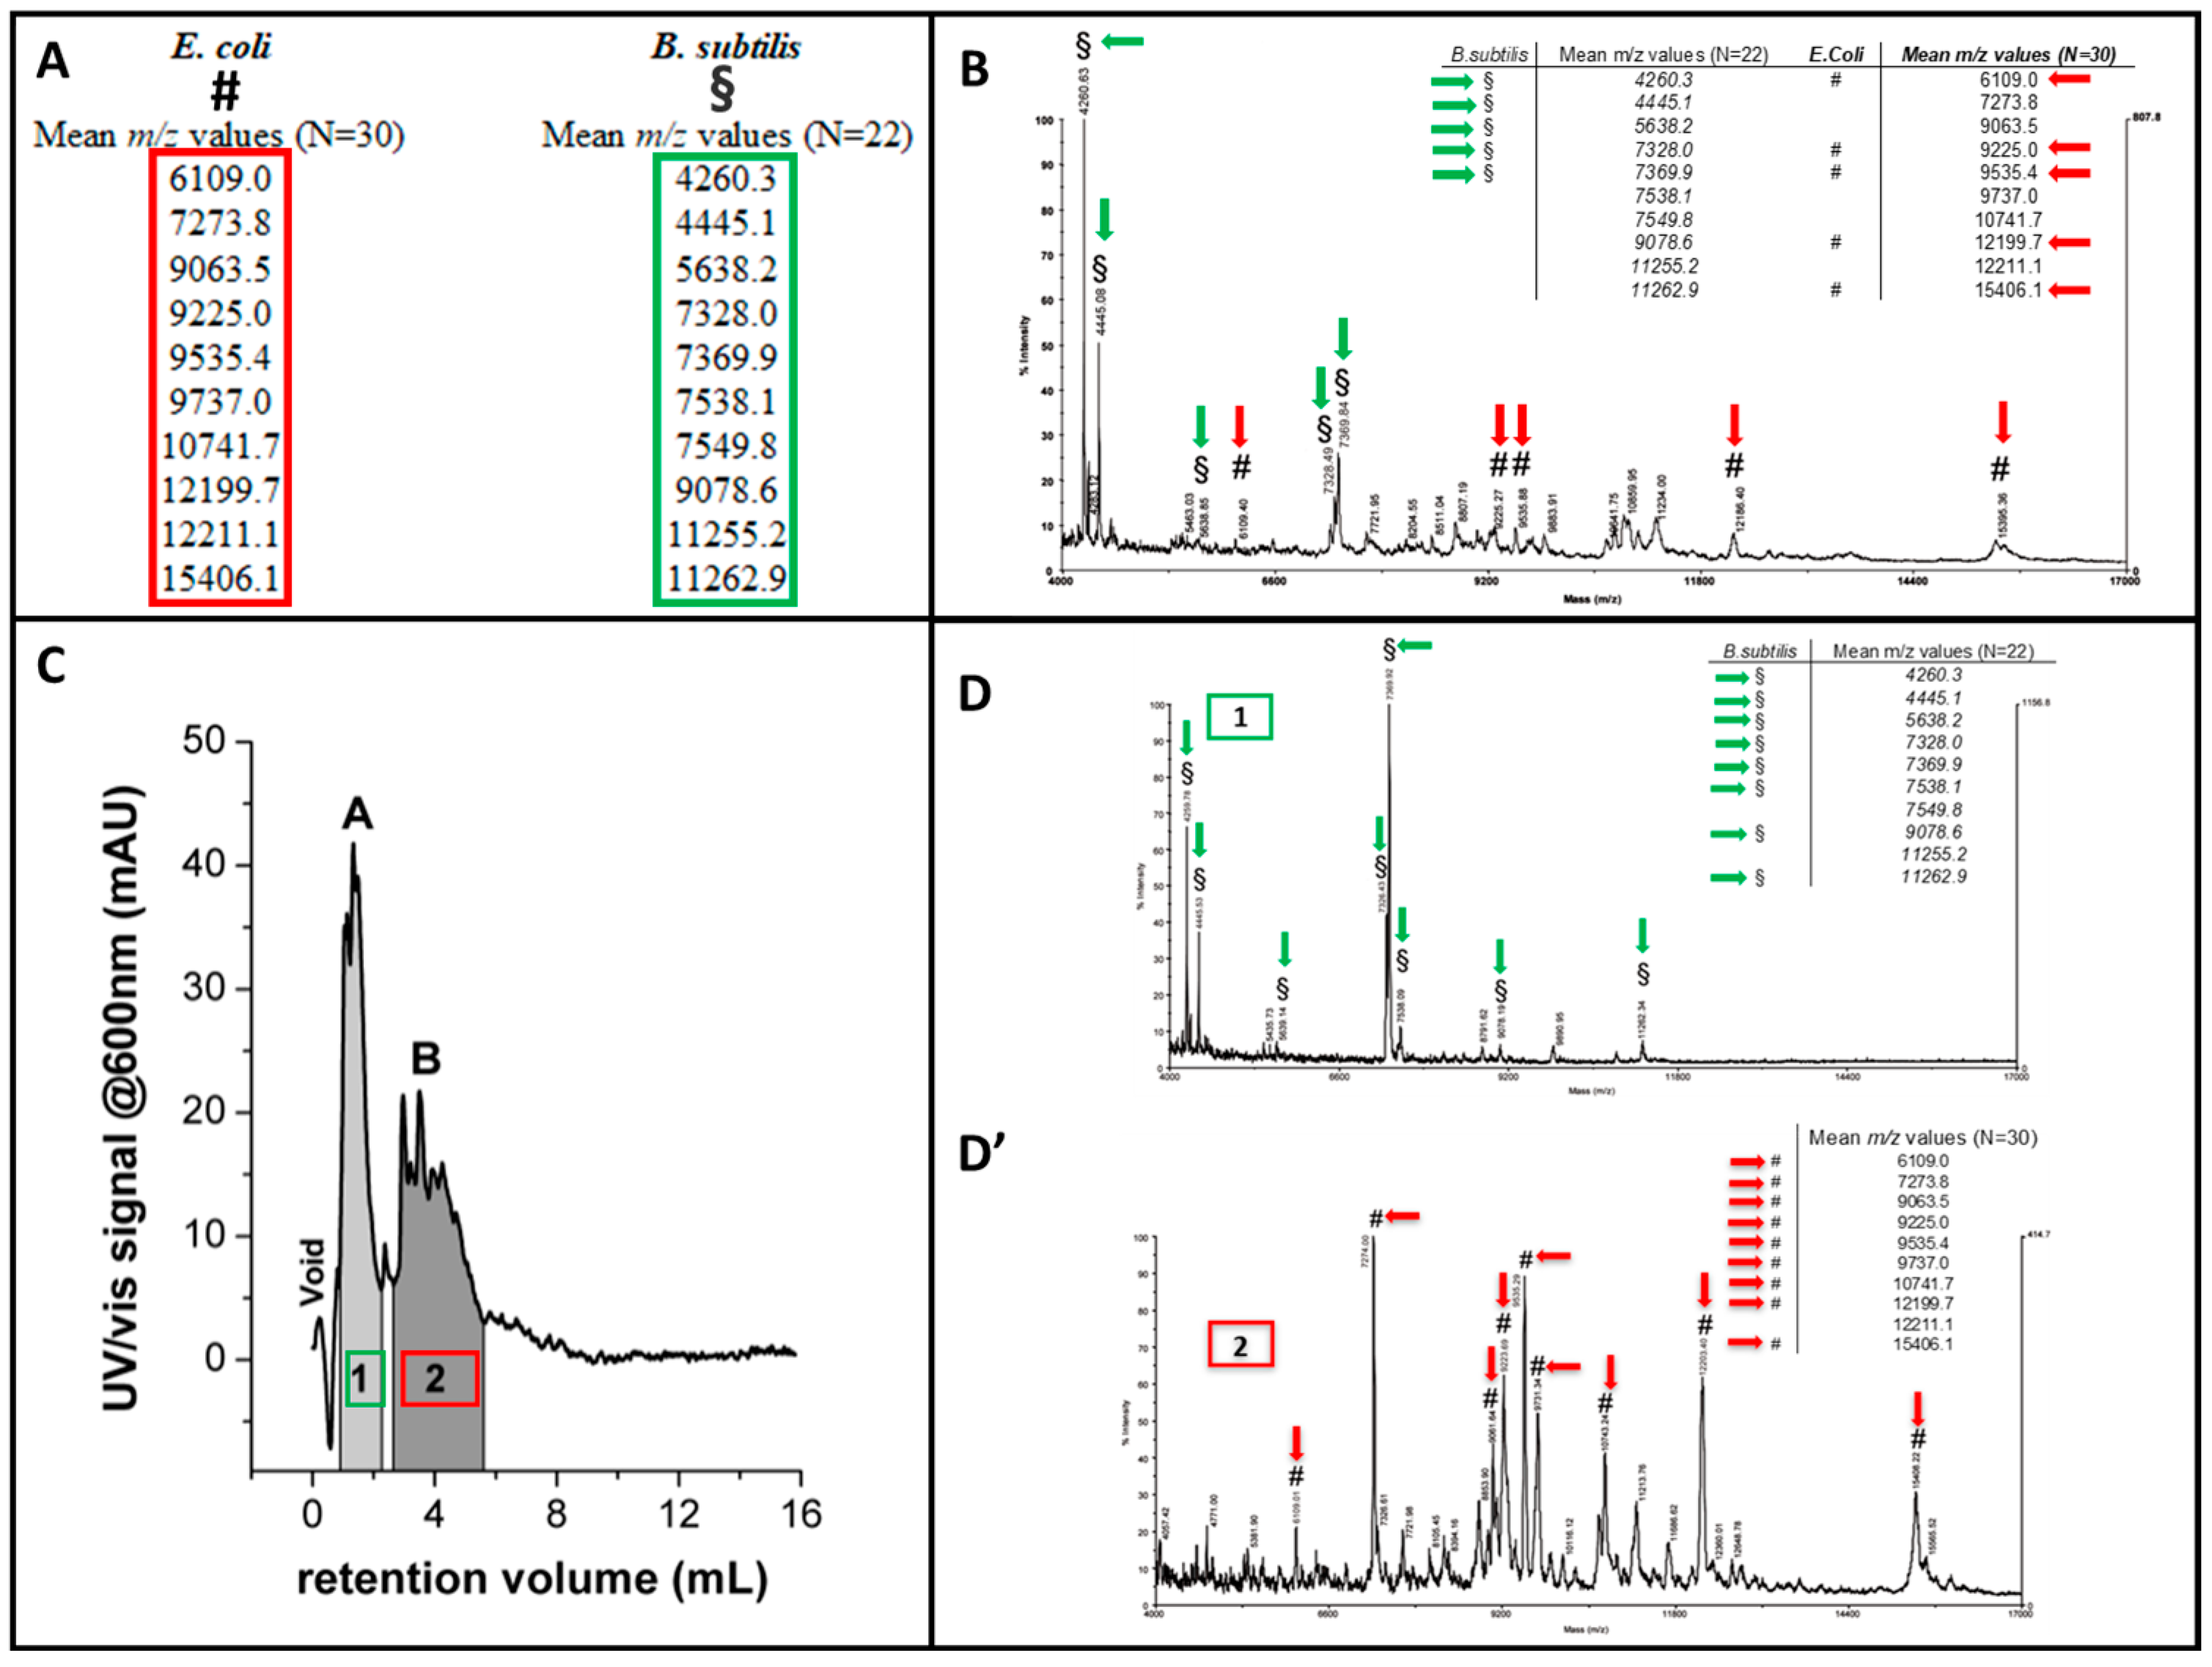
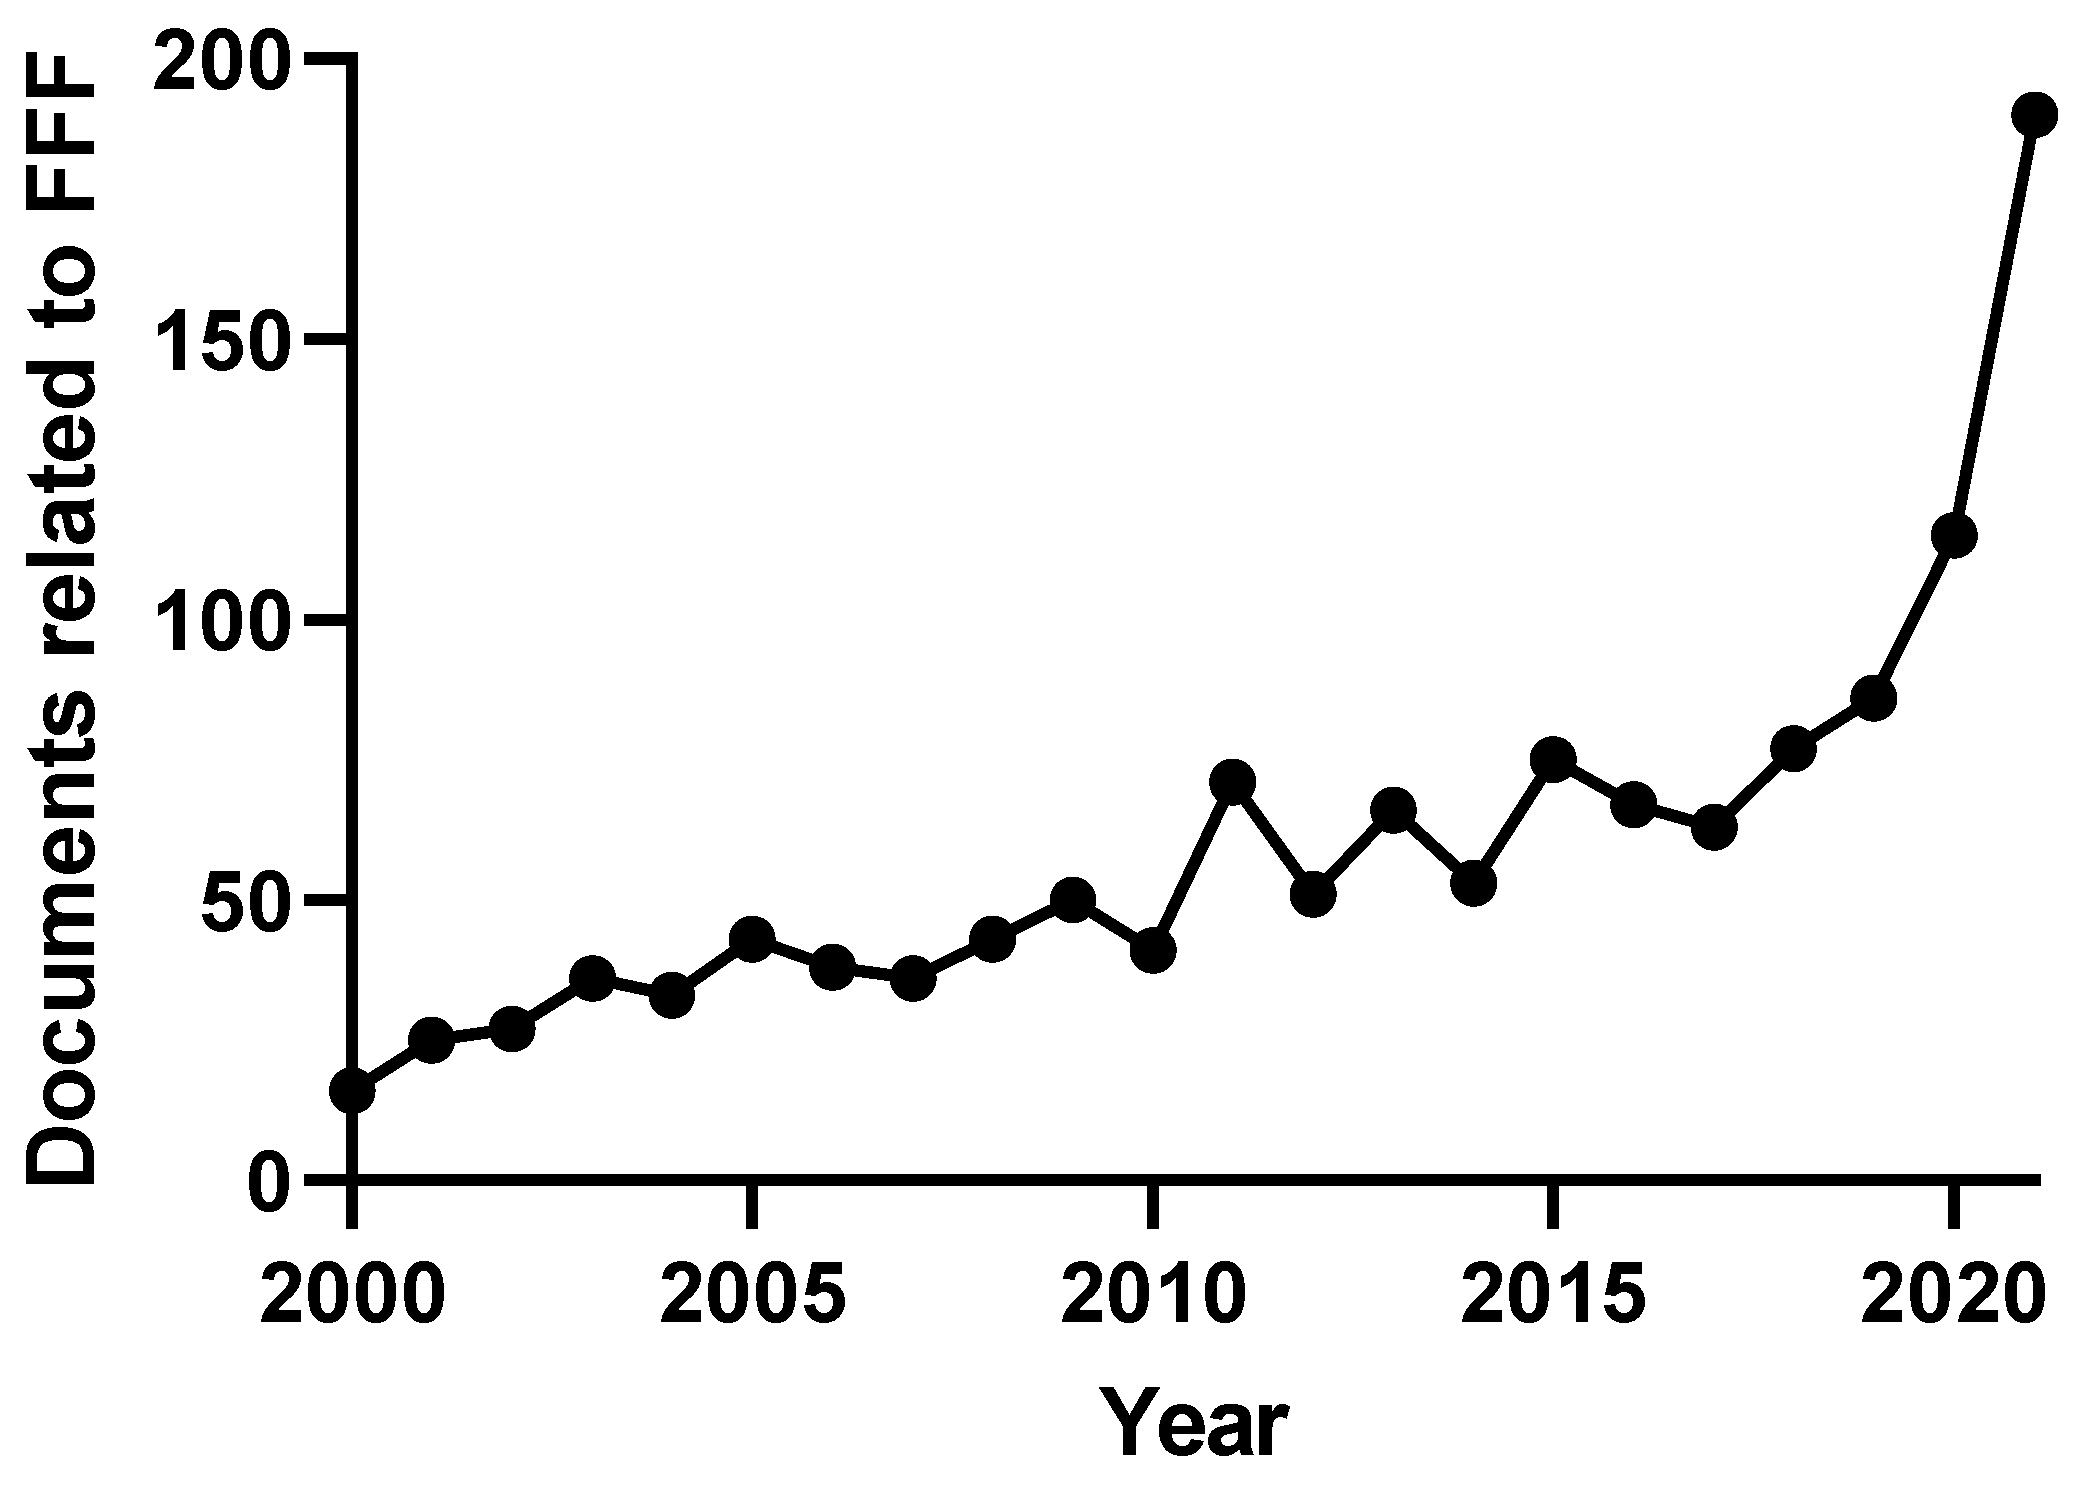
| Rg/Rh | v-Value | Conformation |
|---|---|---|
| <0.7 | Highly expanded macromolecule | |
| 0.775 | 0.33 | Homogeneous-mass sphere |
| 1.0–1.5 | Branched | |
| 1.5–2.1 | 0.5–0.6 | Random coil |
| >2 | 1 | Rod-like, elongated |
| Detector | Features |
|---|---|
| UV-Vis/DAD |
|
| FLD |
|
| dRI |
|
| MALS |
|
| DLS |
|
| ICP-MS |
|
| High-Resolution MS |
|
| Exosome Matrix | FFF Platform | Additional Techniques (Offline) | Results | |
|---|---|---|---|---|
| Exosomes form human neural stem cells. | mFI-AFlFFF-UV (miniaturized frit inlet asymmetrical FlFFF UV-coupled) | TEM; LC-ESI-MS-MS | Exosome subpopulations larger than ∼50 nm were morphologically distinct from those smaller than ∼50 nm. Each exosome fraction showed a different protein pattern. | [179] |
| Non-labeled B16-F10 exosomes from an aggressive mouse melanoma cell culture line. | AF4-UV-MALS | DLS; TEM | Label-free separation of exosomes into subfractions and corresponding size characterization. | [171] |
| Lyophilized exosome standard HBM-BLCL21-30 [55] purified from the culture supernatant of an EBV-transformed. lymphoblastoid B cell line (HansaBioMed, Tallinn, Estonia). | AF4-UV-MALS | DLS; NTA (nanoparticle tracking analysis); TEM | Significant influence of crossflow conditions and channel thickness on fractionation quality. Identification, separation, and size-characterization of two exosomes subpopulations. | [55] |
| Exosomes isolated form the human urine of Pca patients and healthy controls. | AF4-UV | TEM; Western Blotting; UPLC-ESI-MS/MS | Exosome separation and size distribution characterization. The Lipidomic analysis of selected fractions indicated differences in lipidic content and composition between the exosomes of patients and health controls. | [167] |
| B16-F10 melanoma-derived exosomes. | AF4-QUELS-UV | NTA; TEM; Mobius Zetasizer AFM; Blotting and MS Techniques; Odyssey Imaging System | The separation of two discernible exosome subpopulations, Exo-S and Exo-L, and the identification of distinct exomeres, which differ in size and content from other reported particles. Proteins, glycans, lipids, and nucleic acids are selectively packaged in exomeres. | [178] |
| Purified human A375 melanoma exosomes. | Cy-El-FFF-UV-MALS | Mobius Zetasizer | The effect of buffer solution composition and dilution on exosome properties and separation. | [180] |
| Extracellular vesicles from human plasma. | AF4-UV-MALS | Western Blotting; TEM; HPLC-C18; LC-ESI-MS/MS | Human plasma contains more EVs than the paired serum and shows age- and gender-independent individual variability of the amount of EVs in human plasma. Most of the proteins identified in the EVs from human plasma were involved in extracellular matrix structural constituents and associated with the ECM–receptor interaction pathway. | [181] |
| Exosomes isolated from human serum samples. | AF4-UV-MALS | DLS; Western Blotting; nUHPLC-ESI-MS/M | The evaluation of the ability of ultrafiltration and ultracentrifugation in exosome isolation from serum. A simple centrifugation followed by UF offered advantages, such as faster preparation and higher exosomal recovery, with smaller sample volumes than the UC method. However, the removal of lipoproteins seemed more efficient with UC than UF. | [177] |
| Samples obtained from the ultracentrifugation of the culture medium of murine myoblasts (C2C12). | HF5-UV-FLD-MALS | NTA; TEM; Western Blotting | The overall characterization of small and large EVs in all the fractions obtained through ultracentrifugation. The identification of an otherwise-hidden rod-shaped species carrying nucleic content, was found predominantly in the densest SEV fractions, which could potentially correspond to exomeres. | [40] |
| Fractions of exosomes and microvesicles were isolated from the culture media of DU145 cells using a series of centrifugation methods, including UC. | AF4-UV-MALS | nUHPLC-ESI-MS/MS; TEM; Western Blotting | Both UC and UF methods can be utilized for the initial isolation of EVs from cell culture media prior to the FlFFF separation of exosomes and microvesicles; however, UF was found to be more efficient than UC. The hyphenation of FlFFF with ESI-MS/MS allowed for the selective detection of lipid targets and specific biomarkers. | [182] |
Disclaimer/Publisher’s Note: The statements, opinions and data contained in all publications are solely those of the individual author(s) and contributor(s) and not of MDPI and/or the editor(s). MDPI and/or the editor(s) disclaim responsibility for any injury to people or property resulting from any ideas, methods, instructions or products referred to in the content. |
© 2023 by the authors. Licensee MDPI, Basel, Switzerland. This article is an open access article distributed under the terms and conditions of the Creative Commons Attribution (CC BY) license (https://creativecommons.org/licenses/by/4.0/).
Share and Cite
Giordani, S.; Marassi, V.; Placci, A.; Zattoni, A.; Roda, B.; Reschiglian, P. Field-Flow Fractionation in Molecular Biology and Biotechnology. Molecules 2023, 28, 6201. https://doi.org/10.3390/molecules28176201
Giordani S, Marassi V, Placci A, Zattoni A, Roda B, Reschiglian P. Field-Flow Fractionation in Molecular Biology and Biotechnology. Molecules. 2023; 28(17):6201. https://doi.org/10.3390/molecules28176201
Chicago/Turabian StyleGiordani, Stefano, Valentina Marassi, Anna Placci, Andrea Zattoni, Barbara Roda, and Pierluigi Reschiglian. 2023. "Field-Flow Fractionation in Molecular Biology and Biotechnology" Molecules 28, no. 17: 6201. https://doi.org/10.3390/molecules28176201
APA StyleGiordani, S., Marassi, V., Placci, A., Zattoni, A., Roda, B., & Reschiglian, P. (2023). Field-Flow Fractionation in Molecular Biology and Biotechnology. Molecules, 28(17), 6201. https://doi.org/10.3390/molecules28176201