Abstract
This study optimized the exopolysaccharides (EPS) production for Lactiplantibacillus plantarum MC5 (Lp. plantarum MC5) and evaluated the resistance to human simulated digestive juices, antioxidant activity in vitro, and rheological properties of EPS-MC5. The results showed that maximum EPS production of 345.98 mg/L (about 1.5-old greater than the initial production) was obtained at optimal conditions of inoculum size (4.0%), incubation time (30 h), incubation temperature (34.0 °C), and initial pH value (6.40). Furthermore, the resisting-digestion capacity of EPS-MC5 after 180 min in α-amylase, simulated gastric juice (pH 2.0, 3.0, 4.0), and simulated intestinal juice (pH 6.8) was 98.59%, 98.62%, 98.78%, 98.86%, and 98.74%, respectively. In addition, the radical scavenging rates of DPPH•, ABTS•, •OH, and ferric-iron reducing power (OD700) of EPS-MC5 were 73.33%, 87.74%, 46.07%, and 1.20, respectively. Furthermore, rheological results showed that the EPS-MC5 had a higher apparent viscosity (3.01 Pa) and shear stress (41.78 Pa), and the viscoelastic modulus (84.02 and 161.02 Pa at the shear frequency of 100 Hz). These results provide a new insight into the application of EPS in human health and functional foods, which could also improve theoretical guidance for the industrial application of EPS.
1. Introduction
Microorganisms producing bioactive exopolysaccharides (EPS) include archaea, bacteria, and fungi [1]. Lactic acid bacteria (LAB) are well-known EPS-producing bacteria, and their final metabolites are generally recognized as safe (GRAS). They can be applied to different industries, especially the food industry [2] and pharmaceutical industry [3]. As a starter, probiotics are reported to play an important role in the rheology and texture of fermented foods [4]. The widespread use of LAB in baked foods has been reported to improve texture properties, increase flavor and produce lactic acid [5]. EPS also plays an important role in protecting inter-and intra-microbial interactions, serving as a source of nutrients in times of hunger and resistance to virulence when pathogens attack [6]. More than 30 species of LAB have been reported to produce EPS [7], such as Lactobacillus plantarum [2], Lactobacillus rhamnosus [8], Streptococcus thermophilus [9], and so on. Reactive oxygen species (ROS) are used in immune mechanisms to prevent bacterial and viral infections [10]. However, excess ROS can oxidize important biological components such as DNA, lipids, and proteins. This oxidative damage is closely associated with accelerated aging and the development of various diseases, including cancer [11], diabetes [12], and hypertension [13]. Notably, the antioxidant is one of the important prebiotic effects of LAB. The cell surface itself contains antioxidants, and cells also produce antioxidants such as EPS, peptides, and lactic acid [14].
A previous study reported that EPS production and concentration can be affected by medium components (carbon and nitrogen sources) and culture conditions [15]. EPS from LAB can protect cells from desiccation [9], metal ions, antibiotics, bacteriophages, and cell wall-degrading enzymes [16]. Degeest et al. [17] reported that the EPS production and their monomer composition may be affected by the growth medium and culture conditions of laboratory-screened LAB. Likewise, EPS production varies widely (40–1000 mg/L) between strains [7]. Previous literature reported that some EPS-producing Lp. plantarum strains isolated from traditional fermented foods possess many functional properties, especially antioxidant activity [18]. Lp. plantarum is one of the probiotics that can be used in the food list. Its EPS has good biological activity and industrial application characteristics, but it faces the problem of low yield and instability, which limits its promotion and application. Lp. plantarum isolated from traditional fermented dairy products is rare, while Enterococcus faecalis is the main strain isolated from traditional fermented dairy products. To improve the commercial-scale production of EPS, response surface methodology was used to model and optimize the fermentation substrate and culture conditions for EPS production [2]. Therefore, it is particularly necessary to strengthen the screening of new strains or optimize EPS production conditions to improve the EPS production of Lp. plantarum, which is of great significance for the commercial development of EPS. In addition, although the research on the antioxidant activity of EPS produced by Lp. plantarum had some free radical models, they are not systematic and comprehensive.
Lp. plantarum MC5 was isolated from traditional fermented yak milk in the Gansu Tibetan area, which was identified as Lactobacillus plantarum by 16S rRNA sequencing and whole genome sequencing technology. Lp. plantarum MC5 had better EPS-producing and fermentation capacity [19]. In this study, EPS culture conditions were optimized using response surface methodology (RSM) to increase EPS yield. EPS was prepared and purified under optimum conditions. The probiotic properties of the EPS were further investigated, including anti-α-amylase activity, simulated gastrointestinal fluid tolerance, and antioxidant activities (radical scavenging activity of DPPH•, ABTS•, •OH, and iron-reducing power). In addition, the rheological properties of the EPS were also investigated.
2. Results and Discussion
2.1. Identification of Strain MC5 and Culture Conditions Single Factor Test
Based on the 16S rRNA sequence, the phylogenetic tree showed the strain MC5 was more similar to Lp. plantarum CIP 103151 and Lp. plantarum JCM 1149 than other species, so the MC5 was identified as Lp. plantarum. (Figure 1). On an industrial scale, the use of microorganisms was beneficial because they can be cultured under controlled conditions and produce large amounts of EPS in a short time [20]. Therefore, culture conditions are important to increase EPS yield and productivity [21]. To improve the EPS production of Lp. plantarum MC5, the optimal culture conditions of this strain were studied in this paper (Figure 2).
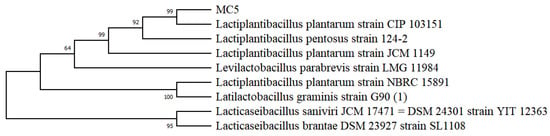
Figure 1.
Phylogenetic tree of strain MC5.
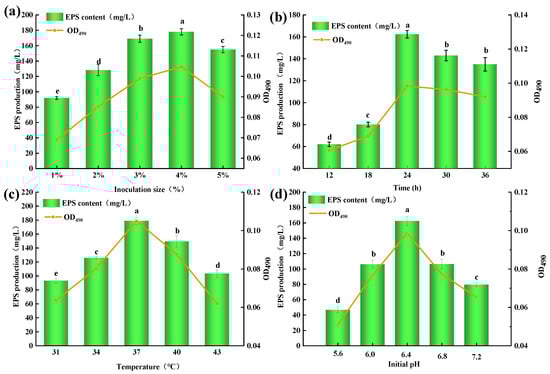
Figure 2.
Effect of culture conditions on the EPS production from Lp. plantarum MC5. (a): Effect of inoculation size on the EPS production from Lp. plantarum MC5; (b): Effect of culture time on the EPS production from Lp. plantarum MC5; (c): Effect of culture temperature on the EPS production from Lp. plantarum MC5; (d): Effect of initial pH on the EPS production from Lp. plantarum MC5. Error bars are represented the standard errors (se) of the mean value (n = 3). “a, b, c, d, e” indicate significant differences (p < 0.05).
The results of inoculation size showed that the EPS-MC5 content increased from 91.98 to 175.45 mg/L at 1–5% (p < 0.05, Figure 2a). The maximum EPS content was 175.45 mg/L at 4% inoculation size. Jiang et al. [22] reported that appropriate inoculation size was the prerequisite for high EPS production of microorganisms. The results of fermentation time showed that the EPS content first increased (12–24 h) and then decreased (24–36 h). (Figure 2b). When the fermentation time was 24 h, the maximum EPS yield (164.65 mg/L) was obtained. At this time (24 h), the Lp. plantarum MC5 reached a stable stage, so the EPS content produced by metabolism was the largest. After 24 h, the EPS content decreased because the large number of metabolites accumulated in the fermentation broth inhibited the growth and reproduction of the strain.
Fermentation temperature results showed that the EPS production increased significantly at the temperature of 31–37 °C (p < 0.05), and the EPS content varied in the range of 89.00–186.77 mg/L (Figure 2c). When the temperature was 37 °C, the EPS production reached a maximum of 186.77 mg/L, indicating that the activity of EPS-related enzymes in the cells of Lp. plantarum MC5 was the highest at this temperature. When the fermentation temperature continued to increase, the EPS production decreased significantly (p < 0.05), indicating that the increased temperature inhibited the activities of EPS-related enzymes. Although strain fermentation is a dynamic process, the initial pH of the fermentation broth is also important for EPS production [23]. The EPS production first increased and then decreased at the initial pH of 5.6–7.2 (p < 0.05, Figure 2d), indicating that the initial pH was too acidic or too alkaline, which would affect the EPS production of Lp. plantarum MC5. When the initial pH was 6.4, the highest EPS production was 169.27 mg/L, indicating that the strain was suitable for growth in a neutral acid environment, and the enzymatic reaction of the strain was more active in this environment.
2.2. Optimization of Fermentation Conditions for EPS-MC5
Based on the single factor test, four culture conditions were independent variables, and the EPS production was the response value. Response surface optimization and the test plans were designed by using Design-Expert 8. 0. 6.1 software (Table 1).

Table 1.
Design and results of response surface experiments. Data are represented as the mean (n = 3).
The overall quadratic polynomial equation for EPS yield was established by multiple regression analysis on the inoculum size (A), the culture time (B), the culture temperature (C), and the initial pH (D) of Lp. plantarum MC5: EPS = 356.92 + 8.38A + 19.15B − 17.79C − 13.39D − 11.25AB + 17.22AC − 0.42AD − 55.91BC + 6.09BD + 4.69CD − 105.37A2 − 68.19B2 − 79.86C2 − 100.95D2. The regression model was analyzed by variance analysis and reliability analysis, and the results were shown in Table 2.
Table 2.
Variance analysis of regression model.
The results were subjected to analysis of variance (ANOVA), and statistical tests were performed with the F test shown in Table 2. The F value of the model was 26.34, p < 0.0001, indicating that the regression model was statistically significant. The lack of fit term was not significant, indicating that the model had good simulation, and R2 and correction coefficient R2Adj were 0.9634 and 0.9268, respectively, indicating that the established regression equation had a good degree of fit and could successfully predict the response value. In addition, the coefficient of variation (C.V. = 10.00%) indicated that the experimental results had high precision and reliability. The model data showed that the primary term B, the interaction term BC, A2, B2, C2, and D2 had a very significant impact on the EPS yield of the fermentation broth (p < 0.01), and the primary term C and D had a significant impact on the EPS yield (p < 0.05). To sum up, the order of the significant differences in the influence of the four factors was culture time > culture temperature > initial pH > inoculation size.
2.3. Three-Dimensional Response Surfaces and Count Plots of Variables
To visualize the effect of the interaction among the four factors of A, B, C, and D on the EPS yield of the strain, the three-dimensional response surface and contour plots between every two factors and EPS yield were drawn (Figure 3). Compared with other graphs, the contour line of the interaction term BC was elliptical, with the densest distribution and the steepest surface, followed by the interaction term AC, which showed that the interaction between culture time, culture temperature, and inoculum size had a more significant effect on EPS yield. This result corresponded to the results in Table 2. Therefore, culture time and temperature were key factors affecting EPS production.
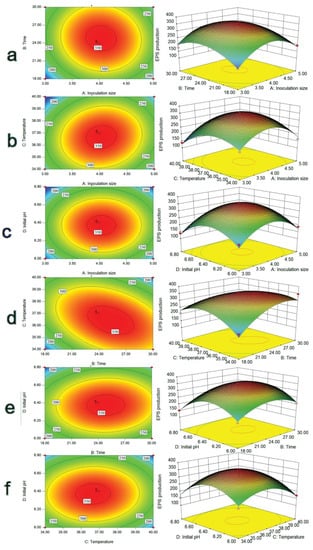
Figure 3.
3D response surface plot of the interaction of four factors. (a) represents the 3D response surface plot of inoculation size and time; (b) represents the 3D response surface plot of inoculation size and temperature; (c) represents the 3D response surface plot of inoculation size and initial pH; (d) represents the 3D response surface plot of time and temperature; (e) represents the 3D response surface plot of time and initial pH; (f) represents the 3D response surface plot of temperature and initial pH.
2.4. Verification Test of EPS-MC5 Yield
The optimal culture conditions for each factor were predicted as follows: the inoculation size, culture time, culture temperature, and initial pH were 4.24%, 30 h, 34.26 °C, and 6.42, respectively. The predicted EPS yield obtained under these conditions was 355.46 mg/L. In order to verify the effectiveness of the response surface model, considering the possibility of actual operation, the optimal culture conditions were adjusted as follows: the inoculum size was 4.0%, the culture time was 30 h, the culture temperature was 34.0 °C, and the initial pH value was 6.40. Under these culture conditions, the EPS content from Lp. plantarum MC5 was 345.81 mg/L (Table 3). The experimental results were in good agreement with the predicted results, indicating that the mathematical model was suitable for the simulation of the EPS production process in this study. We verified that the measured EPS yield was close to the EPS yield (356.92 mg/L) obtained by the five groups of parallel experiments at the center point of the response surface.
Table 3.
EPS production before and after Lp. plantarum MC5 optimized culture conditions.
In addition, the EPS production from other LAB was summarized and compared in Table 4. Many factors affect EPS yield [23,24]. EPS yield and the optimal EPS-producing conditions varied greatly (69–2767 mg/L), which may be due to differences in medium composition, isolation source, and strain species [25].
Table 4.
EPS production of other lactic acid bacteria.
2.5. Isolation and Purification of EPS-MC5
The EPS-MC5 was isolated under optimal culture conditions. The crude EPS-MC5 was separated by anion-exchange chromatography of DEAE Sepharose Fast Flow (Figure 4a). Fractions corresponding to the major peak eluted only with 0.05 Mol/L and 0.1 Mol/L NaCl were found to contain EPS, which showed that 0.05 and 0.1 Mol/L NaCl solution eluted almost all EPS. These fractions containing EPS were acidic EPS as they were eluted with NaCl [29]. The purified EPS eluate was subjected to UV full-wavelength scanning (Figure 4b). EPS-MC5 had no absorption peaks at 260 and 280 nm, indicating that the nucleic acid and protein in the EPS have been removed, and the EPS had high purity.
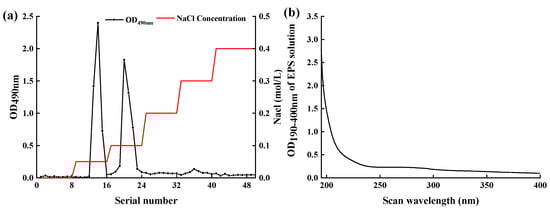
Figure 4.
DEAE Sepharose Fast Flow elution curve of EPS-MC5 (a) and UV full wavelength scan of EPS-MC5 eluent (b). Data are represented as the mean values (n = 3).
2.6. In Vitro Resisting-Digestion Capacity of EPS-MC5 to α-Amylase and Simulated Gastrointestinal Juices
The premise of EPS from LAB to play a probiotic role in the human gastrointestinal tract is that it must have a strong anti-digestive ability. Studies have reported that EPS produced by probiotics plays an important role in the colonization of probiotics in the human gastrointestinal tract [30].
At 0–180 min, the α-amylase resisting-digestion capacity (αRC) of EPS-MC5 was significantly higher than fructooligosaccharides (FOS) (p < 0.05). At 0–80 min, the αRC of EPS-MC5 decreased significantly (p < 0.05), while at 80–180 min, the difference in αRC was not significant (p > 0.05), indicating that the structure of EPS-MC5 was stable. The αRC of EPS-MC5 at 180 min was 98.59% (Figure 5a). The α-amylase can specifically hydrolyze the α-1,4 glucosidic bonds in starch or other polysaccharides. Due to the high αRC of the EPS, the EPS-MC5 could contain little or no α-1,4 glucosidic bonds.
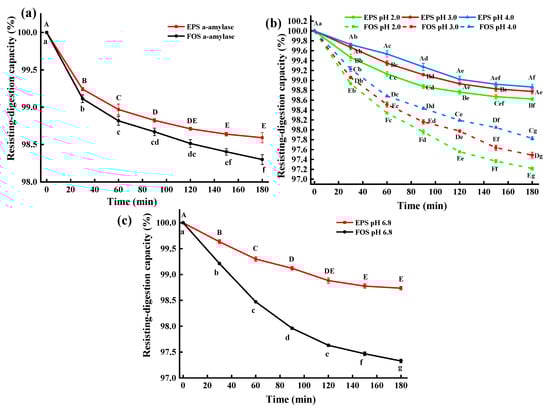
Figure 5.
(a): The resisting-digestion capacity of EPS-MC5 in α-amylase solution; (b): The resisting-digestion capacity of EPS-MC5 in simulative gastric juices (pH 2, 3, and 4); (c): The resisting-digestion capacity of EPS-MC5 in intestinal juices (pH 6.8). Error bars represent the standard errors (se) of the mean value (n = 3). Different lowercase letters indicate the difference between different times of the same pH, different capital letters indicate the difference of different pH at the same time (p < 0.05).
The resisting-digestion capacity (RC) of EPS-MC5 was significantly higher than that of FOS in simulated gastrointestinal juices at different pH values (p < 0.05), indicating that EPS-MC5 had a higher anti-digestive ability (Figure 5b,c). Within 0–120 min, the RC of EPS in four different pH simulated gastrointestinal juices decreased significantly (p < 0.05), while in 120–180 min, the RC decreased insignificantly (p > 0.05). In addition, the RC of the EPS-MC5 in the simulated gastric juice at pH 2.0 was significantly lower than those in pH 3.0 and pH 4.0 (p < 0.05). The results showed that the RC was inversely proportional to pH, with more glycosidic bonds cleavage at low pH. This may be due to that pH affected the RC of EPS by adjusting the enzymatic activity in simulated gastric juice.
The RC of EPS-MC5 at different pH simulated gastrointestinal juices were 98.62–98.86%. Caggianiello et al. [31] reported that EPS-producing strains are more likely to colonize the intestine because of the adhesion of EPS to intestinal epithelial cells. The results of Mao et al. [32] showed that the EPS produced by E. coli O157:H7 was resistant to bile salts, and simulated gastrointestinal juices. Devi [30] reported that the hydrolysis resistance of EPS from Weissella Confusa KR780676 to α-amylase, gastrointestinal juices was 99.1–98.8%, which was close to that of EPS-MC5 in this study. Results have shown that EPS-MC5 has good stability to ensure that it works as intended once it enters the intestinal tract.
2.7. In Vitro Antioxidant Activity of EPS-MC5
The in vitro radical scavenging rate of EPS is a common method to evaluate the ability and mechanisms of antioxidants [33]. DPPH· is a stable radical with an unpaired electron on one atom of its nitrogen bridge and has a strong absorption band at approximately 517 nm [27,34]. Hydroxyl radical (•OH) has free access to cell membranes and causes tissue damage. Thus, scavenging ·OH may avoid tissue injury [4,35]. The DPPH·, ABTS·, and •OH RSR of the EPS and Vc significantly increased with increasing concentrations (p < 0.05, Figure 6a–c). The RSR (DPPH•, ABTS•, and •OH) of EPS increased from 37.12% to 73.33%, 9% to 87.74%, and 7.53% to 46.07% at 2–10 mg/mL concentrations. Miao et al. [36] reported that the RSR of DPPH· was 40% for EPS at 5.0 mg/mL, which supported the results of this study. Results showed that the RSR of DPPH· and ABTS· was higher than that of OH.
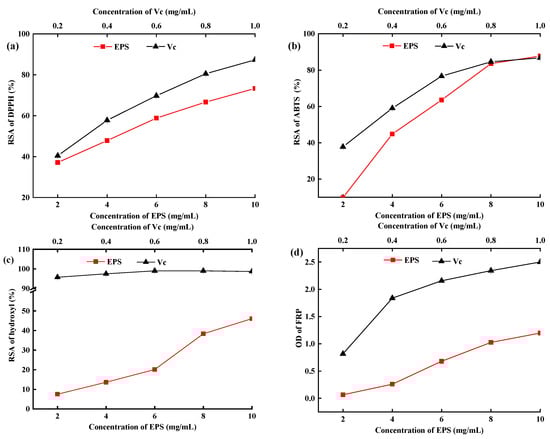
Figure 6.
Radical scavenging activity of DPPH (a), ABTS (b), OH (c), and ferric-iron reducing power of EPS-MC5 (d). Ascorbic acid (Vc) was used as a positive control. Error bars represent the standard errors (se) of the mean value (n = 3).
The FRP of EPS-MC5 significantly increased at 2–10 mg/mL (p < 0.05, Figure 6d). The highest FRP value of the EPS was 1.24 at 10 mg/mL, which suggested that the EPS not only acted as an electrons donor to directly react with free radicals but also performed antioxidant activity by other mechanisms, for instance, chelating with transition metal ion catalysts [37]. The FRP of EPS from L. plantarum LP6 was 0.632 [35], which was close to the EPS-MC5 in this study. The research results of Li [38] also showed that EPS may exert antioxidant activity through multiple mechanisms, such as blocking chain initiation, binding to the transition metal ion catalysts, and decomposing peroxides.
2.8. Rheological Properties of EPS-MC5
2.8.1. Apparent Viscosity of EPS-MC5
EPS concentration, processing temperature, pH, and metal ions all affect the rheological properties of EPS [39]. The apparent viscosity decreased gradually with increasing shear rate. When the shear rate increased from 3.24/s to 60/s, the apparent viscosity of the EPS decreased from 3.01 to 0.45 Pa (Figure 7a), which may be due to the disruption of intermolecular interactions and the breaking of bonds between various structural units with the increase of shear rate [39]. EPS from both L. plantarum C70 [40] and YW11 [26] also exhibited this shear thinning property. When the shear rate was greater than 60/s, the apparent viscosity decreased slowly and finally stabilized. In addition, the apparent viscosity of EPS-MC5 decreased rapidly with the increasing shear temperature (Figure 7b). When the shear temperature was 25–60 °C, the apparent viscosity of EPS decreased from 2.44 to 0.29 Pa, while when continuing to increase the temperature, the apparent viscosity of the EPS remained the same.
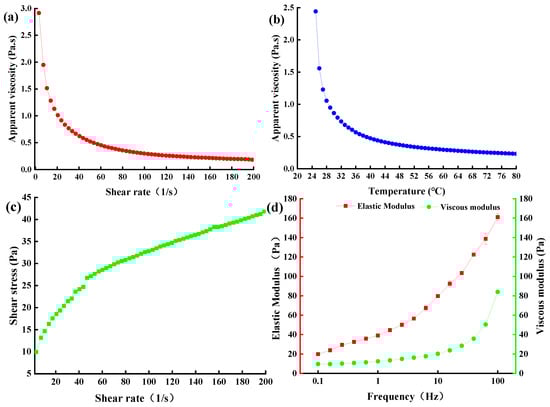
Figure 7.
Apparent viscosity of EPS-MC5 at different shear rates and temperatures (a,b); shear stress and elastic modulus (G’) and viscous modulus (G”) of EPS-MC5 (c,d). Error bars represent the standard errors (se) of the mean value (n = 3).
The shear stress of EPS-MC5 formed a thixotropic ring, indicating that the EPS was a thixotropic system (Figure 7c). The thixotropic ring of the EPS was large, indicating that the EPS had large stress under the action of external force. When the shear rate was 3.24–200/s, the stress of EPS-MC5 increased from 9.93 to 41.78 Pa.
2.8.2. Viscoelastic Properties of EPS-MC5
Viscoelasticity is one of the important processing characteristics of EPS [40]. The elastic modulus (G’) was generally higher than the viscous modulus (G”, Figure 7d), indicating that the EPS itself formed a gel structure and had elastic and solid-like characteristics. With the increasing frequency (0.1–100 Hz), the viscoelasticity modulus of EPS-MC5 increased from 19.81 to 161.02 and 9.63 to 84.02 Pa, respectively. This showed that the work done by the outside world on EPS aggregates increased at high frequencies. However, the viscoelasticity of EPS-M41 at 0.1–10 Hz was 1.0 × 10⁻⁵–1.0 Pa [40], which was lower than that of EPS-MC5 in this study. These differences may be due to the different molecular weights, glycosidic bond type, monosaccharide composition, functional groups, and substituents [41].
3. Materials and Methods
3.1. Materials
The strain Lp. plantarum MC5 was isolated from traditional fermented yak milk samples, in Tibetan areas of Gansu, China. Strain MC5 was identified by 16S rRNA sequencing and whole genome sequencing. Lp. plantarum MC5 was maintained in MRS agar dishes at 4 °C for immediate use and prepared to skim milk and glycerol stocks for a long time of preservation in a deep freezer (−80 °C). α-amylase (8 U/mg) was supplied by Shanghai Macklin Biochemical Co., Ltd. (Shanghai, China). Pepsin and Trypsin were supplied by Beijing Solebro Science and Technology Co., Ltd. (Beijing, China). All reagents used were of analytical grade.
MRS broth [42]: peptone (10 g/L), beef extracts (10 g/L), yeast extract (5 g/L), glucose (25 g/L), Tween 80 (1 mL/L), K2HPO4 (2 g/L), sodium acetate (5 g/L), diammonium hydrogen citrate (2 g/L), MgSO4 (0.2 g/L), MnSO4 (0.08 g/L), and agar (15 g/L). It was sterilized at 121 °C for 20 min.
3.2. Isolation and Determination of EPS-MC5
Lp. plantarum MC5 was cultured in MRS broth for 24 h, and the supernatant was collected after centrifugation. The supernatant was mixed with 80% (w/v) trichloroacetic acid (TCA), allowed to stand at 4 °C for 24 h, and then centrifuged again. The supernatant was collected, mixed with 95% alcohol (3:1 v/v), and allowed to stand again at 4 °C for 24 h. The mixture was centrifuged, and the pellet was suspended in deionized water and dialyzed at 4 °C for 2 days using dialysis bags (molecular weights of 8–14 kDa). The total sugar content was detected using phenol-sulfate acid method [28]. Briefly, 0.1 g EPS was dissolved in 100 mL of distilled water, and 1 mL EPS solution was mixed well with 1 mL 6% (w/v) phenol solution and 5 mL 98% (w/v) H2SO4, shaken for 10 min, and the absorbance was determined at 490 nm.
3,5-dinitro salicylic acid (DNS) method was utilized to detect the reducing sugar content [43]. A total of 2 mL distilled water and 1.5 mL DNS solution were added to 0.2, 0.4, 0.6, 0.8, 1.0, 1.2, and 1.4 mL of 1.0 mg/mL glucose standard solution, respectively. They were shaken well and heated in a 100 °C water bath for 5 min. Then we adding distilled water to make up to 25 mL, and the absorbance was determined at 520 nm.
3.3. Purification of EPS-MC5
The EPS was purified by using the method of Zhang et al. [25]. The crude EPS solution (20 mg/mL, 5 mL) was fractionated with an anion exchange chromatography on a DEAE Sepharose Fast Flow column (16 mm × 25 cm), eluted with deionized water, 0.1, 0.2, 0.3, 0.4, and 0.5 Mol/L NaCl solution at a flow rate of 1 mL/min. Every 7 mL elution was collected automatically and the EPS content was determined by the phenol-sulfuric acid method. Peak fractions containing EPS were pooled, dialyzed, and lyophilized.
3.4. Single Factor Experiment of Culture Conditions for EPS Production from Lp. plantarum MC5
3.4.1. Effects of Inoculation Size on EPS Production from Lp. plantarum MC5
Lp. plantarum MC5 was inoculated in MRS broth (pH 6.4). The inoculation size of strains Lp. plantarum MC5 was 1%, 2%, 3%, 4%, and 5%, respectively. They were incubated at 37 °C for 24 h. EPS production was determined by the method in Section 2.2.
3.4.2. Effects of Culture Time on EPS Production from Lp. plantarum MC5
Lp. plantarum MC5 was inoculated into MRS broth (pH 6.4). The Lp. plantarum MC5 were incubated at 37 °C for 12, 18, 24, 30, and 36 h, respectively. The method of determining EPS production was the same as above.
3.4.3. Effects of Culture Temperature on EPS Production from Lp. plantarum MC5
Lp. plantarum MC5 was inoculated into MRS broth (pH 6.4). The Lp. plantarum MC5 were incubated at 31 °C, 34 °C, 37 °C, 40 °C, and 43 °C for 24 h, respectively. The method of determining EPS production was the same as above.
3.4.4. Effect of Initial pH Value on EPS Production from Lp. plantarum MC5
Lp. plantarum MC5 was inoculated into MRS broth. The initial pH values of the medium were adjusted to 5.6, 6.0, 6.4, 6.8, and 7.2, respectively, which were incubated at 37 °C for 24 h (inoculation size 4%). The method of determining EPS production was the same as above.
3.5. Optimization of Lp. plantarum MC5 EPS Culture Conditions by Response Surface
Using Design Expert 8.0.6.1 Box–Behnken Design (BBD) software to design experiments and analyze the experimental data. The second-order response surface model was obtained by fitting, and the optimal conditions were determined. BBD was experimented to optimize the four variables (inoculation size, incubation time, incubation temperature, and initial pH) screened by single factor experiments and designed as A, B, C, and D. The four independent variables were investigated at three levels with 29 experimental runs and 5 repetitive central points.
The experiments were carried out in triplicates. The 3D graphic plots obtained by the software would illustrate reciprocal interactions between each significant factor [4].
3.6. In Vitro Resisting-Digestion Capacity of EPS-MC5
3.6.1. The Resisting-Digestion Capacity of EPS-MC5 to α-Amylase (RCA)
The RDCA of EPS-MC5 was performed as described by Al-Sheraji et al. [44]. A total of 500 mg EPS was dissolved with 50 mL PBS buffer (pH 6.8), and a-amylase was added to the EPS solution to a final concentration of 8 U/mL. The solution was reacted in a water bath at 37 °C for 180 min. The released reducing sugar content of EPS solution was determined every 30 min, which was detected by the DNS method. The initial total sugar was detected by the phenol-sulfuric acid method. The resisting-digestion capacity (RC) was calculated according to the formula:
3.6.2. The Resisting-Digestion Capacity of EPS-MC5 to Simulated Gastric Juice
Artificial simulated gastric juice [45]: 3.0 g pepsin was fully dissolved in 300 mL normal saline, and divided into 3 equal parts. Then, the three solutions were adjusted the pH to 2.0, 3.0, and 4.0 with HCl (2 Mol/L), respectively. Finally, the three solutions were filtered and sterilized by using a microporous membrane (0.22 μm).
A total of 500 mg EPS-MC5 was added to 50 mL of simulated gastric juice with pH 2, 3, and 4, respectively. The three solutions were reacted in a water bath at 37 °C for 180 min. The released reducing sugar content of the EPS solution was determined every 30 min [30]. The calculation formula of the RC was the same as in Section 3.6.1.
3.6.3. The Resisting-Digestion Capacity of EPS-MC5 to Simulated Intestinal Juice
Artificial simulated intestinal juice [46]: Ox bile salt (3.0 g), ox bile juice (1.0 g), and trypsin (2.0 g) were added in PBS buffer (500 mL pH 6.0). Then, the solution was adjusted the pH to 6.8 with NaOH (2 Mol/L). Finally, the solutions were filtered with a microporous membrane (0.22 μm) for later use.
A total of 500 mg EPS-MC5 was added to 50 mL of simulated intestinal juice with pH 6.8. The solutions were reacted in a water bath at 37 °C for 180 min. The released reducing sugar content of the EPS solution was determined every 30 min [30]. The calculation formula of the RC was the same as in Section 3.6.1.
3.7. In Vitro Antioxidant Activity Analysis of EPS-MC5
3.7.1. The Radical Scavenging Rate (RSR) of DPPH
RSR of DPPH free radical was assayed by El-Dein’ method [28]. A total of 2 mL of EPS solution (2, 4, 6, 8, and 10 mg/mL) was mixed with 2 mL 0.1 mMol/L DPPH solution. Then, the mixture was placed in the dark at room temperature for 30 min. The absorbance of the supernatant was determined at 517 nm after centrifugation (Aj), and ascorbic acid was used as a positive control. The RSR of DPPH free radical was calculated by the equation as follows:
Aj: Absorbance of EPS solution (2 mL) + 95%-DPPH ethanol solution (2 mL);
Ai: Absorbance of EPS solution (2 mL) + 95% ethanol solution (2 mL);
A0: Absorbance of 95%-DPPH ethanol solution (2 mL) + 95% ethanol solution (2 mL).
3.7.2. The Radical Scavenging Rate (RSR) of ABTS
ABTS solution was prepared by mixing equal volumes of ABTS (7 mMol/L) and potassium persulfate solutions (2.45 mMol/L), and the mixture was placed in the dark for 16 h [4]. The ABTS solution was diluted by PBS solution (0.2 M, pH 7.4) to an absorbance of 0.70 ± 0.02 at 734 nm before use. A total of 600 uL of EPS solution (2, 4, 6, 8, and 10 mg/mL) was added into 3 mL ABTS solution. Then, the mixture was incubated for 10 min in dark at room temperature. The absorbance of the mixture solution was determined at 734 nm (Aj), and ascorbic acid was used as a positive control. The RSA of ABTS was calculated using:
Aj: Absorbance of EPS solution (600 uL) + ABTS solution (3 mL);
Ai: Absorbance of EPS solution (600 uL) + deionized water (3 mL);
A0: Absorbance of deionized water (600 uL) + ABTS solution (3 mL).
3.7.3. The Radical Scavenging Rate (RSR) of Hydroxyl
The RSR of Hydroxyl (OH) was investigated by the method of Zhang [25] with slight modifications. One mL of EPS solution (2, 4, 6, 8 and 10 mg/mL) was mixed with 1.8 mM FeSO4 (2 mL), 1.8 mM salicylic acid (1.5 mL) and 0.3% H2O2 (2 mL). After 30 min of standing at 37 °C and centrifugation (8000 rpm, 5 min), the absorbance of the supernatant was measured at 510 nm. Ascorbic acid was used as a positive control. The RSA of OH was calculated using:
Aj: Absorbance of EPS solution + H2O2;
Ai: Absorbance of deionized water + H2O2;
A0: Absorbance of salicylic acid was replaced by deionized water.
3.7.4. The Ferric-Iron Reducing Power (IRP) of EPS-MC5
The IRP of EPS was determined according to the method of Wang [47] with some modifications. Briefly, 1 mL of EPS solution (2, 4, 6, 8 and 10 mg/mL) was mixed with 2.5 mL phosphate buffer (0.2 Mol/L, pH 6.6) and 2.5 mL potassium ferricyanide (1%, w/v), and the mixture was incubated at 50 °C for 20 min. After adding 2.5 mL trichloroacetic acid (10%, w/v), the mixture was centrifuged at 8000 rpm for 5 min. A total of 2.5 mL of supernatant was collected and mixed with 2.5 mL distilled water and 0.5 mL FeCl3 (0.1%, w/v). The absorbance was measured at 700 nm after 10 min. The IRP of EPS was calculated using:
3.8. Analysis of Rheological Properties of EPS-MC5
3.8.1. The Preparation of the EPS-MC5 Samples
Lp. plantarum MC5 was cultured in MRS broth for 30 h, and the supernatant was collected after centrifugation. The supernatant was mixed with 80% (w/v) trichloroacetic acid (TCA), and allowed to stand at 4 °C for 24 h. The supernatant was collected after centrifugation again, mixed with 95% alcohol (3:1 v/v), and allowed to stand again at 4 °C for 24 h. The EPS-MC5 samples were obtained after centrifugation.
3.8.2. Apparent Viscosity and Flow Curves of EPS-MC5
The apparent viscosity and shear stress were determined according to Ayyash’s method [40]. Apparent viscosity and shear stress of the EPS-MC5 samples were determined using an MCR301 Rheometer. The samples were linearly sheared at a constant temperature of 25 ± 1 °C. They were performed in the shear rate range of 0.1 to 200/s. The measurement time was 1 min. In addition, the apparent viscosity of EPS-MC5 was analyzed as a function of temperature from 25 °C to 80 °C. The temperature ramp rate was 1 °C/min at a constant shear rate of 20/s.
3.8.3. Amplitude and Frequency Sweep Tests of EPS-MC5
The viscoelasticity of the EPS-MC5 samples was measured by using an MCR301 Rheometer [48]. The frequency sweep test was used to evaluate viscoelasticity of the EPS-MC5 under the condition of 5% strain force and frequency of 0.1–100 Hz.
3.9. Statistical Analysis
All the experiments were carried out in triplicate. The response surface analysis was obtained by using Design-Expert 8.0.6.1 software. The relative standard error and the mean values were calculated using SPSS 22.0 (Statistical Package for the Social Sciences, Chicago, IL, USA). ANOVA tests were done to a determination of significant differences between treatments with a level of significance of p < 0.05 by the SPSS 22.0 package program. The obtained pictures were carried out according to the Origin 8.0 software (Statistical Package for the Social Sciences, Northampton, MA, USA).
4. Conclusions
In this study, the optimal EPS-producing conditions (the inoculum size of 4.0%, the culture time of 30 h, the culture temperature of 34.0 °C, and the initial pH value of 6.40) and the maximum EPS yield (345.81 mg/L) of Lp. plantarum MC5 were obtained. The resistance of EPS-MC5 to human simulated digestive juices (α-amylase, simulated gastric and intestinal juices) was significantly higher than FOS (p < 0.05), indicating that EPS-MC5 could reach the gastrointestinal tract smoothly when entering the human body. The EPS-MC5 also had high antioxidant activity and could scavenge a variety of radicals (DPPH•, ABTS•, and •OH), which indicated that it exerted antioxidant activity through multiple pathways. In addition, EPS demonstrated good apparent viscosity and viscoelasticity, indicating that it had good processing characteristics.
In conclusion, the EPS-MC5 was a potential active polysaccharide that could regulate human health and can be used in the food processing industry. However, the structural characterization and beneficial nature in vivo of the EPS-MC5 need further study.
Author Contributions
Conceptualization, X.Z. and Q.L.; methodology, X.Z. and Q.L.; validation, X.Z.; formal analysis, X.Z.; investigation, Q.L.; resources, Q.L.; data curation, X.Z.; writing—original draft preparation, X.Z.; writing—review and editing, X.Z. and Q.L.; supervision, Q.L.; funding acquisition, Q.L. All authors have read and agreed to the published version of the manuscript.
Funding
This research was funded by the National Natural Science Foundation of China, grant number: 31660468.
Institutional Review Board Statement
Not applicable.
Informed Consent Statement
Not applicable.
Data Availability Statement
The data presented in this study are available upon request from the corresponding author. The data are not publicly available due to privacy.
Acknowledgments
The authors would like to thank Xiangzhu Wang and Ying Liu from Gansu Liaoyuan Dairy Group for the help of funding acquisition and resources.
Conflicts of Interest
The authors declare no conflict of interest.
Abbreviations
| EPS | Exopolysaccharide |
| EPS-MC5 | Exopolysaccharide production from Lp. plantarum MC5 |
| LAB | Lactic acid bacteria |
| Lp. plantarum MC5 | Lactiplantibacillus plantarum MC5 |
| RSA | Radical scavenging activity |
| DPPH• | 1,1-Diphenyl-2-picrylhydrazyl, (free radical) |
| ABTS• | 2,2’-Azinobis (3-ethylbenzothiazoline-6-sulfonic acid ammonium salt) |
| •OH | Hydroxyl (free radicals) |
| IRP | Ferric-iron reducing power |
References
- Faghfoori, Z.; Gargari, B.P.; Gharamaleki, A.S.; Bagherpour, H.; Khosroushahi, A.Y. Cellular and molecular mechanisms of probiotics effects on colorectal cancer. J. Funct. Foods 2015, 18, 463–472. [Google Scholar] [CrossRef]
- Imran, M.Y.M.; Reehana, N.; Jayaraj, K.A.; Ahamed, A.A.P.; Dhanasekaran, D.; Thajuddin, N.; Alharbi, N.S.; Muralitharan, G. Statistical optimization of exopolysaccharide production by Lactobacillus plantarum NTMI05 and NTMI20. Int. J. Biol. Macromol. 2016, 93, 731–745. [Google Scholar] [CrossRef]
- Kajala, I.; Shi, Q.; Nyyssölä, A.; Maina, N.H.; Hou, Y.; Katina, K.; Tenkanen, M.; Juvonen, R. Cloning and characterization of a Weissella confusa dextransucrase and its application in high fibre baking. PLoS ONE 2015, 10, e116418–e116437. [Google Scholar] [CrossRef]
- Dilna, S.V.; Surya, H.; Aswathy, R.G.; Varsha, K.K.; Sakthikumar, D.N.; Pandey, A.; Nampoothiri, K.M. Characterization of an exopolysaccharide with potential health-benefit properties from a probiotic Lactobacillus plantarum RJF4. LWT-Food Sci. Technol. 2015, 64, 1179–1186. [Google Scholar] [CrossRef]
- Sadishkumar, V.; Jeevaratnam, K. In vitro probiotic evaluation of potential antioxidant lactic acid bacteria isolated fromidli batter fermented with Piper betle leaves. Int. J. Food Sci. Technol. 2017, 52, 329–340. [Google Scholar] [CrossRef]
- Mayer, M.J.; D’Amato, A.; Colquhoun, I.J.; Le Gall, G.; Narbad, A. Identification of genes required for glucan exopolysaccharide production in Lactobacillus johnsonii suggests a novel biosynthesis mechanism. Appl. Environ. Microbiol. 2020, 86, e2808–e2819. [Google Scholar] [CrossRef]
- Loeffler, M.; Hilbig, J.; Velasco, L.; Weiss, J. Usage of in situ exopolysaccharide-forming lactic acid bacteria in food production: Meat products—A new field of application? Compr. Rev. Food Sci. Food Saf. 2020, 19, 2932–2954. [Google Scholar] [CrossRef]
- Macedo, M.; Lacroix, C.; Gardner, N.; Champagne, C. Effect of medium supplementation on exopolysaccharide production by Lactobacillus rhamnosus RW-9595M in whey permeate. Int. Dairy J. 2002, 12, 419–426. [Google Scholar] [CrossRef]
- Aslım, B.; Yüksekdag, Z.N.; Beyatli, Y.; Mercan, N.; Aslim, B. Exopolysaccharide production by Lactobacillus delbruckii subsp. bulgaricus and Streptococcus thermophilus strains under different growth conditions. World J. Microbiol. Biotechnol. 2005, 21, 673–677. [Google Scholar] [CrossRef]
- Bryukhanov, A.L.; Klimko, A.I.; Netrusov, A.I. Antioxidant properties of lactic acid bacteria. Microbiology 2022, 91, 463–478. [Google Scholar] [CrossRef]
- Seishima, R.; Wada, T.; Tsuchihashi, K.; Okazaki, S.; Yoshikawa, M.; Oshima, H.; Oshima, M.; Sato, T.; Hasegawa, H.; Kitagawa, Y.; et al. Ink4a/Arf-dependent loss of parietal cells induced by oxidative stress promotes CD44-dependent gastric tumorigenesis. Cancer Prev. Res. 2015, 8, 492–501. [Google Scholar] [CrossRef]
- Matthew, R.B.; Andrew, B.; Rajesh, K. Reactive oxygen species-mediated diabetic heart disease: Mechanisms and therapies. Antioxid. Redox Signal. 2022, 36, 608–630. [Google Scholar]
- Zuo, L.; Rose, B.A.; Roberts, W.J.; He, F.; Banes-Berceli, A.K. Molecular characterization of reactive oxygen species in systemic and pulmonary hypertension. Am. J. Hypertens. 2014, 27, 643–650. [Google Scholar] [CrossRef]
- Pessione, E.; Cirrincione, S. Bioactive molecules released in food by lactic acid bacteria: Encrypted peptides and biogenic amines. Front. Microbiol. 2016, 7, 1–19. [Google Scholar] [CrossRef] [PubMed]
- Tallon, R.; Bressollier, P.; Urdaci, M.C. Isolation and characterization of two exopolysaccharides produced by Lactobacillus plantarum EP56. Res. Microbiol. 2003, 154, 705–712. [Google Scholar] [CrossRef]
- Vereecke, D.; Fichtner, E.J.; Lambert, P.Q.; Cooke, P.; Kilcrease, J.; Stamler, R.A.; Zhang, Y.; Francis, I.M.; Randall, J.J. Colonization and survival capacities underlying the multifaceted life of Rhodococcus sp. PBTS1 and PBTS2. Plant Pathol. 2021, 70, 567–583. [Google Scholar] [CrossRef]
- Degeest, B.; Vaningelgem, F.; De Vuyst, L. Microbial physiology, fermentation kinetics, and process engineering of heteropolysaccharide production by lactic acid bacteria. Int. Dairy J. 2001, 11, 747–757. [Google Scholar] [CrossRef]
- Adesulu-Dahunsi, A.T.; Sanni, A.I.; Jeyaram, K. Production, characterization and in vitro antioxidant activities of exopolysaccharide from Weissella cibaria GA44. LWT-Food Sci. Technol. 2018, 87, 432–442. [Google Scholar] [CrossRef]
- Zhao, X.F.; Liang, Q. EPS-Producing Lactobacillus plantarum MC5 as a compound starter improves rheology, texture, and antioxidant activity of yogurt during storage. Foods 2022, 11, 1660. [Google Scholar] [CrossRef] [PubMed]
- Xia, M.; Zhang, S.; Shen, L.; Yu, R.; Liu, Y.; Li, J.; Wu, X.; Chen, M.; Qiu, G.; Zeng, W. Optimization and characterization of an antioxidant exopolysaccharide produced by cupriavidus pauculus 1490. J. Polym. Environ. 2022, 30, 2077–2086. [Google Scholar] [CrossRef]
- Chaisuwan, W.; Jantanasakulwong, K.; Wangtueai, S. Microbial exopolysaccharides for immune enhancement fermentation, modifications and bioactivities. Food Biosci. 2020, 35, 100564–100601. [Google Scholar] [CrossRef]
- Jiang, G.; He, J.; Gan, L.; Li, X.; Tian, Y. Optimization of exopolysaccharides production by lactiplantibacillus pentosus B8 isolated from sichuan PAOCAI and its functional properties. Appl. Biochem. Microbiol. 2022, 58, 195–205. [Google Scholar] [CrossRef]
- Li, Y.; Liu, Y.; Cao, C.; Zhu, X.; Wang, C.; Wu, R.; Wu, J. Extraction and biological activity of exopolysaccharide produced by Leuconostoc Mesenteroides SN-8. Int. J. Biol. Macromol. 2020, 157, 36–44. [Google Scholar] [CrossRef]
- Wang, X.; Shao, C.; Liu, L.; Guo, X.; Xu, Y.; Lü, X. Optimization, partial characterization and antioxidant activity of an exopolysaccharide from Lactobacillus plantarum KX041. Int. J. Biol. Macromol. 2017, 103, 1173–1184. [Google Scholar] [CrossRef] [PubMed]
- Zhang, L.; Liu, C.; Li, D.; Zhao, Y.; Zhang, X.; Zeng, X.; Yang, Z.; Li, S. Antioxidant activity of an exopolysaccharide isolated from Lactobacillus plantarum C88. Int. J. Biol. Macromol. 2013, 54, 270–275. [Google Scholar] [CrossRef]
- Wang, J.; Zhao, X.; Tian, Z.; Yang, Y.; Yang, Z. Characterization of an exopolysaccharide produced by Lactobacillus plantarum YW11 isolated from Tibet Kefir. Carbohydr. Polym. 2015, 125, 16–25. [Google Scholar] [CrossRef] [PubMed]
- Rajoka, M.S.R.; Jin, M.; Haobin, Z.; Li, Q.; Shao, D.; Jiang, C.; Huang, Q.; Yang, H.; Shi, J.; Hussain, N. Functional characterization and biotechnological potential of exopolysaccharide produced by Lactobacillus rhamnosus strains isolated from human breast milk. LWT-Food Sci. Technol. 2018, 89, 638–647. [Google Scholar] [CrossRef]
- El-Dein, A.N.; El-Deen, A.M.N.; El-Shatoury, E.H.; Awad, G.A.; Ibrahim, M.K.; Awad, H.M.; Farid, M.A. Assessment of exopolysaccharides, bacteriocins and in vitro and in vivo hypocholesterolemic potential of some Egyptian Lactobacillus spp. Int. J. Biol. Macromol. 2021, 173, 66–78. [Google Scholar] [CrossRef] [PubMed]
- Gan, D.; Ma, L.; Jiang, C.; Xu, R.; Zeng, X. Production, preliminary characterization and antitumor activity in vitro of polysaccharides from the mycelium of Pholiota dinghuensis Bi. Carbohydr. Polym. 2011, 84, 997–1003. [Google Scholar] [CrossRef]
- Devi, P.B.; Kavitake, D.; Jayamanohar, J.; Shetty, P.H. Preferential growth stimulation of probiotic bacteria by galactan exopolysaccharide from Weissella confusa KR780676. Food Res. Int. 2021, 143, 110333–110340. [Google Scholar] [CrossRef]
- Caggianiello, G.; Kleerebezem, M.; Spano, G. Exopolysaccharides produced by lactic acid bacteria: From health-promoting benefits to stress tolerance mechanisms. Appl. Microbiol. Biotechnol. 2016, 100, 3877–3886. [Google Scholar] [CrossRef]
- Mao, Y.; Doyle, M.P.; Chen, J. Role of colanic acid exopolysaccharide in the survival of enterohaemorrhagic Escherichia coli O157:H7 in simulated gastrointestinal fluids. Lett. Appl. Microbiol. 2006, 42, 642–647. [Google Scholar] [CrossRef]
- Khalil, M.A.; Sonbol, F.I.; Al-Madboly, L.A.; Aboshady, T.A.; Alqurashi, A.S.; Ali, S.S. Exploring the therapeutic potentials of exopolysaccharides derived from lactic acid bacteria and bifidobacteria: Antioxidant, antitumor, and periodontal regeneration. Front. Microbiol. 2022, 13, 803688–803699. [Google Scholar] [CrossRef] [PubMed]
- Hao, L.; Sheng, Z.; Lu, J.; Tao, R.; Jia, S. Characterization and antioxidant activities of extracellular and intracellular polysaccharides from Fomitopsis pinicola. Carbohydr. Polym. 2016, 141, 54–59. [Google Scholar] [CrossRef] [PubMed]
- Yamamoto, N.; Shoji, M.; Hoshigami, H.; Watanabe, K.; Takatsuzu, T.; Yasuda, S.; Igoshi, K.; Kinoshita, H. Antioxidant capacity of soymilk yogurt and exopolysaccharides produced by lactic acid bacteria. Biosci. Microbiota Food Health 2019, 38, 97–104. [Google Scholar] [CrossRef] [PubMed]
- Miao, M.; Jia, X.; Jiang, B.; Wu, S.; Cui, S.W.; Li, X. Elucidating molecular structure and prebiotics properties of bioengineered α-D-glucan from Leuconostoc citreum SK24.002. Food Hydrocoll. 2016, 54, 227–233. [Google Scholar] [CrossRef]
- Xu, Y.; Cui, Y.; Yue, F.; Liu, L.; Shan, Y.; Liu, B.; Zhou, Y.; Lü, X. Exopolysaccharides produced by lactic acid bacteria and bifidobacteria structures, physiofchemical functions and applications in the food industry. Food Hydrocoll. 2019, 94, 475–499. [Google Scholar] [CrossRef]
- Li, B.; Du, P.; Smith, E.E.; Wang, S.; Jiao, Y.; Guo, L.; Huo, G.; Liu, F. In vitro and in vivo evaluation of an exopolysaccharide produced by Lactobacillus helveticus KLDS1.8701 for the alleviative effect on oxidative stress. Food Funct. 2019, 10, 1707–1717. [Google Scholar] [CrossRef]
- Zhao, D.; Liu, L.; Jiang, J.; Guo, S.; Ping, W.; Ge, J. The response surface optimization of exopolysaccharide produced by Weissella confusa XG-3 and its rheological property. Prep. Biochem. Biotechnol. 2020, 50, 1014–1022. [Google Scholar] [CrossRef]
- Ayyash, M.; Abu-Jdayil, B.; Itsaranuwat, P.; Galiwango, E.; Tamiello-Rosa, C.; Abdullah, H.; Esposito, G.; Hunashal, Y.; Obaid, R.S.; Hamed, F. Characterization, bioactivities, and rheological properties of exopolysaccharide produced by novel probiotic Lactobacillus plantarum C70 isolated from camel milk. Int. J. Biol. Macromol. 2020, 144, 938–946. [Google Scholar] [CrossRef]
- Zhou, Y.; Cui, Y.; Qu, X. Exopolysaccharides of lactic acid bacteria: Structure, bioactivity and associations: A review. Carbohydr. Polym. 2019, 207, 317–332. [Google Scholar] [CrossRef]
- Fashogbon, R.O.; Adebayo-Tayo, B.; Sanusi, J. Optimization of extracellular polysaccharide substances from lactic acid bacteria isolated from fermented dairy products. Microbiol. J. 2021, 11, 1–11. [Google Scholar] [CrossRef]
- Poespowati, T.; Mahmudi, A. Optimization of acid hydrolysis process on macroalga Ulva lactuca for reducing sugar production as feedstock of bioethanol. Int. J. Renew. Energy Res. 2018, 8, 466–475. [Google Scholar]
- Al-Sheraji, S.H.; Ismail, A.; Manap, M.Y.; Mustafa, S.; Yusof, R.M.; Hassan, F.A. Fermentation and non-digestibility of Mangifera pajang fibrous pulp and its polysaccharides. J. Funct. Foods 2012, 4, 933–940. [Google Scholar] [CrossRef]
- Vecchione, A.; Celandroni, F.; Mazzantini, D.; Senesi, S.; Lupetti, A.; Ghelardi, E. Compositional quality and potential gastrointestinal behavior of probiotic products commercialized in Italy. Front. Med. 2018, 5, 59–68. [Google Scholar] [CrossRef] [PubMed]
- Li, E.; Yang, H.; Zou, Y.; Wang, H.; Hu, T.; Li, Q.; Liao, S. In-vitro digestion by simulated gastrointestinal juices of Lactobacillus rhamnosus cultured with mulberry oligosaccharides and subsequent fermentation with human fecal inocula. LWT-Food Sci. Technol. 2019, 101, 61–68. [Google Scholar] [CrossRef]
- Wang, K.; Niu, M.; Song, D.; Song, X.; Zhao, J.; Wu, Y.; Lu, B.; Niu, G. Preparation, partial characterization and biological activity of exopolysaccharides produced from Lactobacillus fermentum S1. J. Biosci. Bioeng. 2020, 129, 206–214. [Google Scholar] [CrossRef]
- Ayyash, M.; Abu-Jdayil, B.; Olaimat, A.; Esposito, G.; Itsaranuwat, P.; Osaili, T.; Obaid, R.S.; Kizhakkayil, J.; Liu, S.-Q. Physicochemical, bioactive and rheological properties of an exopolysaccharide produced by a probiotic Pediococcus pentosaceus M41. Carbohydr. Polym. 2020, 229, 115462–115471. [Google Scholar] [CrossRef]


Disclaimer/Publisher’s Note: The statements, opinions and data contained in all publications are solely those of the individual author(s) and contributor(s) and not of MDPI and/or the editor(s). MDPI and/or the editor(s) disclaim responsibility for any injury to people or property resulting from any ideas, methods, instructions or products referred to in the content. |
© 2023 by the authors. Licensee MDPI, Basel, Switzerland. This article is an open access article distributed under the terms and conditions of the Creative Commons Attribution (CC BY) license (https://creativecommons.org/licenses/by/4.0/).