
Interactions between Ionic Cellulose Derivatives Recycled from Textile Wastes and Surfactants: Interfacial, Aggregation and Wettability Studies


Abstract
:1. Introduction
2. Results and Discussion
2.1. Polymer-Surfactant Interactions: Surface Tension, Zeta Potential and pH Data
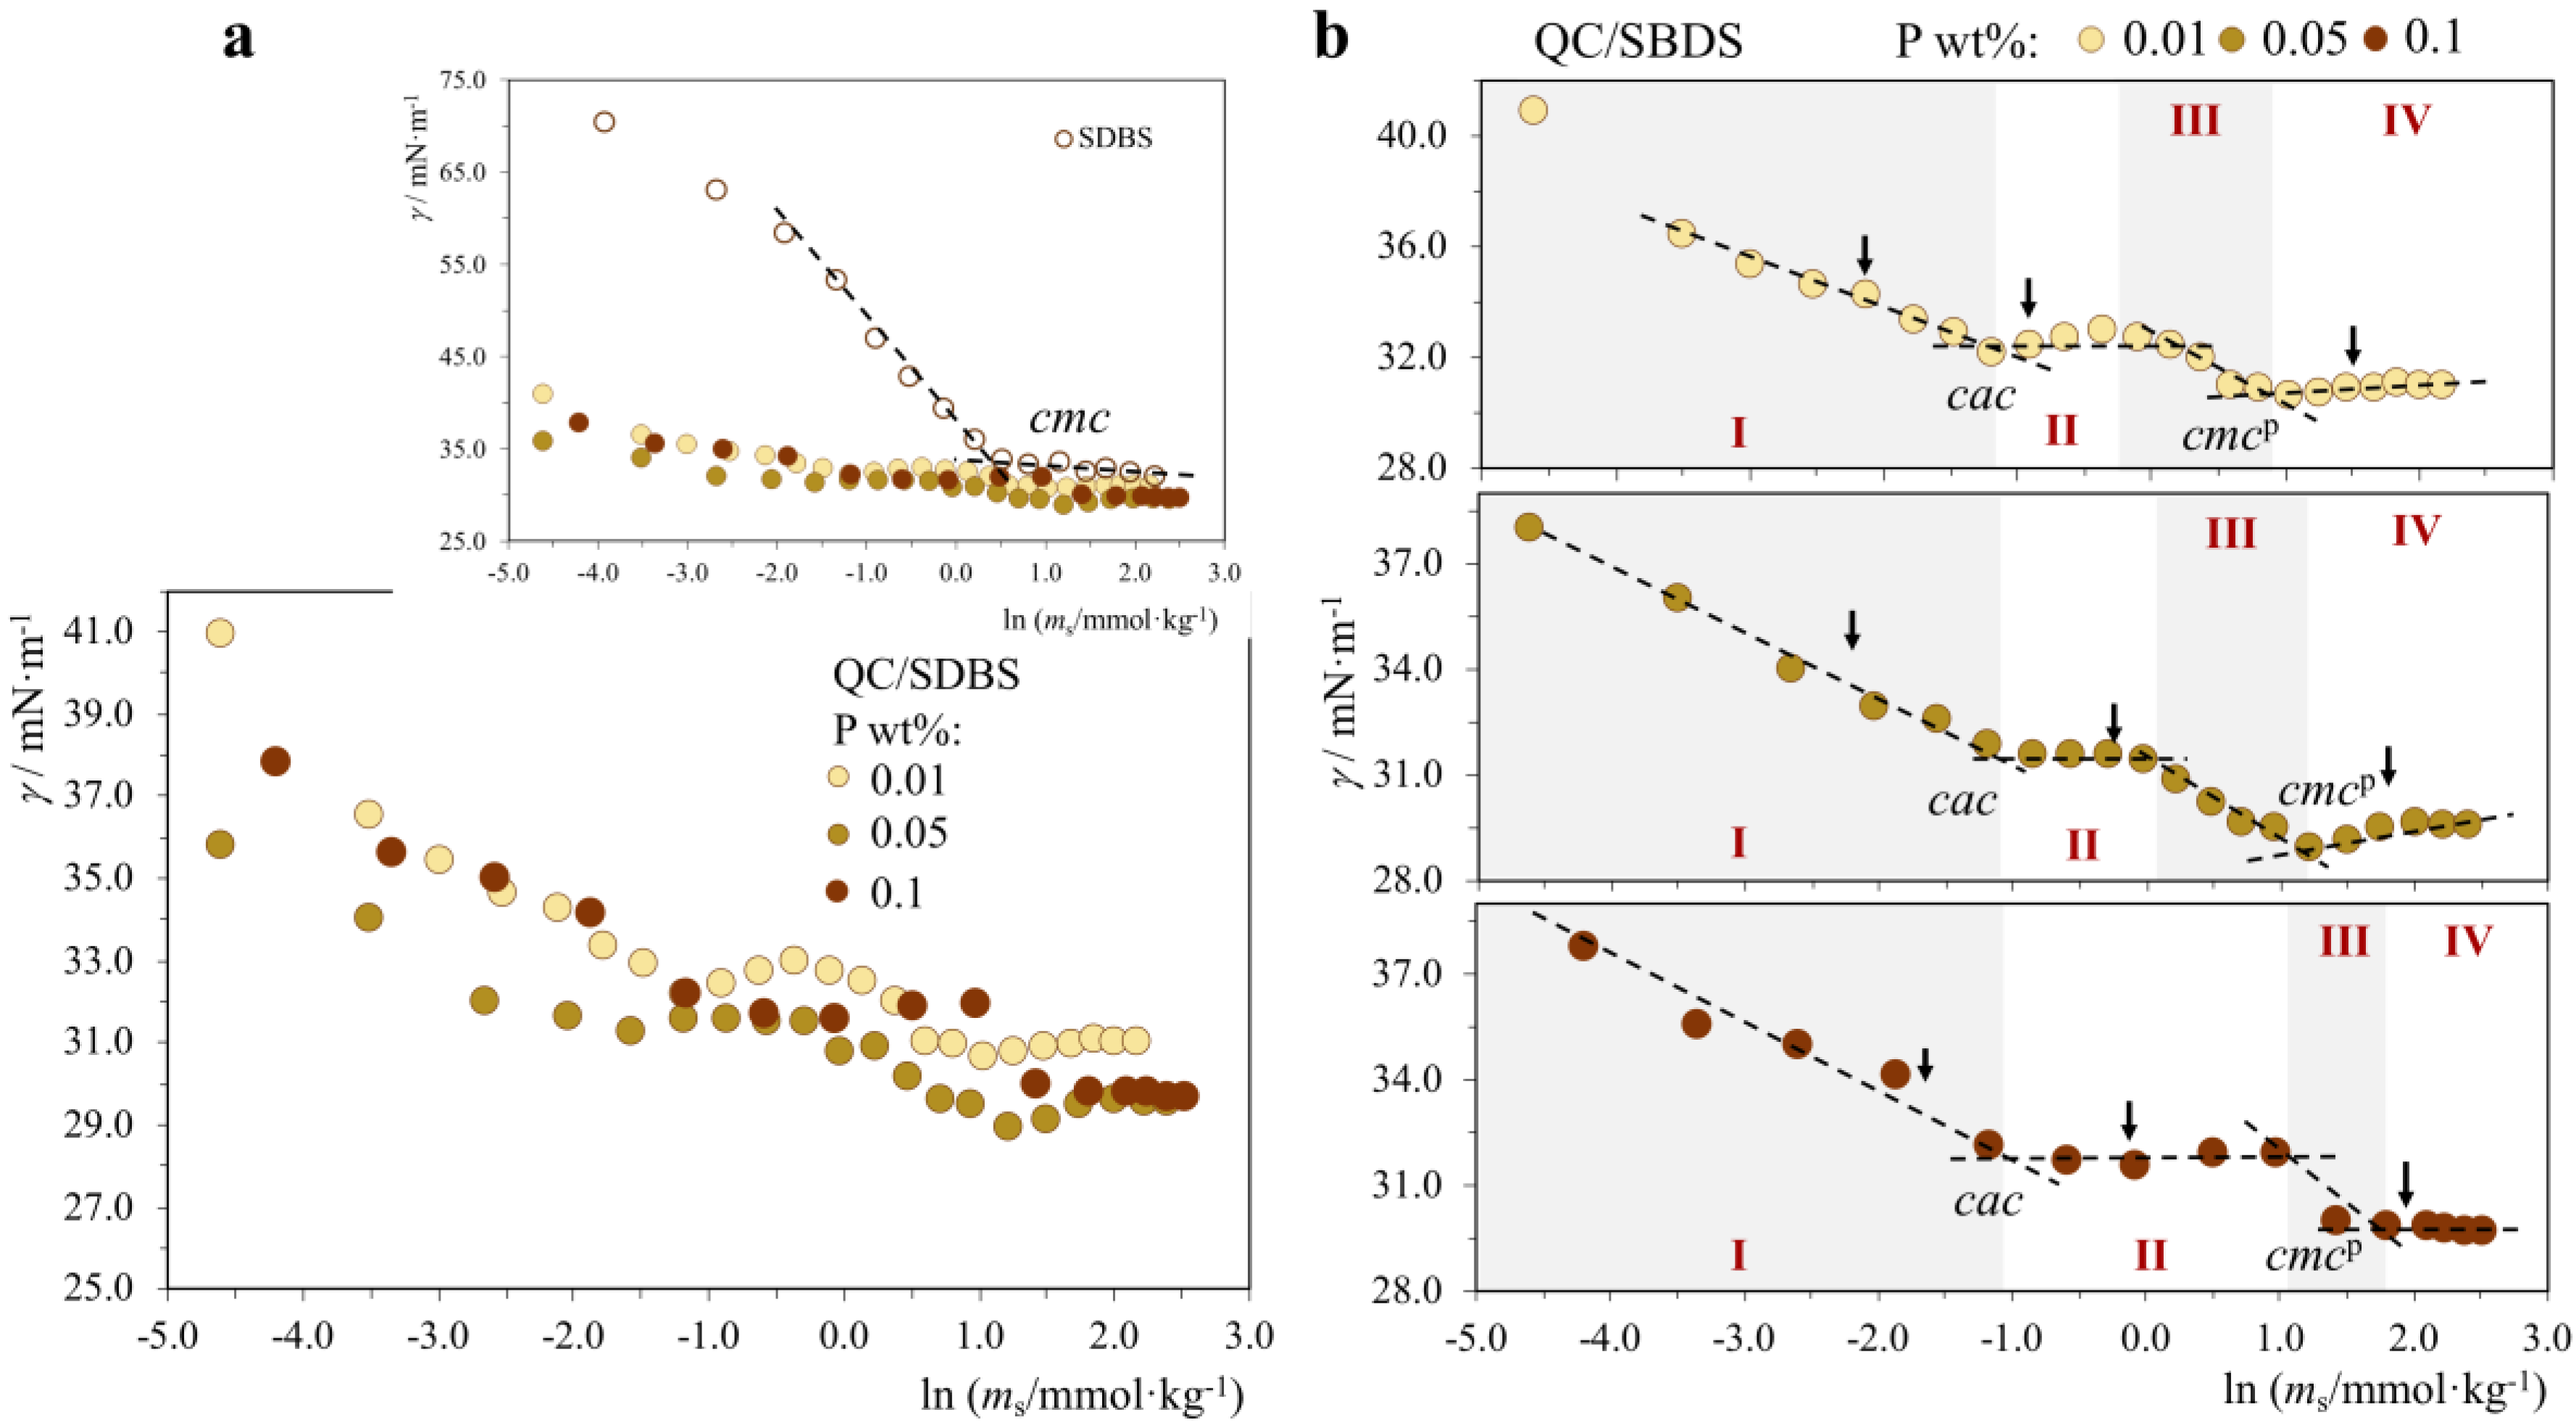
2.1.1. P−/S+ Systems: Strong Association

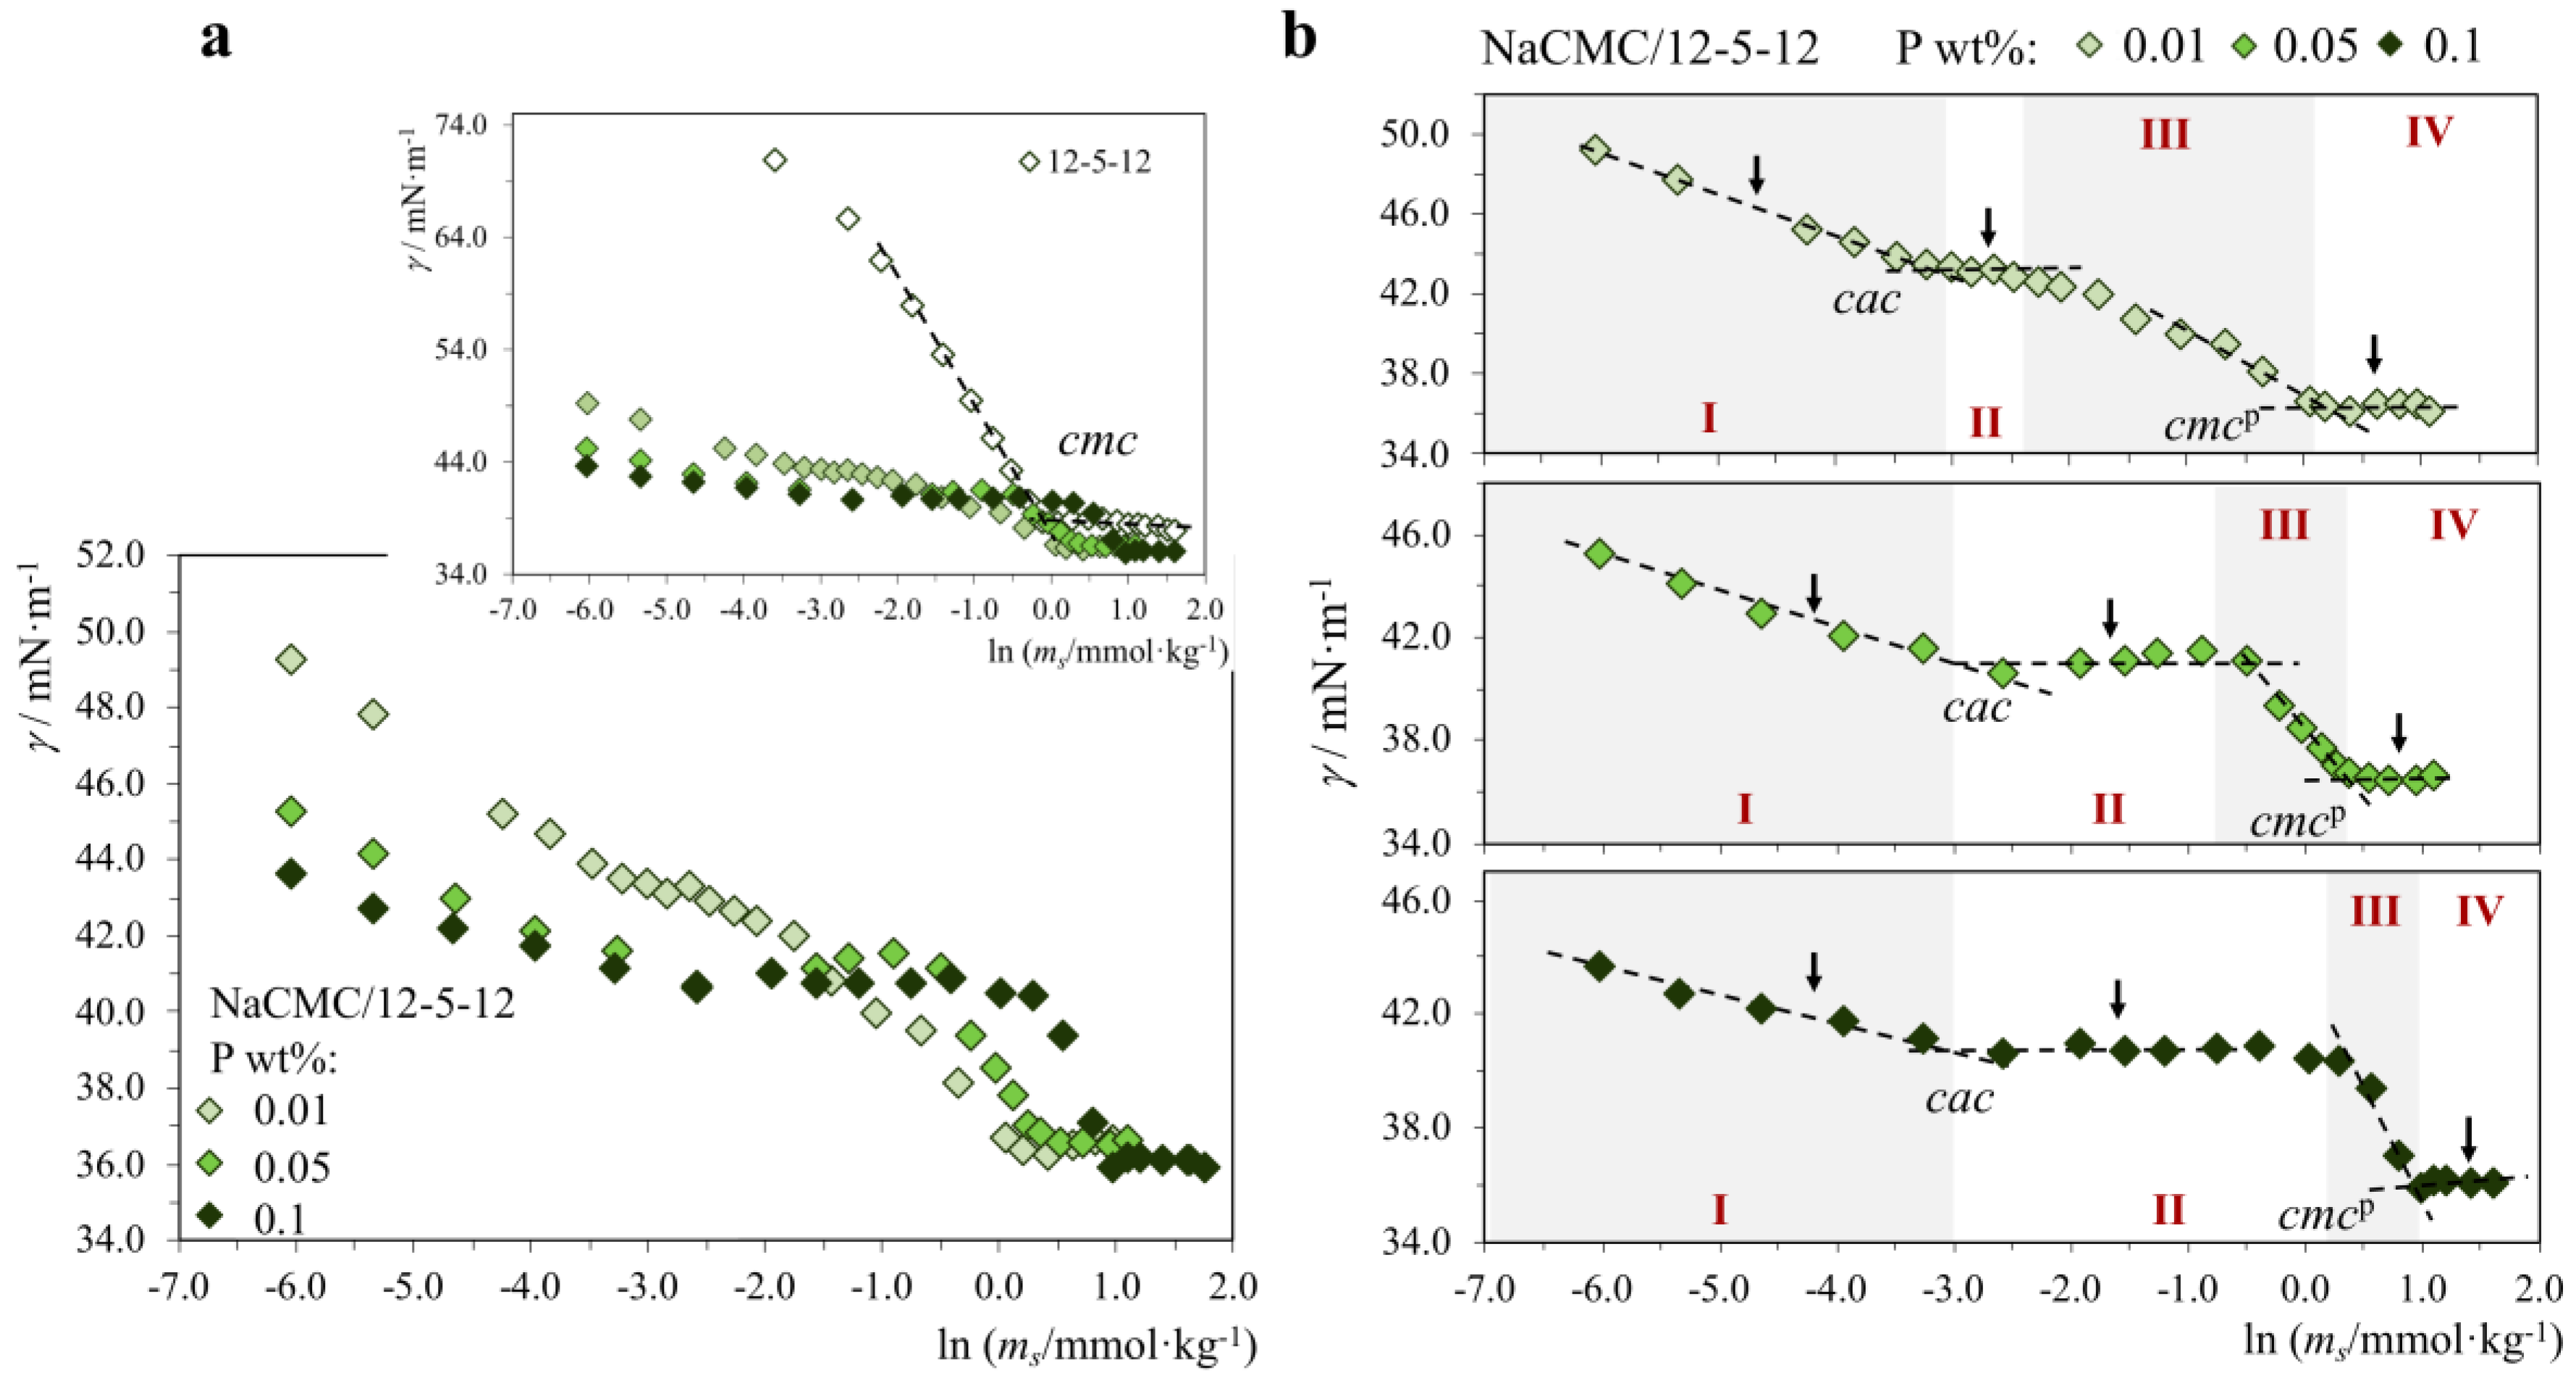
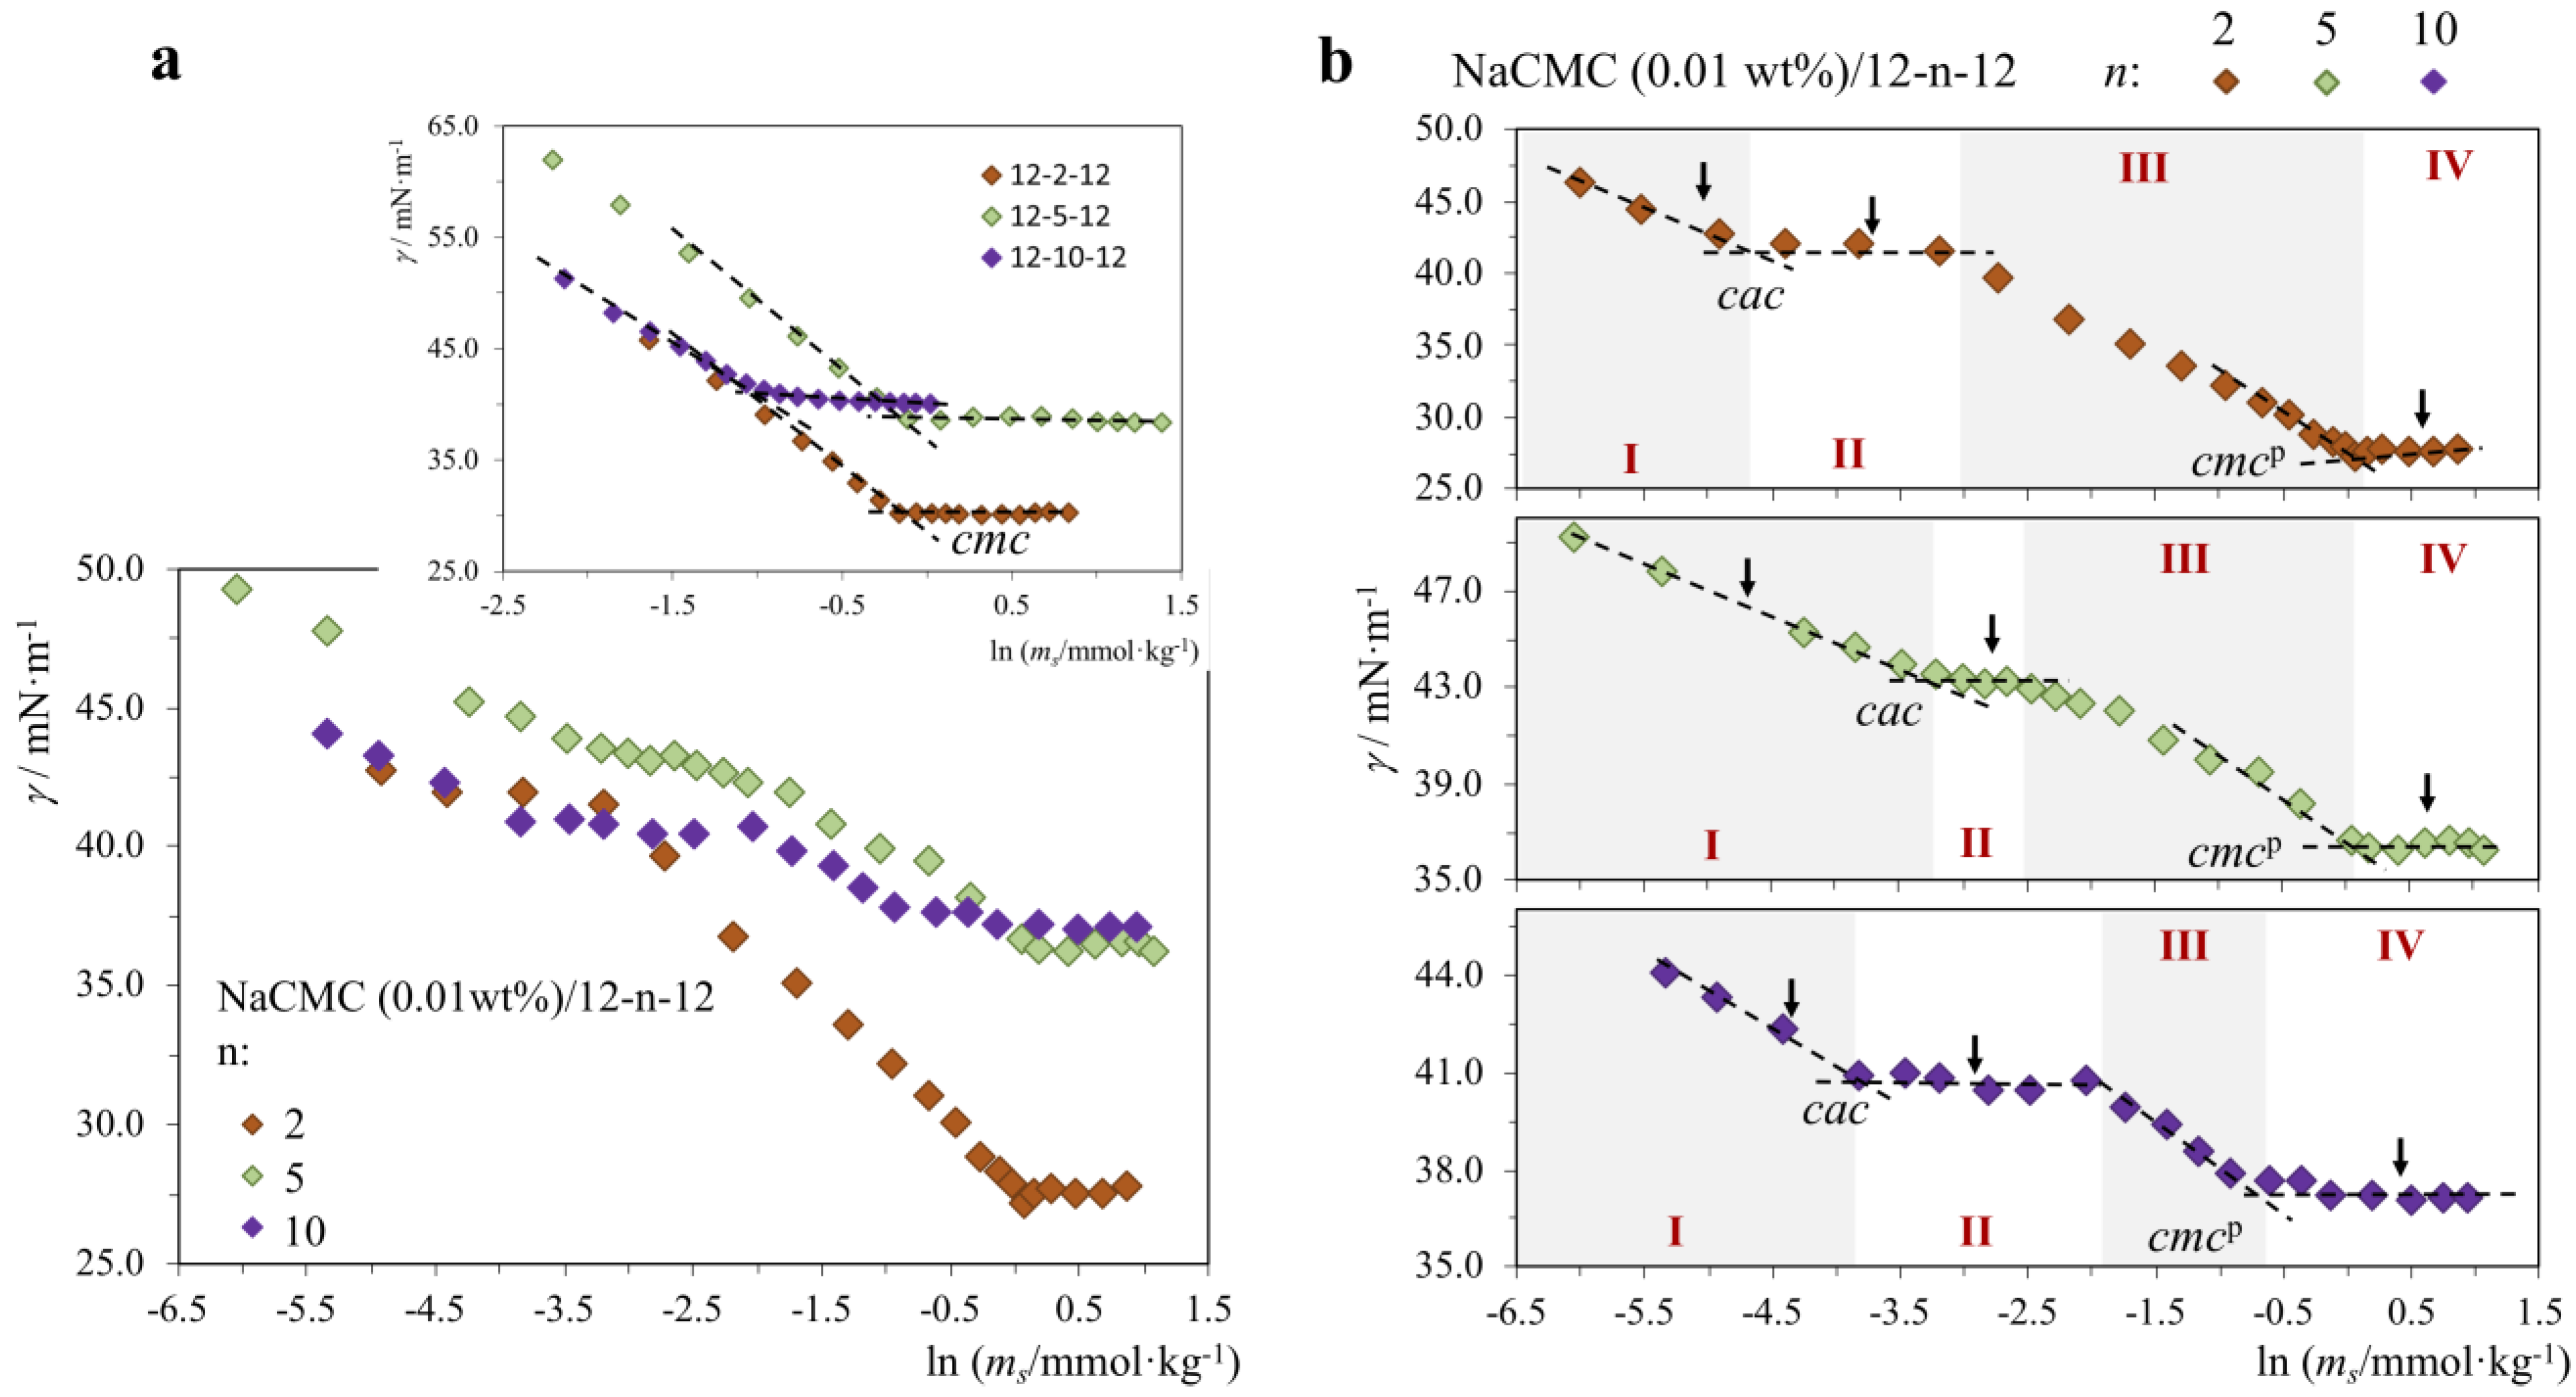
2.1.2. P+/S− Systems: Strong Association
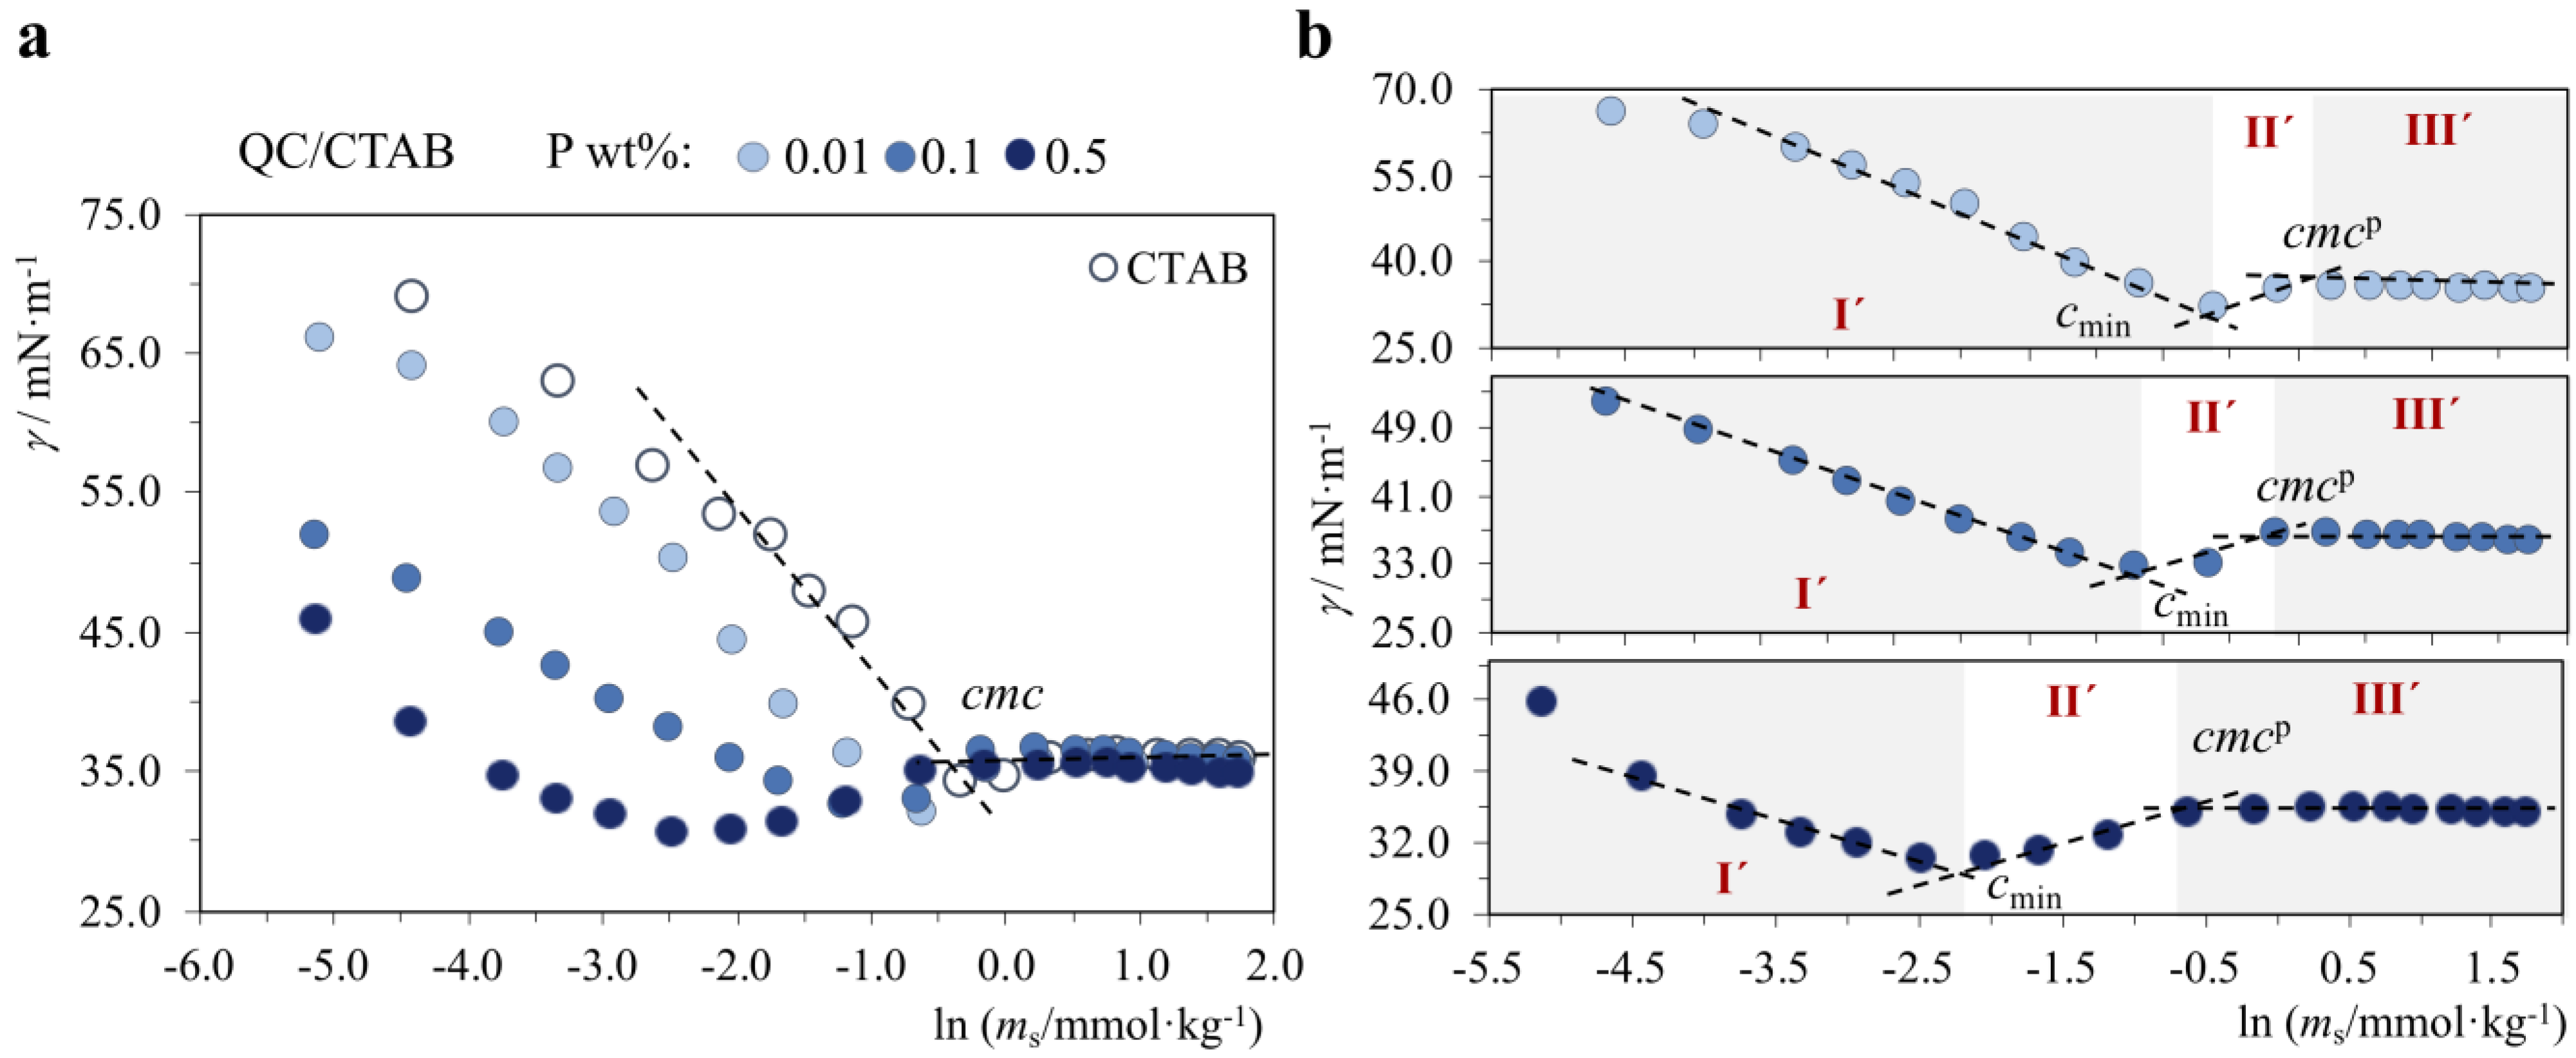
2.1.3. P+/S+, P−/S−, P+/S0 and P−/S0 Systems: No Interactions with the Exception of QC/CTAB
2.2. Effect of Polymer-Surfactant Interactions on Wettability

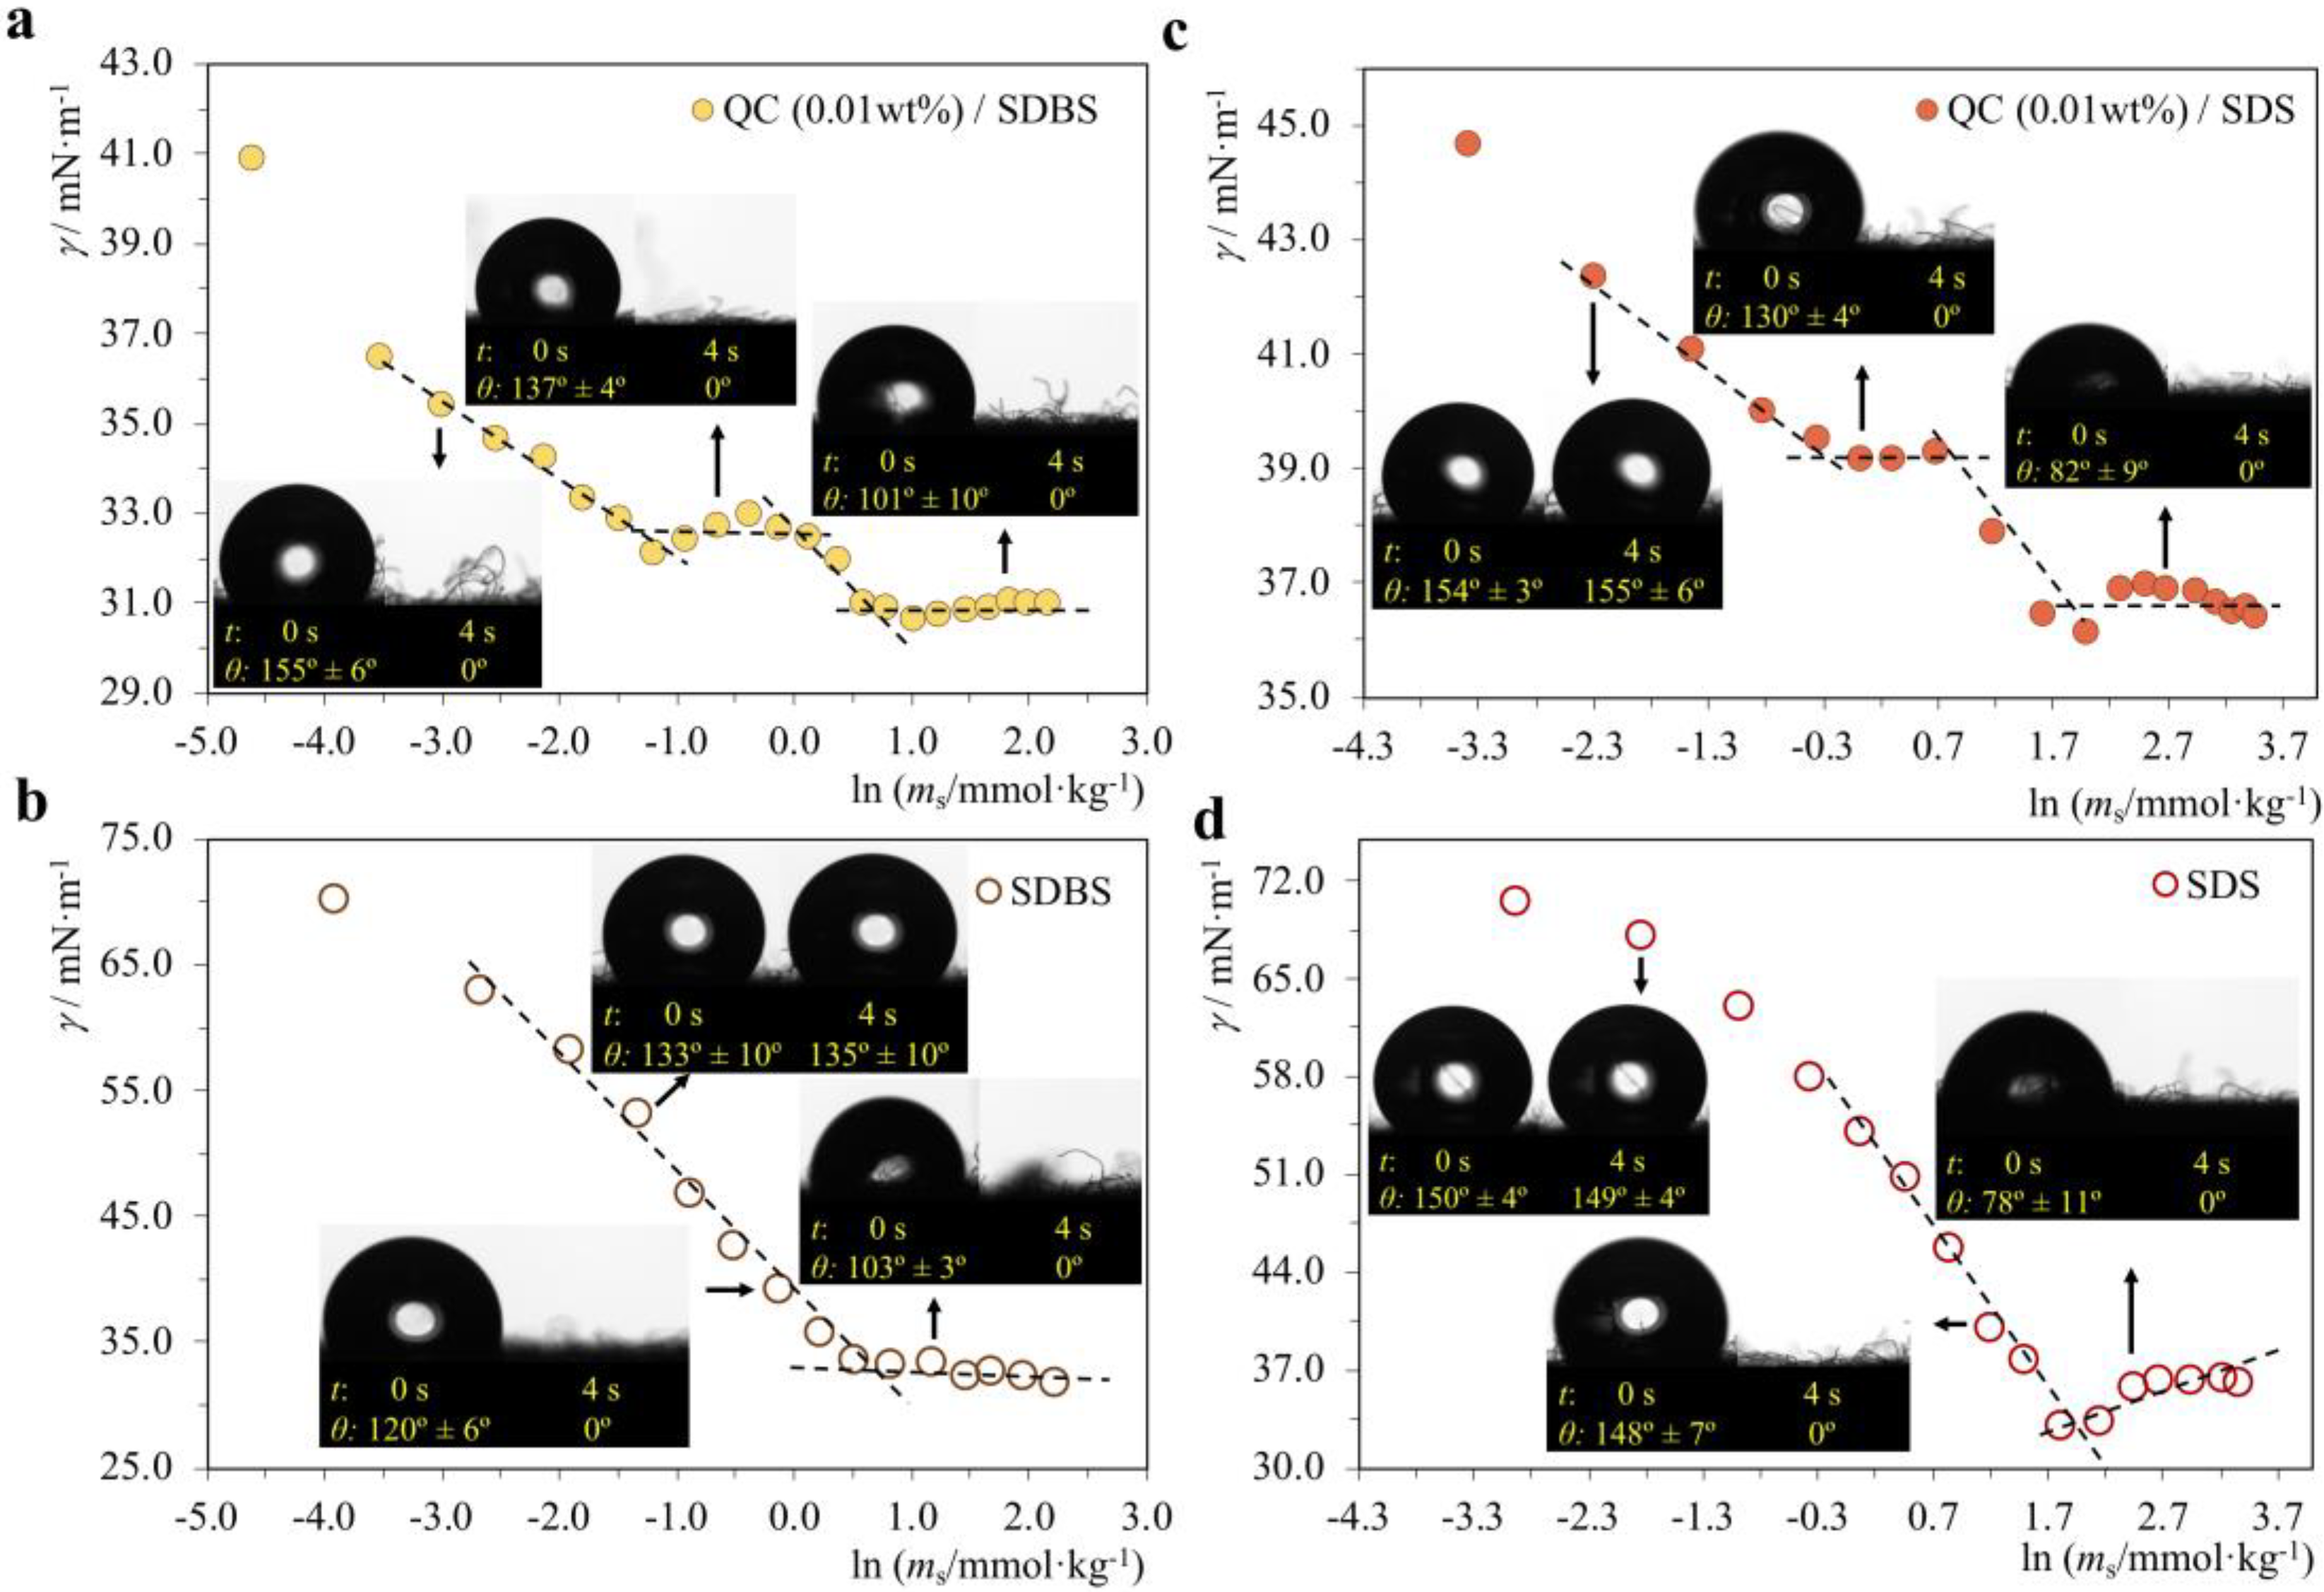
2.2.1. P−/S+ Systems
2.2.2. P+/S− Systems
3. Materials and Methods
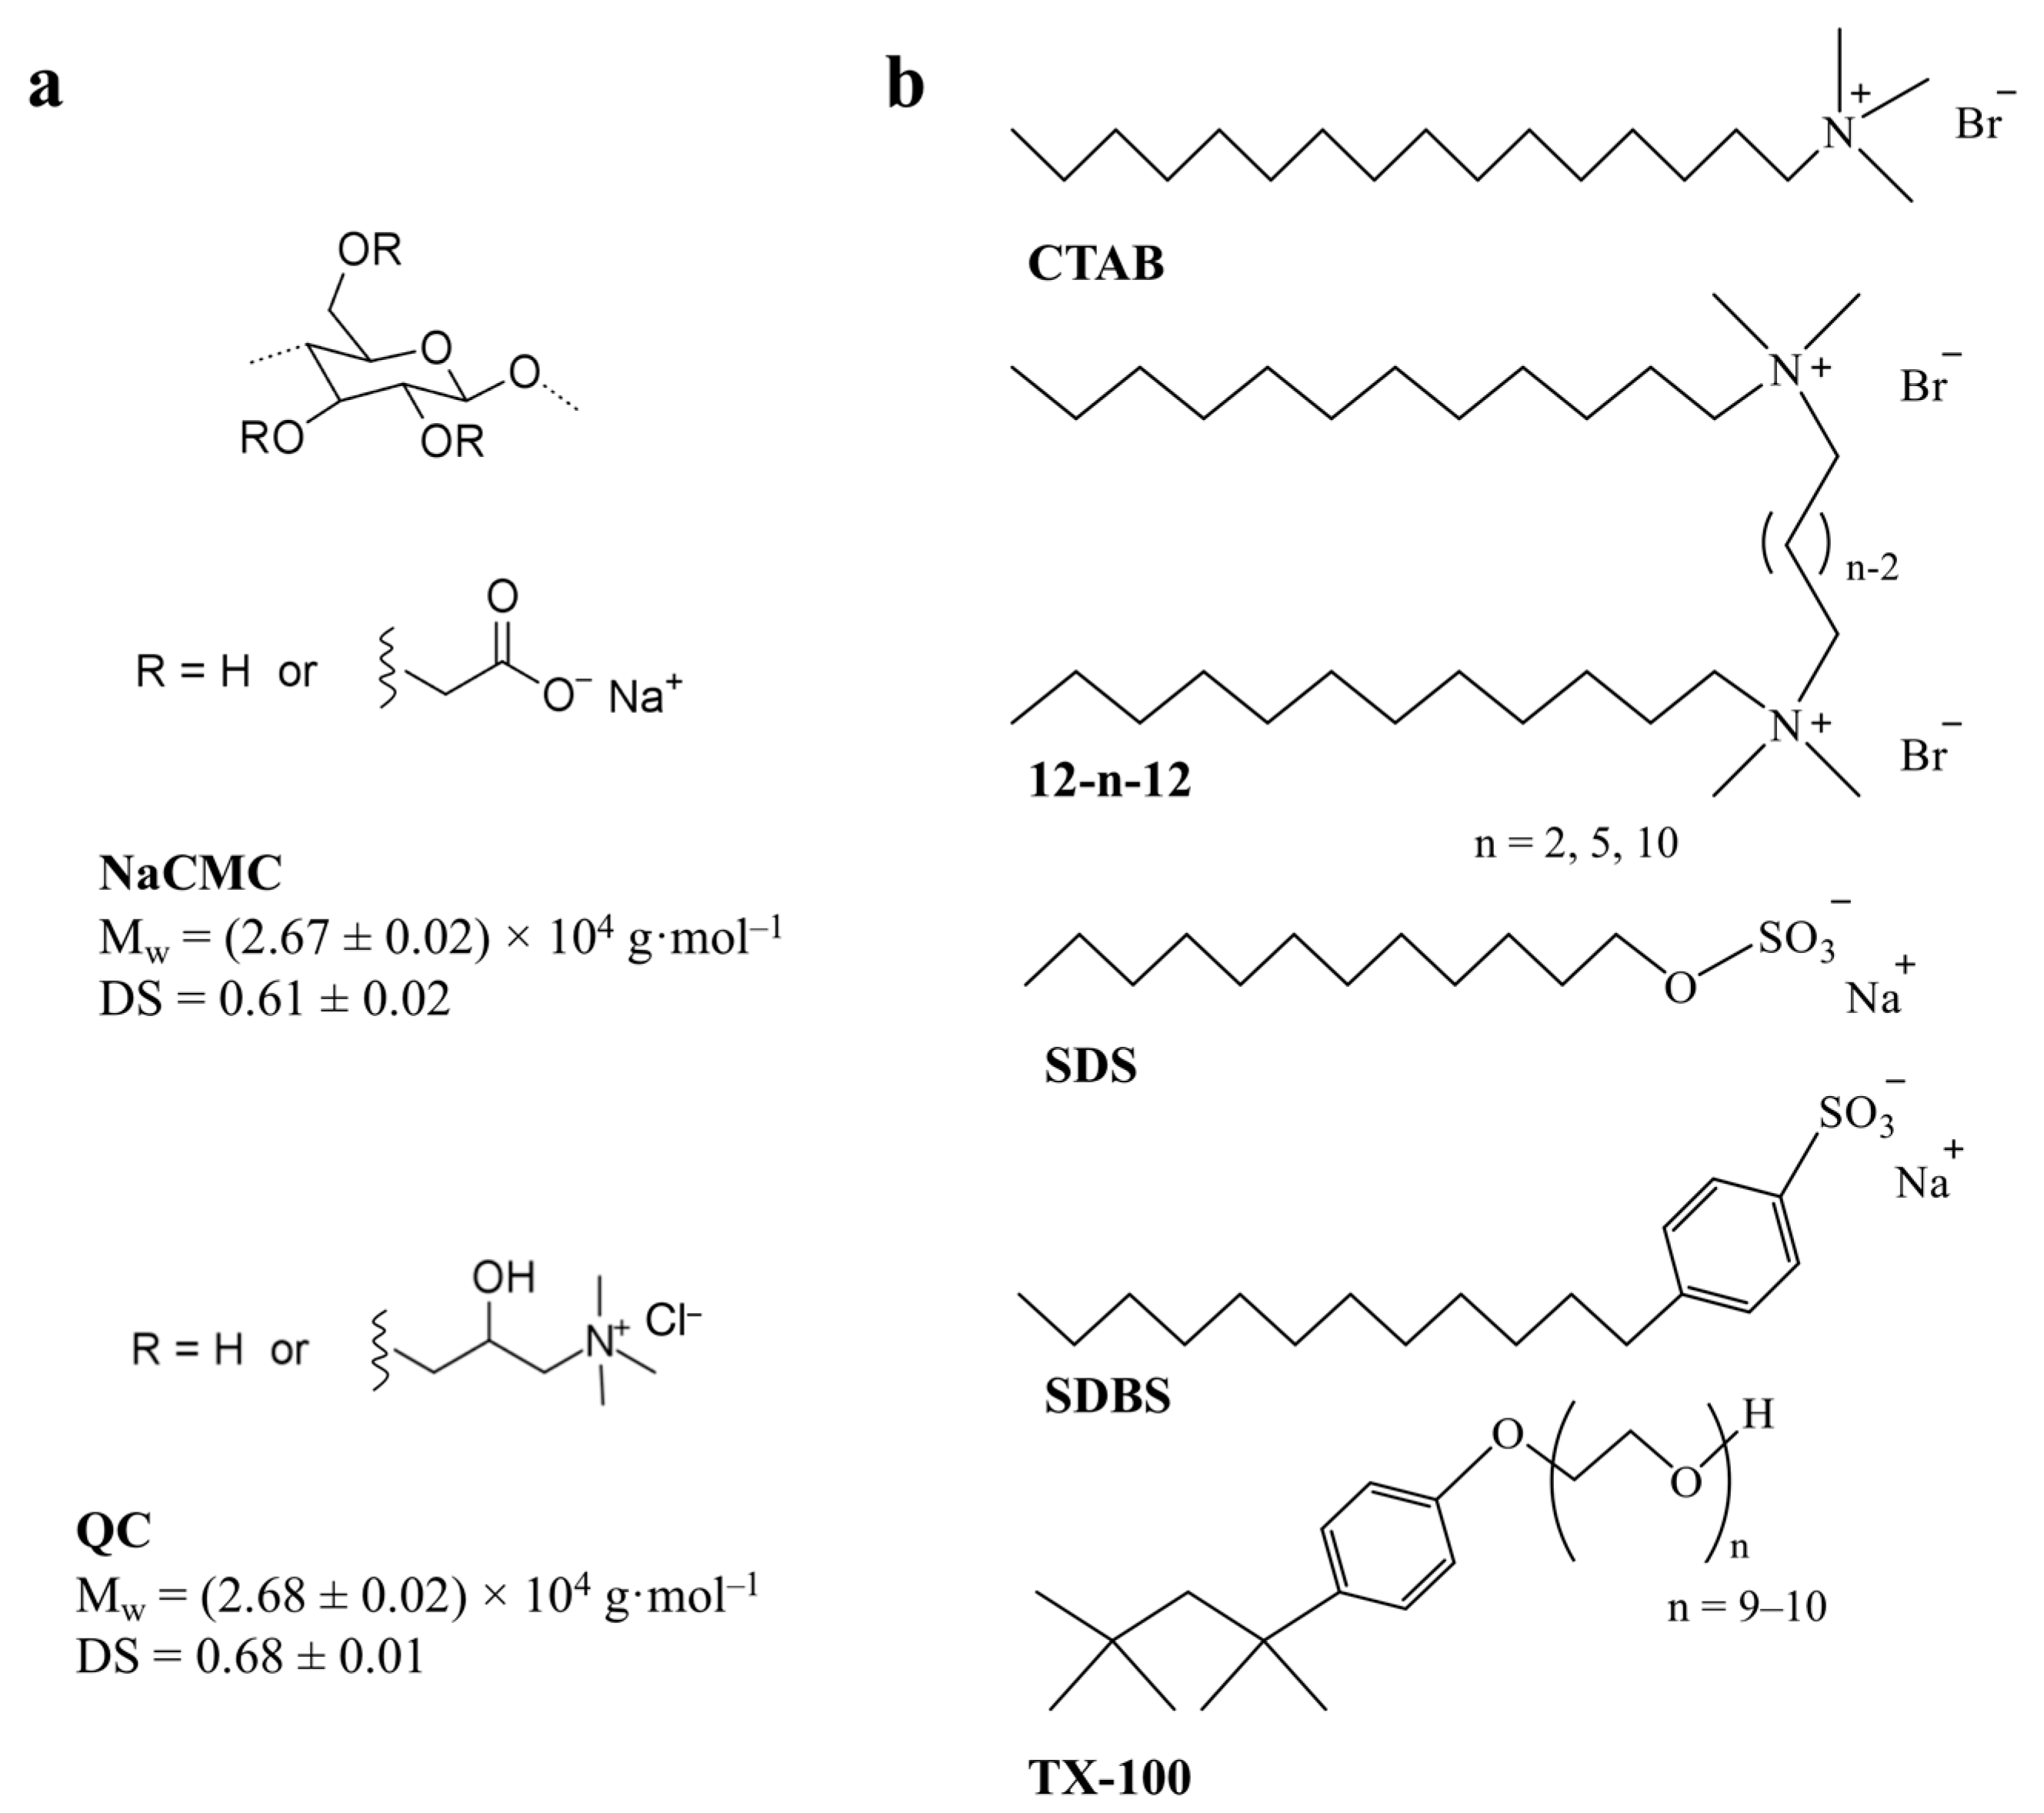
3.1. Synthesis of Sodium Carboxymethyl Cellulose (NaCMC)
3.2. Synthesis of Cationic Quaternized Cellulose (QC)
3.3. Surfactants
3.4. Sample Preparation
3.5. Surface Tension Studies
3.6. Zeta Potential and pH Studies
3.7. Contact Angle Measurements
4. Conclusions
Supplementary Materials
Author Contributions
Funding
Institutional Review Board Statement
Informed Consent Statement
Data Availability Statement
Acknowledgments
Conflicts of Interest
References
- Piculell, L.; Lindman, B. Association and segregation in aqueous polymer/polymer, polymer surfactant, and surfactant surfactant mixtures—Similarities and differences. Adv. Colloid Interface Sci. 1992, 41, 149–178. [Google Scholar] [CrossRef]
- Lindman, B.; Khan, A.; Marques, E.; Miguel, M.D.; Piculell, L.; Thalberg, K. Phase-behavior of polymer-surfactant systems in relation to polymer-polymer and surfactant-surfactant mixtures. Pure Appl. Chem. 1993, 65, 953–958. [Google Scholar] [CrossRef]
- Goddard, E.D. Polymer/surfactant interaction: Interfacial aspects. J. Colloid Interface Sci. 2002, 256, 228–235. [Google Scholar] [CrossRef]
- Chiappisi, L.; Hoffmann, I.; Gradzielski, M. Complexes of oppositely charged polyelectrolytes and surfactants—Recent developments in the field of biologically derived polyelectrolytes. Soft Matter 2013, 9, 3896. [Google Scholar] [CrossRef]
- Antunes, F.E.; Marques, E.F.; Miguel, M.G.; Lindman, B. Polymer-vesicle association. Adv. Colloid Interface Sci. 2009, 147–148, 18. [Google Scholar] [CrossRef] [PubMed]
- Antunes, F.E.; Marques, E.F.; Gomes, R.; Thuresson, K.; Lindman, B.; Miguel, M.G. Network formation of catanionic vesicles and oppositely charged polyelectrolytes. Effect of polymer charge density and hydrophobic modification. Langmuir 2004, 20, 4647–4656. [Google Scholar] [CrossRef] [PubMed]
- Burrows, H.D.; Valente, A.J.M.; Costa, T.; Stewart, B.; Tapia, M.J.; Scherf, U. What conjugated polyelectrolytes tell us about aggregation in polyelectrolyte/surfactant systems. J. Mol. Liq. 2015, 210, 82–99. [Google Scholar] [CrossRef]
- Guzmán, E.; Llamas, S.; Maestro, A.; Fernández-Peña, L.; Akanno, A.; Miller, R.; Ortega, F.; Rubio, R.G. Polymer-surfactant systems in bulk and at fluid interfaces. Adv. Colloid Interface Sci 2016, 233, 38–64. [Google Scholar] [CrossRef]
- Ritacco, H.A. Electro-optic Kerr effect in the study of mixtures of oppositely charged colloids. The case of polymer-surfactant mixtures in aqueous solutions. Adv. Colloid Interface Sci. 2017, 247, 234. [Google Scholar] [CrossRef] [PubMed]
- Mal, A.; Saha, A.; Dinda, G.; Ghosh, S. Effect of carbohydrate based polymers on worm-like micelles of cetyltrimethylammonium p-toluenesulfonate in aqueous media: Detail physicochemical and antimicrobial properties survey. J. Mol. Liq. 2020, 299, 112153. [Google Scholar] [CrossRef]
- Bain, C.D.; Claesson, P.M.; Langevin, D.; Meszaros, R.; Nylander, T.; Stubenrauch, C.; Titmuss, S.; von Klitzing, R. Complexes of surfactants with oppositely charged polymers at surfaces and in bulk. Adv. Colloid Interface Sci. 2010, 155, 32–49. [Google Scholar] [CrossRef]
- Peetla, C.; Stine, A.; Labhasetwar, V. Biophysical Interactions with Model Lipid Membranes: Applications in Drug Discovery and Drug Delivery. Mol. Pharm. 2009, 6, 1264. [Google Scholar] [CrossRef]
- Green, R.J.; Burnhams, H.; Howgego, J.; Gitonga, N.; Odubanjo, S.; Greco, F. The effect of polymer architecture on polymer-lipid interactions within biological membranes. J. Pharm. Pharmacol. 2010, 62, 1306–1307. [Google Scholar]
- Peyret, A.; Ibarboure, E.; Le Meins, J.F.; Lecommandoux, S. Asymmetric Hybrid Polymer-Lipid Giant Vesicles as Cell Membrane Mimics. Adv. Sci. 2018, 5, 1700453. [Google Scholar] [CrossRef] [PubMed]
- Di Leone, S.; Avsar, S.Y.; Belluati, A.; Wehr, R.; Palivan, C.G.; Meier, W. Polymer-Lipid Hybrid Membranes as a Model Platform to Drive Membrane-Cytochrome c Interaction and Peroxidase-like Activity. J. Phys. Chem. B 2020, 124, 4454–4465. [Google Scholar] [CrossRef] [PubMed]
- Sharipova, A.A.; Aidarova, S.B.; Mutaliyeva, B.Z.; Babayev, A.A.; Issakhov, M.; Issayeva, A.B.; Madybekova, G.M.; Grigoriev, D.O.; Miller, R. The Use of Polymer and Surfactants for the Microencapsulation and Emulsion Stabilization. Colloids Interfaces 2017, 1, 3. [Google Scholar] [CrossRef]
- Oikonomou, E.K.; Mousseau, F.; Christov, N.; Cristobal, G.; Vacher, A.; Airiau, M.; Bourgaux, C.; Heux, L.; Berret, J.F. Fabric Softener-Cellulose Nanocrystal Interaction: A Model for Assessing Surfactant Deposition on Cotton. J. Phys. Chem. B 2017, 121, 2299–2307. [Google Scholar] [CrossRef] [PubMed]
- Bai, D.; Khin, C.C.; Chen, S.B.; Tsai, C.C.; Chen, B.H. Interaction between a nonionic surfactant and a hydrophobically modified 2-hydroxyethyl cellulose. J. Phys. Chem. B 2005, 109, 4909–4916. [Google Scholar] [CrossRef]
- Malkin, A.Y.; Zuev, K.V.; Arinina, M.P.; Kulichikhin, V.G. Modifying the viscosity of heavy crude oil using surfactants and polymer additives. Energ. Fuels 2018, 32, 11991–11999. [Google Scholar] [CrossRef]
- Wang, W.; Sande, S.A. Kinetics of re-equilibrium of oppositely charged hydrogel-surfactant system and its application in controlled release. Langmuir 2013, 29, 6697–6705. [Google Scholar] [CrossRef] [PubMed]
- Jabeen, S.; Chat, O.A.; Maswal, M.; Ashraf, U.; Rather, G.M.; Dar, A.A. Hydrogels of sodium alginate in cationic surfactants: Surfactant dependent modulation of encapsulation/release toward Ibuprofen. Carbohydr. Polym. 2015, 133, 144–153. [Google Scholar] [CrossRef] [PubMed]
- Abreu, B.; Pires, A.S.; Guimarães, A.; Fernandes, R.M.F.; Oliveira, I.S.; Marques, E.F. Polymer/surfactant mixtures as dispersants and non-covalent functionalization agents of multiwalled carbon nanotubes: Synergism, morphological characterization and molecular picture. J. Mol. Liq. 2022, 347, 118338. [Google Scholar] [CrossRef]
- Ali, M.; Khan, N.R.; Basit, H.M.; Mahmood, S. Physico-chemical based mechanistic insight into surfactant modulated sodium Carboxymethylcellulose film for skin tissue regeneration applications. J. Polym. Res. 2019, 27, 20. [Google Scholar] [CrossRef]
- Maltesh, C.; Somasundaran, P. Polymers as rheology modifiers. Colloids Surf. 1992, 65, 231–308. [Google Scholar] [CrossRef]
- Frugier, D.; Audebert, R. Interaction Between Oppositely Charged Low Ionic Density Polyelectrolytes: Complex Formation or Simple Mixture? In Macromolecular Complexes in Chemistry and Biology; Dubin, P., Bock, J., Davies, D.N., Thies, C., Eds.; Springer: Berlin/Heidelberg, Germany, 1994. [Google Scholar]
- Goddard, E.D. Polymer/surfactant interaction—Its relevance to detergent systems. J. Am. Oil Chem. Soc. 1994, 71, 1–16. [Google Scholar] [CrossRef]
- Thuresson, K.; Lindman, B.; Nyström, B. Effect of hydrophobic modification of a nonionic cellulose derivative on the interaction with surfactants. Rheology. J. Phys. Chem. B 1997, 101, 6450–6459. [Google Scholar] [CrossRef]
- Petrovic, L.B.; Sovilj, V.J.; Katona, J.M.; Milanovic, J.L. Influence of polymer-surfactant interactions on o/w emulsion properties and microcapsule formation. J. Colloid Interface Sci. 2010, 342, 333–339. [Google Scholar] [CrossRef] [PubMed]
- Carlsson, A.; Karlström, G.; Lindman, B.; Stenberg, O. Interaction between ethyl(hydroxyethyl)cellulose and sodium dodecyl sulphate in aqueous solution. Colloid Polym. Sci. 1988, 266, 1031–1036. [Google Scholar] [CrossRef]
- Zana, R.; Binana-Limbelé, W.; Kamenka, N.; Lindman, B. Ethyl(hydroxyethyl)cellulose-cationic surfactant interactions: Electrical conductivity, self-diffusion, and time-resolved fluorescence quenching investigations. J. Phys. Chem. 1992, 96, 5461–5465. [Google Scholar] [CrossRef]
- Das, S.; Mondal, S.; Ghosh, S. Interaction of cationic gemini surfactant tetramethylene-1,4-bis(dimethyltetradecylammonium bromide) with anionic polyelectrolyte sodium carboxymethyl cellulose, with two different molar masses, in aqueous and aquo-organic (isopropanol) media. Rsc Adv. 2016, 6, 30795–30803. [Google Scholar] [CrossRef]
- Wang, R.J.; Yan, H.T.; Ma, W.W.; Li, Y.H. Complex formation between cationic gemini surfactant and sodium carboxymethylcellulose in the absence and presence of organic salt. Colloids Surf. A 2016, 509, 293–300. [Google Scholar] [CrossRef]
- Tardy, B.L.; Yokota, S.; Ago, M.; Xiang, W.; Kondo, T.; Bordes, R.; Rojas, O.J. Nanocellulose–surfactant interactions. Current Opin. Colloid Interface Sci. 2017, 29, 57–67. [Google Scholar] [CrossRef]
- Bhardwaj, P.; Kamil, M.; Panda, M. Surfactant-polymer interaction: Effect of hydroxypropylmethyl cellulose on the surface and solution properties of gemini surfactants. Colloid Polym. Sci. 2018, 296, 1879–1889. [Google Scholar] [CrossRef]
- Bao, H.; Xing, H.; Liu, M.; Zhang, Q.; Yan, H.; Liu, J. Effects of polymer concentration and type on the interactions between 1-methyl-3-tetradecylimidazolium bromide and polymers in aqueous solution. J. Dispersion Sci. Technol. 2020, 41, 2116–2127. [Google Scholar] [CrossRef]
- Yang, J.; Pal, R. Investigation of Surfactant-Polymer Interactions Using Rheology and Surface Tension Measurements. Polymers 2020, 12, 2302. [Google Scholar] [CrossRef] [PubMed]
- Murphy, D.S. Fabric Softener Technology: A Review. J. Surfactants Deterg. 2015, 18, 199–204. [Google Scholar] [CrossRef]
- Oikonomou, E.K.; Christov, N.; Cristobal, G.; Bourgaux, C.; Heux, L.; Boucenna, I.; Berret, J.F. Design of eco-friendly fabric softeners: Structure, rheology and interaction with cellulose nanocrystals. J. Colloid Interface Sci. 2018, 525, 206–215. [Google Scholar] [CrossRef] [PubMed]
- Sivaramakrishnan, C.N. The use of surfactants in the finishing of technical textiles. In Advances in the Dyeing and Finishing of Technical Textiles; Woodhead Publishing: Sawston, UK, 2013; pp. 199–235. [Google Scholar]
- Teli, M. Softening finishes for textiles and clothing. In Functional Finishes for Textiles; Woodhead Publishing: Sawston, UK, 2015; pp. 123–152. [Google Scholar]
- Costa, C.; Viana, A.; Silva, C.; Marques, E.F.; Azoia, N.G. Recycling of textile wastes, by acid hydrolysis, into new cellulosic raw materials. Waste Manag. 2022, 153, 99–109. [Google Scholar] [CrossRef] [PubMed]
- Rahman, M.S.; Hasan, M.S.; Nitai, A.S.; Nam, S.; Karmakar, A.K.; Ahsan, M.S.; Shiddiky, M.J.A.; Ahmed, M.B. Recent Developments of Carboxymethyl Cellulose. Polymers 2021, 13, 1345. [Google Scholar] [CrossRef]
- Chakraborty, T.; Chakraborty, I.; Ghosh, S. Sodium carboxymethylcellulose-CTAB interaction: A detailed thermodynamic study of polymer-surfactant interaction with opposite charges. Langmuir 2006, 22, 9905–9913. [Google Scholar] [CrossRef]
- Liu, R.C.W.; Morishima, Y.; Winnik, F.M. Composition-dependent rheology of aqueous systems of amphiphilic sodium poly(2-acrylamido-2-methylpropanesulfonates) in the presence of a hydrophobically modified cationic cellulose ether. Macromolecules 2003, 36, 4967–4975. [Google Scholar] [CrossRef]
- Terada, E.; Samoshina, Y.; Nylander, T.; Lindman, B. Adsorption of cationic cellulose derivative/anionic surfactant complexes onto solid surfaces. II. Hydrophobized silica surfaces. Langmuir 2004, 20, 6692–6701. [Google Scholar] [CrossRef] [PubMed]
- Zhao, S.J.; Cheng, F.; Chen, Y.; Wei, Y.P. The interactions between cationic cellulose and Gemini surfactant in aqueous solution. Carbohydr. Polym. 2016, 141, 68–74. [Google Scholar] [CrossRef] [PubMed]
- Li, Y.Q.; Ma, S.Y.; Fang, X.; Wu, C.X.; Chen, H.L.; Zhang, W.Q.; Cao, M.W.; Liu, J.G. Water hardness effect on the association and adsorption of cationic cellulose derivative/anionic surfactant mixtures for fabric softener application. Colloids Surf. A 2021, 626, 12. [Google Scholar] [CrossRef]
- Del Sorbo, G.R.; Clemens, D.; Schneck, E.; Hoffmann, I. Stimuli-responsive polyelectrolyte surfactant complexes for the reversible control of solution viscosity. Soft Matter 2022, 18, 2434–2440. [Google Scholar] [CrossRef]
- Hoffmann, I.; Heunemann, P.; Prevost, S.; Schweins, R.; Wagner, N.J.; Gradzielski, M. Self-Aggregation of Mixtures of Oppositely Charged Polyelectrolytes and Surfactants Studied by Rheology, Dynamic Light Scattering and Small-Angle Neutron Scattering. Langmuir 2011, 27, 4386–4396. [Google Scholar] [CrossRef] [PubMed]
- Calejo, M.T.; Kjoniksen, A.L.; Marques, E.F.; Araujo, M.J.; Sande, S.A.; Nystrom, B. Interactions between ethyl(hydroxyethyl) cellulose and lysine-based surfactants in aqueous media. Eur. Polym. J. 2012, 48, 1622. [Google Scholar] [CrossRef]
- Oliveira, I.S.; Silva, J.P.N.; Araujo, M.J.; Gomes, A.C.; Marques, E.F. Biocompatible thermosensitive nanostructures and hydrogels of an amino acid-derived surfactant and hydroxyethyl cellulose polymers. J. Mol. Liq. 2021, 322, 14. [Google Scholar] [CrossRef]
- Abreu, B.; Rocha, J.; Fernandes, R.M.F.; Regev, O.; Furo, I.; Marques, E.F. Gemini surfactants as efficient dispersants of multiwalled carbon nanotubes: Interplay of molecular parameters on nanotube dispersibility and debundling. J. Colloid Interface Sci. 2019, 547, 69–77. [Google Scholar] [CrossRef]
- Fernandes, R.M.F.; Wang, Y.J.; Tavares, P.B.; Nunes, S.C.C.; Pais, A.; Marques, E.F. Critical Role of the Spacer Length of Gemini Surfactants on the Formation of Ionic Liquid Crystals and Thermotropic Behavior. J. Phys. Chem. B 2017, 121, 10583–10592. [Google Scholar] [CrossRef]
- Zana, R. Dimeric and oligomeric surfactants. Behavior at interfaces and in aqueous solution: A review. Adv. Colloid Interface Sci. 2002, 97, 205–253. [Google Scholar] [CrossRef] [PubMed]
- Burrows, H.D.; Tapia, M.J.; Silva, C.L.; Pais, A.; Fonseca, S.M.; Pina, J.; de Melo, J.S.; Wang, Y.J.; Marques, E.F.; Knaapila, M.; et al. Interplay of electrostatic and hydrophobic effects with binding of cationic gemini surfactants and a conjugated polyanion: Experimental and molecular modeling studies. J. Phys. Chem. B 2007, 111, 4401–4410. [Google Scholar] [CrossRef] [PubMed]
- Xiao, Y.C.; Meshitsuka, G. Development of high-retention water absorbent from cellulosic materials: Water absorbent from bleached kraft pulp. J. Wood Sci. 2001, 47, 394–399. [Google Scholar] [CrossRef]
- Menger, F.M.; Littau, C. Gemini-surfactants: Synthesis and properties. J. Am. Chem. Soc. 1991, 113, 1451–1452. [Google Scholar] [CrossRef]

| Interfacial Properties | ||||
|---|---|---|---|---|
| cNaCMC/wt% | CTAB | |||
| 0.01 | 0.05 | 0.1 | ||
| cac/mmol·kg−1 | 0.038 ± 0.005 | 0.041 ± 0.007 | 0.035 ± 0.004 | --- |
| cmcp/mmol·kg−1 | 1.3 ± 0.1 | 3.0 ± 0.6 | 4.4 ± 0.9 | --- |
| cmc/mmol·kg−1 | --- | --- | --- | 0.95 ± 0.04 |
| γcac/mN·m−1 | 41.8 ± 0.3 | 40.1 ± 0.2 | 39.7 ± 0.3 | --- |
| γcmcp/mN·m−1 | 34.2 ± 0.2 | 34.0 ± 0.5 | 33.8 ± 0.2 | --- |
| γcmc/mN·m−1 | --- | --- | --- | 33.1 ± 0.2 |
| Zeta Potential and pH | ||||
| cNaCMC/wt% | mCTAB/mmol·kg−1 | ζ /mV | pH | |
| 0.01 | 0 | −43 ± 1 | 7.4 ± 0.3 | |
| 0.010 | −49 ± 2 | 7.0 ± 0.1 | ||
| 0.10 | −37 ± 1 | 7.0 ± 0.5 | ||
| 10 | +35 ± 2 | 6.4 ± 0.3 | ||
| 0.05 | 0 | −46 ± 2 | 7.0 ± 0.2 | |
| 0.010 | −48 ± 1 | 6.8 ± 0.1 | ||
| 0.20 | −40 ± 1 | 6.8 ± 0.2 | ||
| 10 | +32 ± 1 | 6.6 ± 0.4 | ||
| 0.1 | 0 | −44 ± 2 | 7.5 ± 0.2 | |
| 0.010 | −50 ± 1 | 7.1 ± 0.2 | ||
| 0.20 | −41 ± 1 | 7.2 ± 0.2 | ||
| 10 | +34 ± 1 | 7.0 ± 0.4 | ||
| 0 | 10 | +42 ± 2 | 5.9 ± 0.1 | |
| Interfacial Properties | ||||
|---|---|---|---|---|
| cNaCMC/wt% | 12-5-12 | |||
| 0.01 | 0.05 | 0.1 | ||
| cac/mmol·kg−1 | 0.041 ± 0.001 | 0.061 ± 0.004 | 0.064 ± 0.009 | --- |
| cmcp/mmol·kg−1 | 1.30 ± 0.09 | 1.48 ± 0.07 | 2.65 ± 0.08 | --- |
| cmc/mmol·kg−1 | --- | --- | --- | 0.87 ± 0.02 |
| γcac/mN·m−1 | 43.4 ± 0.6 | 40.6 ± 0.3 | 40.7 ± 0.1 | --- |
| γcmcp/mN·m−1 | 36.2 ± 0.5 | 36.4 ± 0.9 | 36.0 ± 0.1 | --- |
| γcmc/mN·m−1 | --- | --- | --- | 38.4 ± 0.8 |
| Zeta Potential and pH | ||||
| cNaCMC/wt% | m12-5-12/mmol·kg−1 | ζ/mV | pH | |
| 0.01 | 0 | −43 ± 1 | 7.4 ± 0.3 | |
| 0.010 | −48 ± 2 | 7.1 ± 0.5 | ||
| 0.080 | −38 ± 1 | 6.6 ± 0.4 | ||
| 3.0 | +25 ± 2 | 6.7 ± 0.1 | ||
| 0.05 | 0 | −46 ± 2 | 7.0 ± 0.2 | |
| 0.010 | −49 ± 1 | 7.2 ± 0.1 | ||
| 0.40 | −43 ± 1 | 7.1 ± 0.1 | ||
| 8.0 | +21 ± 1 | 6.8 ± 0.1 | ||
| 0.1 | 0 | −44 ± 2 | 7.5 ± 0.2 | |
| 0.010 | −49 ± 1 | 7.3 ± 0.1 | ||
| 0.40 | −45 ± 1 | 7.2 ± 0.2 | ||
| 8.0 | +19 ± 1 | 7.0 ± 0.1 | ||
| 0 | 3.0 | +57 ± 1 | 7.3 ± 0.5 | |
| Interfacial parameters | |||
|---|---|---|---|
| NaCMC (0.01 wt%)/12-n-12 | |||
| 12-2-12 | 12-5-12 | 12-10-12 | |
| cac/mmol·kg−1 | 0.018 ± 0.002 | 0.041 ± 0.001 | 0.025 ± 0.002 |
| cmcp/mmol·kg−1 | 0.99 ± 0.04 | 1.30 ± 0.09 | 0.52 ± 0.06 |
| cmc/mmol·kg−1 | 0.81 ± 0.02 | 0.87 ± 0.02 | 0.42 ± 0.01 |
| γcac/mN·m−1 | 42.1 ± 0.6 | 43.4 ± 0.6 | 40.9 ± 0.2 |
| γcmcp/mN·m−1 | 28.0 ± 1 | 36.2 ± 0.5 | 37.2 ±0.3 |
| γcmc/mN·m−1 | 30.9 ± 0.8 | 38.4 ± 0.8 | 40.8 ± 0.1 |
| Zeta Potential and pH | |||
| cNaCMC = 0.01 wt% | |||
| 12-n-12 | m12-n-12/mmol·kg−1 | ζ/mV | pH |
| 12-2-12 | 0.010 | −48 ± 1 | 7.1 ± 0.1 |
| 0.060 | −45 ± 1 | 6.9 ± 0.2 | |
| 3.0 | +37 ± 2 | 7.0 ± 0.1 | |
| 12-5-12 | 0.010 | −48 ± 2 | 7.1 ± 0.5 |
| 0.080 | −38 ± 1 | 6.6 ± 0.4 | |
| 3.0 | +25 ± 2 | 6.7 ± 0.1 | |
| 12-10-12 | 0.010 | −48 ± 2 | 7.3 ± 0.1 |
| 0.080 | −37 ± 1 | 7.1 ± 0.2 | |
| 3.0 | +25 ± 2 | 7.4 ± 0.2 | |
| neat systems | |||
| 12-2-12 | 3.0 | +52 ± 3 | 7.0 ± 0.2 |
| 12-5-12 | 3.0 | +54 ± 2 | 7.1 ± 0.3 |
| 12-10-12 | 3.0 | +57 ± 3 | 6.9 ± 0.5 |
| NaCMC 0.01 wt% | --- | −43 ± 1 | 7.4 ± 0.3 |
| Interfacial properties | ||||
|---|---|---|---|---|
| cQC/wt% | SDBS | |||
| 0.01 | 0.05 | 0.1 | ||
| cac/mmol·kg−1 | 0.33 ± 0.03 | 0.32 ± 0.04 | 0.35 ± 0.08 | --- |
| cmcp/mmol·kg−1 | 2.2 ± 0.4 | 3.0 ± 0.3 | 4.2 ± 0.2 | --- |
| cmc/mmol·kg−1 | --- | --- | --- | 1.58 ± 0.06 |
| γcac/mN·m−1 | 32.2 ± 0.3 | 31.6 ± 0.6 | 31.6 ± 0.3 | --- |
| γcmcp/mN·m−1 | 30.5 ± 0.2 | 29.0 ± 0.5 | 30.0 ± 0.2 | --- |
| γcmc/mN·m−1 | --- | --- | --- | 34.7 ± 0.5 |
| Zeta Potential and pH | ||||
| cCQ/wt% | mSDBS/mmol·kg−1 | ζ/mV | pH | |
| 0.01 | 0 | +31 ± 2 | 6.5 ± 0.2 | |
| 0.10 | +26 ± 1 | 7.0 ± 0.3 | ||
| 0.50 | +16 ± 1 | 6.9 ± 0.1 | ||
| 8.0 | −37 ± 2 | 7.2 ± 0.1 | ||
| 0.05 | 0 | +36 ± 3 | 7.2 ± 0.2 | |
| 0.10 | +23 ± 2 | 7.3 ± 0.2 | ||
| 0.50 | +10 ± 1 | 7.2 ± 0.2 | ||
| 8.0 | −41 ± 1 | 7.5 ± 0.1 | ||
| 0.1 | 0 | +38 ± 2 | 8.4 ± 0.3 | |
| 0.10 | +22 ± 3 | 7.6 ± 0.3 | ||
| 0.50 | +14 ± 1 | 7.7 ± 0.3 | ||
| 8.0 | −39 ± 1 | 7.8 ± 0.1 | ||
| 0 | 8.0 | −56 ± 3 | 7.4 ± 0.1 | |
| cQC/wt% | CTAB | |||
|---|---|---|---|---|
| 0.01 | 0.1 | 0.5 | ||
| cmcmin/mmol·kg−1 | 0.54 ± 0.03 | 0.23 ± 0.02 | 0.08 ± 0.01 | --- |
| cmcp/mmol·kg−1 | 1.2 ± 0.1 | 0.84 ± 0.09 | 0.43 ± 0.09 | 0.95 ± 0.04 |
| γcmcmin/mN·m−1 | 32.1 ± 0.3 | 32.5 ± 0.4 | 32.2 ± 0.3 | --- |
| γcmcp/mN·m−1 | 35.0 ± 0.2 | 33.9 ± 0.5 | 34.2 ± 0.3 | 33.1 ± 0.2 |
Disclaimer/Publisher’s Note: The statements, opinions and data contained in all publications are solely those of the individual author(s) and contributor(s) and not of MDPI and/or the editor(s). MDPI and/or the editor(s) disclaim responsibility for any injury to people or property resulting from any ideas, methods, instructions or products referred to in the content. |
© 2023 by the authors. Licensee MDPI, Basel, Switzerland. This article is an open access article distributed under the terms and conditions of the Creative Commons Attribution (CC BY) license (https://creativecommons.org/licenses/by/4.0/).
Share and Cite
Costa, C.; Viana, A.; Oliveira, I.S.; Marques, E.F. Interactions between Ionic Cellulose Derivatives Recycled from Textile Wastes and Surfactants: Interfacial, Aggregation and Wettability Studies. Molecules 2023, 28, 3454. https://doi.org/10.3390/molecules28083454
Costa C, Viana A, Oliveira IS, Marques EF. Interactions between Ionic Cellulose Derivatives Recycled from Textile Wastes and Surfactants: Interfacial, Aggregation and Wettability Studies. Molecules. 2023; 28(8):3454. https://doi.org/10.3390/molecules28083454
Chicago/Turabian StyleCosta, Catarina, André Viana, Isabel S. Oliveira, and Eduardo F. Marques. 2023. "Interactions between Ionic Cellulose Derivatives Recycled from Textile Wastes and Surfactants: Interfacial, Aggregation and Wettability Studies" Molecules 28, no. 8: 3454. https://doi.org/10.3390/molecules28083454
APA StyleCosta, C., Viana, A., Oliveira, I. S., & Marques, E. F. (2023). Interactions between Ionic Cellulose Derivatives Recycled from Textile Wastes and Surfactants: Interfacial, Aggregation and Wettability Studies. Molecules, 28(8), 3454. https://doi.org/10.3390/molecules28083454