Abstract
The structural, electronic, magnetic, and optical properties of Co-doped 10–20-atom silver clusters are investigated by GGA/PBE via the density functional theory. The Ag–Co clusters form core–shell structures with a Co atom in the center. Co atom doping modulates electronic properties like energy gap, molecular softness, global hardness, electronegativity, and electrophilicity index. For the optical spectra of the Ag–Co clusters, the energy of their spectra overall exhibits little change with increasing numbers of atoms; the strongest peaks are roughly distributed at 3.5 eV, and the intensity of their spectra overall is strengthened. Raman and vibrational spectra reflect structural changes with Co atom addition. The addition of the Co atom alters magnetic moments of specific Ag–Co clusters, while others remain unchanged.
1. Introduction
The noble metal clusters have important applications in electronics, catalysis, optics, and medical fields because of their unique physical and chemical characteristics [1,2,3,4,5,6]. Their properties are regulated by their size, structure, and composition [7,8,9,10,11,12,13]. With the continuous development of cluster science, the study of noble metal clusters has gradually changed from pure noble metal clusters to bimetallic clusters. Bimetallic clusters exhibit many special properties that differ from pure metal clusters. However, fully revealing the properties of bimetallic clusters is very challenging due to their structures becoming complicated compared with pure metal clusters. At present, the studies show that silver–cobalt (Ag–Co) bimetallic clusters have potential applications in magnetism, optics, and catalysis [14,15,16,17,18,19,20].
Currently, the studies on Ag–Co binary clusters primarily concentrate on their structural and magnetic properties. Cheng et al. calculated the second-order difference of binding energy of a ComAgn (m + n = 13) cluster, indicating that the structures of the ComAgn (m = 6, 8, 10, 12) clusters are relatively stable, and studied their energy gap and magnetic properties, indicating that the Co6Ag7 cluster has high chemical stability and its magnetic property is enhanced with the increase in the number of Co atoms [21]. Dzhurakhalov et al. found that core–shell structural Ag–Co clusters form by regulating their composition and temperature [22]. Garcia-Torres et al. showed various structures of Co–Ag alloy, and special core–shell structures effectively ensure plasma loss and magnetic features [23]. Laasonen et al. concluded that Ag–Co nanoalloy clusters are all core–shell structures, with Ag atoms occupying the surface and Co atoms residing in the core, using density functional theory [24]. Ferrando et al. affirmed that silver atoms have a tendency to occupy surface positions, and that the lowest-energy clusters in the polymerized icosahedral structures of 28 and 34 atoms are intermediate components, which is attributed to the interaction of the magnetic moments of internal Co atoms in the core–shell structure, as determined by a DFT (density functional theory) study [25]. Bochicchio et al. determined the chirality of core–shell Ag–Co clusters by combining global optimization searches and first principles [26]. Kong et al. reported that Co–Ag structures can produce special magnetic moments [27]. Hoof et al. obtained the core–shell structures of Ag–Co clusters using molecular dynamics [28,29]. Janssens et al. showed that in <50-atom Co-Ag clusters, the rich Ag clusters show an obvious quantum size effect, while this effect is lacking in the rich Co clusters, and they found experimental evidence of the stability enhancement of the Ag10Co+ cluster, theoretically showing that the magnetic moment on cobalt atoms disappears [30,31]. Recently, the structural, electronic, and optical characteristics of seven- and thirteen-atom Ag–Co clusters were investigated using density functional theory by our teams [32,33].
Studying the theoretical aspects of Ag–Co clusters, including their structure, composition, and performance, holds significant importance; however, these studies are too limited to be applied. In addition, most of the research on Ag–Co clusters focuses on their structural stability, magnetic properties, and catalytic characteristics, but the electronic and optical characteristics of Ag–Co clusters are little understood. To identify novel applications in the optics fields, it is necessary to perform theoretical research on their structures and optical performances. Therefore, the structural, electronic, magnetic, and optical properties of Co-doped 10–20-atom silver clusters are studied by GGA/PBE via the density functional theory.
2. Model and Computational Methods
Firstly, the initial global searches of the structures of Ag–Co clusters were carried out using the artificial swarm algorithm (Artificial Bee Colony Algorithm, ABC) [34,35] with the empirical Gupta many-body potential used to model atomic interactions [36,37]. The Gupta potential parameters of Ag–Co clusters are shown in Table 1, where r0 is the atomic nearest-neighbor distance, and the parameters A, ξ, p, and q are derived from numerous experimental values of binding energy, lattice parameters, and elastic constants.

Table 1.
Gupta potential parameters for Ag–Ag, Ag–Co, and Co–Co interactions [36,37].
Secondly, the above initial structures of Ag–Co clusters were optimized using DFT calculations, implemented in the Dmol3 package included in the software Materials Studio 2019 [38,39], and the smallest structures were selected as the study objects. The optimizations and performance calculation parameters are as follows: the exchange-correlation functional is the Perdew–Burke–Ernzerhof and generalized gradient approximation (PBE/GGA) method [40], the basis set is the double numerical plus polarization group (DNP) function [41], and the core treatment is the semi-core pseudopotentials (DSPPs) [38]. The convergence value of the total energy of the self-consistent field is 10−6 Ha, and the cut-off radius is set to 5.0 Å. Property calculations such as those for the binding energy, as well as the Raman and vibrational spectra, of the clusters are here performed using the PBE/GGA. The Raman spectra of the clusters are simulated by the wavelength of incident light at 514.5 nm and 10 K. Optical properties have been calculated using the time-dependent density functional theory [42] and PBE/GGA.
The binding energy is as follows:
where is the binding energy of the A-B system, is the total energy of the A-B system, is the sum of atomic energies of the A atom, is the sum of atomic energies of the B atom, is the number of the A atom, and is the number of the B atom.
To a certain degree, the stability of the clusters can be determined by the second-order difference energy, which is defined as
where and are the total energies of pure Ag and Ag–Co clusters, respectively.
According to Koopmans’ approximation, the electronegativity (χ), molecular softness (S), global hardness (η), and electrophilicity index (ω) play crucial roles as key indicators for nanoalloys, so we computed their χ, S, η, and ω using electron affinity (EA) and ionization energy (IE). The χ, S, η, ω, IE, and EA of all the nanoclusters are as follows:
where μ is the chemical potential of the clusters.
3. Results and Discussion
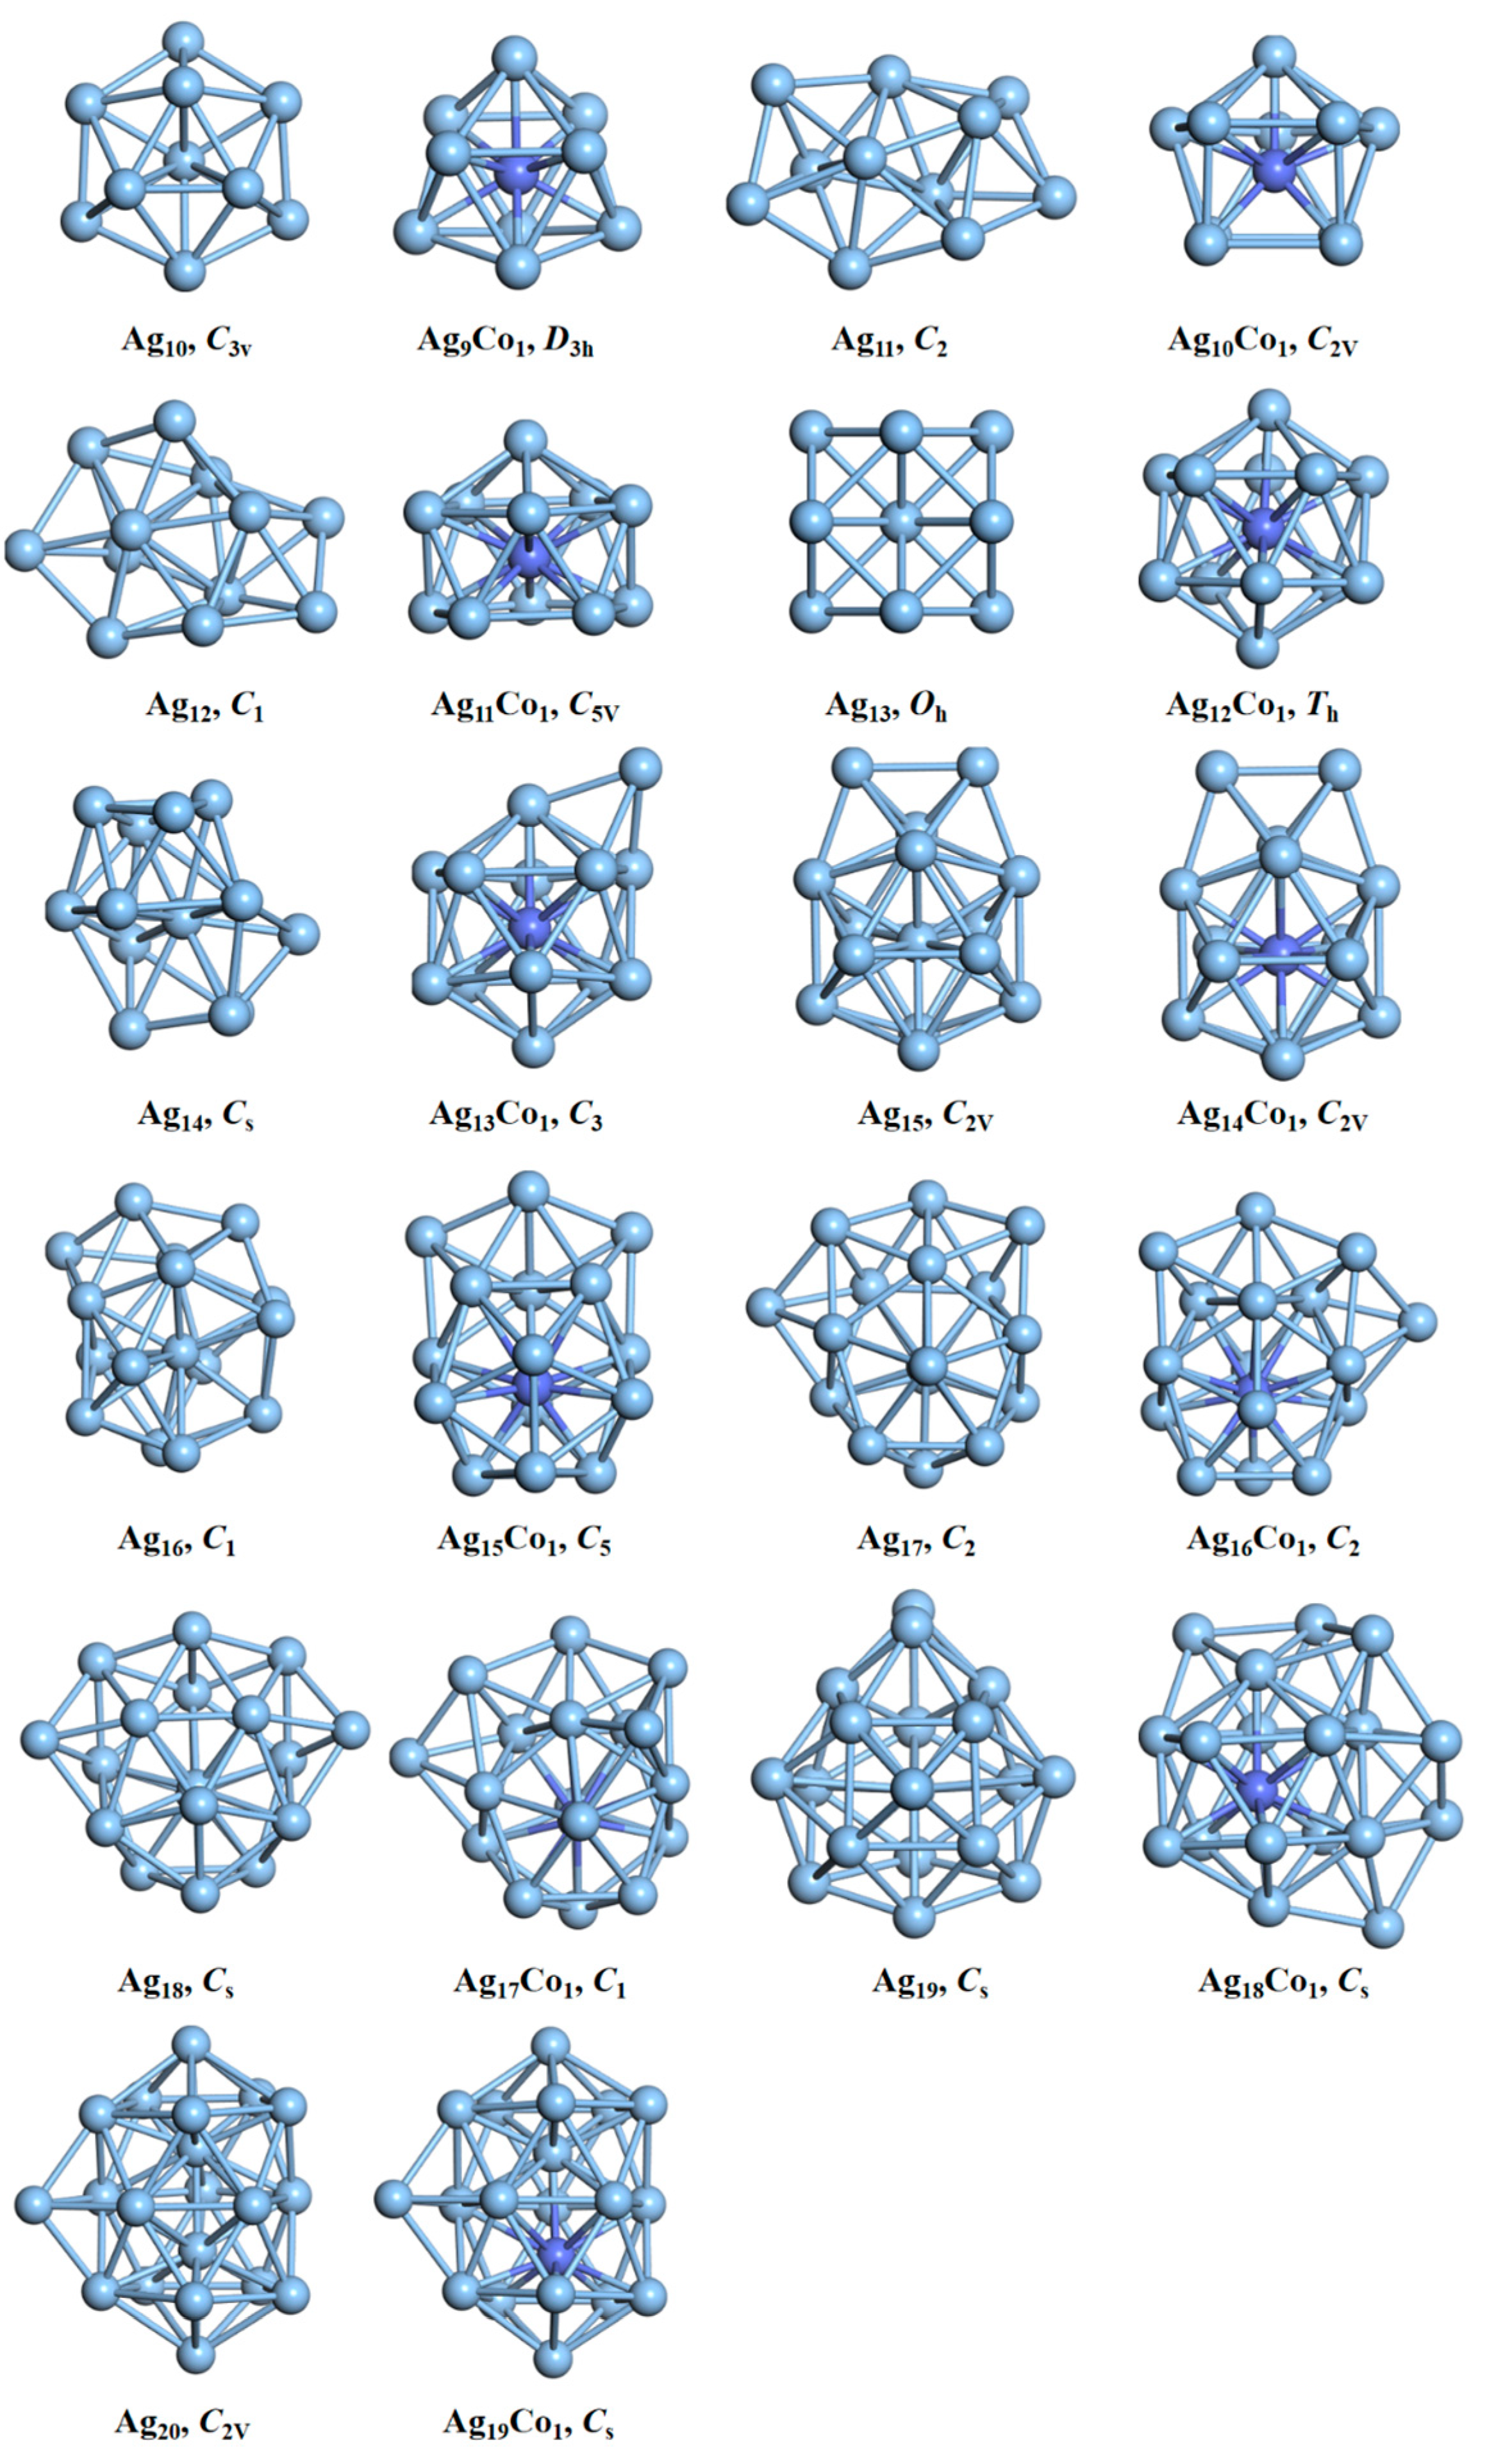
The schematic structures of the pure silver and silver–cobalt clusters after optimization are shown in Figure 1. The Ag10 cluster with C3v point group symmetry is a hexahedral geometry, which is in agreement with the reported structure of the Ag10 cluster calculated using TPSS and M06 functionals [43]. When a single cobalt atom is doped, its lowest-energy structure does not maintain a hexahedral form, i.e., the Ag9Co1 cluster forms a core–shell structure with the Co atoms at the center and the remaining nine silver atoms at the edge. The Ag11 cluster adopts an amorphous structure connected by two decahedra, with C2 point group symmetry, which is in agreement with the previous report [44,45]. When one Co atom is doped, its lowest-energy structure displays a core–shell form exhibiting C2v point group symmetry. The Ag12 cluster also has an amorphous structure, where all silver atoms lie on the outside, with low symmetry (C1). The Ag11Co1 cluster with C5v point group symmetry shows a core–shell structure, where the Co atom is located in the central position. The lowest-energy structure of the Ag13 cluster, with a truncated octahedral shape maintaining the point group symmetry of Oh, has been reported by our researchers [46,47]. While the lowest-energy structure of the Ag12Co1 cluster is an icosahedron core–shell form, the Co atom is in the center of icosahedral, and its point group symmetry is Th, which agrees with a previous report [32]. The Ag14 cluster with Cs point group symmetry is deformed by adding a Ag atom to the truncated octahedral Ag13 cluster. The lowest-energy structure of the Ag13Co1 cluster entails the addition of an Ag atom on the icosahedral Ag12Co1 cluster, where the Co atom is also in the central position, and its point group symmetry is C3. The lowest-energy structure of the Ag15 cluster is icosahedral with the addition of two linked Ag atoms. The structure of the Ag14Co1 cluster is similar to that of the Ag15 cluster, and the Co atom is located in its center, and both have the point group symmetry of C2v. The structure of the Ag16 cluster is also based on an icosahedral form with the addition of three Ag atoms. Due to the addition of Ag atoms, the original icosahedral structure is slightly deformed, and its symmetry is reduced. The icosahedral structure with the addition of three Ag atoms in the Ag15Co1 cluster is not deformed, and also adopts a core–shell form. The Ag17 cluster is composed of an icosahedral shape with the addition of four Ag atoms, which is similar to previous reports [48]. The structure of the Ag16Co1 cluster closely resembles that of the Ag17 cluster, where the Co atom lies at its core. Both show the point group symmetry of C2. The Ag18 cluster has an icosahedral structure with the addition of five Ag atoms, which is in agreement with the previous result [43], and the Co atom of the Ag17Co1 cluster is also located in the core. The Ag19 cluster shows a deformed truncated octahedral structure with an additional six Ag atoms, which is also in agreement with the previous result [43], while the Ag18Co1 cluster has an icosahedral core–shell structure with the addition of six Ag atoms. The central position of the icosahedron is also occupied by the Co atom. The Ag20 cluster has an icosahedral structure with the addition of seven Ag atoms. The structure of the Ag19Co1 cluster is similar to that of the Ag20 cluster, and is a core–shell structure with a Co atom in the center. Generally speaking, when a single Co atom is doped into the silver cluster, the Ag–Co clusters can easily form core–shell structures, with Co atoms in the center, because the surface energy of the Co atom is larger than that of the Ag atom. As the number of atoms increases, the Ag clusters (except the Ag13 cluster) retain an almost icosahedral structure with the addition of some Ag atoms, and the Ag–Co cluster also includes some Ag atoms on top of the icosahedral structure. The electron configurations of Ag and Ag–Co clusters are shown in Table 2. There are two unpaired electrons in the Ag10, Ag11Co1, Ag13Co1, and Ag19Co1 clusters, so all are open-shell configurations, and their spin multiplicities are all 3. There are no unpaired electrons in the Ag9Co1, Ag12, Ag14, Ag16, Ag15Co1, Ag18, Ag17Co1, or Ag20 clusters, thus these are all closed-shell configurations, and their spin multiplicity is 1. There is only one unpaired electron in the Ag11, Ag10Co1, Ag13, Ag17, Ag16Co1, Ag19, and Ag18Co1 clusters, thus they are all open-shell configurations, and their spin multiplicities are all 2. There are three unpaired electron in the Ag12Co1, Ag15, and Ag14Co1 clusters, thus they all have open-shell configurations, and their spin multiplicities are 4.

Figure 1.
Structural images of the Ag–Co clusters. The cobalt atom is blue, and the point group symmetry is shown below the structure.
Table 2.
The electron configurations of Ag and Ag–Co clusters.
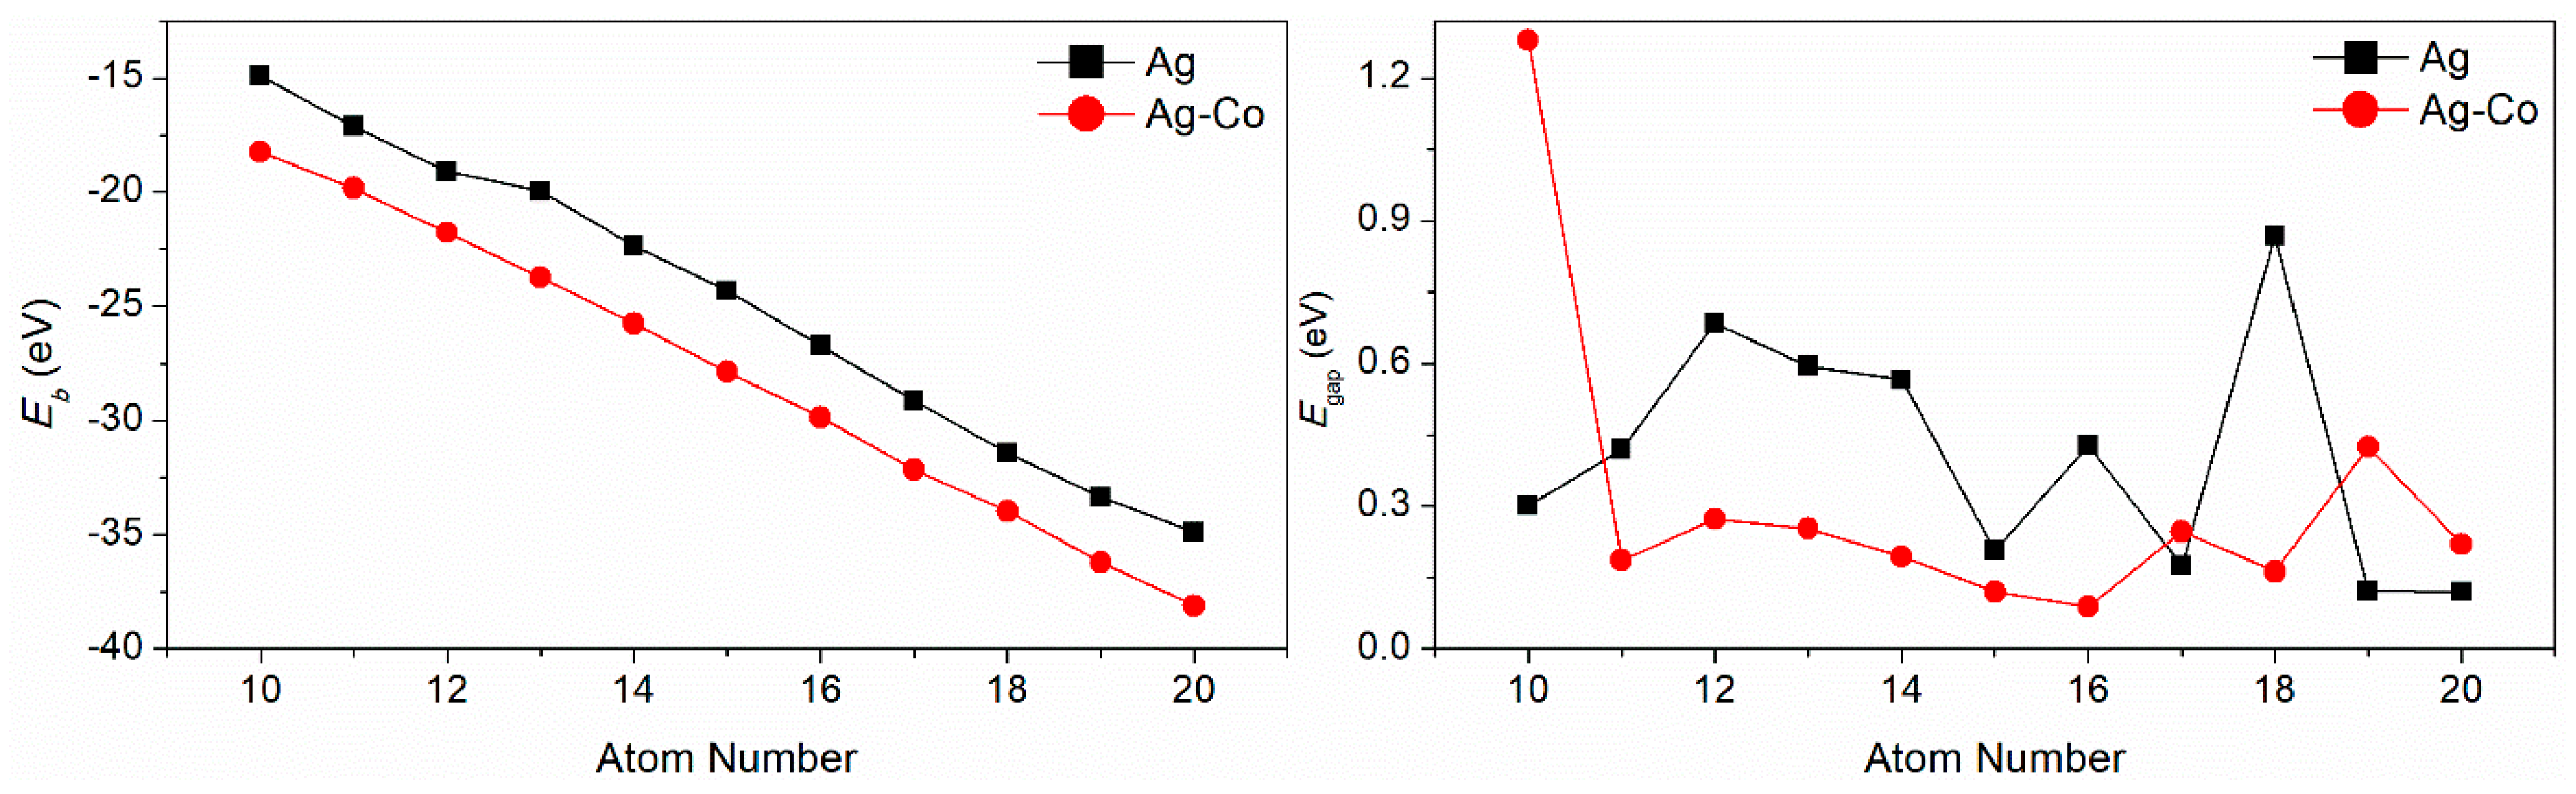
The binding energy (Eb) and the energy gap (Egap) between the energy of the highest occupied molecular orbital and the energy of the lowest unoccupied molecular orbital of the Ag–Co clusters are displayed in Figure 2. With an increase in the quantity of cluster atoms, their binding energy also escalates. When a single Co atom is doped into a silver cluster, its binding energy increases accordingly, because the cohesive energy and surface energy of Co atoms are greater than those of Ag atoms. For pure silver clusters, the energy gap values of Agn (n = 10–14, 16, 18) clusters are larger than 0.3 eV, and the Egap of the Ag18 cluster is the largest of all; the energy gap values of Agn (n = 15, 17, 19, 20) clusters are lower than 0.3 eV, and the Egap of the Ag20 cluster is lowest of all. The energy gap values of AgnCo1 (n = 10–15, 17) clusters are lower than those of the corresponding pure silver clusters, and the energy gap values of AgnCo1 (n = 9, 16, 18, 19) clusters are larger than those of the corresponding pure silver clusters. The Egap of the Ag9Co1 cluster is the largest of all, and the Egap of the Ag15Co1 cluster is the lowest of all. In a word, the energy gap of silver clusters can be tuned by the addition of a cobalt atom.
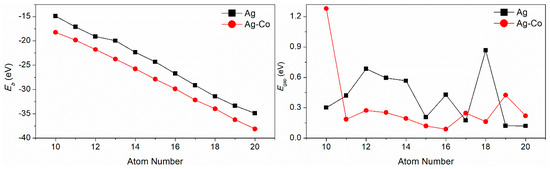
Figure 2.
The Eb and Egap values of the Ag–Co clusters.
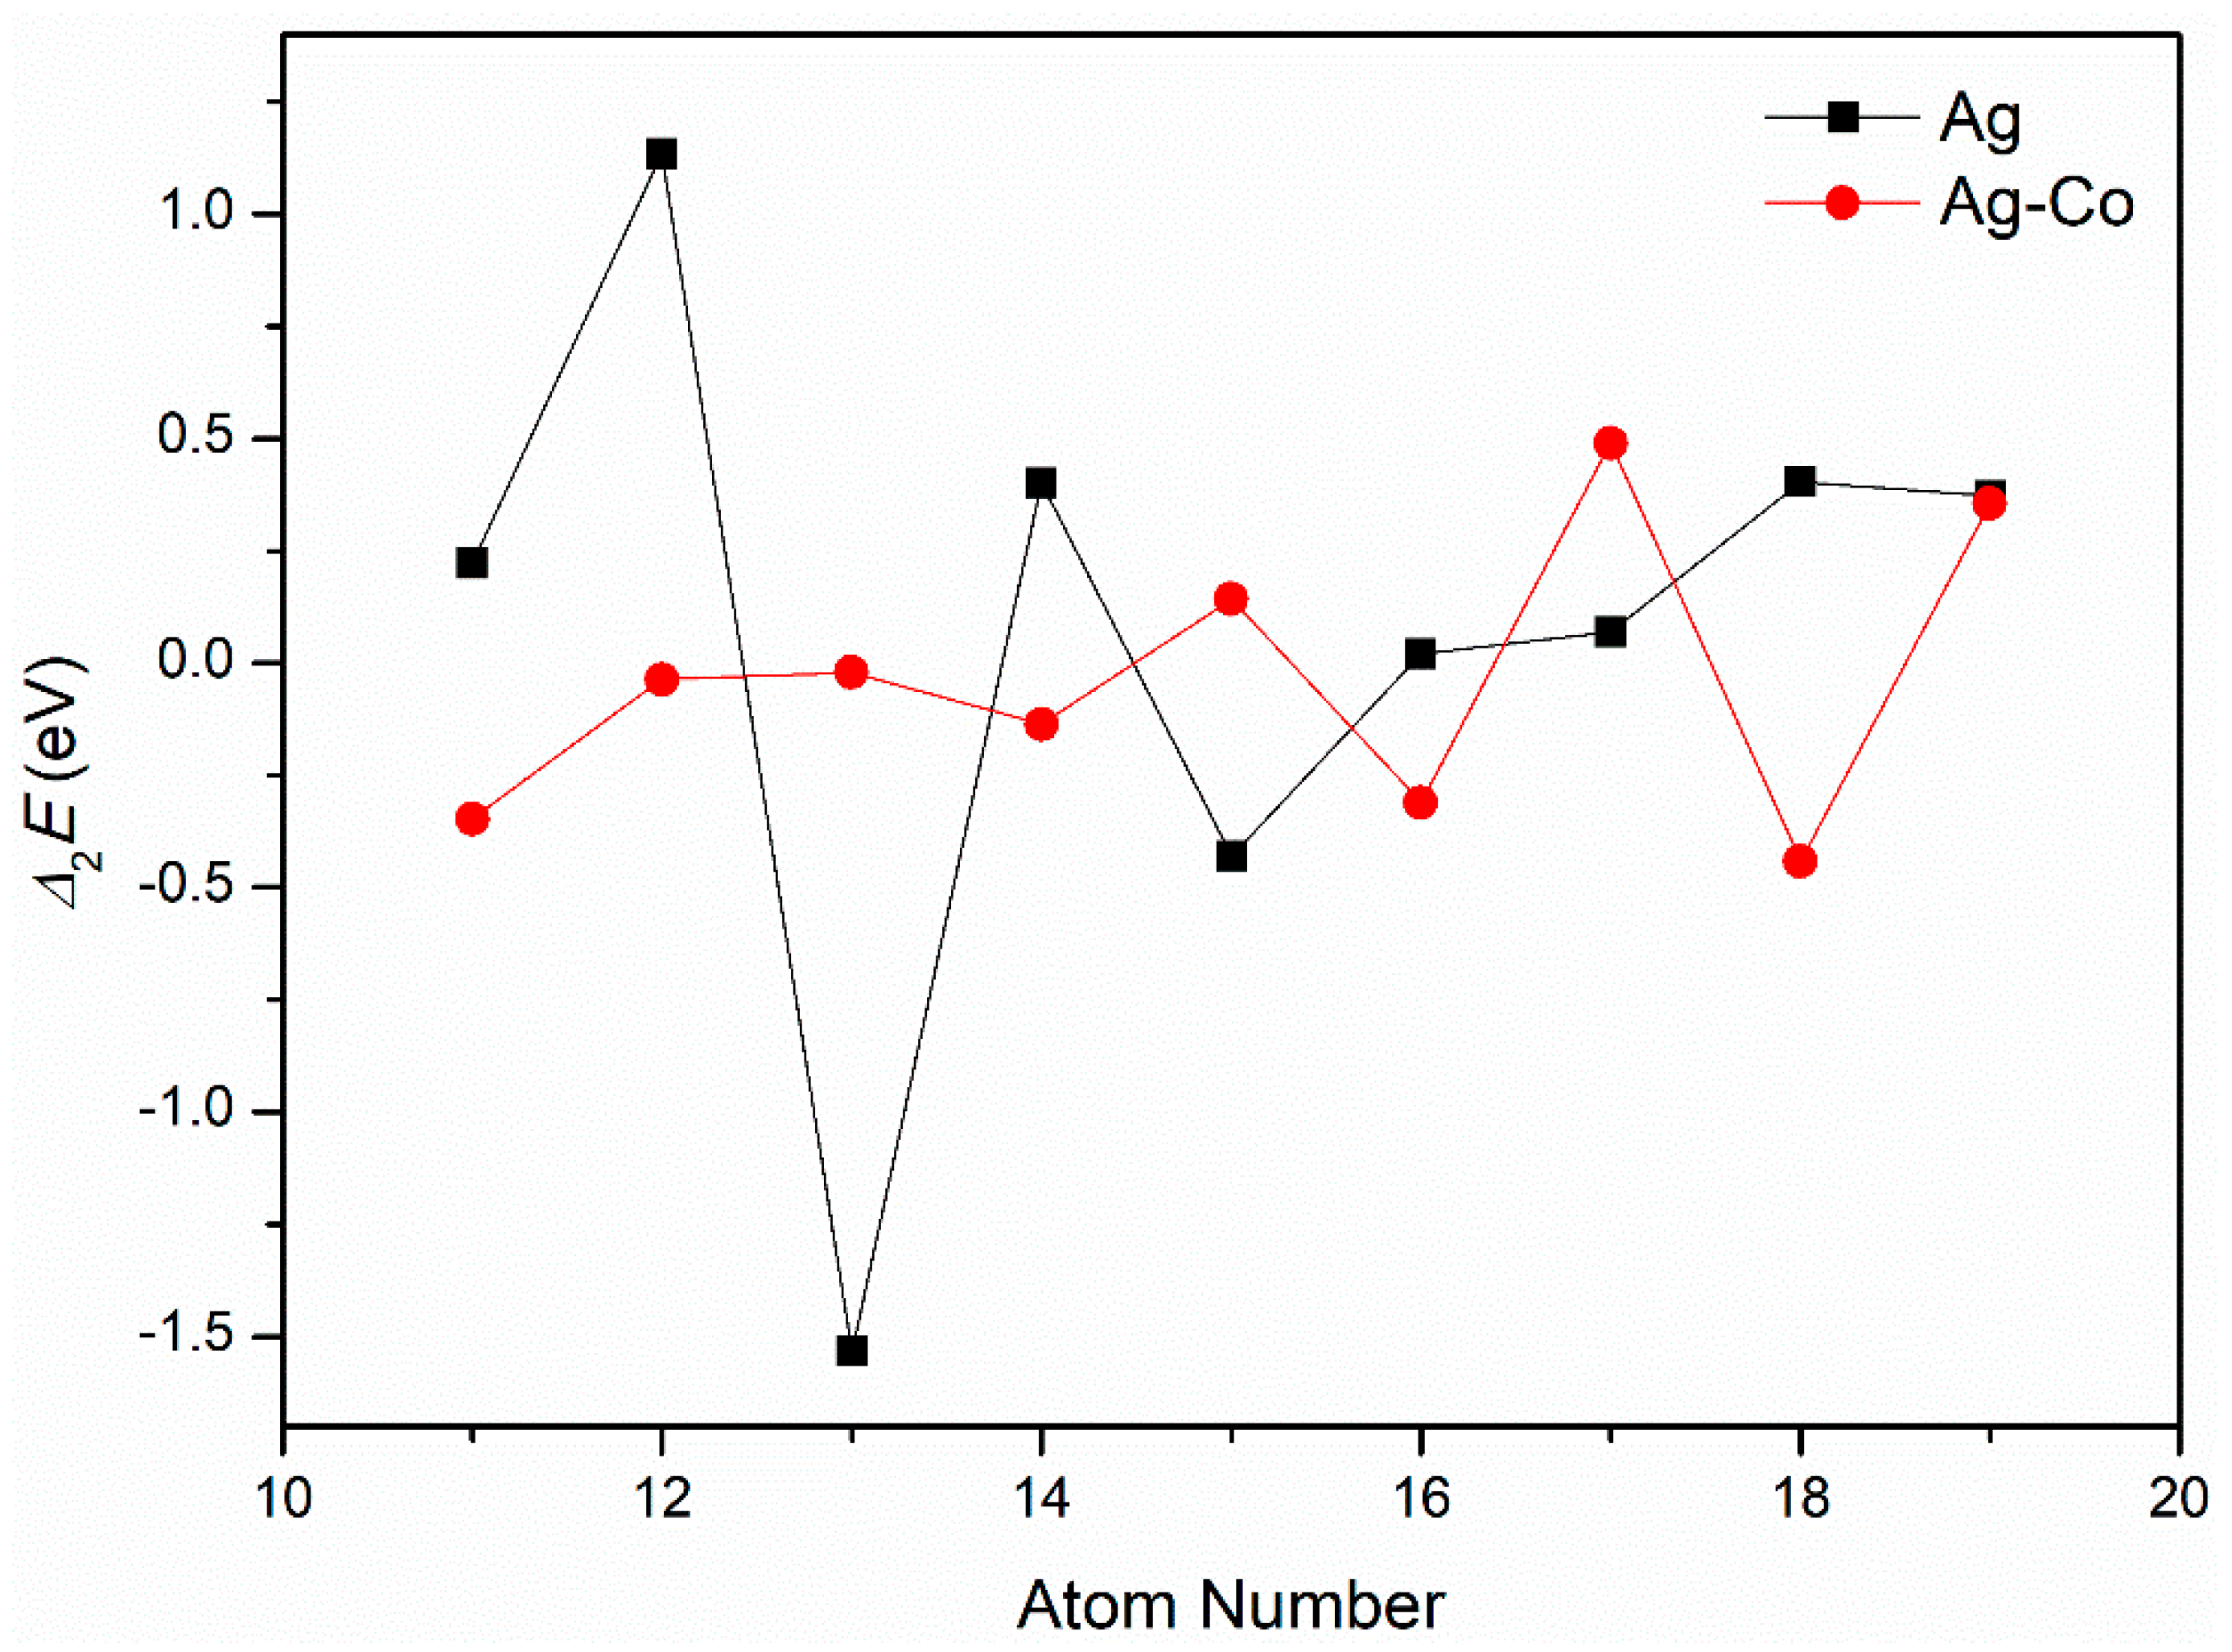
The second-order differential energy values of pure Ag and Ag–Co clusters are given in Figure 3. For pure silver clusters, the values of the Ag12, Ag14, and Ag18 clusters are larger than those of their neighboring clusters, respectively; therefore, the Ag12, Ag14, and Ag18 clusters are relatively stable. For the Ag–Co clusters, the values of the Ag12Co1, Ag14Co1, and Ag16Co1 clusters are larger than those of their neighboring clusters, respectively; therefore, the stability of these clusters is relatively high.
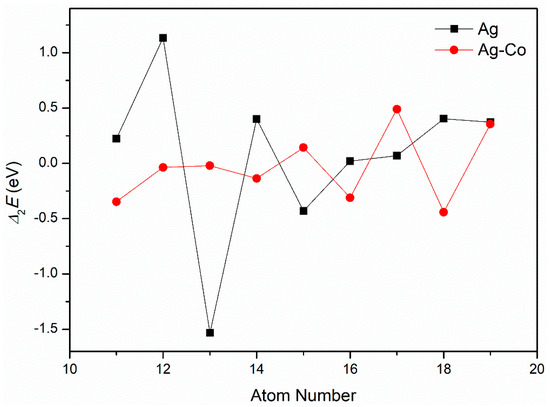
Figure 3.
The Δ2E of the Ag–Co clusters.
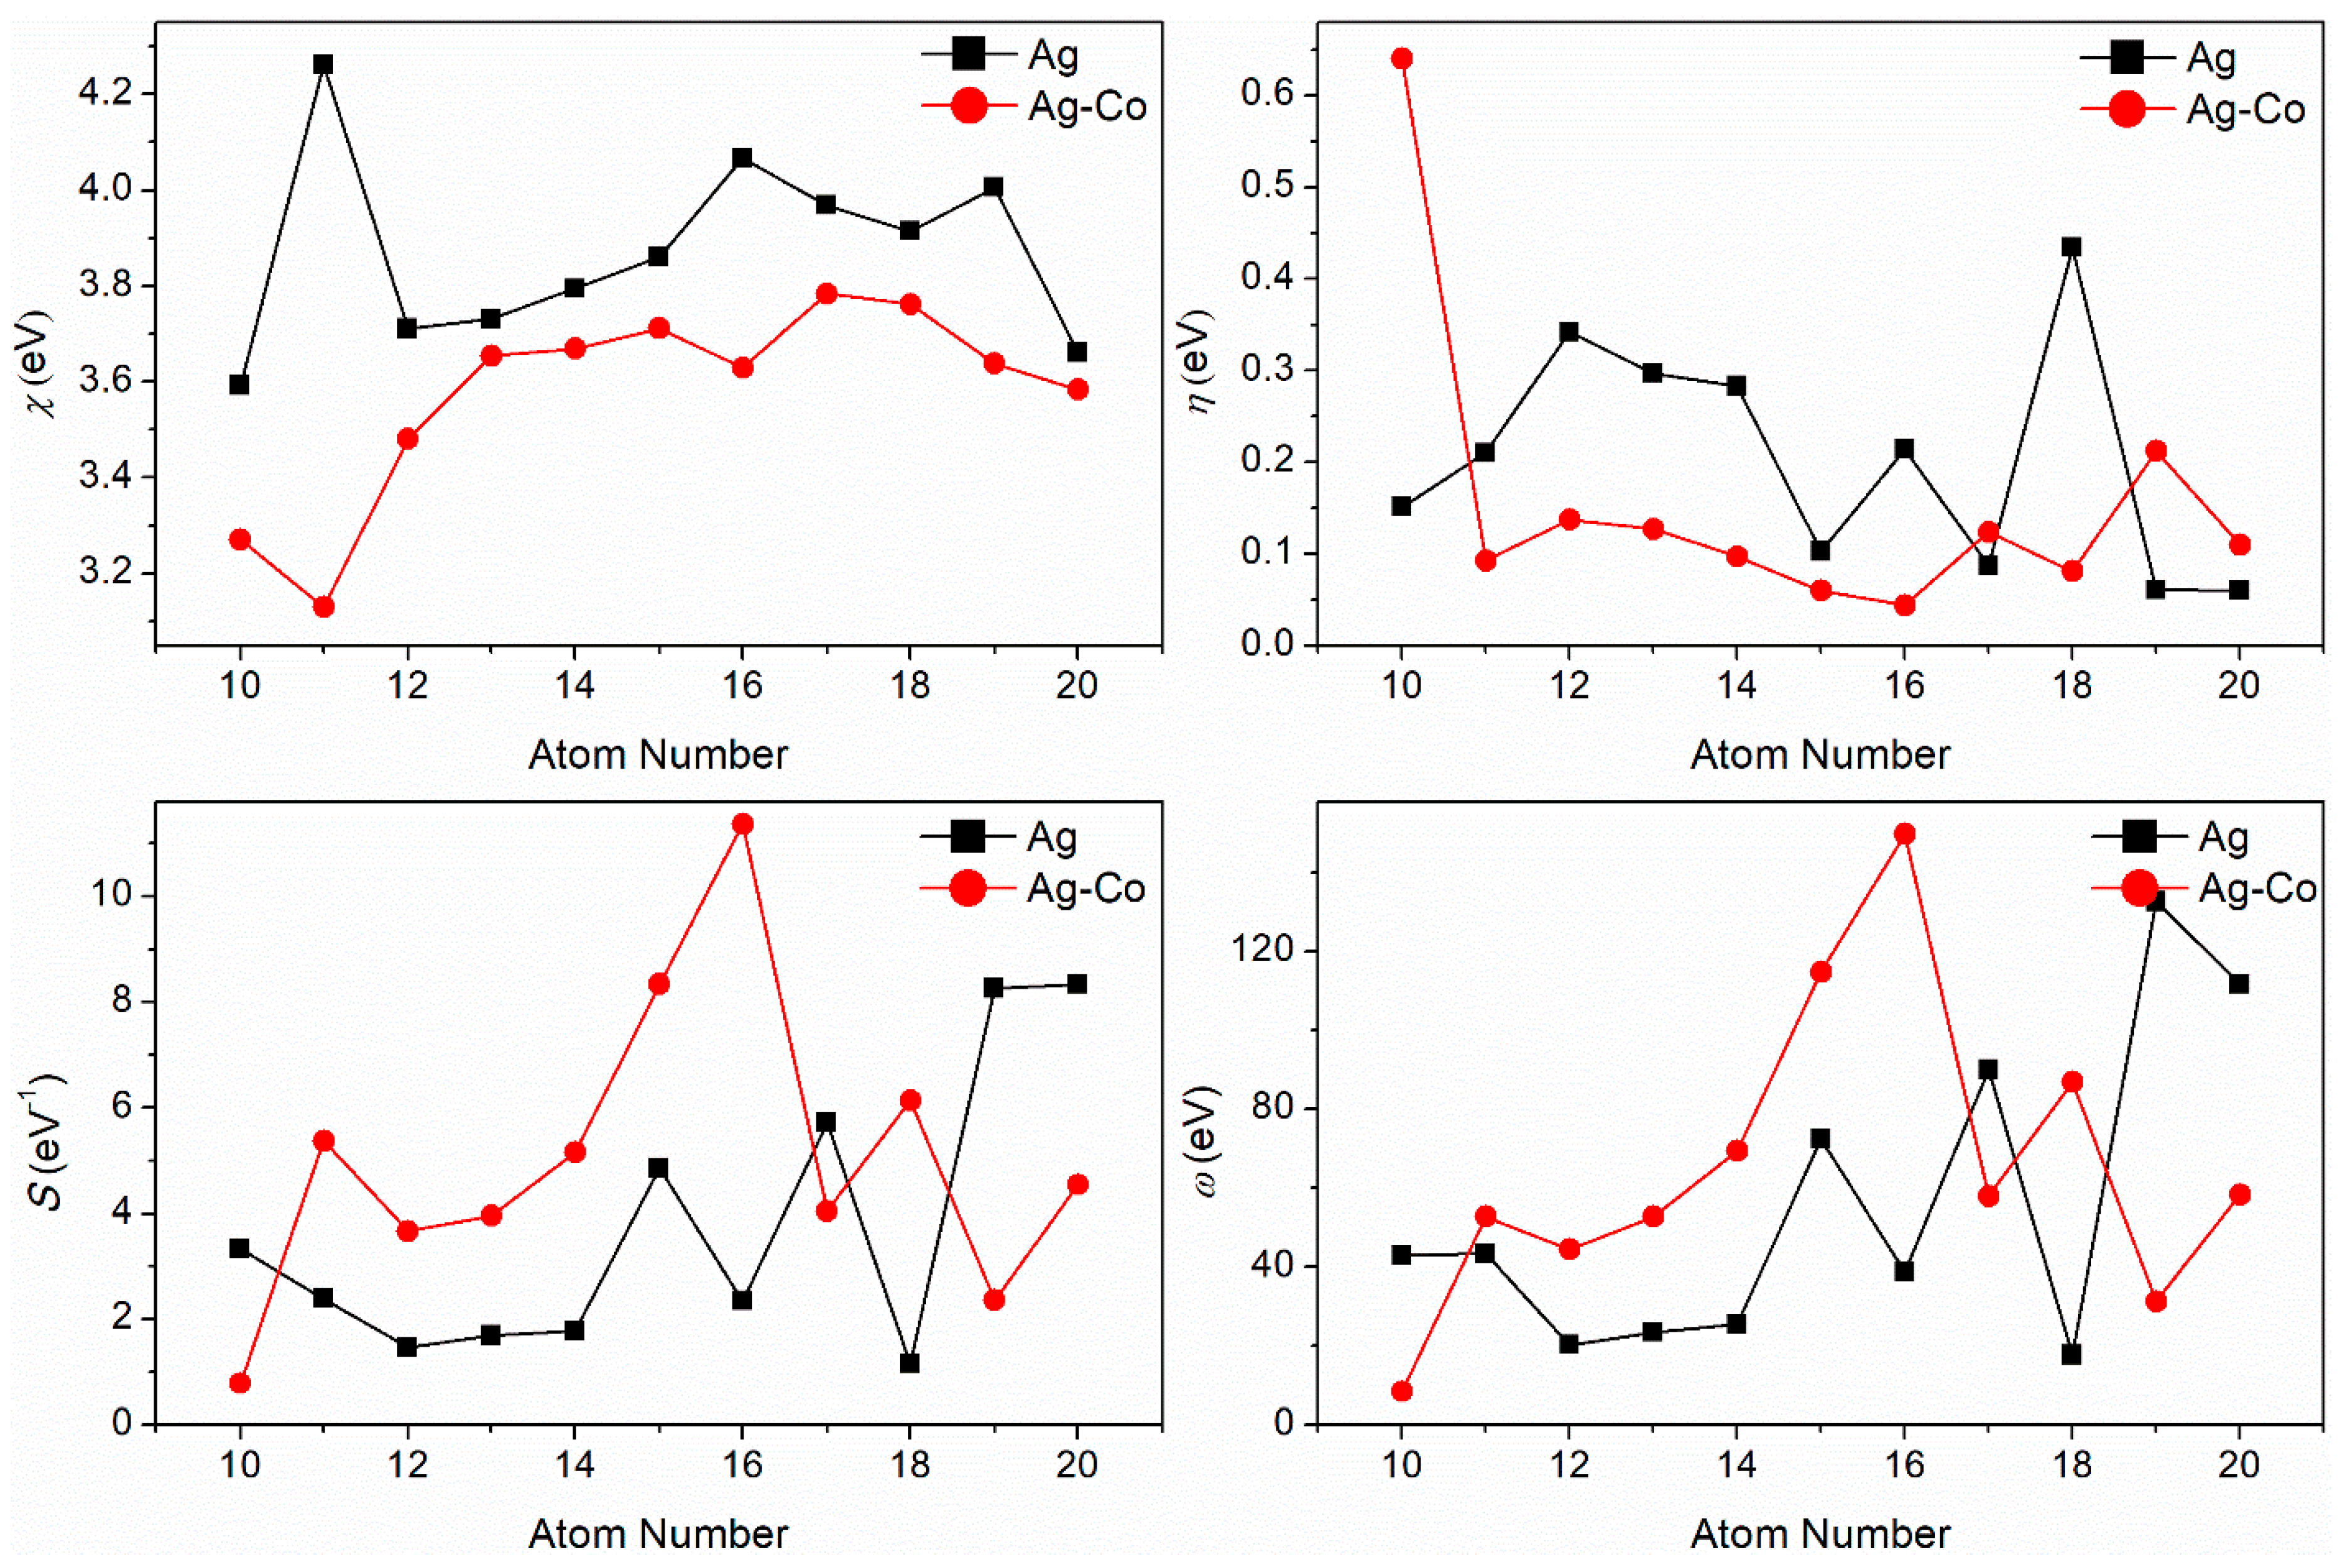
The χ, S, η, and ω of the pure Ag and Ag–Co clusters are shown in Figure 4. For pure Ag clusters, the electronegativity χ value increases with the number of atoms. The χ value of the Ag11 cluster is the highest, and the χ value of the Ag10 cluster is the lowest. These results indicate that the ability of the Ag11 cluster to obtain electrons is the strongest, and that of the Ag10 cluster is the weakest, the remaining clusters being in between the two. Comparing the χ values of pure silver clusters, we see that the χ value of the Ag–Co cluster decreases. For Ag–Co clusters, when the quantity of atoms reaches 10–13, the χ values firstly decrease and then increase; when the number of atoms is greater than 13, the χ values change very little, keeping around 3.7 eV. The χ value of the Ag10Co1 cluster is the lowest, and the χ value of the Ag16Co1 cluster is the highest. These results show that the ability of Ag–Co clusters to obtain electrons is reduced; that of the Ag16Co1 cluster is the strongest and that of the Ag10Co1 cluster is the weakest, and as the quantity of atoms increases, the ability of the Ag–Co clusters to obtain electrons firstly weakens, then increases, and then tends towards no change.
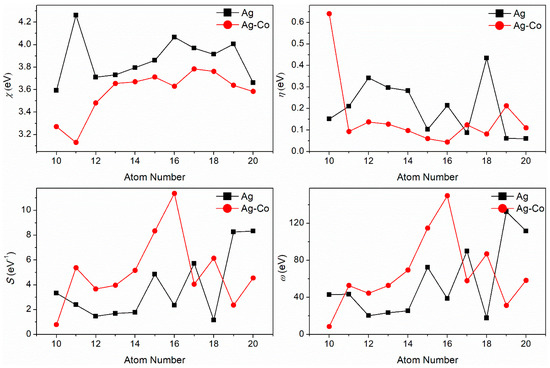
Figure 4.
The χ, η, S, and ω of the Ag–Co clusters.
The trend in the global hardness η of pure Ag clusters and Ag–Co clusters is consistent with that of the energy gap between the energy of the highest occupied molecular orbital and the energy of the lowest unoccupied molecular orbital. For pure silver clusters, the η value of the Ag18 cluster is the highest, and the η value of the Ag20 cluster is the lowest. For Ag–Co clusters, the η value of the Ag9Co1 cluster is the highest, and the η value of the Ag15Co1 cluster is the lowest. These results illustrate that the electronic stability of the Ag18 and Ag9Co1 clusters is high, and that of the Ag20 and Ag15Co1 clusters is low.
The change trends of the molecular softness S of the Ag and Ag–Co clusters are the opposite to those of their global hardness. For pure Ag clusters, the S values of the Ag10, Ag15, Ag17, Ag19, and Ag20 clusters are greater than 3.0 eV−1, and those of the remaining pure Ag clusters are lower than 3.0 eV−1. The S value of the Ag20 cluster is the highest, and the S value of the Ag18 cluster is the lowest. The S values of the AgnCo1 (n = 9–15, 17) clusters are increased with the doping of the Co atom, and the S values of the AgnCo1 (n = 9, 16, 18, 19) clusters decrease with the doping of the Co atom. The S value of the Ag15Co1 cluster is the highest, and the S value of the Ag9Co1 cluster is the lowest.
Overall, the change trends in the electrophilicity index ω of the Ag (except Ag11 and Ag20) and Ag–Co clusters are consistent with their molecular softness. The ω of the Ag11 cluster is greater than that of the Ag10 cluster, which shows a different trend from their S change trend. At the same time, the ω of the Ag20 cluster is lower than that of the Ag19 cluster, which is also different from their S change trend. These results illustrate that the ω values of the Ag (except Ag11 and Ag20) and Ag–Co clusters are mainly determined by their molecular softness, while the ω values of the Ag11 and Ag20 clusters are primarily influenced by their electronegativity. The ω value of the Ag19 cluster is the highest, and the ω value of the Ag18 cluster is the lowest. The ω value of the Ag16Co1 cluster is the highest, and the ω value of the Ag9Co1 cluster is the lowest.
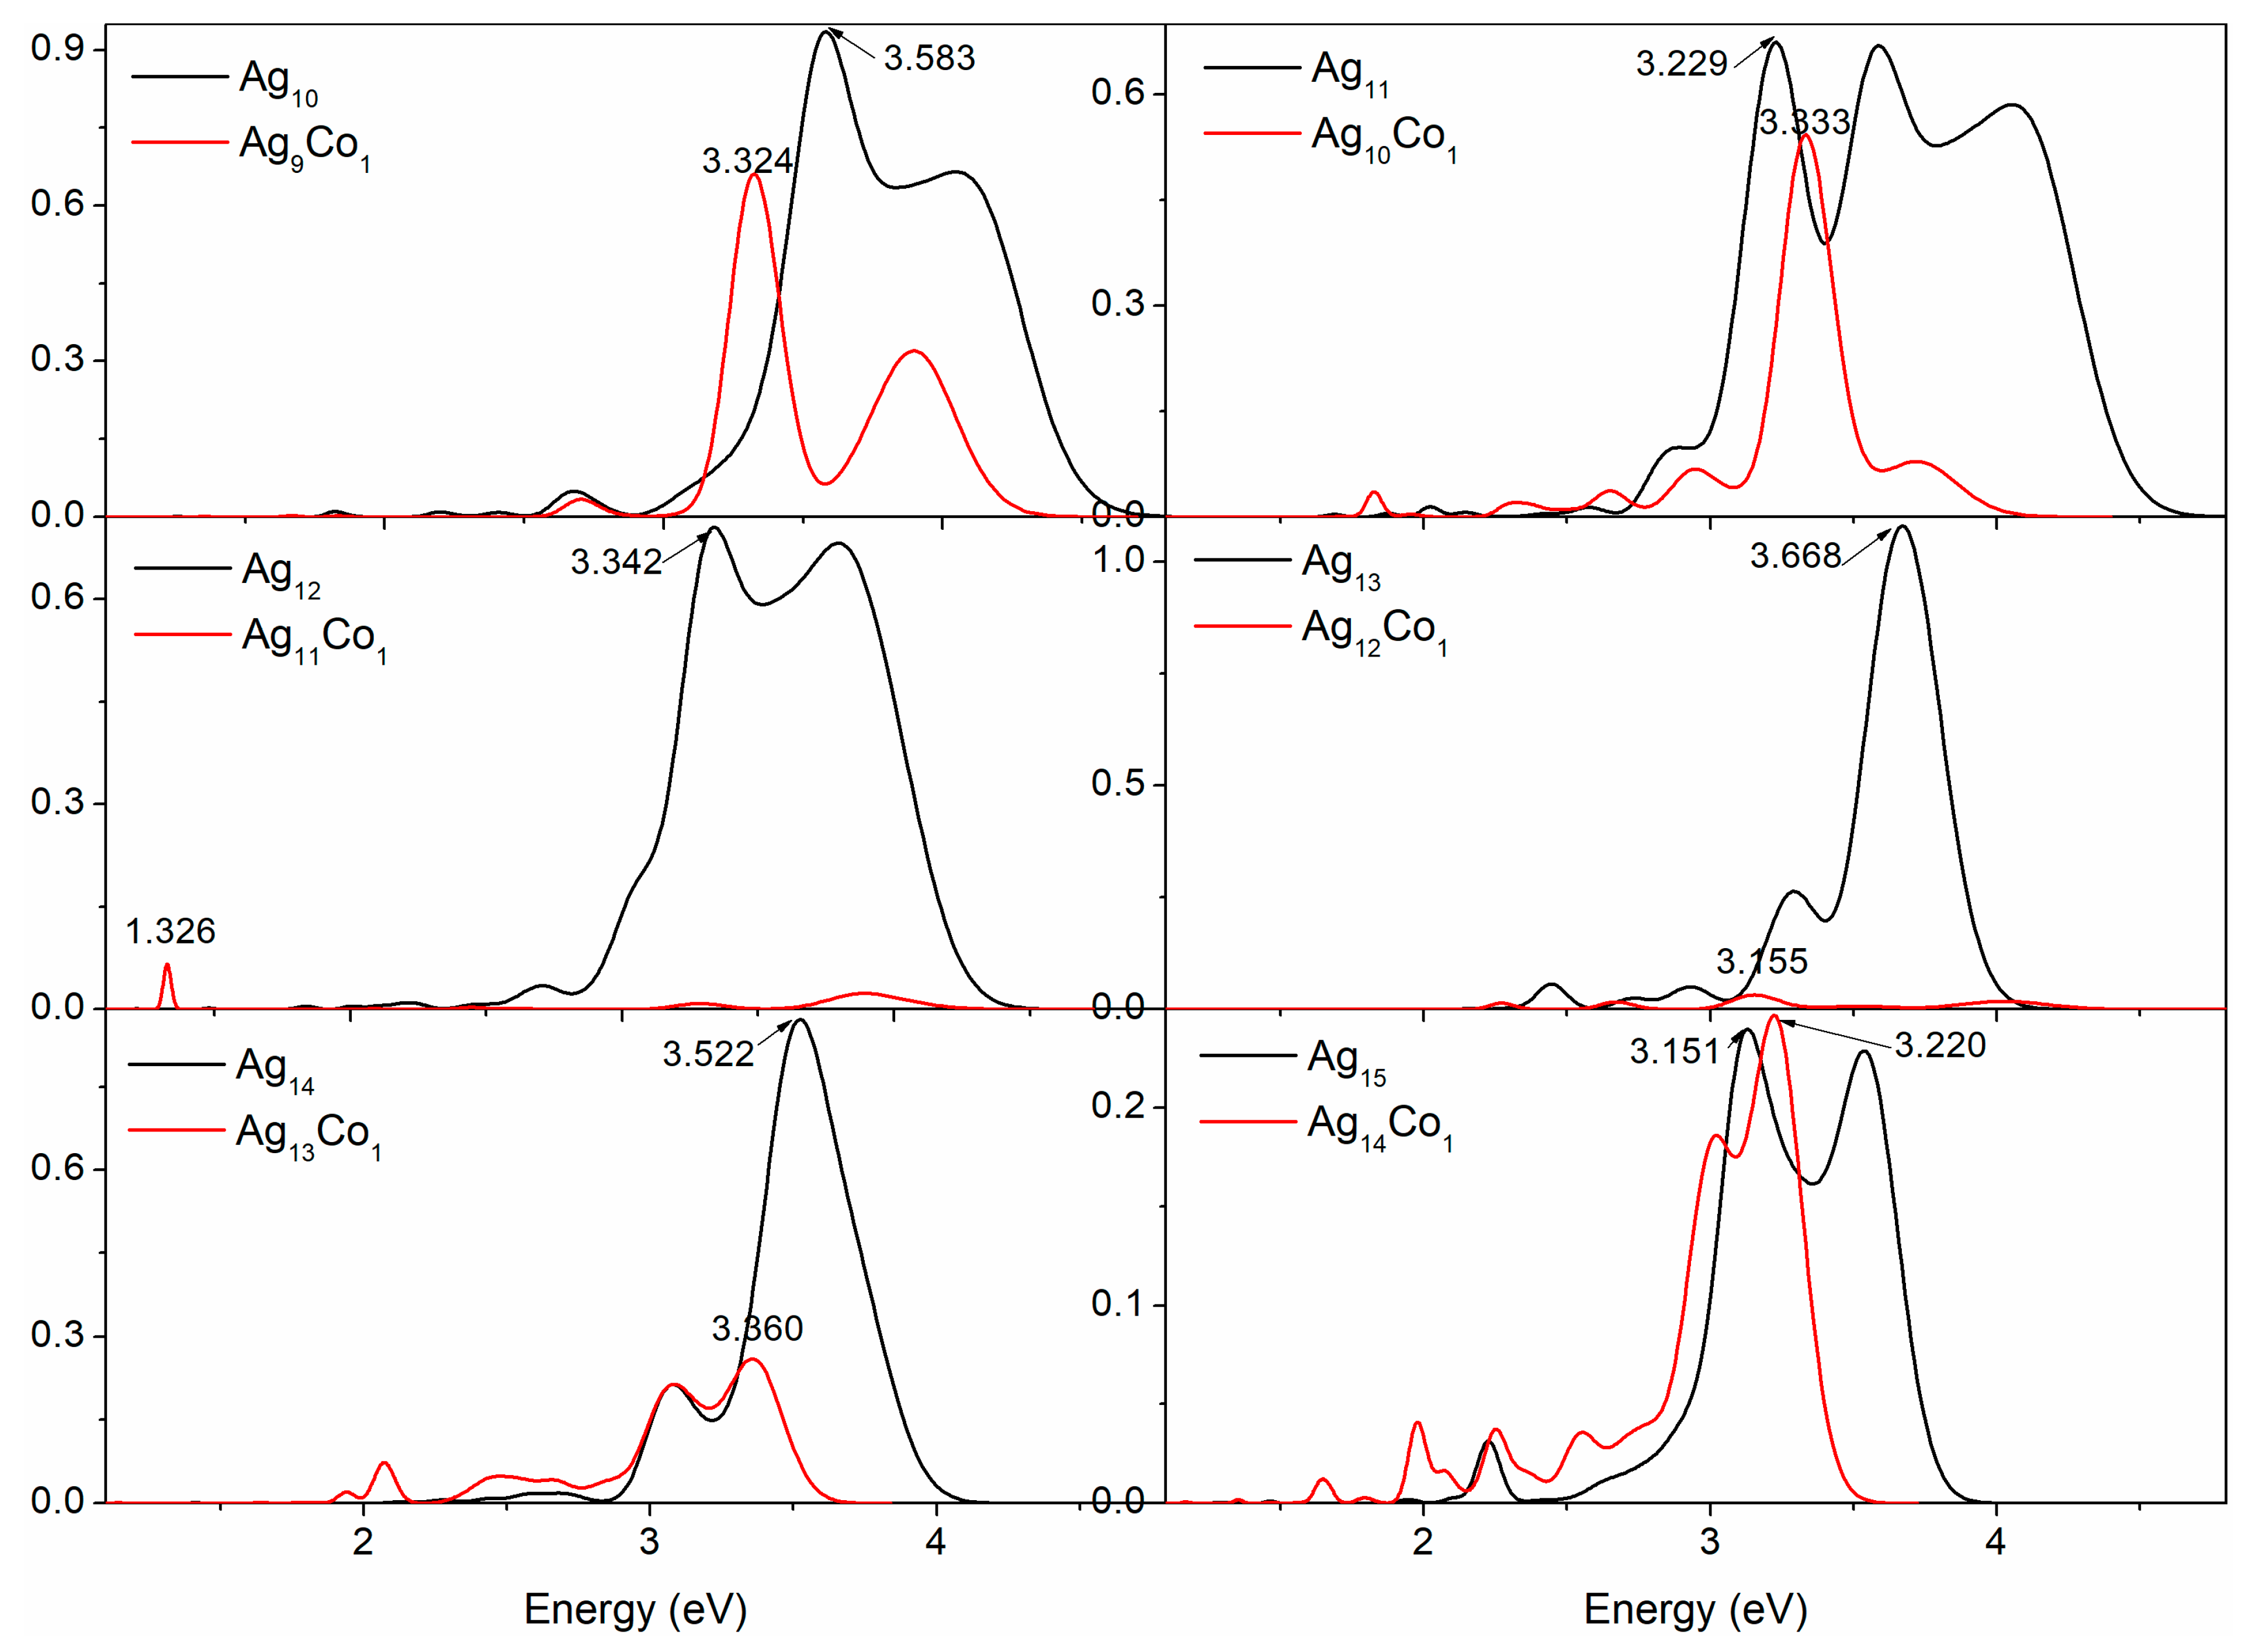
In the field of materials science, the spectral analysis of metal clusters is a crucial research approach. Through further study, we obtained spectra for the 10–15-atom Ag–Co clusters (Figure 5) and analyzed them in detail. These spectra present a sequence of distinct absorption peaks, and the appearance of these peaks indicates excited electrons in these clusters, revealing for us the electronic-level structure of the clusters. The spectrum of the Ag10 cluster presents three significant absorption peaks, of which the peak at 4.052 eV is close to the experimental peak at 3.98 eV [44] or 3.97 eV [49], and the strongest peak is located at 3.583 eV. When a Co atom is doped into the Ag10 cluster forming the Ag9Co1 cluster, the spectrum of the Ag9Co1 cluster also shows three distinct absorption peaks, and the strongest peak of this cluster is located at 3.324 eV. Consequently, a spectral redshift is observed in the Ag9Co1 cluster in comparison to the Ag10 cluster. The spectrum of the Ag11 cluster shows three significantly strong absorption peaks and three small peaks, which can be seen in the experimental spectrum of the Ag11 cluster [44,50,51]; the strongest peak is located at 3.229 eV. The spectrum of the Ag10Co1 cluster also displays one strong peak and five small peaks, and the strongest peak of this cluster is located at 3.333 eV. The spectrum of the Ag10Co1 cluster exhibits a blueshift of 0.104 eV in comparison to that of the Ag11 cluster. There are two strong peaks and two small peaks in the spectrum of the Ag12 cluster, which are in agreement with the experimental peaks [44]; the strongest peak is located at 3.342 eV. When the Co atom is in the Ag12 cluster, the absorption peaks become too weak; there are three small absorption peaks, and the strongest peak is located at 1.326 eV. Compared with the spectrum of the Ag12 cluster, a big redshift in the spectrum of the Ag11Co1 cluster is observed. There is one strong peak and four small peaks in the spectrum of the truncated octahedral Ag13 cluster, which findings are in agreement with experimental peaks [44] and our previous findings [46], wherein the strongest peak lies at 3.668 eV. While the peaks of the optical spectrum of the icosahedral Ag12Co1 cluster become very weak, the strongest peak lies at 3.155 eV. A redshift in the spectrum of the Ag12Co1 cluster is observed compared with the Ag13 cluster. There is one strong peak and three small peaks in the spectrum of the Ag14 cluster; the strongest peak lies at 3.522 eV, which is close to the experimental peak at 3.48 eV [44]. With a Co atom doped in the Ag14 cluster, the spectrum of the Ag13Co1 cluster has more peaks than that of the Ag14 cluster and shows six peaks, the strongest peak lying at 3.360 eV. The spectrum of the Ag13Co1 cluster exhibits a redshift of 0.162 eV in comparison to that of the Ag14 cluster. There are two strong peaks and one small peak in the spectrum of the Ag15 cluster, the strongest peak lying at 3.131 eV, and a peak at 3.532 eV is observed in the experimental spectrum [44]. At the same time, with a Co atom doped in the Ag15 cluster, the spectrum of the Ag14Co1 cluster has more peaks than that of the Ag15 cluster, and shows two strong peaks and five small peaks, the strongest peak lying at 3.220 eV. There is a 0.089 eV blueshift observed in the spectrum of the Ag14Co1 cluster in comparison to the Ag15 cluster.
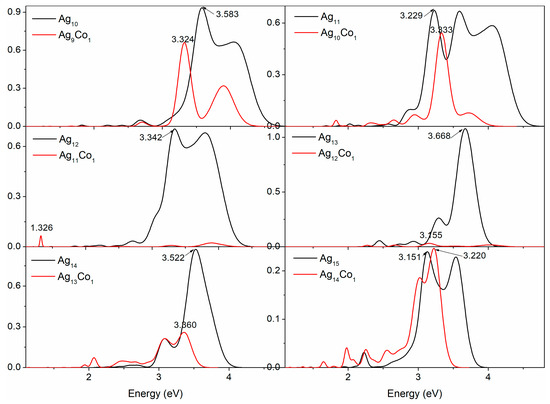
Figure 5.
The optical spectra of the 10–15-atom Ag–Co clusters.
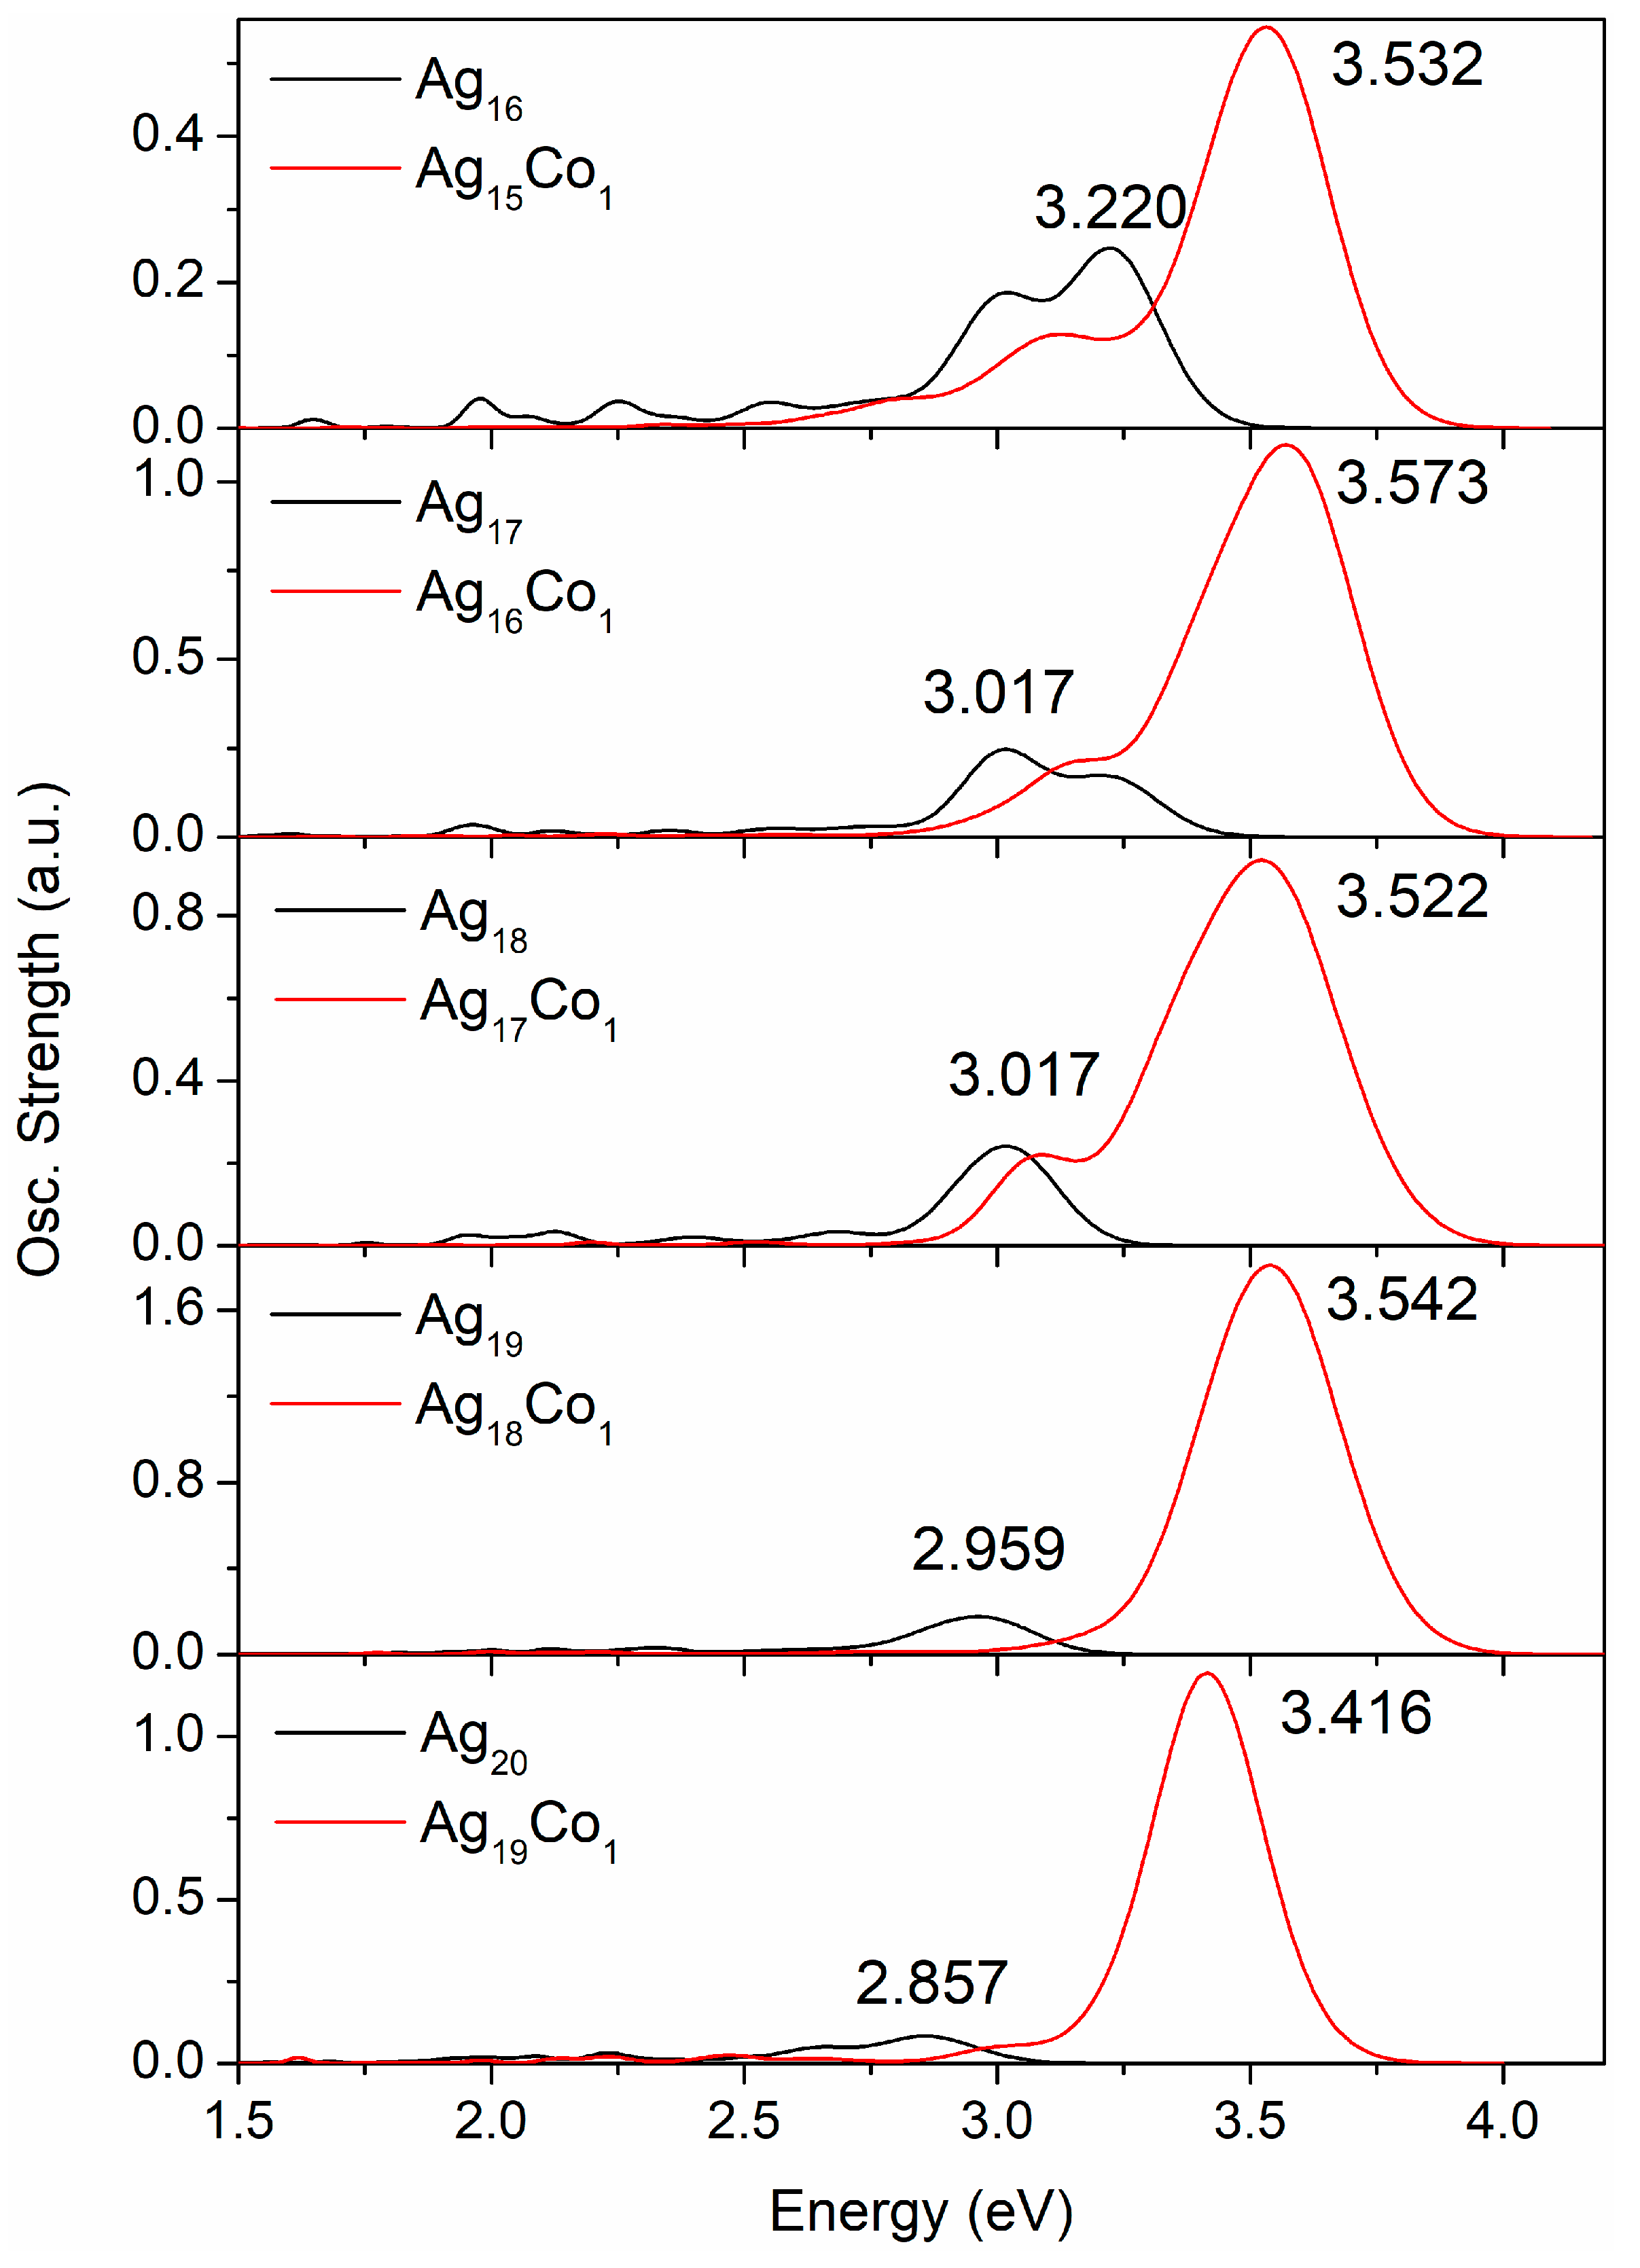
When the number of atoms in the Ag–Co clusters is changed from 16 to 20, their spectra show some remarkable change patterns. Therefore, the spectra of the 16–20-atom Ag–Co clusters are drawn separately, as shown in Figure 6. There are two strong peaks and five small peaks in the spectrum of the Ag16 cluster, the strongest peak lying at 3.220 eV. There are only two peaks in the spectrum of the Ag15Co1 cluster, the strongest peak lying at 3.532 eV. Two strong peaks and four small peaks are observed in the spectrum of the Ag17 cluster, the strongest peak lying at 3.017 eV, and the other peak lies at 3.123 eV. Only one peak is observed in the spectrum of the Ag16Co1 cluster and this lies at 3.573 eV. There is one strong peak and four small peaks in the spectrum of the Ag18 cluster, with the strongest peak also lying at 3.017 eV. There are two peaks in the spectrum of the Ag17Co1 cluster, with the strongest peak lying at 3.522 eV. The spectrum of the Ag19 cluster exhibits one clear peak and three small peaks, with the strongest peak lying at 2.959 eV. The spectrum of the Ag18Co1 cluster presents only one peak, which lies at 3.542 eV. The spectrum of the Ag20 cluster displays one obvious peak and four small peaks, and the strong peak lies at 2.857 eV. The spectrum of the Ag19Co1 cluster shows only one strong peak and three small peaks, with the strongest peak at 3.416 eV. Thus, the addition of a Co atom into Ag clusters causes a strong peak at approximately 3.5 eV in the spectra of the Ag–Co clusters, and a blueshift in the spectra of the Ag–Co clusters compared with the same number of atoms in a pure silver cluster.
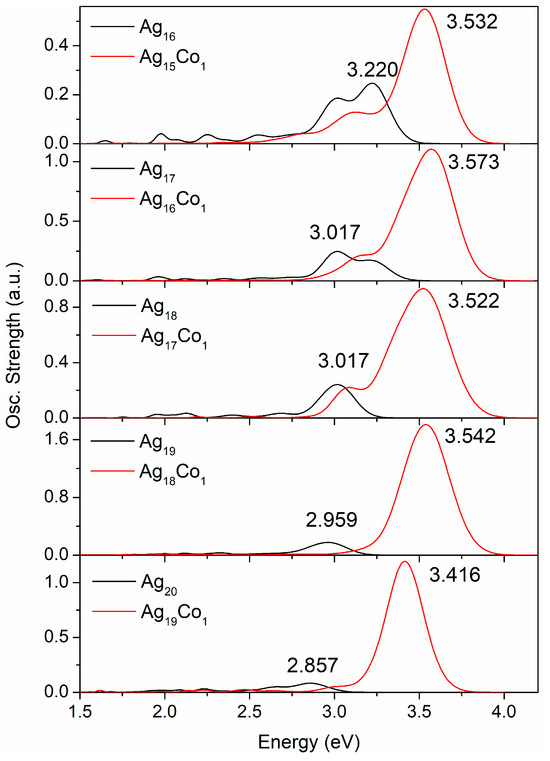
Figure 6.
The optical spectra of the 16–20-atom Ag–Co clusters.
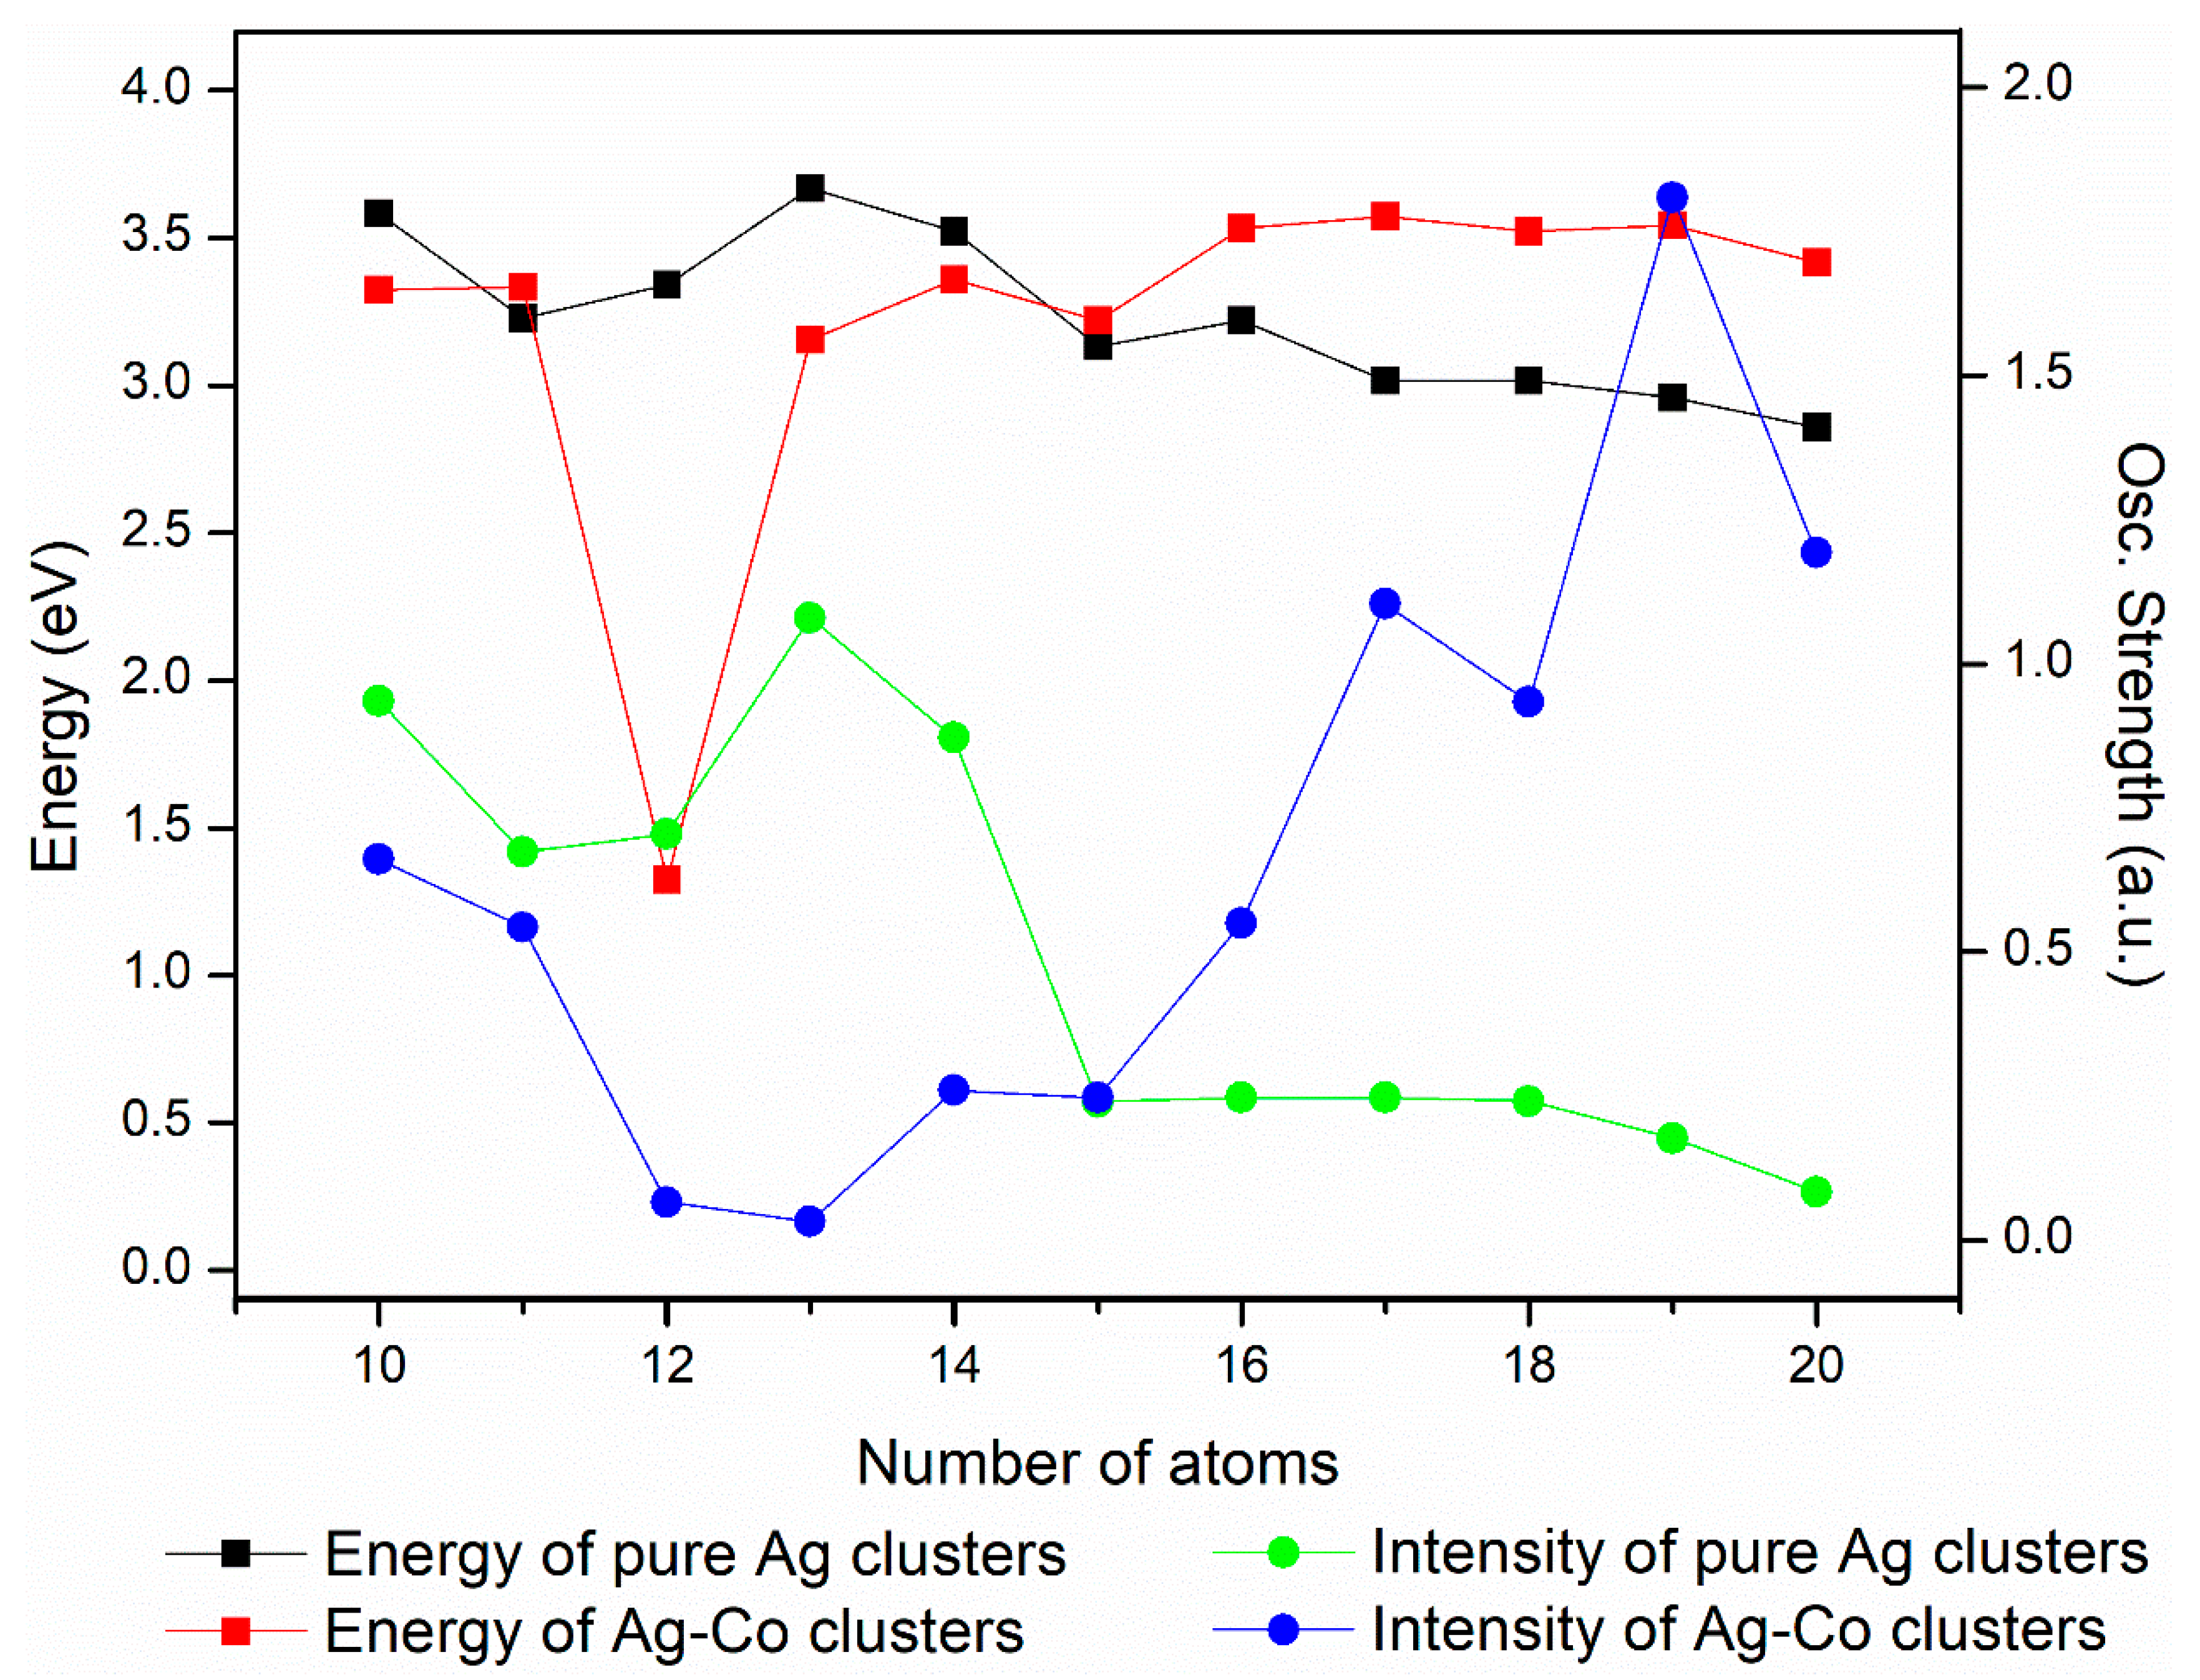
Generally speaking, the spectral analysis of the Ag–Co clusters has provided valuable insights into their electronic structure and the influence of introducing Co into these clusters on their optical properties. Figure 7 displays the energy and intensity of the optical peaks of the Ag–Co clusters with increasing numbers of atoms. For the pure Ag clusters, the energy and intensity of their spectra generally change little as the number of atoms increases, i.e., redshift occurs as the number of atoms grows. For the Ag–Co clusters, the energy of their spectra overall exhibits little change as the number of atoms grows; the strongest peaks are roughly distributed at 3.5 eV, and the intensity of their spectra strengthens overall. When the numbers of atoms are 10, 12, 13, and 14, the addition of the Co atom makes the optical spectra redshift and weakens the intensity. As the number of atoms is 15–20, doping with Co leads to a redshift of the optical spectra and a strengthening of intensity. The blueshift or redshift in the absorption peaks with the addition of a Co atom suggests that the Co atom has the ability to adjust the electronic characteristics of the Ag–Co clusters efficiently. These findings have important implications for the development of novel optical materials and the understanding of the fundamental processes governing the electronic properties of metal clusters.

Figure 7.
Energy and intensity of optical peaks of Ag–Co clusters vs. the number of atoms.
Raman spectroscopy plays a crucial role in studying the structure, chemical composition, size effects, and magnetic properties of Ag–Co clusters. By analyzing the Raman spectra of Ag–Co clusters, we can gain an insight into their basic properties, and lay the foundation for subsequent experimental and applied studies. Thus, the Raman spectra of the Ag–Co clusters were investigated by GGA/PBE, and the Raman spectra are displayed in Figure 8 and Figure 9. The range in the Raman spectra of the 10–15-atom Ag–Co clusters is small, and the range in the Raman spectra of the 16–20-atom Ag–Co clusters is large; thus, Figure 8 and Figure 9 show the Raman spectra of the 10–15-atom and 16–20-atom Ag–Co clusters, respectively. The Raman spectrum of the Ag10 cluster presents two peaks at 68.1 and 145.7 cm−1, respectively (Figure 8). The addition of a Co atom into the Ag10 cluster leads to the appearance of five peaks, lying at 9.2, 63.4, 86.9, 128.9, and 155.4 cm−1, respectively (Figure 8). The Raman spectrum of the Ag11 cluster also exhibits two peaks, located at 68.4 and 148.5 cm−1, respectively (Figure 8). The presence of one Co atom in the Ag11 cluster leads to the appearance of two new Raman peaks at 21.2 and 125.9 cm−1 and increases the intensity of the Raman peaks at 150.2 cm−1, while it weakens the intensity of the Raman peaks at 73.0 cm−1 (Figure 8). The Raman spectrum of the Ag12 cluster also exhibits two peaks, with center at 69.8 and 147.4 cm−1 (Figure 8). The appearance of a new Raman peak at 32.3 cm−1 and the increasing intensity of the Raman peak at 75.6 cm−1 are attributed to the cooperative effect of the Co atom in the cluster (Figure 8). The Raman spectrum of the Ag13 cluster also displays two peaks, with centers at 67.0 and 129.4 cm−1 (Figure 8), which findings are in agreement with our previous results [46]. The presence of one Co atom in the Ag13 cluster leads to the appearance of a new Raman peak at 106.7 cm−1, and the Raman peaks at 74.3 and 145.0 cm−1 shift to a larger wavelength (Figure 8). The Raman spectrum of the Ag14 cluster displays three distinctive Raman peaks, which lie at 34.0, 78.9, and 149 cm−1 (Figure 8). The Raman spectrum of the Ag13Co1 cluster displays four distinct Raman peaks, which lie at 67.3, 106.6, 142.5, and 189.6 cm−1 (Figure 8). The Raman spectrum of the Ag15 cluster has four distinct peaks, centered at 59.0, 104.3, 132.7, and 174.6 cm−1 (Figure 8). With the addition of a Co atom into the Ag15 cluster, the three Raman peaks at 68.0, 141.7, and 19.1 cm−1 shift to a larger wavelength in comparison to the Raman spectrum obtained from the Ag15 cluster (Figure 8).
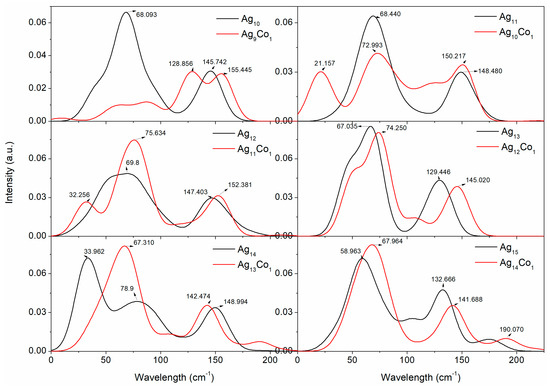
Figure 8.
The Raman spectra of the 10–15-atom Ag–Co clusters.
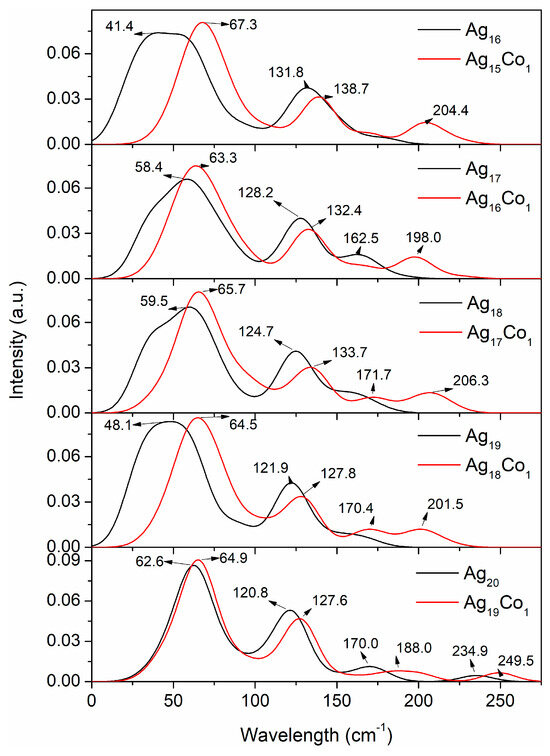
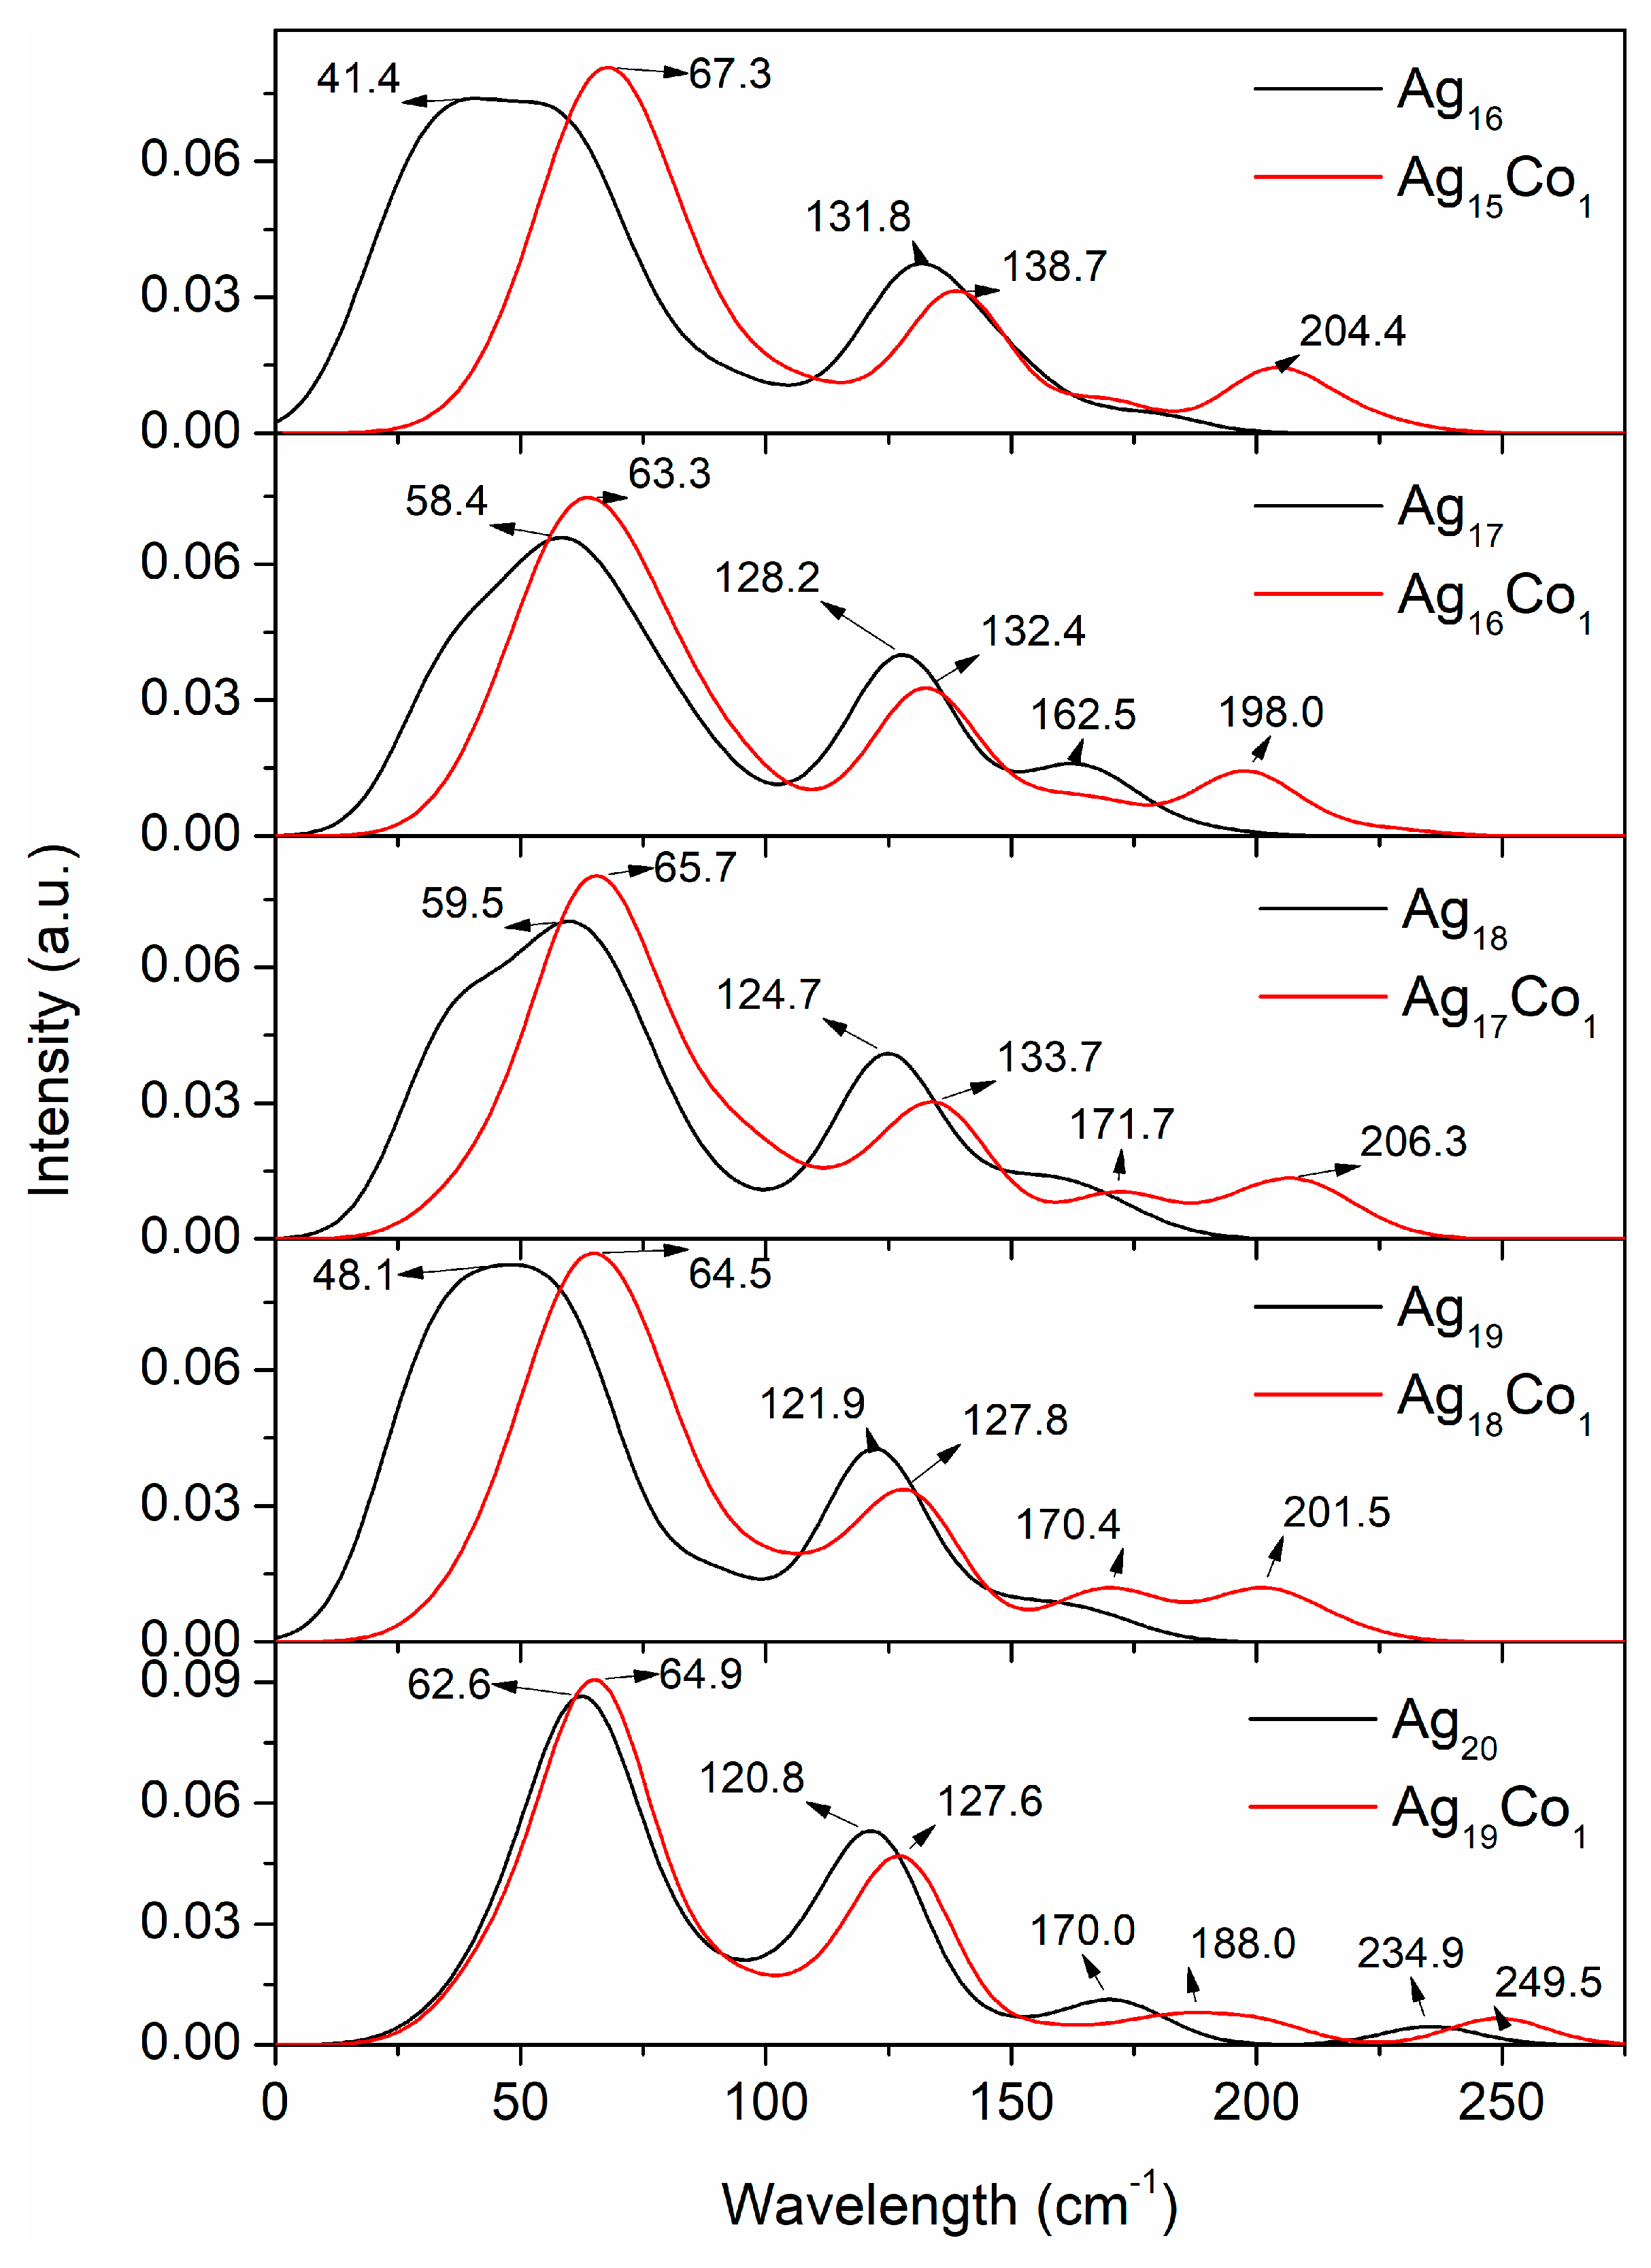
Figure 9.
The Raman spectra of the 16–20-atom Ag–Co clusters.
The Raman spectrum of the Ag16 cluster exhibits two Raman peaks, with centers at 41.4 and 131.8 cm−1 (Figure 9). When a Co atom is doped into the Ag16 cluster, the Raman spectrum shows a new peak at 204.4 cm−1, and the other two peaks shift to greater wavelengths of 67.3 and 138.7 cm−1 (Figure 9). Both Raman spectra of the Ag17 and Ag16Co1 clusters present three Raman peaks; all peaks of the Ag16Co1 clusters shift towards larger wavelengths compared with the Ag17 cluster (Figure 9). There are two Raman peaks at 59.5 and 124.7 cm−1 in the Raman spectrum of the Ag18 cluster (Figure 9). In contrast to the Raman spectrum of the Ag18 cluster, two new Raman peaks appear at 171.7 and 206.3 cm−1, and all Raman peaks shift to larger wavelengths (Figure 9). The Raman spectra of the 19-atom Ag–Co clusters are similar to those of the 18-atom Ag–Co clusters; the Raman spectrum of the Ag18 cluster shows two Raman peaks at 48.1 and 121.9 cm−1, and the Raman spectrum of the Ag18Co1 cluster shows four Raman peaks at 64.5, 127.8, 170.4, and 201.5 cm−1 (Figure 9). Both Raman spectra of the 20-atom Ag–Co cluster display four Raman peaks, and all Raman peaks of the Ag19Co1 cluster shift to the large wavelength area compared with the Ag20 cluster (Figure 9). These findings suggest that the Raman spectra of the Ag–Co clusters can be used to monitor the structural changes in the clusters as the number of Co atoms increases.
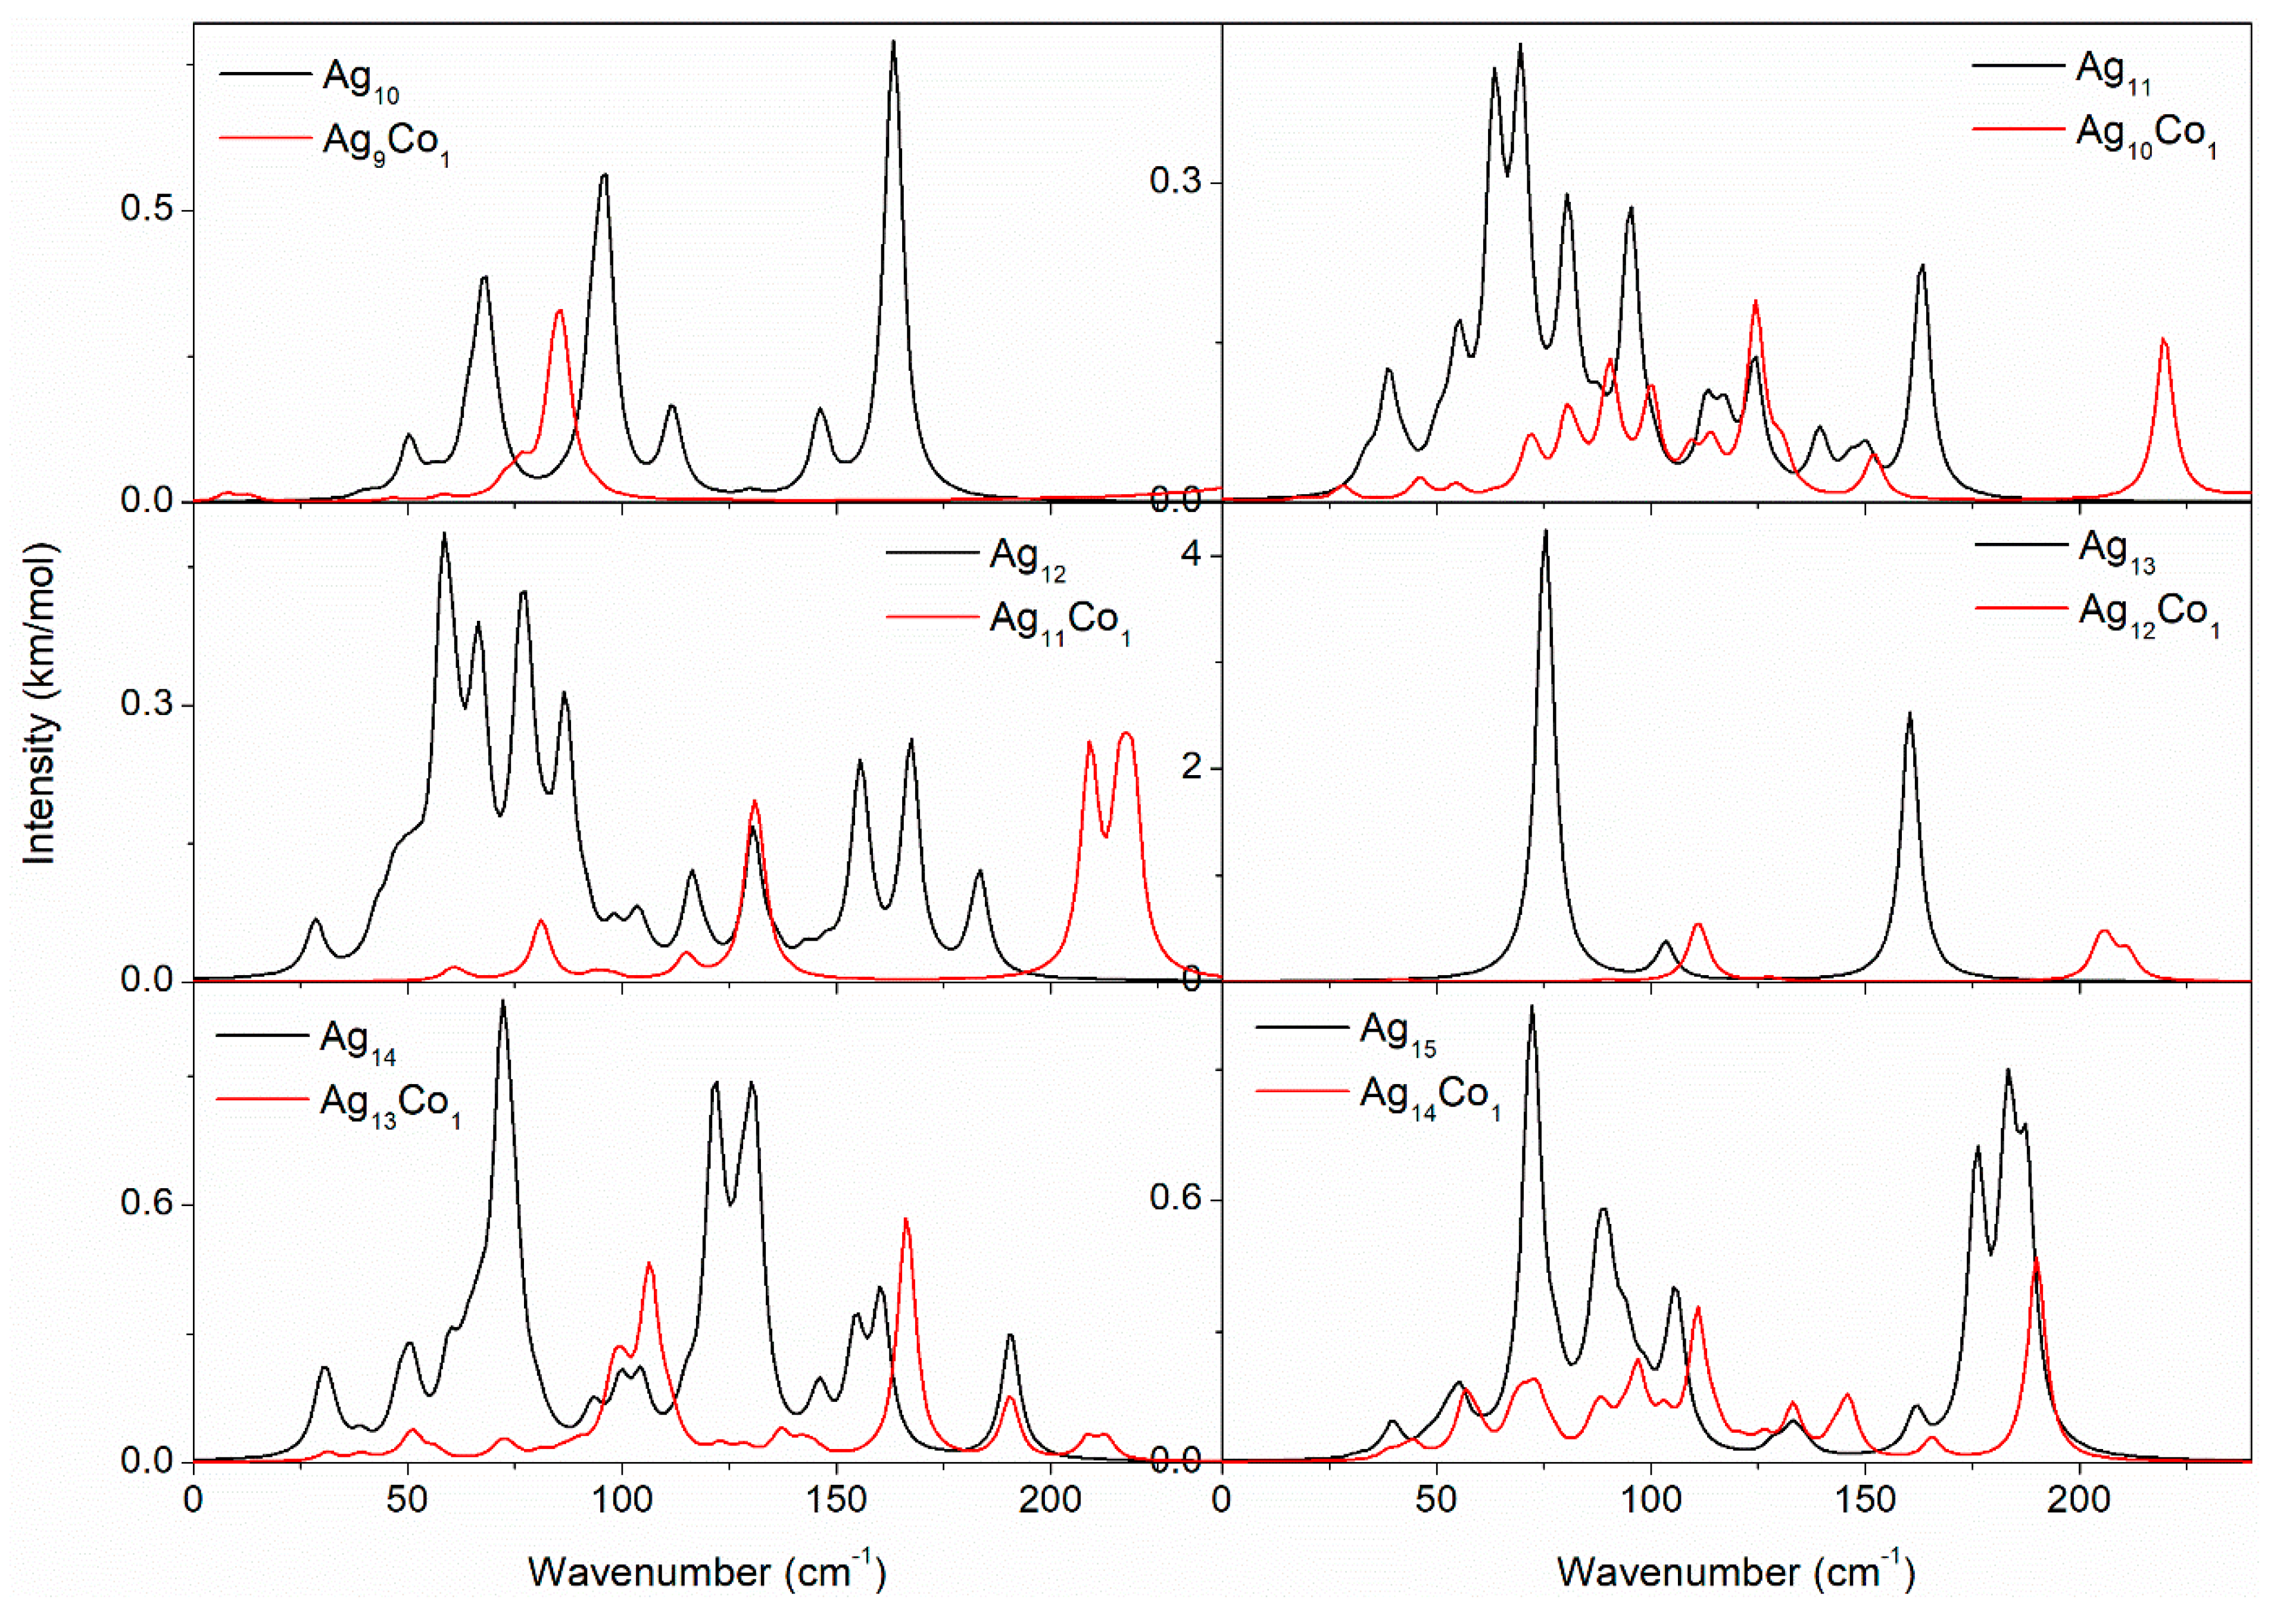
As an effective characterization method, the vibrational spectrum is important for revealing the structure, performance, and stability of Ag–Co clusters. Thus the vibrational spectra of the Ag–Co clusters are studied by GGA/PBE. The vibrational spectra of the 10–15-atom Ag–Co clusters are displayed in Figure 10. The vibrational spectrum of the Ag10 cluster exhibits six peaks at 50.3, 68.3, 96.3, 111.3, 146.3, and 163.3 cm−1, while the vibrational spectrum of the Ag9Co1 cluster exhibits only one significant peak at 85.7 cm−1. This may indicate that the vibrational pattern is more complex in the Ag10 cluster and relatively simple in the Ag9Co1 cluster. Both vibrational spectra of the Ag11 and Ag10Co1 clusters are more complex; the Ag10Co1 cluster has a strong vibrational peak at 262.5 cm−1, while the vibrational peak of the Ag11 cluster is located below a wavenumber of 175.0 cm−1. The vibrational spectrum of the Ag12 cluster exhibits thirteen peaks, while the vibrational spectrum of the Ag11Co1 cluster shows six peaks, suggesting the vibrational pattern of the Ag11Co1 cluster is simpler than that of the Ag12 cluster. Both vibrational spectra of the Ag13 and Ag12Co1 clusters exhibit only three peaks; the vibrational peaks of the Ag13 cluster are located at 75.5, 103.5, and 160.5 cm−1, which is in agreement with our previous results [46], while the vibrational peaks of the Ag12Co1 cluster locate at 111.4, 205.4, and 210.4 cm−1. The vibrational spectrum of the Ag14 cluster appears to be more complex, while the vibrational spectrum of the Ag13Co1 cluster displays a simple vibrational pattern, indicating that the addition of the Co atom leads to a simplifying of the vibrational pattern. Both vibrational spectra of the Ag15 and Ag14Co1 clusters are more complex, and their vibrational peaks are in almost the same positions. In the Ag14Co1 cluster, a vibrational peak is observed at 145.9 cm−1, but no vibrational peaks at 176.3 and 183.3 cm−1 are observed.
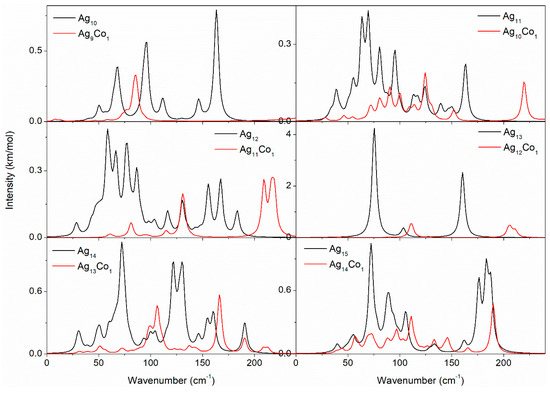
Figure 10.
The vibrational spectra of the 10–15-atom Ag–Co clusters.
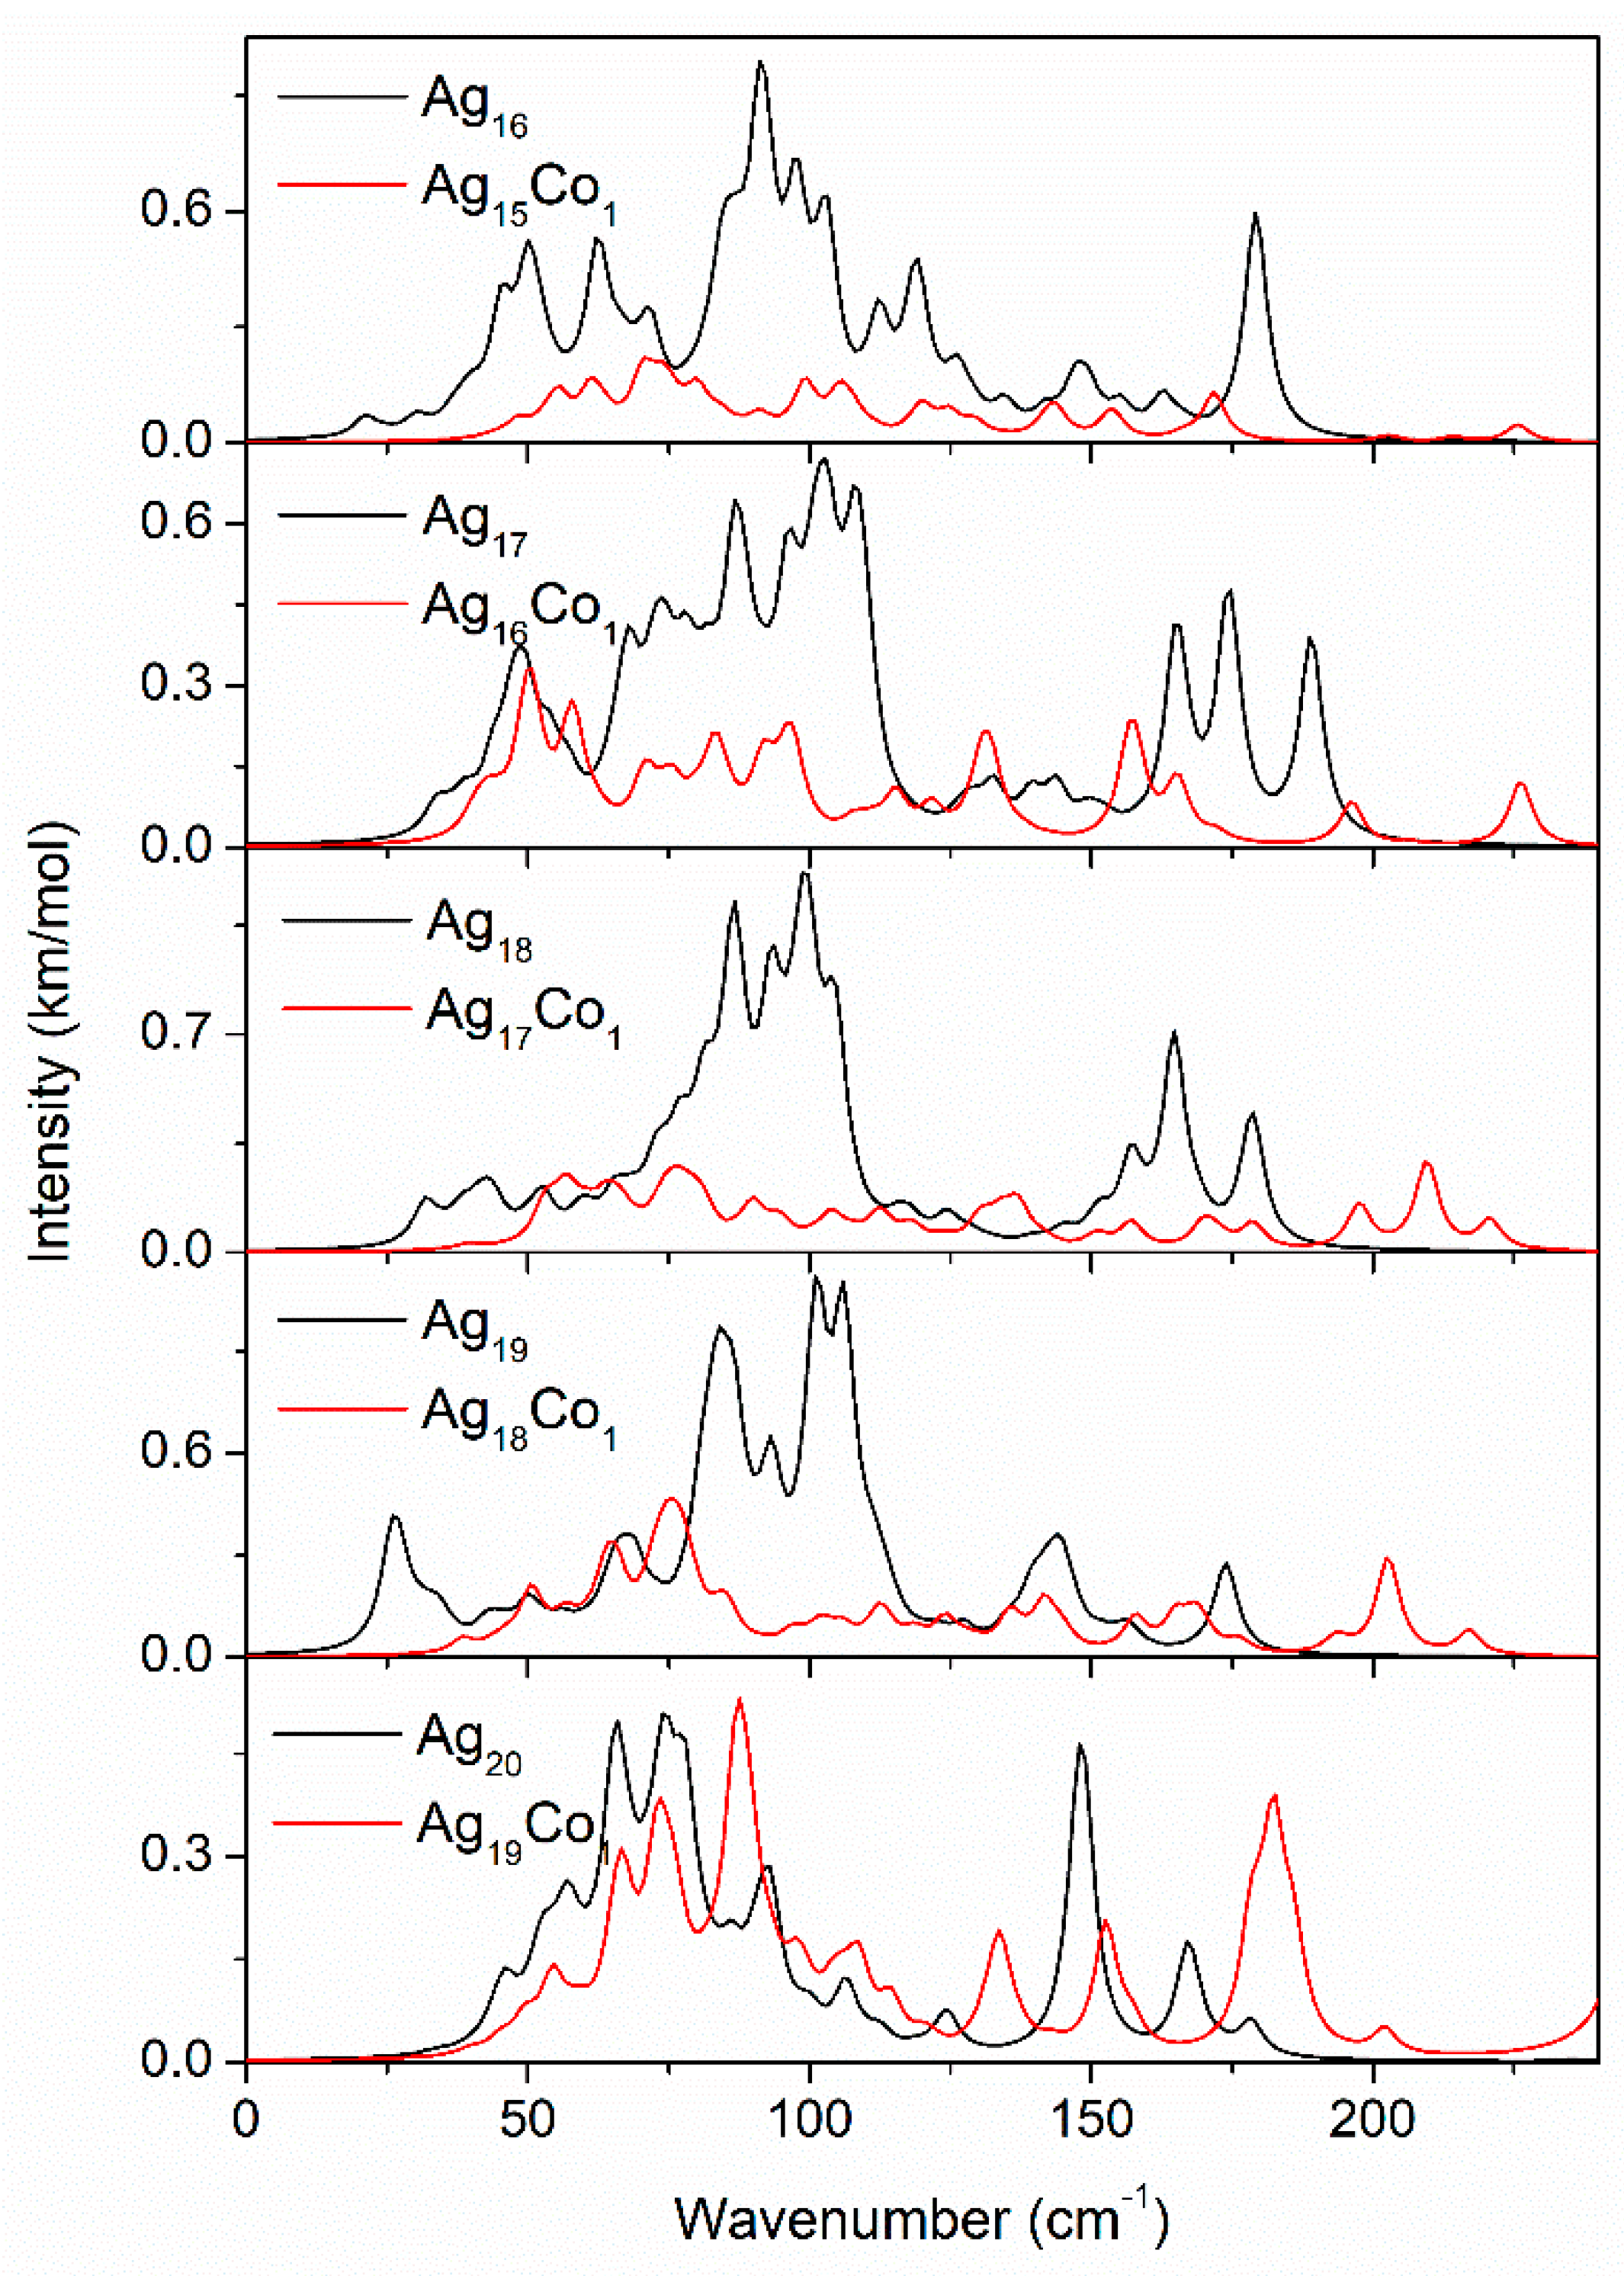
The vibrational spectra of the 16–20-atom Ag–Co clusters are displayed in Figure 11. Both the vibrational spectra of the Ag16 and Ag15Co1 clusters are more complex, and the intensity of the vibrational peaks of the Ag16 cluster is stronger than that of the Ag15Co1 cluster. A new vibrational peak at 225.7 cm−1 is observed in the Ag15Co1 cluster. The vibrational spectra of the Ag17 and Ag16Co1 clusters are similar to those of the Ag16 and Ag15Co1 clusters; they are more complex, and a new vibrational peak at 225.8 cm−1 is observed in the Ag16Co1 cluster. The vibrational spectra of the 18-, 19- and 20-atom Ag and Ag–Co clusters are also similar to those of the Ag16 and Ag15Co1 clusters, and they are also more complex; however, the vibrational spectra of the 18-, 19-, and 20-atom Ag–Co clusters exhibit some new vibrational peaks above 200 cm−1. These findings can serve as a basis for further investigations into the Ag–Co clusters and their potential applications in various fields. Moreover, the vibrational spectra presented here can serve as a reference for the characterization of other Ag–Co clusters and related systems, contributing to a deeper understanding of their structural and dynamic properties.
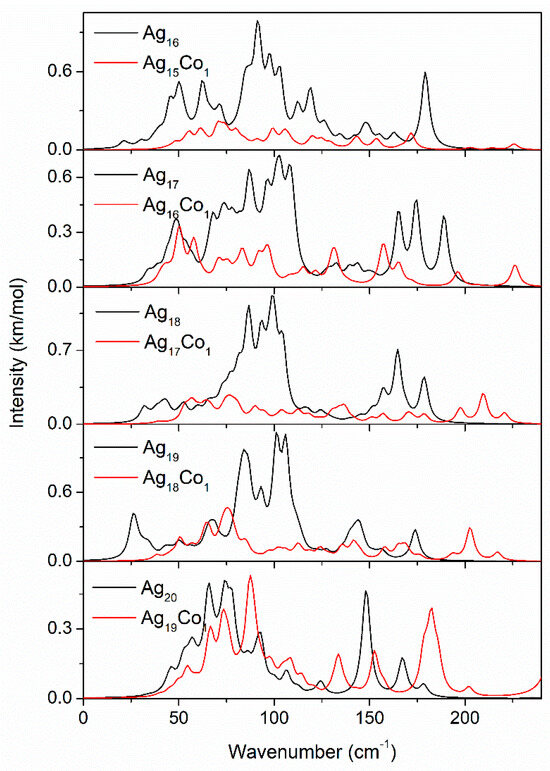
Figure 11.
The vibrational spectra of the 16–20-atom Ag–Co clusters.
The magnetic characteristics of the Ag–Co clusters are displayed in Figure 12. As is evident from Figure 12, the magnetic characteristics of the Ag–Co clusters are quite intriguing. The magnetic moment of the Ag10 cluster is 2 µB, which is different from those of the Ag12, Ag14, Ag16, Ag18, and Ag20 clusters, for all of which the magnetic moments are zero. The magnetic moment of the Ag15 cluster is 3 µB, which is different from those of the Ag11, Ag13, Ag17, and Ag19 clusters, for all of which the magnetic moments are 1 µB. The addition of the Co atom leads to the magnetic moments of the Ag11Co1, Ag13Co1, and Ag19Co1 clusters increasing to 2 µB, and that of the Ag12Co1 cluster increasing to 3 µB, while that of the Ag9Co1 cluster decreases to zero. The magnetic moments of the Ag10Co1, Ag14Co1, Ag15Co1, Ag16Co1, Ag17Co1, and Ag18Co1 clusters, on the other hand, remain unchanged—both the magnetic moments of the Ag15Co1 and Ag17Co1 clusters are zero, all the magnetic moments of the Ag10Co1, Ag16Co1, and Ag18Co1 clusters are 1 µB, and the magnetic moment of the Ag14Co1 cluster is 3 µB. The current study serves as a starting point for researchers interested in exploring the fascinating world of Ag–Co clusters and their unique magnetic properties. Future investigations are expected to reveal more about the intricate interactions between Ag and Co atoms, opening up new avenues for the development of advanced magnetic materials.
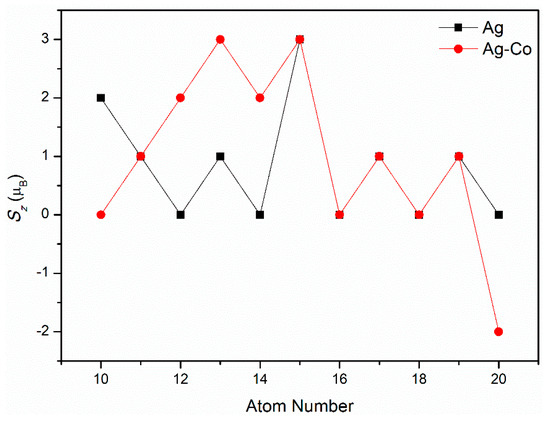
Figure 12.
The magnetic properties of Ag–Co clusters.
4. Conclusions
The structural, electronic, magnetic, and optical characteristics of Co-doped 10–20-atom silver clusters were investigated by GGA/PBE. The Ag–Co clusters easily form core–shell structures, with Co atom in the center. With a growth in the quantity of atoms, the Ag clusters (except the Ag13 cluster) retain an almost icosahedral structure, with the addition of some Ag atoms, and Ag–Co clusters also receive some Ag atoms on top of their icosahedral structure. The energy gap values of AgnCo1 (n = 10–15, 17) clusters are lower than the ones for pure silver clusters; the energy gap values of AgnCo1 (n = 9, 16, 18, 19) clusters are larger than those of pure silver clusters. The electronegativity χ value of the Ag16Co1 cluster is the strongest. The S values of the AgnCo1 (n = 9–15, 17) clusters increase when doping the Co atom, and the S values of the AgnCo1 (n = 9, 16, 18, 19) clusters decrease when doping the Co atom. The S value of the Ag15Co1 cluster is the greatest. The ω value of the Ag16Co1 cluster is greatest. In the optical spectra of pure Ag clusters, redshift occurs with an increasing number of atoms. In the optical spectra of Ag–Co clusters, the energy of their spectra overall exhibits little change with an increasing number of atoms; the strongest peaks are roughly distributed around 3.5 eV, and the overall intensity of their spectra strengthens. The Raman and vibrational spectra of the Ag–Co clusters can be used to monitor structural changes in the clusters as the number of Co atoms increases. The addition of a Co atom leads to the magnetic moments of the Ag11Co1, Ag13Co1, and Ag19Co1 clusters increasing to 2 µB, that of the Ag12Co1 cluster increasing to 3 µB, and that of the Ag9Co1 cluster decreasing to zero, while the magnetic moments of the Ag10Co1, Ag14Co1, Ag15Co1, Ag16Co1, Ag17Co1, and Ag18Co1 clusters remain unchanged. Therefore, this study on the performances of Ag–Co double metal clusters could provide important guidance for their application in optical and photoelectric devices.
Author Contributions
Conceptualization, W.L.; formal analysis, R.S.; investigation, H.F.; writing—original draft preparation, W.L. and R.S.; writing—review and editing, R.S. and H.F.; funding acquisition, W.L. All authors have read and agreed to the published version of the manuscript.
Funding
This work was supported by the Natural Science Foundation of Ningxia (Grant Nos. 2023AAC03318 and 2022AAC03267), the National Natural Science Foundation of China (Grant No. 11764001), the High Level Talent Project of North Minzu University (Grant No. 2019BGGZ08), the Ningxia new solid electronic materials and Devices research and development innovation team (Grant No. 2020CXTDLX12), and the Fundamental Research Funds for the Central Universities, North Minzu University (Grant No. 2022XYZDX03).
Data Availability Statement
The authors declare that all data supporting the findings of this study are available within the article.
Conflicts of Interest
The authors declare that they have no known competing financial interests or personal relationships that could have appeared to influence the work reported in this paper.
References
- Ferrando, R.; Jellinek, J.; Johnston, R.L. Nanoalloys: From theory to applications of alloy clusters and nanoparticles. Chem. Rev. 2008, 108, 845–910. [Google Scholar] [CrossRef] [PubMed]
- Lewis, L.N. Chemical Catalysis by Colloids and Clusters. Chem. Rev. 1993, 93, 2693–2730. [Google Scholar] [CrossRef]
- Darbha, G.K.; Ray, A.; Ray, P.C. Gold nanoparticle-based miniaturized nanomaterial surface energy transfer probe for rapid and ultrasensitive detection of mercury in soil, water, and fish. ACS Nano 2007, 1, 208–214. [Google Scholar] [CrossRef] [PubMed]
- Dreaden, E.C.; Mackey, M.A.; Huang, X.H.; Kang, B.; El-Sayed, M.A. Beating cancer in multiple ways using nanogold. Chem. Soc. Rev. 2011, 40, 3391–3404. [Google Scholar] [CrossRef] [PubMed]
- Mirkin, C.A.; Letsinger, R.L.; Mucic, R.C.; Storhoff, J.J. A DNA-based method for rationally assembling nanoparticles into macroscopic materials. Nature 1996, 382, 607–609. [Google Scholar] [CrossRef] [PubMed]
- Nicewarner-Pena, S.R.; Freeman, R.G.; Reiss, B.D.; He, L.; Pena, D.J.; Walton, I.D.; Cromer, R.; Keating, C.D.; Natan, M.J. Submicrometer metallic barcodes. Science 2001, 294, 137–141. [Google Scholar] [CrossRef] [PubMed]
- Li, W.; Chen, F. Ultraviolet-visible absorption, Raman, vibration spectra of pure silver and Ag-Cu clusters: A density functional theory study. Phys. B 2014, 451, 96–105. [Google Scholar] [CrossRef]
- Li, W.; Ding, L.; Wang, K.; Wang, W.; Zhang, S. A density functional theory study of structural, electronic and optical properties of 9-atom silver-copper clusters. Mater. Today Commun. 2020, 25, 101248. [Google Scholar] [CrossRef]
- Li, W.; Ding, L.; Zhao, T.; Liu, Y. Structural, electronic, and optical properties of the Ag-Cu clusters with the equal number atoms. J. Nanoparticle Res. 2022, 24, 11. [Google Scholar] [CrossRef]
- Li, W.Y.; Zhang, S.; Hai, L. Structural, optical, electronic, and magnetic properties of Ag-Cu bimetallic clusters: A density functional theory study. J. Nanoparticle Res. 2018, 20, 188. [Google Scholar] [CrossRef]
- Gaudry, M.; Cottancin, E.; Pellarin, M.; Lermé, J.; Arnaud, L.; Huntzinger, J.R.; Vialle, J.L.; Broyer, M.; Rousset, J.L.; Treilleux, M.; et al. Size and composition dependence in the optical properties of mixed (transition metal/noble metal) embedded clusters. Phys. Rev. B 2003, 67, 5409. [Google Scholar] [CrossRef]
- Ma, W.Q.; Chen, F.Y. Optical and electronic properties of Cu doped Ag clusters. J. Alloys Compd. 2012, 541, 79–83. [Google Scholar] [CrossRef]
- Wang, L.; Die, D.; Wang, S.J.; Zhao, Z.Q. Geometrical, electronic, and magnetic properties of CunFe (n = 1–12) clusters: A density functional study. J. Phys. Chem. Solids 2015, 76, 10–16. [Google Scholar] [CrossRef]
- Bhatt, M.D.; Lee, G.; Lee, J.S.; Lee, J.Y. Electrocatalytic property of water oxidation reaction depends on charging state of intermediates on Ag-M (M = Fe, co, Ni, Cu) in alkaline media. Int. J. Hydrogen Energy 2019, 44, 5863–5871. [Google Scholar] [CrossRef]
- Andreazza, P.; Lemoine, A.; Coati, A.; Nelli, D.; Ferrando, R.; Garreau, Y.; Creuze, J.; Andreazza-Vignolle, C. From metastability to equilibrium during the sequential growth of Co-Ag supported clusters: A real-time investigation. Nanoscale 2021, 13, 6096–6104. [Google Scholar] [CrossRef] [PubMed]
- Zhevnenko, S.N.; Chernyshikhin, S.V. The effect of cobalt on surface energy of Ag(Co) alloys. Mater. Lett. 2020, 258, 126800. [Google Scholar] [CrossRef]
- Amaya-Roncancio, S.; Reinaudi, L.; Gimenez, M.C. Adsorption and dissociation of CO on metal clusters. Mater. Today Commun. 2020, 24, 101158. [Google Scholar] [CrossRef]
- Cesari, C.; Berti, B.; Calcagno, F.; Femoni, C.; Garavelli, M.; Iapalucci, M.C.; Rivalta, I.; Zacchini, S. Polymerization Isomerism in Co-M (M = Cu, Ag, Au) Carbonyl Clusters: Synthesis, Structures and Computational Investigation. Molecules 2021, 26, 1529. [Google Scholar] [CrossRef]
- Cesari, C.; Berti, B.; Calcagno, F.; Lucarelli, C.; Garavelli, M.; Mazzoni, R.; Rivalta, I.; Zacchini, S. Bimetallic Co–M (M = Cu, Ag, and Au) Carbonyl Complexes Supported by N-Heterocyclic Carbene Ligands: Synthesis, Structures, Computational Investigation, and Catalysis for Ammonia Borane Dehydrogenation. Organometallics 2021, 40, 2724–2735. [Google Scholar] [CrossRef]
- Jia, N.N.; Song, S.P.; Zhang, Y.Z.; Zhou, H.R.; Wang, J.Z. First-principles study on adsorption C2H4 on the surface of ConAgm clusters (n + m = 13). J. At. Mol. Phys. 2018, 35, 592. [Google Scholar] [CrossRef]
- Cheng, Z.F.; Fu, C.P.; Bai, J. First-principles study of the geometry and properties of ComAgn(m + n = 13) clusters. J. At. Mol. Phys. 2015, 32, 993. [Google Scholar]
- Dzhurakhalov, A.A.; Atanasov, I.; Hou, M. Calculation of binary and ternary metallic immiscible clusters with icosahedral structures. Phys. Rev. B 2008, 77, 115415. [Google Scholar] [CrossRef]
- Garcia-Torres, J.; Gomez, E.; Valles, E. Evolution of magnetic and structural properties from Ag nanolayers to several microns Co–Ag deposits prepared by electrodeposition. J. Electroanal. Chem. 2009, 635, 63. [Google Scholar] [CrossRef]
- Laasonen, K.; Panizon, E.; Bochicchio, D.; Ferrando, R. Competition between Icosahedral Motifs in AgCu, AgNi, and AgCo Nanoalloys: A Combined Atomistic–DFT Study. J. Phys. Chem. C 2013, 117, 26405–26413. [Google Scholar] [CrossRef]
- Ferrando, R.; Fortunelli, A.; Johnston, R.L. Searching for the optimum structures of alloy nanoclusters. Phys. Chem. Chem. Phys. 2008, 10, 640. [Google Scholar] [CrossRef] [PubMed]
- Bochicchio, D.; Ferrando, R. Size-dependent transition to high-symmetry chiral structures in AgCu, AgCo, AgNi, and AuNi nanoalloys. Nano Lett. 2010, 10, 4211–4216. [Google Scholar] [CrossRef] [PubMed]
- Kong, J.; Zhang, R.; Li, Z.; Liu, B.X. Magnetic properties of Co and Co-Ag alloys in equilibrium/nonequilibrium structures studied by ab initio calculations. Phys. Rev. B 2003, 68, 134446. [Google Scholar] [CrossRef]
- Van Hoof, T.; Dzhurakhalov, A.; Hou, M. Interface formation by low energy deposition of core-shell Ag-Co nanoclusters on Ag(100). Eur. Phys. J. D 2007, 43, 159–163. [Google Scholar] [CrossRef]
- Van Hoof, T.; Hou, M. Structural and thermodynamic properties of Ag-Co nanoclusters. Phys. Rev. B 2005, 72, 115434. [Google Scholar] [CrossRef]
- Janssens, E.; Neukermans, S.; Nguyen, H.M.; Nguyen, M.T.; Lievens, P. Quenching of the magnetic moment of a transition metal dopant in silver clusters. Phys. Rev. Lett. 2005, 94, 113401. [Google Scholar] [CrossRef]
- Janssens, E.; Van Hoof, T.; Veldeman, N.; Neukermans, S.; Hou, M.; Lievens, P. Mass spectrometric and modeling investigations of bimetallic silver–cobalt clusters. Int. J. Mass Spectrom. 2006, 252, 38–46. [Google Scholar] [CrossRef]
- Li, W.; Shang, R.; Lei, Y.; Liu, Y.; Ma, C. Density Functional Theory Study on Structural, Electronic, Magnetic, and Optical Properties of Au, Cu, Cr, Mn, Co, Ni, and Fe Atoms Doped 13-Atom Silver Clusters. Nano 2023, 18, 2350077. [Google Scholar] [CrossRef]
- Li, W.; Shang, R.; Wang, C.; Zhang, Y. Study on the structural, electronic and optical properties of the Ag-Co clusters based on density functional theory. J. At. Mol. Phys. 2025, 42, 022001. [Google Scholar] [CrossRef]
- Zhang, J.; Dolg, M. ABCluster: The artificial bee colony algorithm for cluster global optimization. Phys. Chem. Chem. Phys. 2015, 17, 24173. [Google Scholar] [CrossRef] [PubMed]
- Zhang, J.; Dolg, M. Global optimization of clusters of rigid molecules using the artificial bee colony algorithm. Phys. Chem. Chem. Phys. 2016, 18, 3003. [Google Scholar] [CrossRef] [PubMed]
- Gupta, R.P. Lattice-Relaxation at a Metal-Surface. Phys Rev B 1981, 23, 6265–6270. [Google Scholar] [CrossRef]
- Cleri, F.; Rosato, V. Tight-Binding Potentials for Transition-Metals and Alloys. Phys. Rev. B 1993, 48, 22–33. [Google Scholar] [CrossRef] [PubMed]
- Delley, B. Hardness conserving semilocal pseudopotentials. Phys. Rev. B 2002, 66, 155125. [Google Scholar] [CrossRef]
- Delley, B. From molecules to solids with the DMol3 approach. J. Chem. Phys. 2000, 113, 7756–7764. [Google Scholar] [CrossRef]
- Perdew, J.P.; Burke, K.; Ernzerhof, M. Generalized gradient approximation made simple. Phys. Rev. Lett. 1996, 77, 3865–3868. [Google Scholar] [CrossRef]
- Delley, B. An All-Electron Numerical-Method for Solving the Local Density Functional for Polyatomic-Molecules. J. Chem. Phys. 1990, 92, 508–517. [Google Scholar] [CrossRef]
- Delley, B. Time dependent density functional theory with DMol3. J. Phys.-Condens. Mat. 2010, 22, 384208. [Google Scholar] [CrossRef] [PubMed]
- Chen, M.; Dyer, J.E.; Li, K.; Dixon, D.A. Prediction of Structures and Atomization Energies of Small Silver Clusters, (Ag)n, n < 100. J. Phys. Chem. A 2013, 117, 8298–8313. [Google Scholar] [CrossRef] [PubMed]
- Harb, M.; Rabilloud, F.; Simon, D.; Rydlo, A.; Lecoultre, S.; Conus, F.; Rodrigues, V.; Felix, C. Optical absorption of small silver clusters: Agn, (n = 4–22). J. Chem. Phys. 2008, 129, 194108. [Google Scholar] [CrossRef] [PubMed]
- Tian, D.; Zhang, H.; Zhao, J. Structure and structural evolution of Agn (n = 3–22) clusters using a genetic algorithm and density functional theory method. Solid State Commun. 2007, 144, 174–179. [Google Scholar] [CrossRef]
- Li, W.; Chen, F. Effects of shape and dopant on structural, optical absorption, Raman, and vibrational properties of silver and copper quantum clusters: A density functional theory. Chin. Phys. B 2014, 23, 117103. [Google Scholar] [CrossRef]
- Li, W.; Chen, F. A density functional theory study of structural, electronic, optical and magnetic properties of small Ag-Cu nanoalloys. J. Nanoparticle Res. 2013, 15, 1809. [Google Scholar] [CrossRef]
- Baishya, K.; Idrobo, J.C.; Ogut, S.; Yang, M.L.; Jackson, K.; Jellinek, J. Optical absorption spectra of intermediate-size silver clusters from first principles. Phys. Rev. B 2008, 78, 075439. [Google Scholar] [CrossRef]
- Conus, F.; Lau, J.T.; Rodrigues, V.; Félix, C. High sensitivity absorption measurement of small metal clusters embedded in an argon matrix. Rev. Sci. Instrum. 2006, 77, 113103. [Google Scholar] [CrossRef]
- Harbich, W.; Fedrigo, S.; Buttet, J. The Optical-Absorption Spectra of Small Silver Clusters (N = 5–11) Embedded in Argon Matrices. Chem. Phys. Lett. 1992, 195, 613–617. [Google Scholar] [CrossRef]
- Harbich, W.; Fedrigo, S.; Buttet, J. The Optical-Absorption Spectra of Small Silver Clusters (N = 8–39) Embedded in Rare-Gas Matrices. Z. Phys. D At. Mol. Clust. 1993, 26, 138. [Google Scholar] [CrossRef]


Disclaimer/Publisher’s Note: The statements, opinions and data contained in all publications are solely those of the individual author(s) and contributor(s) and not of MDPI and/or the editor(s). MDPI and/or the editor(s) disclaim responsibility for any injury to people or property resulting from any ideas, methods, instructions or products referred to in the content. |
© 2024 by the authors. Licensee MDPI, Basel, Switzerland. This article is an open access article distributed under the terms and conditions of the Creative Commons Attribution (CC BY) license (https://creativecommons.org/licenses/by/4.0/).