
Uncovering Metabolic Alterations in HCT-116 Colon Cancer Cells upon Exposure to Bamboo Leaf Extract Obtained from Guadua incana Londoño

 ,
,  , , ,
, , ,  , and
, and 
Abstract

1. Introduction
2. Results
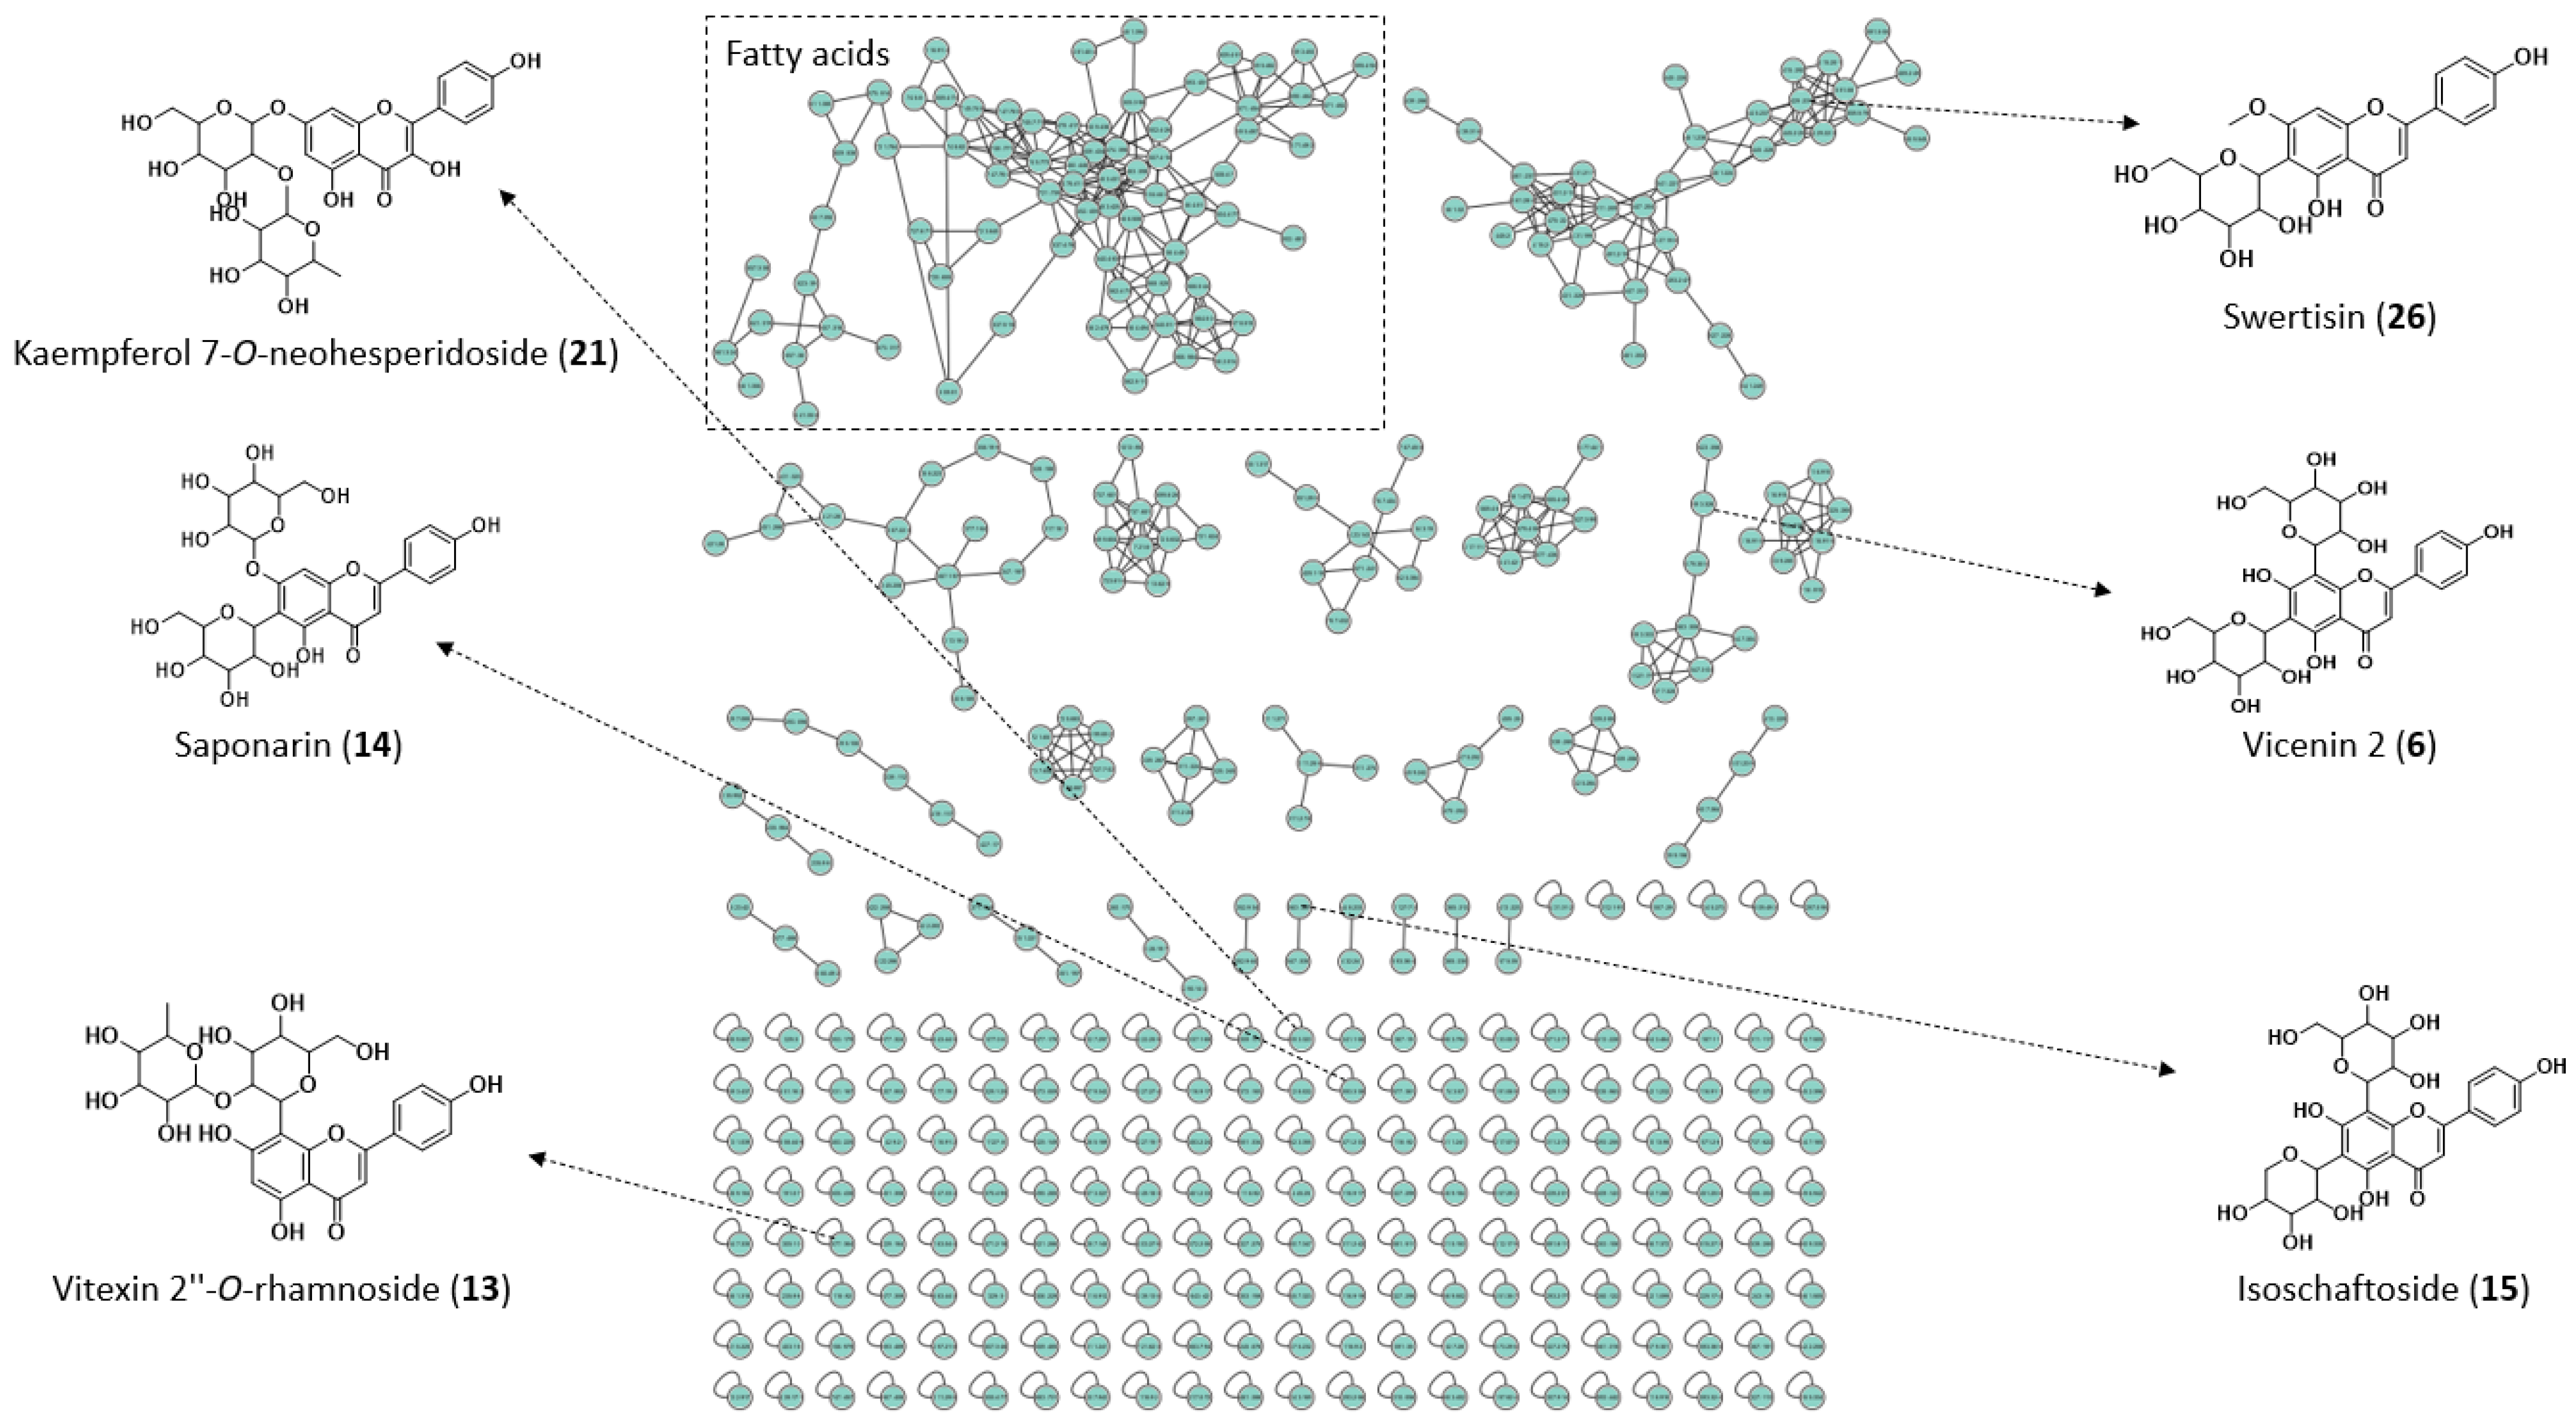
2.1. Chemical Characterization of Extract

| No | tR (min) | UV λmax (nm) | Molecular Formula | Adduct Ion | Calculated Mass (m/z) | Experimental Mass (m/z) | Mass Error (ppm) | Main Fragment Ions (MS/MS) | Identification Confidence Level | Metabolite | Reference or Database a |
|---|---|---|---|---|---|---|---|---|---|---|---|
| 1 | 0.57 | - | C7H12O6 | [M − H]− | 191.0551 | 191.0543 | −4.2 | 175, 147, 129, 111 | 2 | Quinic acid | [14,19,20] |
| 2 | 1.94 | Low intensity | C15H16O10 | [M − H]− | 355.0670 | 355.0669 | −0.3 | 209, 191, 163, 147, 129 | 4 | Not identified | |
| 3 | 2.33 | Low intensity | C16H18O8 | [M − H]− | 337.0928 | 337.0945 | 5.0 | 191, 173, 164, 119 | 2 | O-Coumaroylquinic acid | [14,18,20,21] and GNPS |
| 4 | 2.36 | 270, 327 | C27H30O16 | [M − H]− | 609.1461 | 609.1466 | 0.8 | 547, 519, 489, 429, 399 | 3 | Luteolin 6-C-hexoside 8-C-pentoside | |
| 5 | 2.51 | 274, 336 | C21H20O10 | [M − H]− | 431.0983 | 431.0981 | −0.5 | 387, 341, 311, 179 | 4 | Not identified | |
| 6 | 2.68 | 272, 325 | C27H30O15 | [M − H]− | 593.1511 | 593.1513 | 0.3 | 503, 473, 383, 353, 297 | 2 | Vicenin 2 | [14,22] and GNPS |
| 7 | 2.70 | 269, 325 | C21H20O11 | [M − H]− | 447.0932 | 447.0931 | −0.2 | 327, 299, 285, 133, 109 | 4 | Not identified | |
| 8 | 2.71 | 268, 337 | C27H30O15 | [M − H]− | 593.1511 | 593.1517 | 1.0 | 457, 383, 353, 297 | 2 | Apigenin 6,8-digalactoside | [18] and GNPS |
| [M + H]+ | 595.1668 | 595.1660 | −1.3 | 541, 481, 457, 379, 325, 295 | |||||||
| 9 | 2.71 | 267, 326 | C26H28O14 | [M − H]− | 563.1406 | 563.1411 | 0.9 | 473, 443, 383, 353, 325, 2.97 | 4 | Not identified | |
| 10 | 2.74 | 311 | C9H8O4 | [M − H]− | 179.0349 | 179.0352 | 1.7 | 135, 119 | 1 | Caffeic acid st | [23,24,25] |
| 11 | 2.77 | 271, 333 | C26H28O14 | [M − H]− | 563.1406 | 563.1410 | 0.7 | 445, 355, 325, 297 | 4 | Not identified | |
| 12 | 2.80 | 269, 334 | C26H28O14 | [M − H]− | 563.1416 | 563.1415 | −0.2 | 473, 443, 401, 383, 353, 311 | 4 | Not identified | |
| 13 | 2.87 | 265, 341 | C27H30O14 | [M − H]− | 577.1562 | 577.1565 | 0.5 | 413, 341, 293, 175 | 2 | Vitexin 2″-O-rhamnoside | [14] and GNPS |
| [M + H]+ | 579.1719 | 579.171 | −1.6 | 433, 415, 367, 313, 283 | |||||||
| 14 | 2.88 | 269, 342 | C27H30O15 | [M − H]− | 593.1511 | 593.1519 | 1.3 | 473, 431, 353, 311, 297, 282 | 2 | Saponarin or Isosaponarin | [14,18] and GNPS |
| 15 | 2.91 | 271, 335 | C26H28O14 | [M − H]− | 563.1406 | 563.1401 | −0.9 | 473, 443, 383, 353, 325, 297 | 2 | Schaftoside or Isoschaftoside | [14,18,20,21,26,27] and GNPS |
| [M + H]+ | 565.1562 | 565.1563 | 0.2 | 547, 529, 499, 457, 427, 379 | |||||||
| 16 | 3.13 | 273, 339 | C26H28O14 | [M + H]+ | 565.1562 | 565.1564 | 0.4 | 525, 481, 405, 337, 295 | 3 | Vicenin 1 or Vicenin 3 | |
| 17 | 3.16 | 270, 344 | C28H32O16 | [M − H]− | 623.1617 | 623.1617 | 0.0 | 504, 443, 353, 323 | 3 | Isoscoparin 2″-O-hexoside | |
| 18 | 3.18 | 271, 342 | C28H32O15 | [M + H]+ | 609.1824 | 609.1824 | 0.0 | 430, 393, 327, 297, 267 | 3 | Spinosin or Isospinosin | |
| 19 | 3.20 | Low intensity | C9H8O3 | [M − H]− | 163.0400 | 163.0400 | 0.0 | 119 | 1 | p-Coumaric acid st | [28] and GNPS |
| 20 | 3.23 | 270, 341 | C27H30O14 | [M − H]− | 577.1562 | 577.1569 | 1.2 | 533, 472, 413, 353, 293 | 2 | Violanthin or Isoviolanthin | [29] |
| 21 | 3.24 | 269, 332 | C27H30O15 | [M − H]− | 593.1511 | 593.1512 | 0.2 | 285, 218, 151 | 2 | Kaempferol 7-O-neohesperidoside | [29] and GNPS |
| 22 | 3.28 | 270, 325 | C33H40O19 | [M − H]− | 739.2091 | 739.209 | −0.1 | 593, 431, 281 | 3 | Kaempferol 3-O-disaccharoside-7-O-pentoside | |
| 23 | 3.28 | 270, 326 | C27H30O15 | [M + H]+ | 595.1668 | 595.1667 | −0.2 | 449, 287 | 3 | Kaempferol 3-O-disaccharoside | |
| 24 | 3.35 | 272, 326 | C21H18O13 | [M − H]− | 477.0674 | 477.0675 | 0.2 | 431, 301, 179 | 3 | Quercetin 3-O-hexoside | |
| 25 | 3.37 | 270, 325 | C21H20O12 | [M − H]− | 463.0882 | 463.0880 | −0.4 | 372, 300, 271, 255, 243, 151 | 2 | Hyperoside | [28] |
| 26 | 3.38 | 271, 328 | C22H22O10 | [M − H]− | 445.1140 | 445.1145 | 1.1 | 385, 325, 297, 282, 269 | 2 | Swertisin | [18] |
| 27 | 3.41 | 271, 329 | C28H32O17 | [M − H]− | 639.1566 | 639.1570 | 0.6 | 403, 328, 313, 285, 270, 242 | 3 | Isorhamnetin 3,4′-hexoside | |
| 28 | 3.54 | 271, 344 | C27H30O14 | [M − H]− | 577.1562 | 577.1561 | −0.2 | 269, 117 | 3 | Apigenin 7-O-disaccharoside | |
| 29 | 3.56 | 269, 342 | C27H30O14 | [M + H]+ | 579.1719 | 579.1718 | −0.2 | 433, 363, 271, 153 | 3 | Apigenin 7-O-disaccharoside | |
| 30 | 3.58 | 268, 331 | C22H22O11 | [M − H]− | 461.1089 | 461.1087 | −0.4 | 415, 341, 313, 298 | 4 | Not identified | |
| 31 | 3.59 | 270, 325 | C28H34O15 | [M − H]− | 609.1824 | 609.1843 | 3.1 | 325, 301, 286, 151 | 3 | Hesperidin | |
| 32 | 3.61 | 271, 344 | C28H32O15 | [M + H]+ | 609.1826 | 609.1810 | −2.6 | 463, 301, 286, 258 | 3 | Diosmetin 7-O-disaccharoside | |
| 33 | 3.64 | 269, 326 | C28H32O16 | [M − H]− | 623.1617 | 623.1620 | 0.5 | 329, 314, 299, 271, 243, 187 | 3 | Isorhamnetin 3-O-hexoside-6″-disaccharoside | |
| 34 | 3.73 | 265, 341 | C27H30O15 | [M − H]− | 593.1511 | 593.1512 | 0.2 | 473, 431, 353, 341, 311, 283 | 3 | Apigenin 6-C-hexoside-7-O-hexoside | |
| [M + H]+ | 595.1668 | 595.1667 | −0.2 | 415, 379, 337, 313, 283, 165 | |||||||
| 35 | 4.47 | 264, 356 | C15H10O6 | [M − H]− | 285.0404 | 285.0403 | −0.4 | 199, 169, 151, 133 | 2 | Luteolin | [30,31,32] |
| 36 | 4.57 | 270, 319 | C15H12O3 | [M − H]− | 239.0713 | 239.0699 | −5.9 | 211, 195, 179, 135 | 3 | 6-Hidroxyflavanone | |
| 37 | 4.88 | 264, 329 | C23H24O12 | [M − H]− | 491.1195 | 491.1198 | 0.6 | 461, 328, 313, 285, 226 | 2 | Tricin 7-O-glucoside | [18] |
| 38 | 4.92 | 264, 335 | C27H32O14 | [M − H]− | 579.1719 | 579.1720 | 0.2 | 271, 177, 151, 119 | 3 | Naringenin-7-O-disaccharoside | |
| 39 | 4.95 | 263, 334 | C21H22O10 | [M − H]− | 433.1140 | 433.1145 | 1.2 | 271, 151, 119 | 3 | Naringenin-7-O-hexoside | |
| 40 | 4.97 | 271, 358 | C15H10O5 | [M − H]− | 269.0455 | 269.0460 | 1.9 | 227, 181, 151, 117 | 2 | Apigenin | [30] |
| 41 | 5.01 | 244, 315 | C15H10O6 | [M − H]− | 285.0404 | 285.0405 | 0.4 | 211, 183, 149, 121 | 3 | 3,6,2′,3′-Tetrahydroxyflavone | |
| 42 | 5.03 | 245, 319 | C15H10O5 | [M − H]− | 269.0455 | 269.0461 | 2.2 | 239, 211, 187, 143, 117 | 3 | 6,7,4′-Trihydroxyisoflavone | |
| 43 | 5.04 | 269, 354 | C15H10O6 | [M − H]− | 285.0404 | 285.0420 | 5.6 | 255, 227, 187, 159, 143, 117 | 2 | Kaempferol | [29,30] |
| 44 | 5.09 | 245, 319 | C17H14O7 | [M − H]− | 329.0666 | 329.0671 | 1.5 | 271, 243, 227, 161, 133 | 3 | 4′,5,7-Trihydroxy-3,6-dimethoxyflavone | |
| 45 | 5.12 | 244, 325 | C16H12O6 | [M − H]− | 299.0561 | 299.0561 | 0.0 | 256, 227, 212, 183, 151 | 3 | 3,5,7-Trihydroxy-4′-methoxyflavone | |
| 46 | 5.15 | 244, 354 | C17H14O7 | [M − H]− | 329.0666 | 329.0669 | 0.9 | 229, 271, 227, 215, 161 | 2 | Tricin | [30] |
| [M + H]+ | 331.0823 | 331.0820 | −0.9 | 313, 285, 270, 258, 203, 153 |
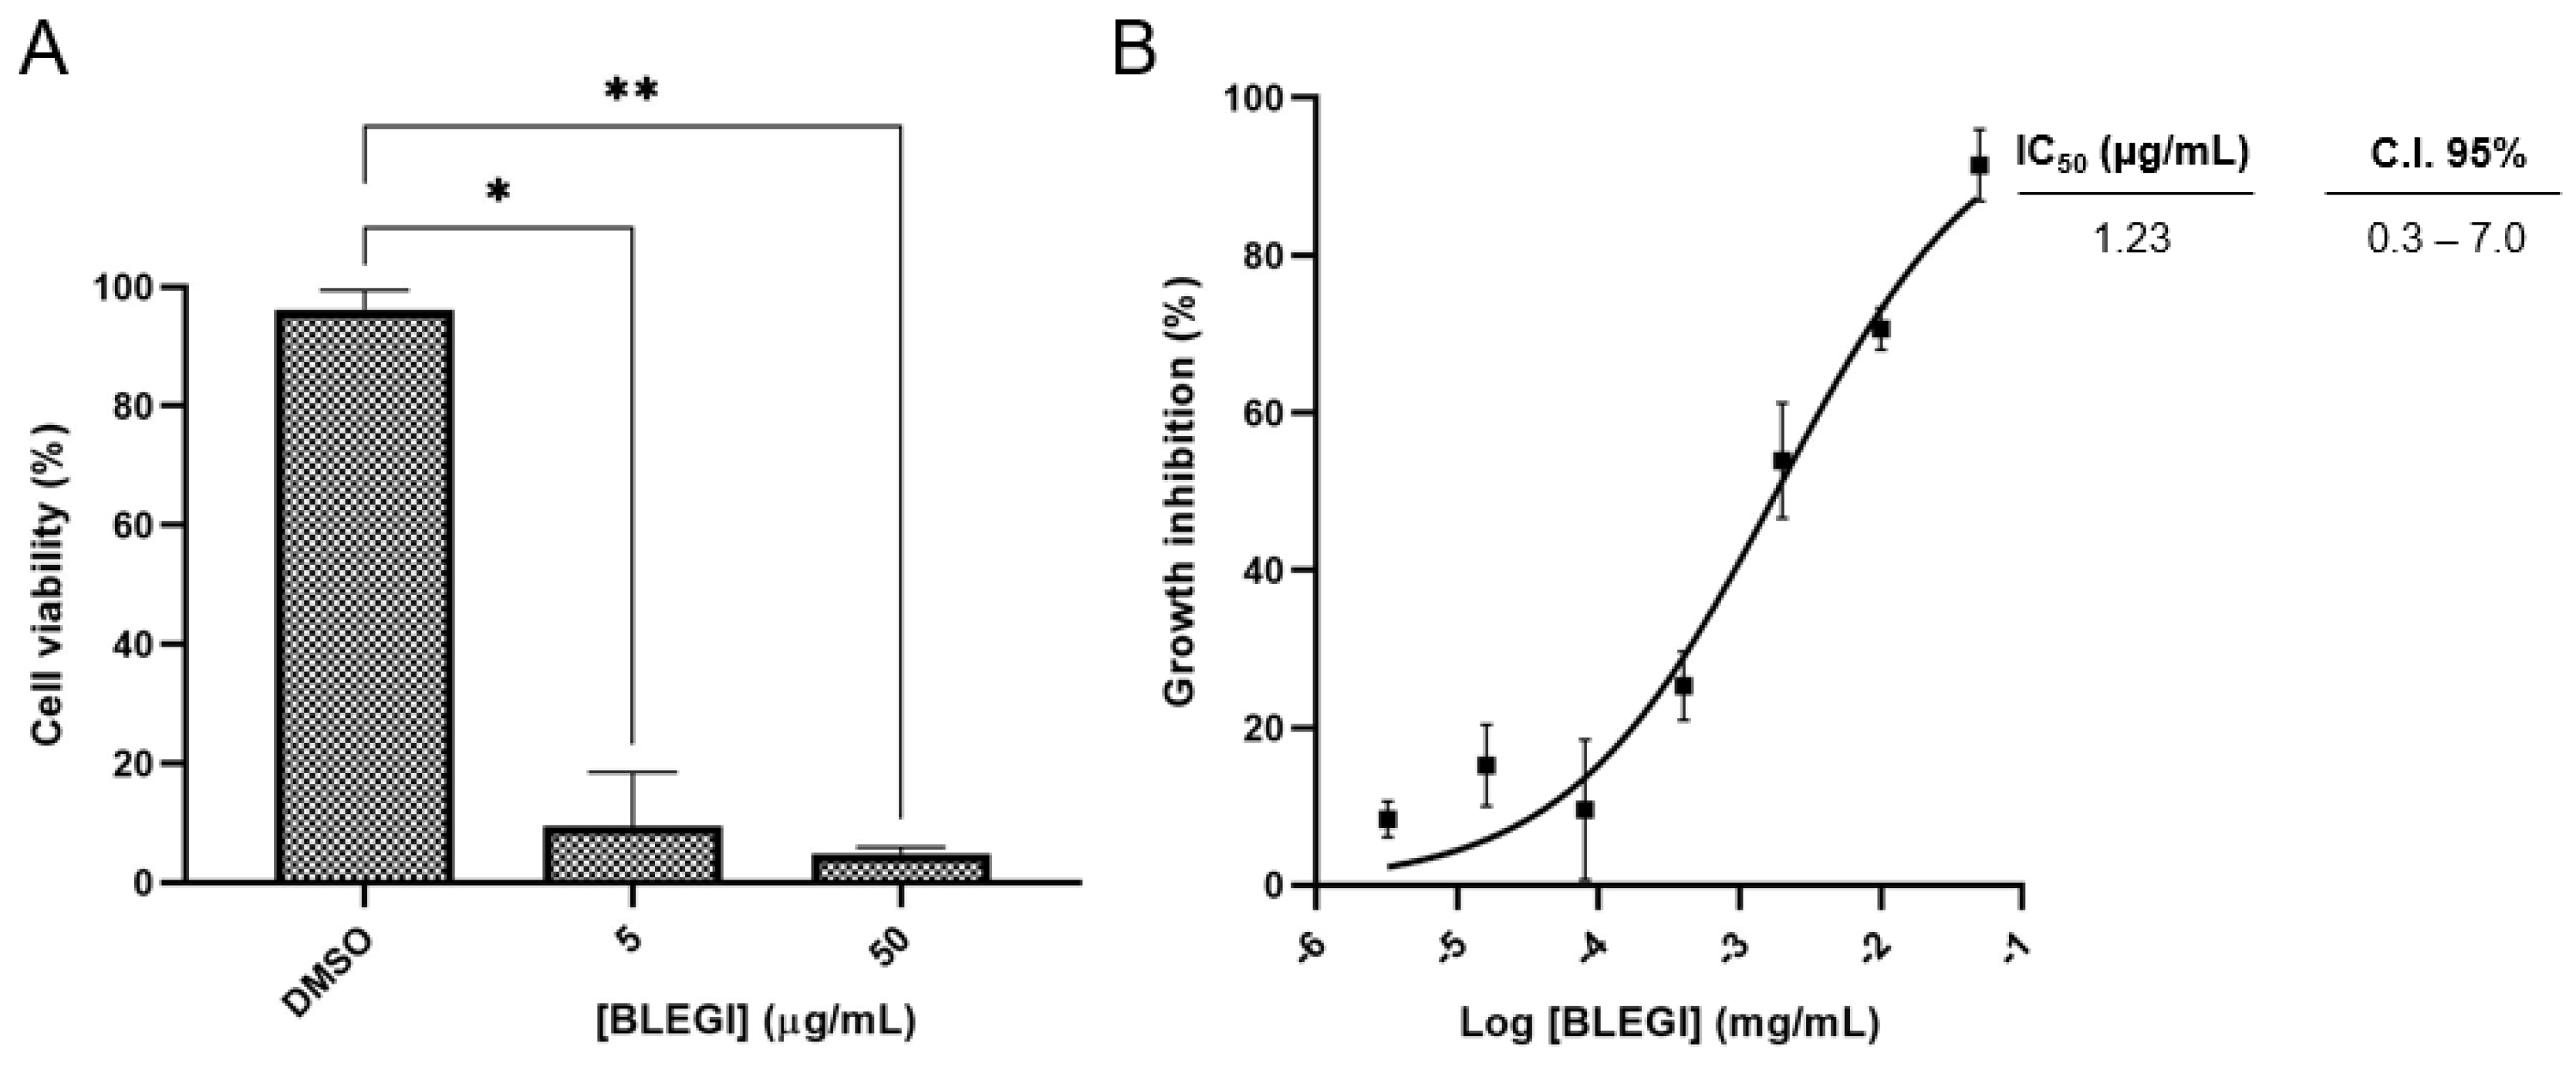
2.2. Cell Viability
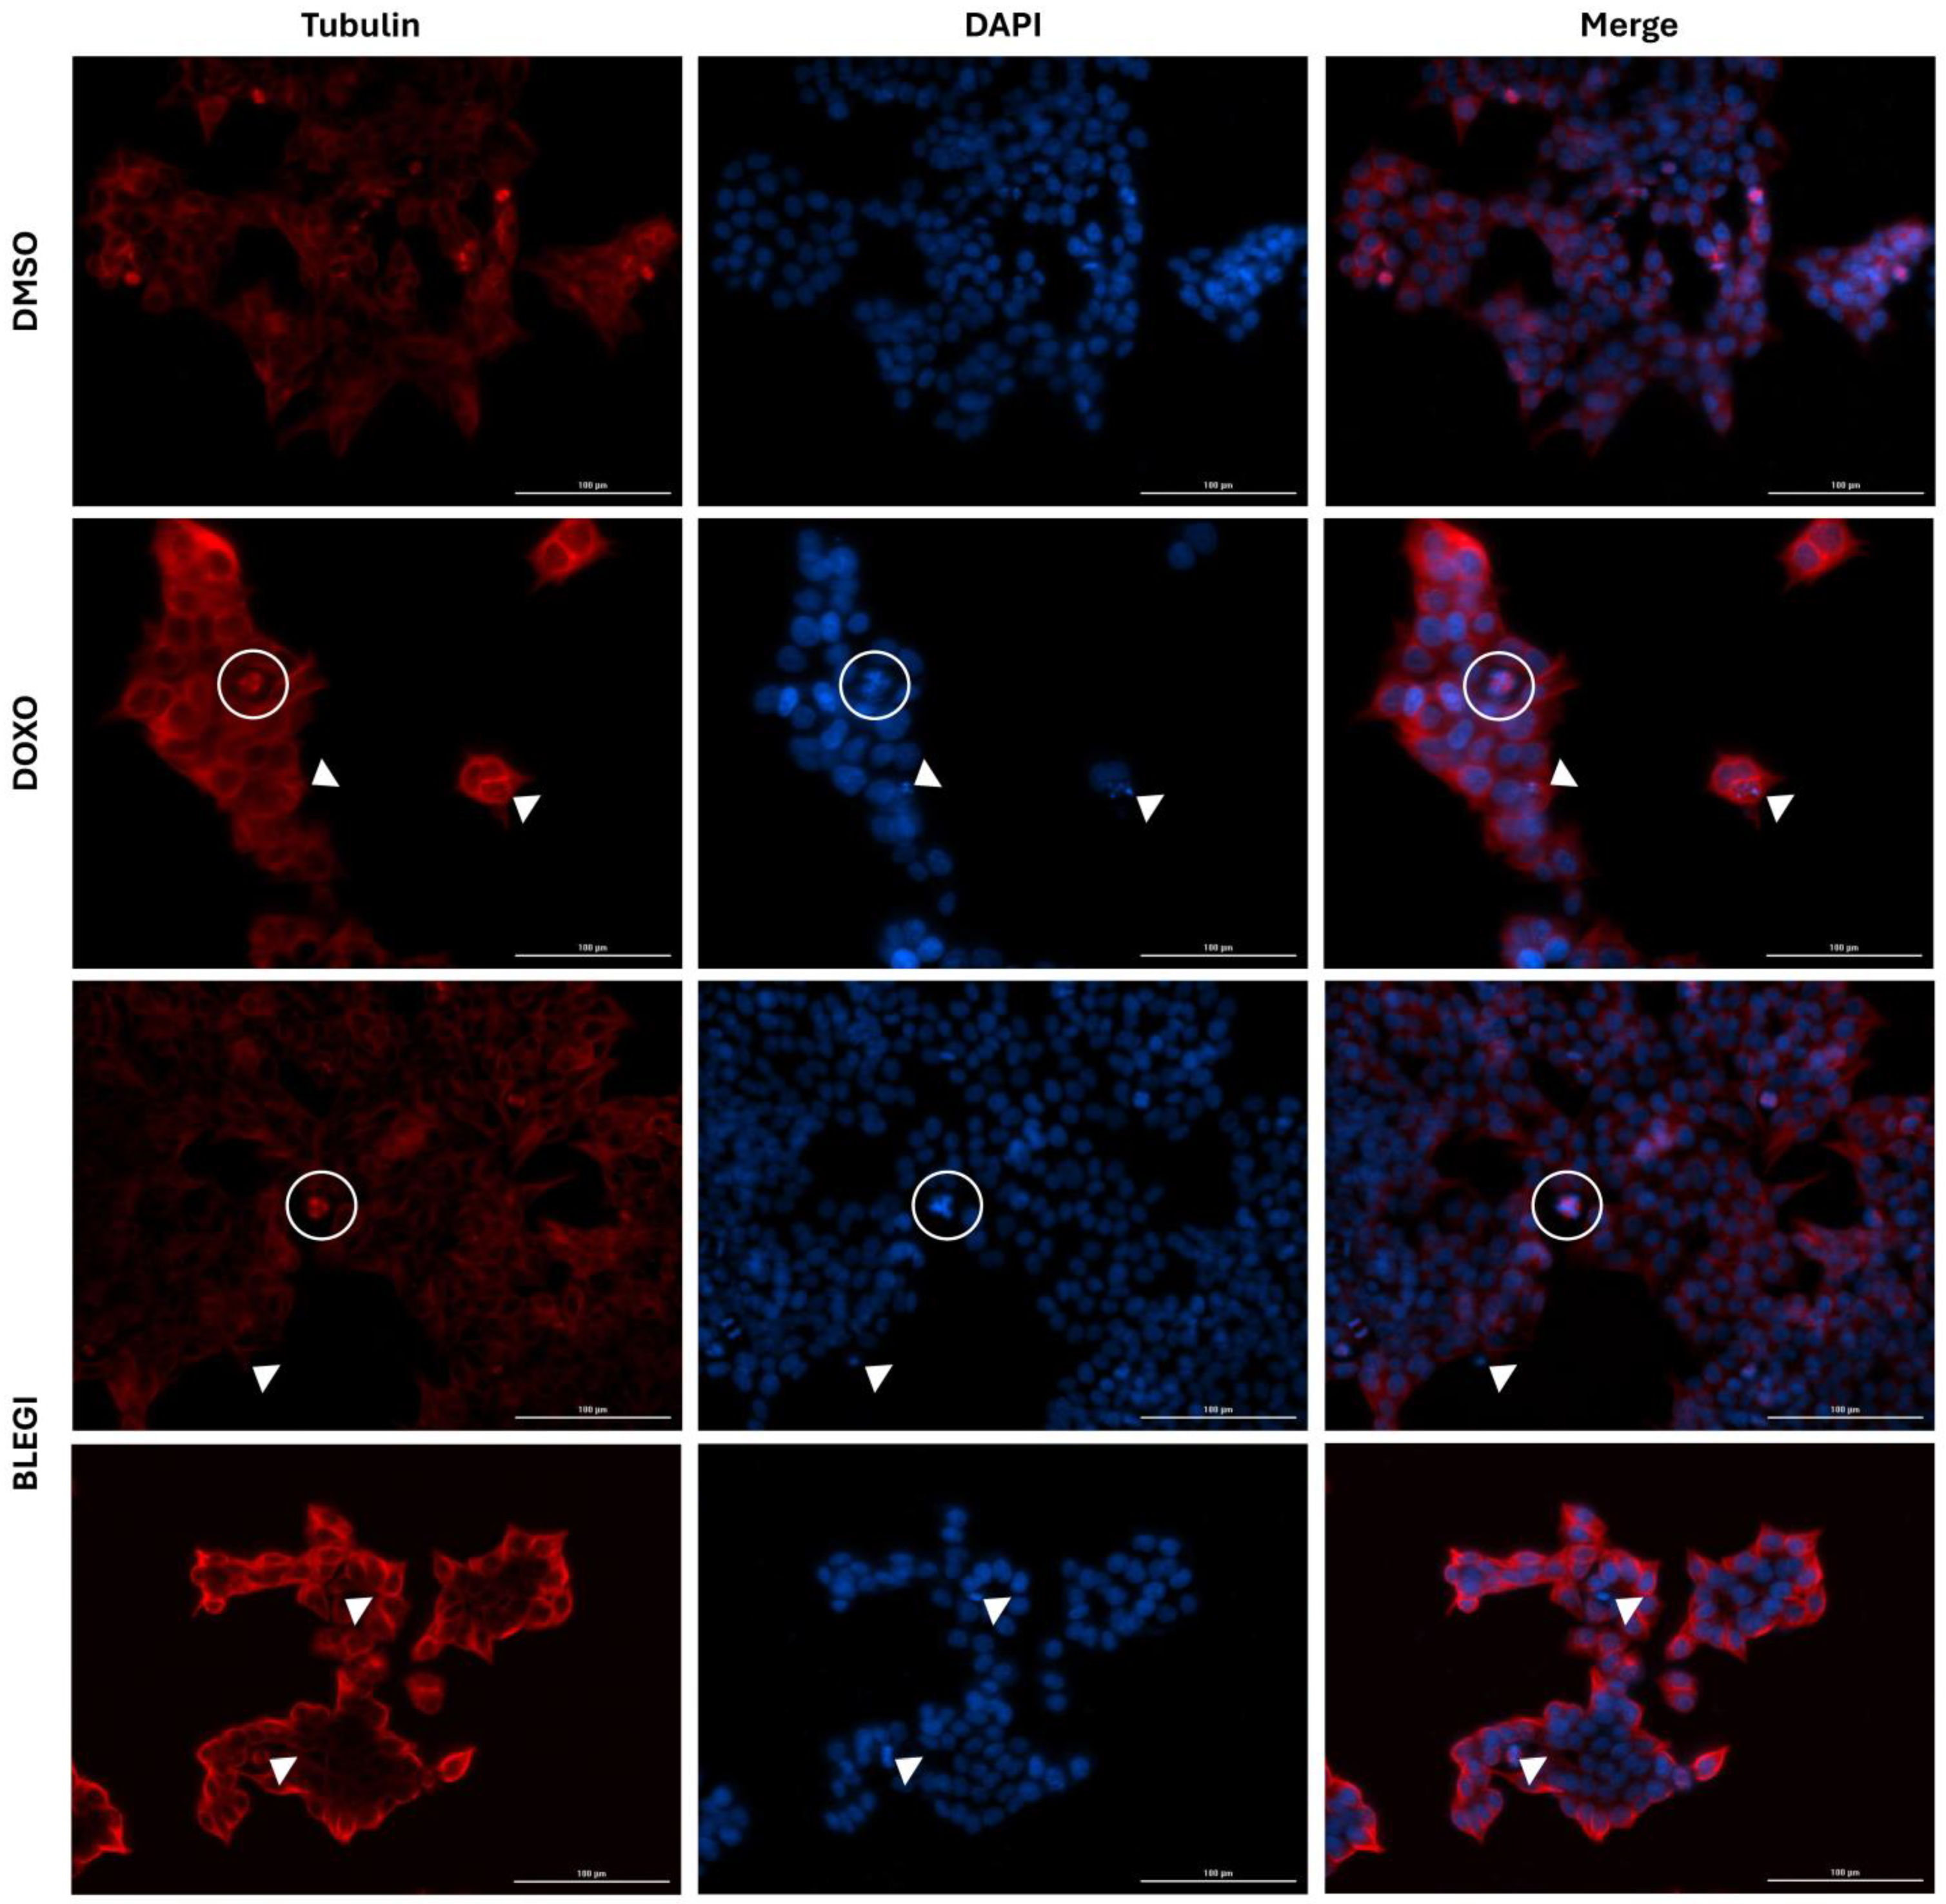
2.3. Immunofluorescence Assay
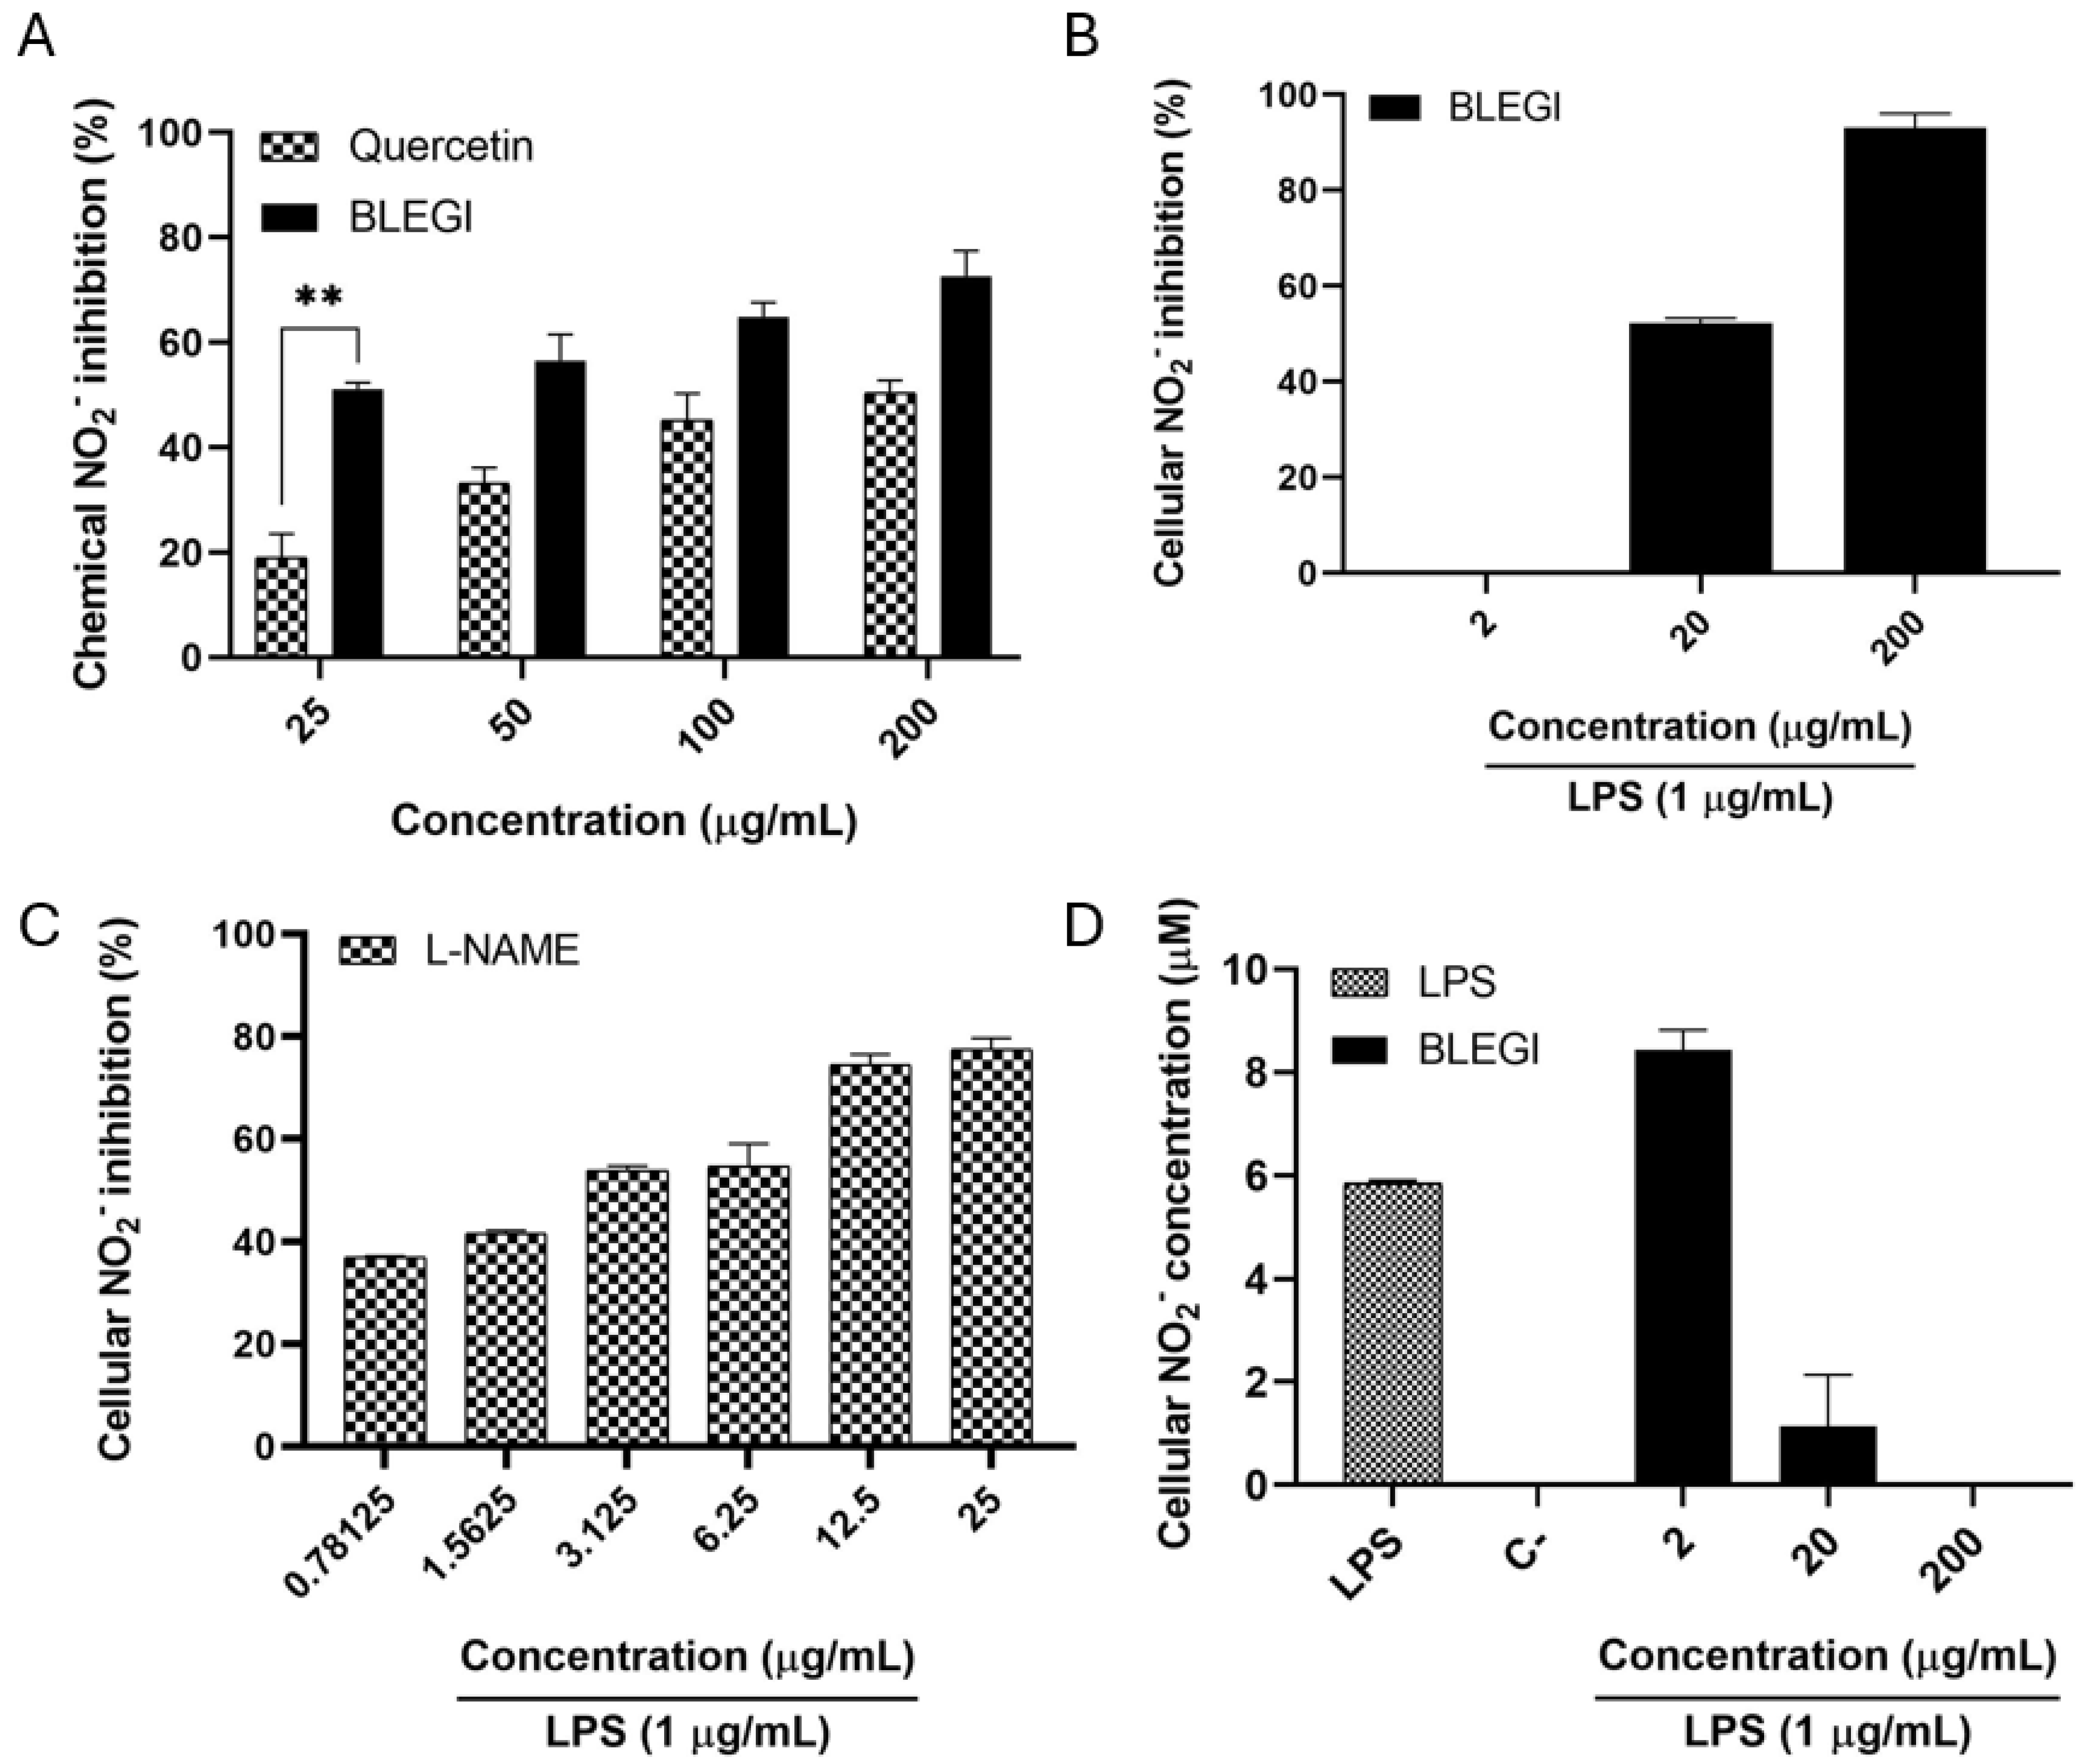
2.4. Nitric Oxide (NO) Production Inhibition
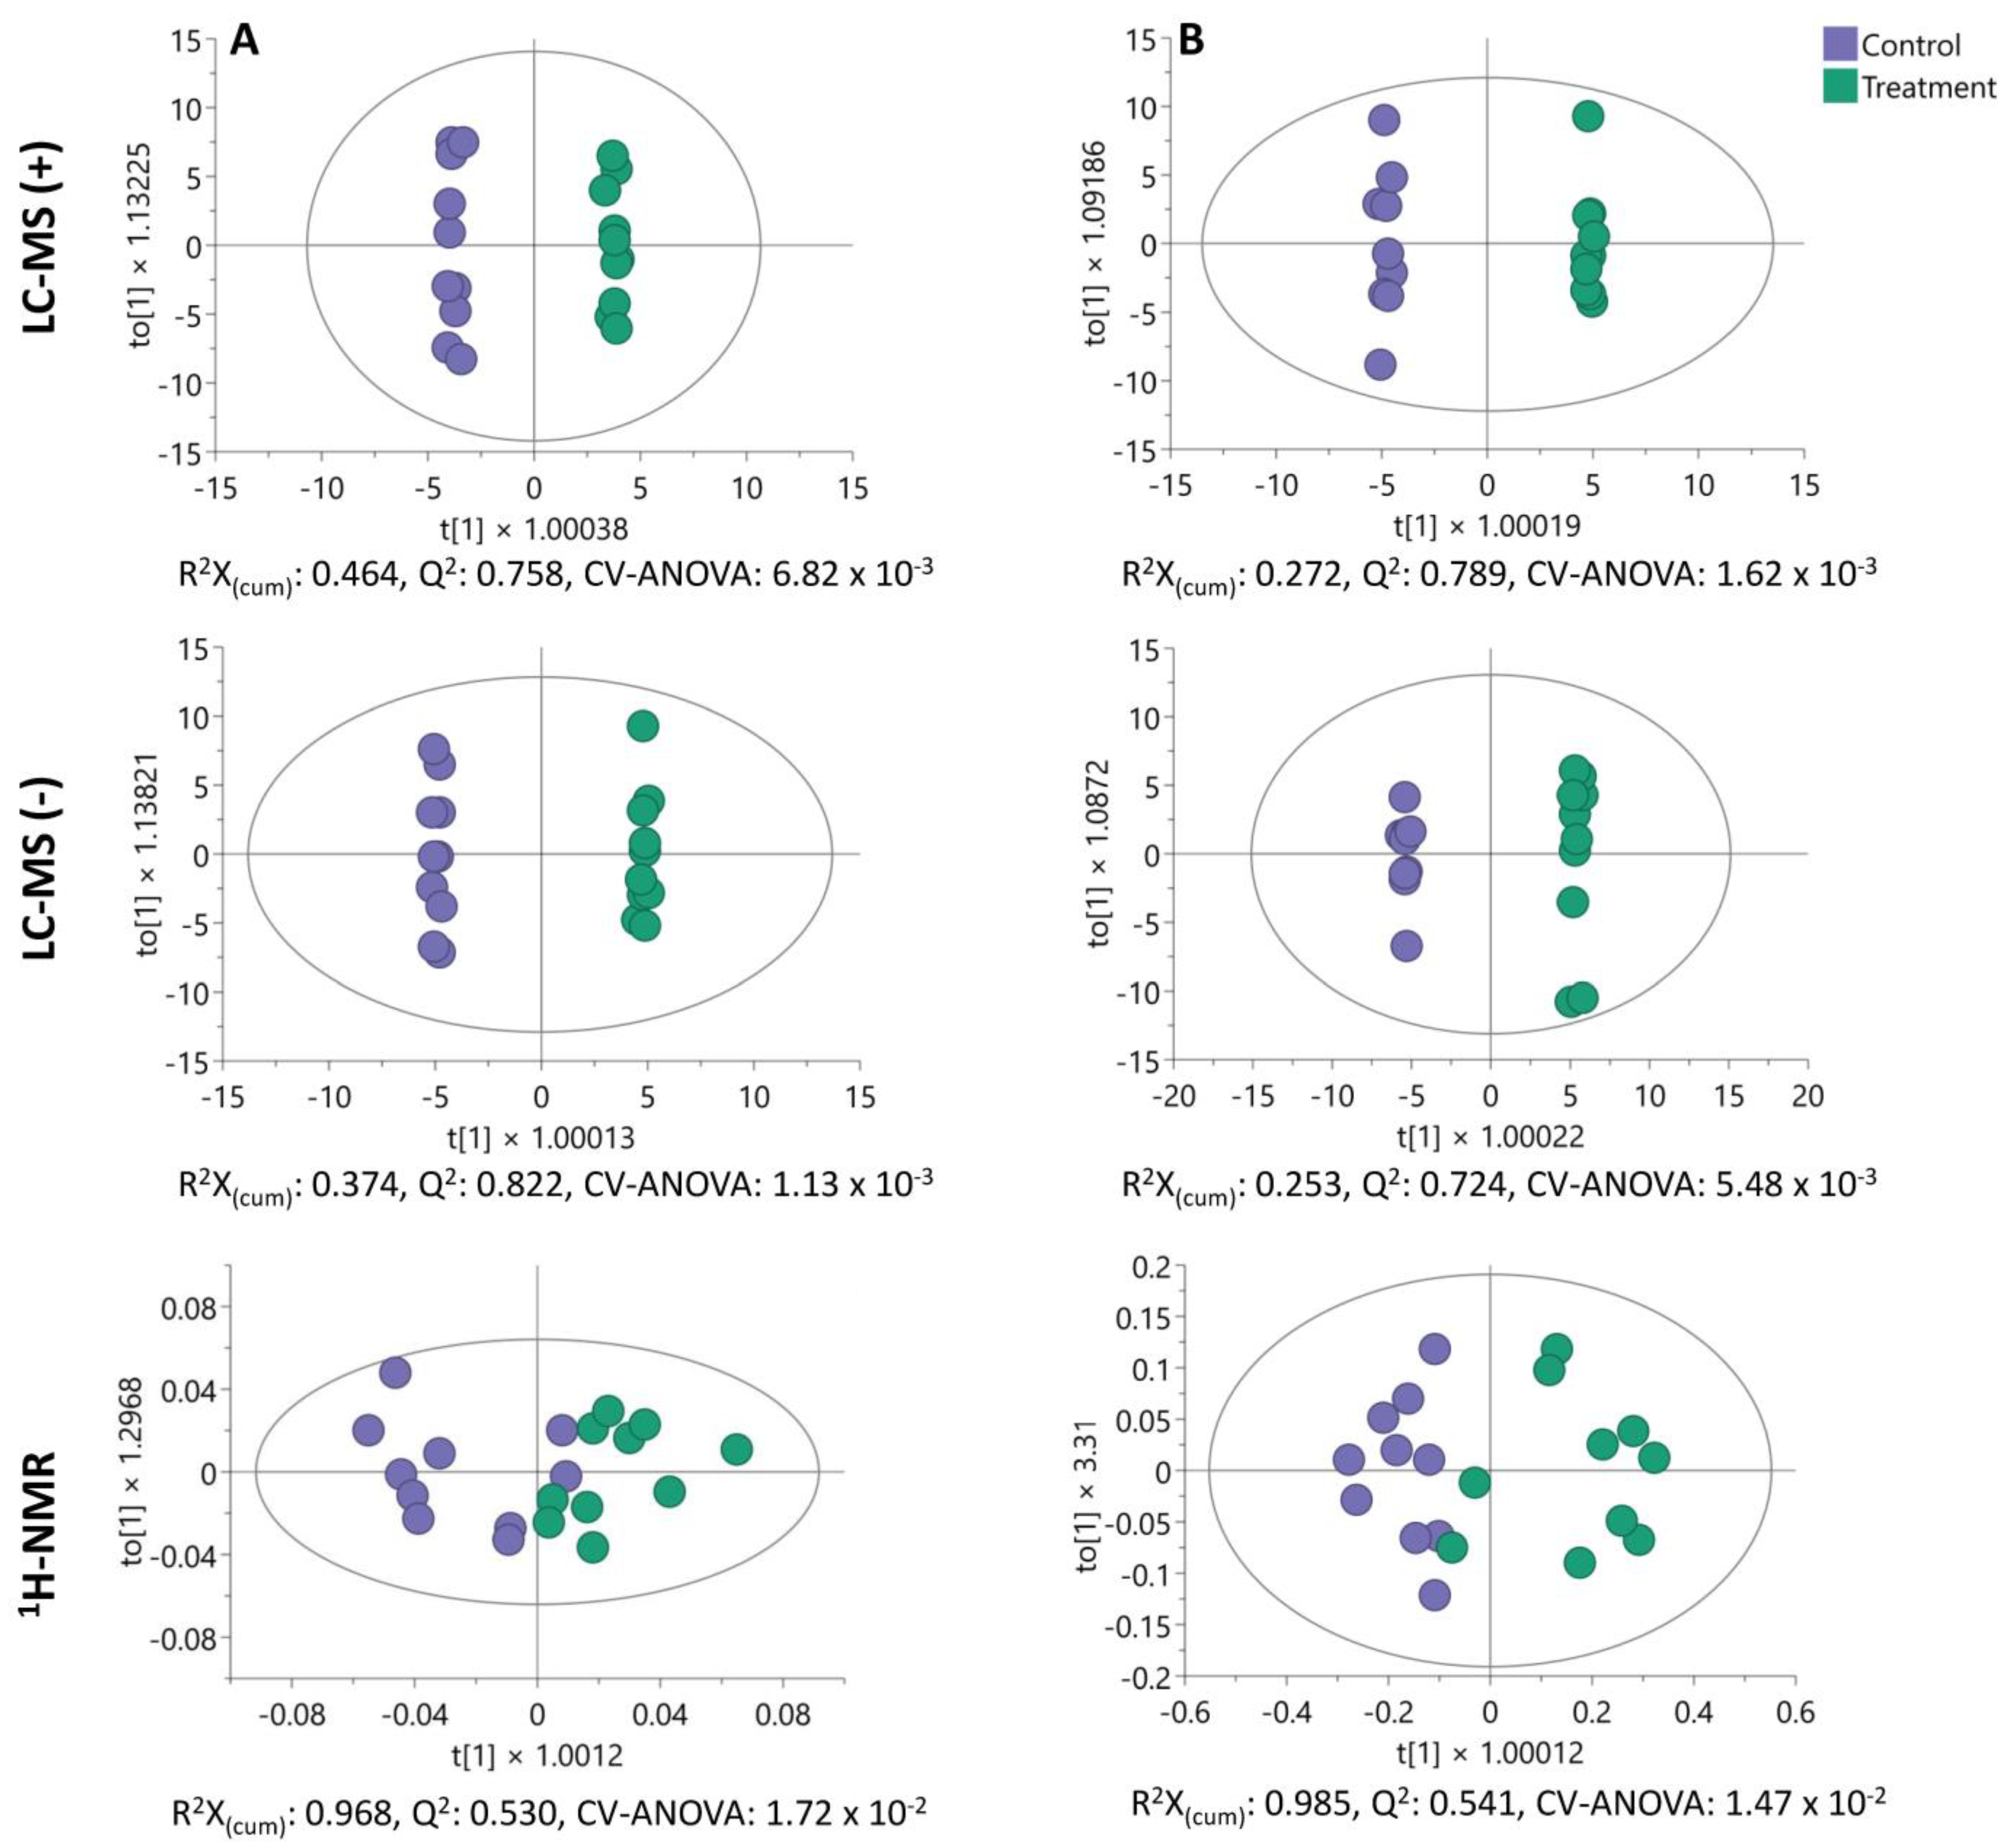
2.5. Untargeted Endo- and Exometabolome Analysis
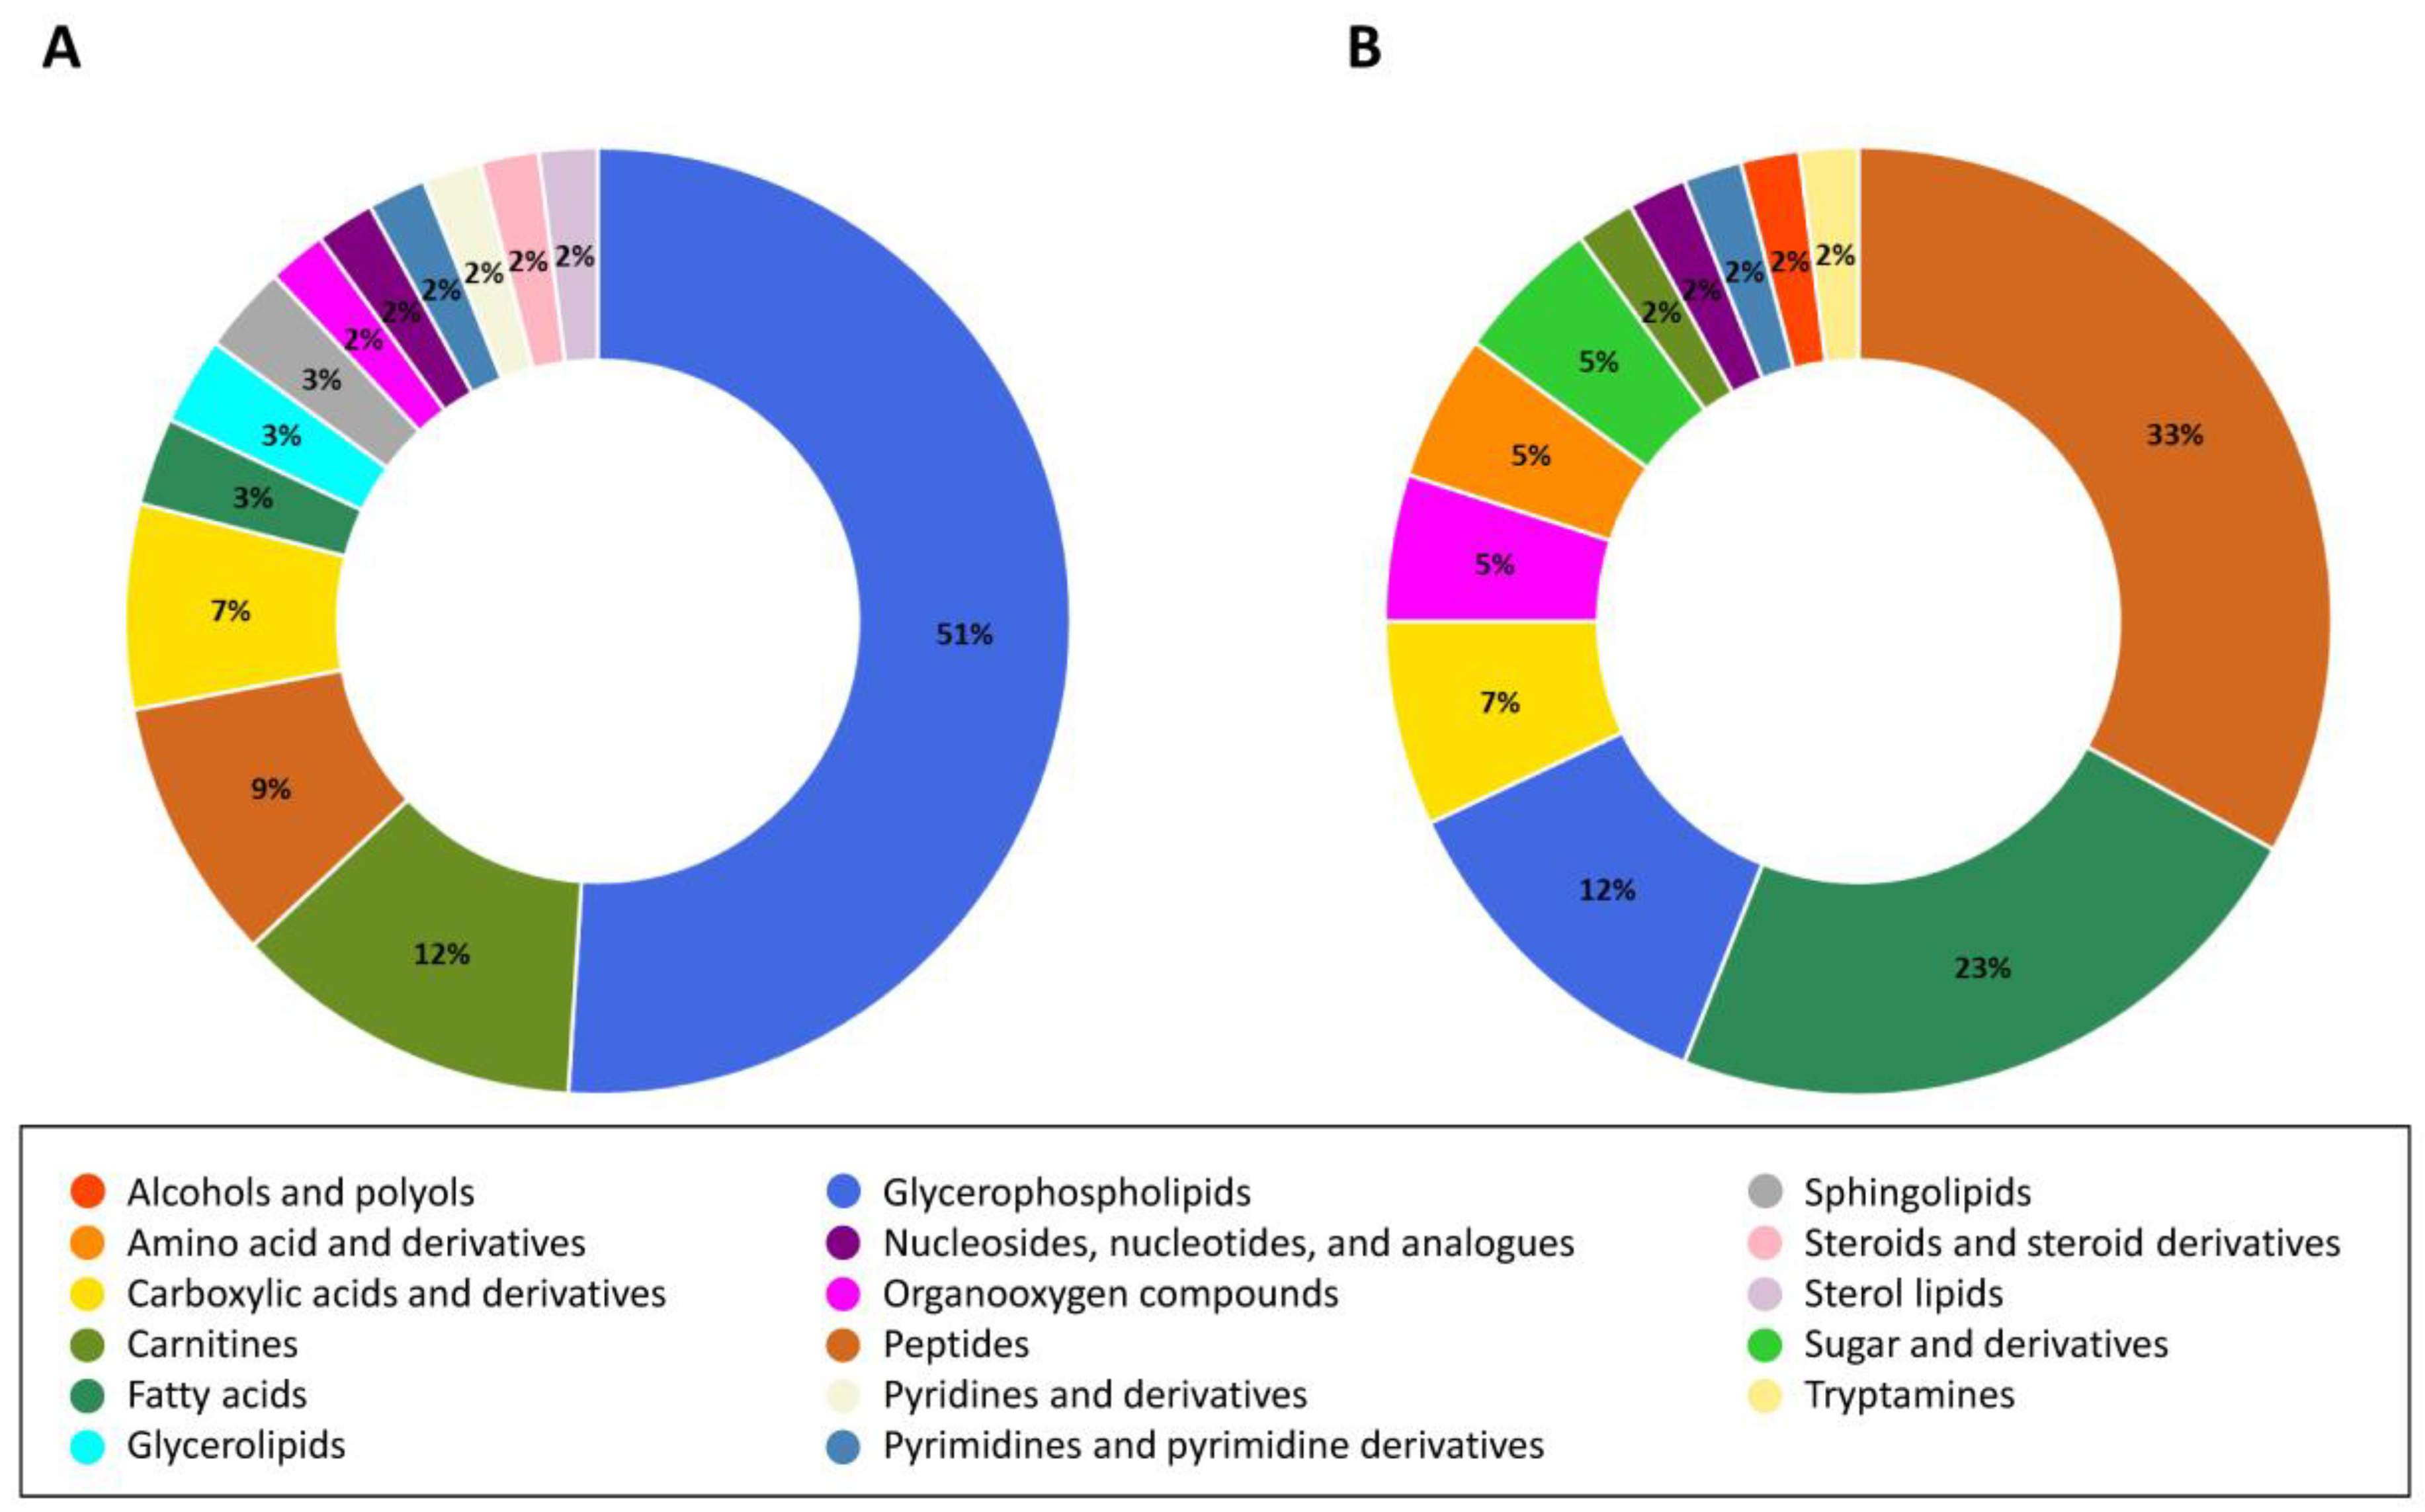
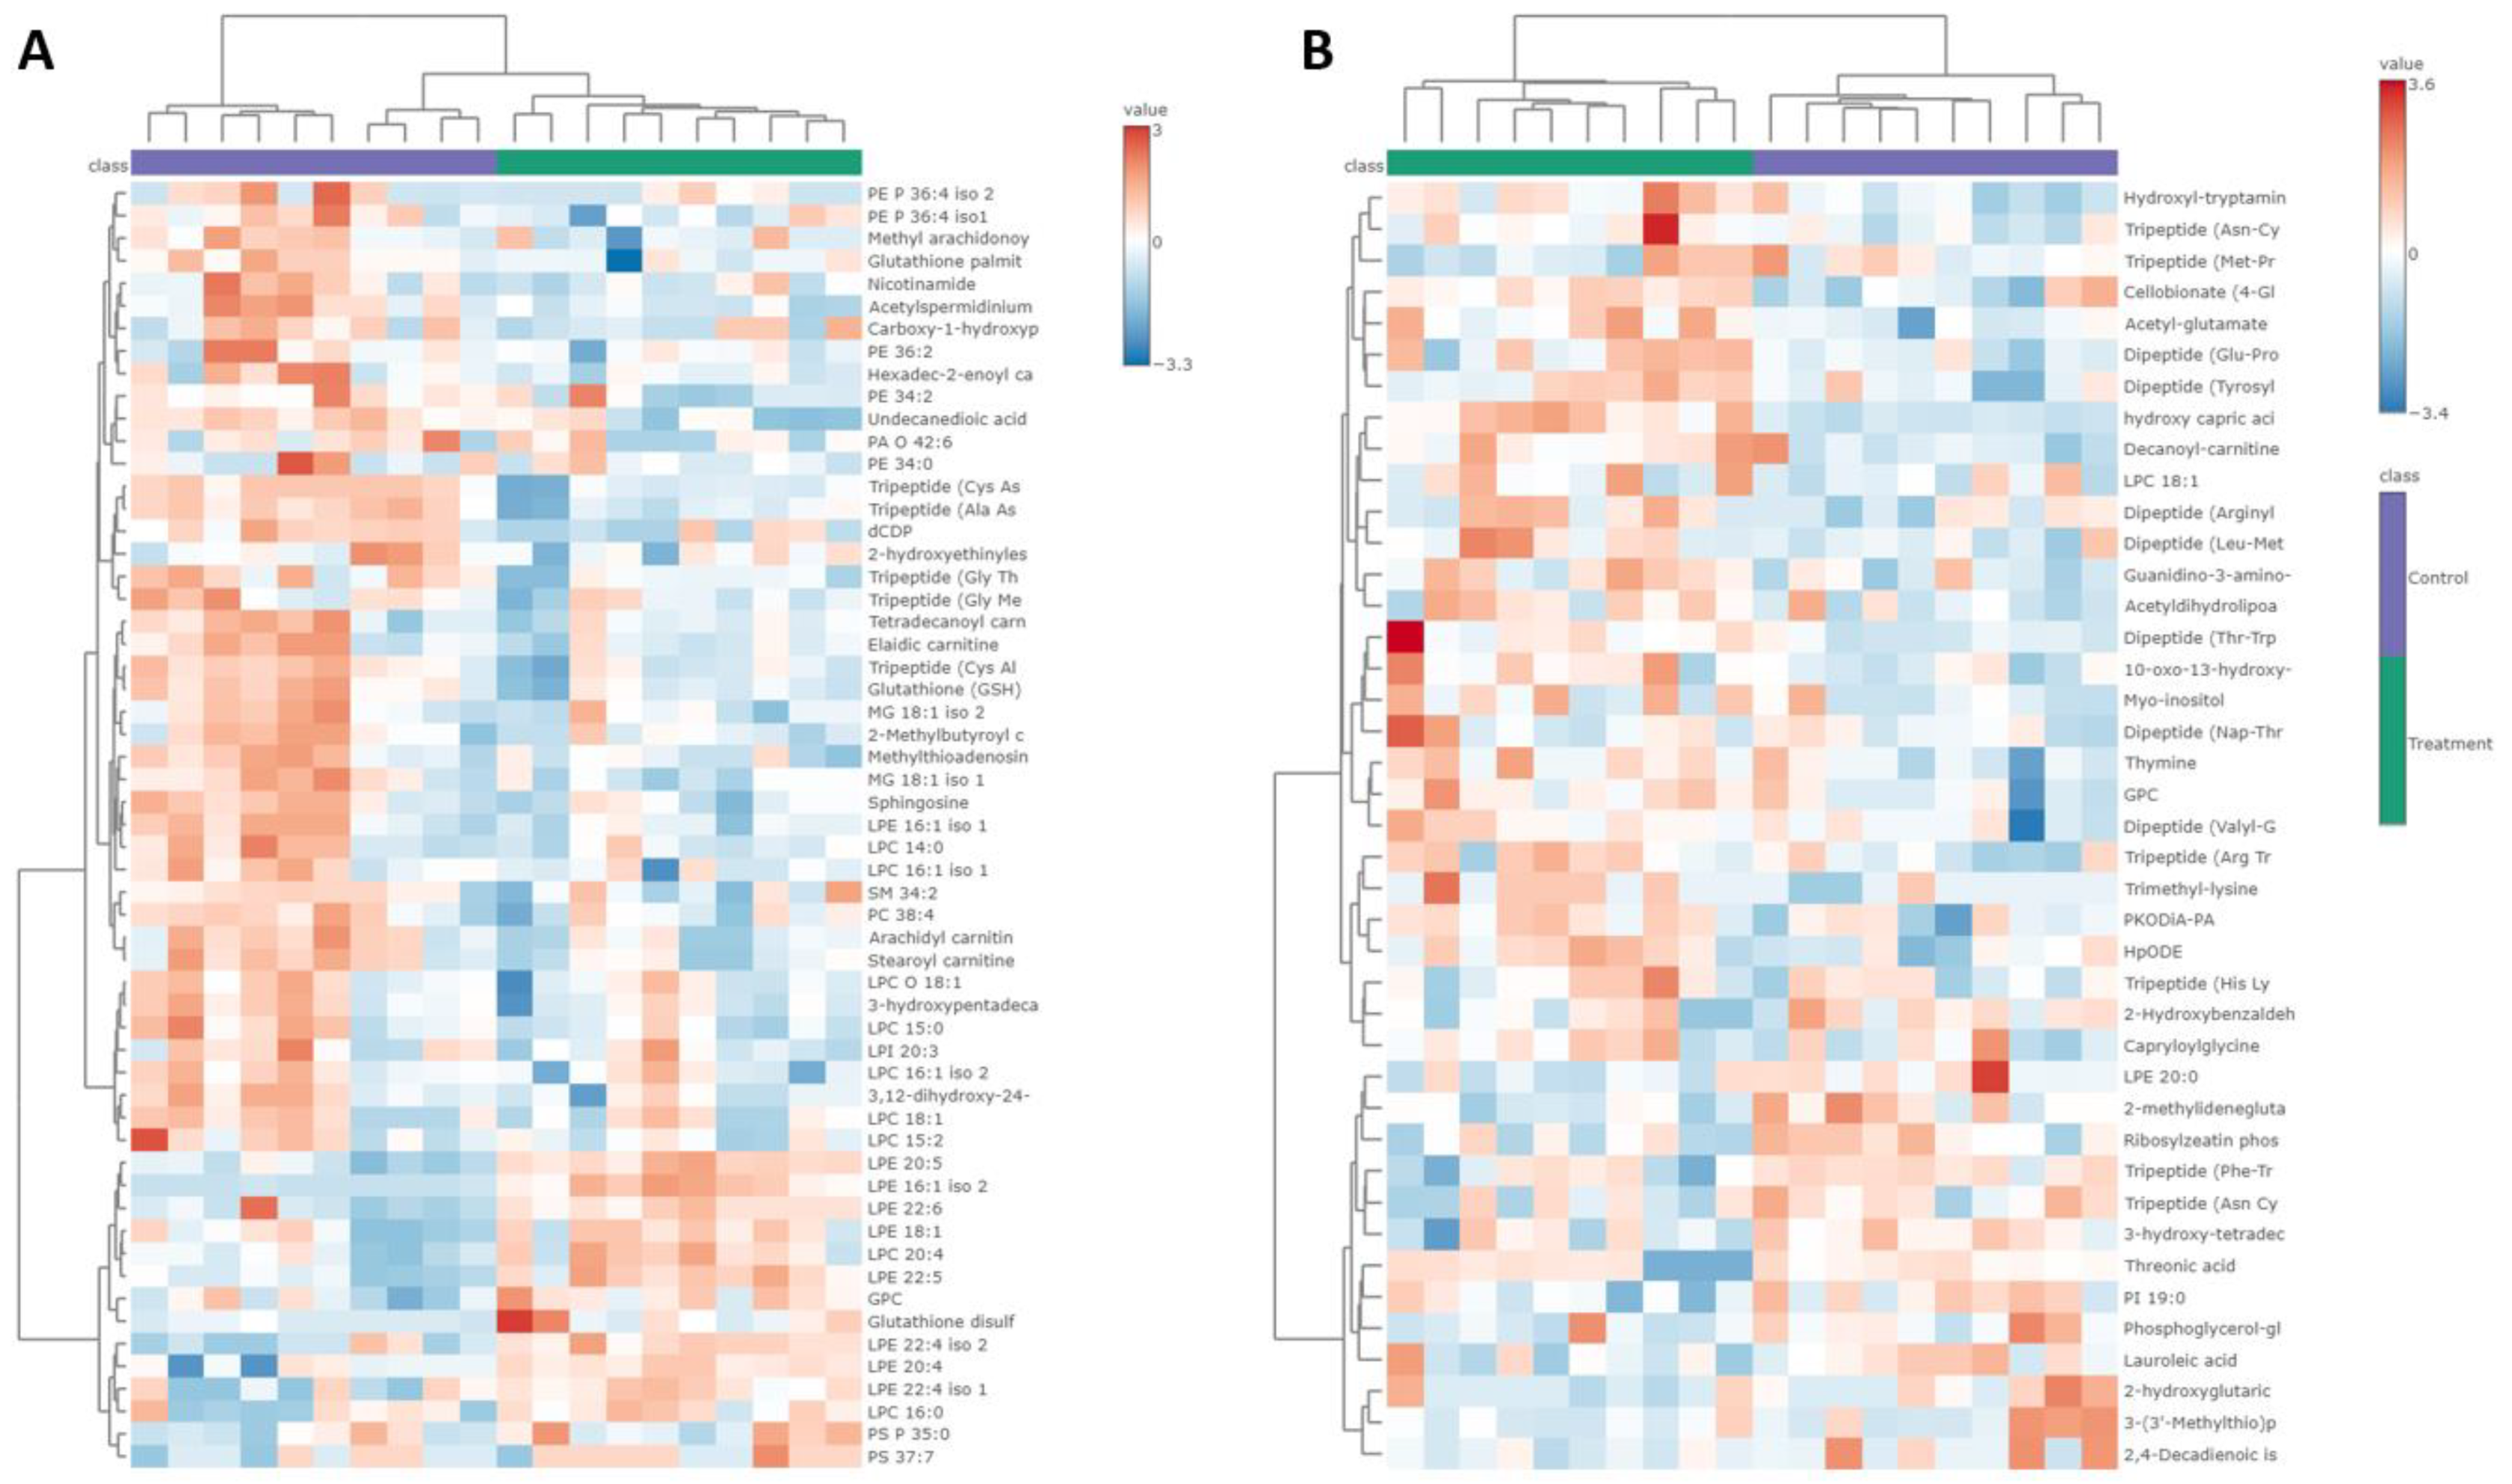
2.6. Analysis of Altered Metabolites in HCT-116 Cells
2.7. Exploration of Altered Metabolic Pathways in HCT-116 Cells
3. Discussion
4. Materials and Methods
4.1. Chemical and Reagents
4.2. Plant Material, Extraction
4.3. Chemical Characterization of the BLEGI
4.3.1. Chemical Analysis through LC-MS
4.3.2. GNPS Classical Molecular MS/MS Network Analyses
4.4. Cell Lines and Culture Conditions
4.5. Cytotoxicity Assay
4.6. Immunofluorescence Analysis
4.7. Nitric Oxide (NO) Scavenging Assay
4.8. Macrophages Cell Culture and Viability
4.9. Inhibition of NO Produced by Macrophages
4.10. Statistical Analysis
4.11. Untargeted Metabolomic Analysis
4.11.1. Cell Treatment
4.11.2. Metabolite Extraction
4.11.3. Sample Preparation for Metabolomic Analysis
4.11.4. LC-MS Metabolomic Profiling Analysis
4.11.5. 1H-NMR Fingerprinting Analysis
4.11.6. Data Processing and Statistical Analysis
4.11.7. Metabolites Identification
4.11.8. Mapping of Altered Metabolic Pathways
5. Conclusions
Supplementary Materials
Author Contributions
Funding
Institutional Review Board Statement
Informed Consent Statement
Data Availability Statement
Acknowledgments
Conflicts of Interest
References
- Nikas, I.P.; Paschou, S.A.; Ryu, H.S. The Role of Nicotinamide in Cancer Chemoprevention and Therapy. Biomolecules 2020, 10, 477. [Google Scholar] [CrossRef] [PubMed]
- Gyamfi, J.; Kim, J.; Choi, J. Cancer as a Metabolic Disorder. Int. J. Mol. Sci. 2022, 23, 1155. [Google Scholar] [CrossRef] [PubMed]
- Di Gregorio, J.; Petricca, S.; Iorio, R.; Toniato, E.; Flati, V. Mitochondrial and Metabolic Alterations in Cancer Cells. Eur. J. Cell Biol. 2022, 101, 151225. [Google Scholar] [CrossRef]
- Hanahan, D.; Weinberg, R. Hallmarks of Cancer: The Next Generation. Cell 2011, 144, 646–674. [Google Scholar] [CrossRef]
- Hanahan, D. Hallmarks of Cancer: New Dimensions. Cancer Discov. 2022, 12, 31–46. [Google Scholar] [CrossRef]
- Fendt, S.M.; Frezza, C.; Erez, A. Targeting Metabolic Plasticity and Flexibility Dynamics for Cancer Therapy. Cancer Discov. 2020, 10, 1797–1807. [Google Scholar] [CrossRef] [PubMed]
- Rawla, P.; Sunkara, T.; Barsouk, A. Epidemiology of Colorectal Cancer: Incidence, Mortality, Survival, and Risk Factors. Prz. Gastroenterol. 2019, 14, 89–103. [Google Scholar] [CrossRef] [PubMed]
- Sawicki, T.; Ruszkowska, M.; Danielewicz, A.; Niedźwiedzka, E.; Arłukowicz, T.; Przybyłowicz, K.E. A Review of Colorectal Cancer in Terms of Epidemiology, Risk Factors, Development, Symptoms and Diagnosis. Cancers 2021, 13, 2025. [Google Scholar] [CrossRef] [PubMed]
- Xi, Y.; Xu, P. Global Colorectal Cancer Burden in 2020 and Projections to 2040. Transl. Oncol. 2021, 14, 101174. [Google Scholar] [CrossRef] [PubMed]
- Thanikachalam, K.; Khan, G. Colorectal Cancer and Nutrition. Nutrients 2019, 11, 164. [Google Scholar] [CrossRef] [PubMed]
- Li, J.; Ma, X.; Chakravarti, D.; Shalapour, S.; DePinho, R.A. Genetic and Biological Hallmarks of Colorectal Cancer. Genes Dev. 2021, 38, 787–820. [Google Scholar] [CrossRef]
- Chitiva, L.C.; Rezende-Teixeira, P.; Leão, T.; Lozano-Puentes, H.S.; Londoño, X.; Díaz-Ariza, L.A.; Costa-Lotufo, L.V.; Prieto-Rodríguez, J.A.; Modesti Costa, G.; Castro-Gamboa, I. Metabolomic Profiling of Guadua Species and Its Correlation with Antioxidant and Cytotoxic Activities. ACS Omega 2024. [Google Scholar]
- Londoño, X.; Zurita, E. Two New Species of Guadua (Bambusoideae: Guaduinae) from Colombia and Bolivia. J. Bot. Res. Inst. Texas 2008, 2, 25–34. [Google Scholar]
- Chitiva, L.C.; Lozano-Puentes, H.S.; Londoño, X.; Leão, T.F.; Cala, M.P.; Ruiz-Sanchez, E.; Díaz-Ariza, L.A.; Prieto-Rodríguez, J.A.; Castro-Gamboa, I.; Costa, M.G. Untargeted Metabolomics Approach and Molecular Networking Analysis Reveal Changes in Chemical Composition under the Influence of Altitudinal Variation in Bamboo Species. Front. Mol. Biosci. 2023, 10, 1192088. [Google Scholar] [CrossRef] [PubMed]
- Gao, D.; Wang, Y.N.; Xie, W.Y.; Yang, T.; Jiang, Y.Y.; Guo, Y.W.; Guan, J.; Liu, H.X. Metabolomics Study on the Antitumor Effect of Marine Natural Compound Flexibilide in HCT-116 Colon Cancer Cell Line. J. Chromatogr. B-Anal. Technol. Biomed. Life Sci. 2016, 1014, 17–23. [Google Scholar] [CrossRef]
- Dahabiyeh, L.A.; Hudaib, F.; Hourani, W.; Darwish, W.; Abu-Irmaileh, B.; Deb, P.K.; Venugopala, K.N.; Mohanlall, V.; Chandrashekharappa, S.; Abu-Dahab, R.; et al. Mass Spectrometry-Based Metabolomics Approach and in Vitro Assays Revealed Promising Role of 2,3-Dihydroquinazolin-4(1H)-One Derivatives against Colorectal Cancer Cell Lines. Eur. J. Pharm. Sci. 2023, 182, 106378. [Google Scholar] [CrossRef]
- Blaženović, I.; Kind, T.; Ji, J.; Fiehn, O. Software Tools and Approaches for Compound Identification of LC-MS/MS Data in Metabolomics. Metabolites 2018, 8, 31. [Google Scholar] [CrossRef]
- Gagliano, J.; Altenhofen, S.; Nabinger, D.D.; Gusso, D.; Kuhl-Silva, J.M.; Anselmo-Moreira, F.; Yamaguchi, L.F.; Kato, M.J.; Bonan, C.D.; Furlan, C.M. Are Brazilian Bamboo Species Helpful for Cognition and Memory? Phytomed. Plus 2022, 2, 100183. [Google Scholar] [CrossRef]
- Cao, X.; Zhang, Y.; Xun, H.; Wang, J.; Tang, F. High-Yield Recovery of Antioxidant Compounds from Bambusa Chungii Culms Using Pressurized Hot Water Extraction. Antioxidants 2022, 11, 2231. [Google Scholar] [CrossRef] [PubMed]
- Jiang, L.; Belwal, T.; Huang, H.; Ge, Z.; Limwachiranon, J.; Zhao, Y.; Li, L.; Ren, G.; Luo, Z. Extraction and Characterization of Phenolic Compounds from Bamboo Shoot Shell under Optimized Ultrasonic-Assisted Conditions: A Potential Source of Nutraceutical Compounds. Food Bioprocess Technol. 2019, 12, 1741–1755. [Google Scholar] [CrossRef]
- Akhtar, J.; Patowary, L. Bambusa vulgaris: A Comprehensive Review of Its Traditional Uses, Phytochemicals and Pharmacological Activities. Sci. Phytochem. 2022, 1, 11–21. [Google Scholar] [CrossRef]
- Gagliano, J.; Anselmo-Moreira, F.; Sala-Carvalho, W.R.; Furlan, C.M. What Is Known about the Medicinal Potential of Bamboo? Adv. Tradit. Med. 2022, 22, 467–495. [Google Scholar] [CrossRef]
- Hu, C.; Zhang, Y.; Kitts, D.D. Evaluation of Antioxidant and Prooxidant Activities of Bamboo Phyllostachys nigra Var. Henonis Leaf Extract in Vitro. J. Agric. Food Chem. 2000, 48, 3170–3176. [Google Scholar] [CrossRef] [PubMed]
- Ni, Q.; Xu, G.; Wang, Z.; Gao, Q.; Wang, S.; Zhang, Y. Seasonal Variations of the Antioxidant Composition in Ground Bamboo Sasa argenteastriatus Leaves. Int. J. Mol. Sci. 2012, 13, 2249–2262. [Google Scholar] [CrossRef] [PubMed]
- Ni, Q.; Wang, Z.; Xu, G.; Gao, Q.; Yang, D.; Morimatsu, F.; Zhang, Y. Altitudinal Variation of Antioxidant Components and Capability in Indocalamus latifolius (Keng) McClure Leaf. J. Nutr. Sci. Vitaminol. 2013, 59, 336–342. [Google Scholar] [CrossRef] [PubMed]
- Wang, Y.; Zhang, Y.; Cheng, J.; Zhao, J.; Shi, R.; He, L.; Li, Q.; Chen, Y. Efficient Purification of Flavonoids from Bamboo Shoot Residues of Phyllostachys edulis by Macroporous Resin and Their Hypoglycemic Activity. Food Chem. X 2022, 16, 100505. [Google Scholar] [CrossRef] [PubMed]
- Wang, Y.; Chen, J.; Wang, D.; Ye, F.; He, Y.; Hu, Z.; Zhao, G. A Systematic Review on the Composition, Storage, Processing of Bamboo Shoots: Focusing the Nutritional and Functional Benefits. J. Funct. Foods 2020, 71, 104015. [Google Scholar] [CrossRef]
- Silva de Oliveira, D.C. Composição Química e Atividades Biológicas de Extratos de Guadua angustifolia Kunth. Master’s Thesis, Universidade de São Paulo, São Paulo, Brazil, 2019. Available online: https://www.teses.usp.br/teses/disponiveis/9/9138/tde-22122021-132604/pt-br.php (accessed on 10 March 2024).
- Morales Noreña, N.; Sanchez Vallejo, L. Contribución Al Estudio Fitoquímico de Las Hojas de Guadua angustifolia Kunth. Master’s Thesis, Universidad del Quindío, Armenia, Colombia, 2008. Available online: https://bdigital.uniquindio.edu.co/entities/publication/43207db2-b05f-4e69-8106-06c33527e826 (accessed on 10 March 2024).
- Li, X.; Tao, W.; Xun, H.; Yao, X.; Wang, J.; Sun, J.; Yue, Y.; Tang, F. Simultaneous Determination of Flavonoids from Bamboo Leaf Extracts Using Liquid Chromatography-Tandem Mass Spectrometry. Rev. Bras. Farmacogn. 2021, 31, 347–352. [Google Scholar] [CrossRef]
- Cheng, Y.; Wan, S.; Yao, L.; Lin, D.; Wu, T.; Chen, Y.; Zhang, A.; Lu, C. Bamboo Leaf: A Review of Traditional Medicinal Property, Phytochemistry, Pharmacology, and Purification Technology. J. Ethnopharmacol. 2023, 306, 116166. [Google Scholar] [CrossRef] [PubMed]
- Ma, N.H.; Guo, J.; Chen, S.H.X.; Yuan, X.R.; Zhang, T.; Ding, Y. Antioxidant and Compositional HPLC Analysis of Three Common Bamboo Leaves. Molecules 2020, 25, 409. [Google Scholar] [CrossRef] [PubMed]
- Shao, X.; Gao, D.; Wang, Y.; Jin, F.; Wu, Q.; Liu, H. Application of Metabolomics to Investigate the Antitumor Mechanism of Flavopiridol in MCF-7 Breast Cancer Cells. J. Chromatogr. B Anal. Technol. Biomed. Life Sci. 2016, 1025, 40–47. [Google Scholar] [CrossRef]
- Gao, D.; Jin, F.; Liu, H.; Wang, Y.; Jiang, Y. Metabonomic Study on the Antitumor Effect of Flavonoid Derivative 3d in HepG2 Cells and Its Action Mechanism. Talanta 2014, 118, 382–388. [Google Scholar] [CrossRef] [PubMed]
- Musaogullari, A.; Mandato, A.; Chai, Y.C. Role of Glutathione Depletion and Reactive Oxygen Species Generation on Caspase-3 Activation: A Study with the Kinase Inhibitor Staurosporine. Front. Physiol. 2020, 11, 998. [Google Scholar] [CrossRef] [PubMed]
- Sabharwal, S.S.; Schumacker, P.T. Mitochondrial ROS in Cancer: Initiators, Amplifiers or an Achilles’ Heel? Nat. Rev. Cancer 2014, 14, 709–721. [Google Scholar] [CrossRef] [PubMed]
- Dükel, M.; Tavsan, Z.; Kayali, H.A. Flavonoids Regulate Cell Death-Related Cellular Signaling via ROS in Human Colon Cancer Cells. Process Biochem. 2021, 101, 11–25. [Google Scholar] [CrossRef]
- Brzozowa-Zasada, M.; Piecuch, A.; Bajdak-Rusinek, K.; Michalski, M.; Klymenko, O.; Matysiak, N.; Janelt, K.; Czuba, Z. Glutathione Reductase Expression and Its Prognostic Significance in Colon Cancer. Int. J. Mol. Sci. 2024, 25, 1097. [Google Scholar] [CrossRef] [PubMed]
- Hegedűs, C.; Kovács, K.; Polgár, Z.; Regdon, Z.; Szabó, É.; Robaszkiewicz, A.; Forman, H.J.; Martner, A.; Virág, L. Redox Control of Cancer Cell Destruction. Redox Biol. 2018, 16, 59–74. [Google Scholar] [CrossRef] [PubMed]
- Kennedy, L.; Sandhu, J.K.; Harper, M.E.; Cuperlovic-Culf, M. Role of Glutathione in Cancer: From Mechanisms to Therapies. Biomolecules 2020, 10, 1429. [Google Scholar] [CrossRef] [PubMed]
- Chen, C.; Wang, X.; Huang, X.; Yong, H.; Shen, J.; Tang, Q.; Zhu, J.; Ni, J.; Feng, Z. Nicotinamide N-Methyltransferase: A Potential Biomarker for Worse Prognosis in Gastric Carcinoma. Am. J. Cancer Res. 2016, 6, 649–663. [Google Scholar] [PubMed]
- Li, X.Y.; Pi, Y.N.; Chen, Y.; Zhu, Q.; Xia, B.R. Nicotinamide N-Methyltransferase: A Promising Biomarker and Target for Human Cancer Therapy. Front. Oncol. 2022, 12, 894744. [Google Scholar] [CrossRef] [PubMed]
- Ramsden, D.B.; Waring, R.H.; Barlow, D.J.; Parsons, R.B. Nicotinamide N-Methyltransferase in Health and Cancer. Int. J. Tryptophan Res. 2017, 10, 1178646917691739. [Google Scholar] [CrossRef] [PubMed]
- Wang, W.; Yang, C.; Wang, T.; Deng, H. Complex Roles of Nicotinamide N-Methyltransferase in Cancer Progression. Cell Death Dis. 2022, 13, 267. [Google Scholar] [CrossRef] [PubMed]
- Fu, Y.; Zou, T.; Shen, X.; Nelson, P.J.; Li, J.; Wu, C.; Yang, J.; Zheng, Y.; Bruns, C.; Zhao, Y.; et al. Lipid Metabolism in Cancer Progression and Therapeutic Strategies. MedComm 2021, 2, 27–59. [Google Scholar] [CrossRef] [PubMed]
- Broadfield, L.A.; Pane, A.A.; Talebi, A.; Swinnen, J.V.; Fendt, S.M. Lipid Metabolism in Cancer: New Perspectives and Emerging Mechanisms. Dev. Cell 2021, 56, 1363–1393. [Google Scholar] [CrossRef] [PubMed]
- Gomez-Larrauri, A.; Adhikari, U.D.; Aramburu-Nuñez, M.; Custodia, A.; Ouro, A. Ceramide Metabolism Enzymes—Therapeutic Targets against Cancer. Medicina 2021, 57, 729. [Google Scholar] [CrossRef] [PubMed]
- Choi, M.K.; Song, I.S. Recent Advances in the Formulation of Sphingolipid Anticancer Therapeutics. J. Pharm. Investig. 2020, 50. [Google Scholar] [CrossRef]
- Santos, C.R.; Schulze, A. Lipid Metabolism in Cancer. FEBS J. 2012, 279, 2610–2623. [Google Scholar] [CrossRef] [PubMed]
- Cuvillier, O. Sphingosine in Apoptosis Signaling. Biochim. Biophys. Acta 2002, 1585, 153–162. [Google Scholar] [CrossRef] [PubMed]
- Zhao, J.; Zhang, J.Q.; Li, T.T.; Qiao, S.; Jiang, S.L. Promoting Liver Cancer Cell Apoptosis Effect of Tribulus Terrestris L. via Reducing Sphingosine Level Was Confirmed by Network Pharmacology with Metabolomics. Heliyon 2023, 9, e17612. [Google Scholar] [CrossRef] [PubMed]
- Xu, X.; Lai, Y.; Hua, Z.C. Apoptosis and Apoptotic Body: Disease Message and Therapeutic Target Potentials. Biosci. Rep. 2019, 39, BSR20180992. [Google Scholar] [CrossRef] [PubMed]
- Zhang, Z.; Li, B.; Xu, P.; Yang, B. Integrated Whole Transcriptome Profiling and Bioinformatics Analysis for Revealing Regulatory Pathways Associated with Quercetin-Induced Apoptosis in HCT-116 Cells. Front. Pharmacol. 2019, 10, 446985. [Google Scholar] [CrossRef] [PubMed]
- Jiang, Y.X.; Dai, Y.Y.; Pan, Y.F.; Wu, X.M.; Yang, Y.; Bian, K.; Zhang, D.D. Total Flavonoids from Radix Glycyrrhiza Exert Anti-Inflammatory and Antitumorigenic Effects by Inactivating INOS Signaling Pathways. Evid. Based Complement. Altern. Med. 2018, 2018, 6714282. [Google Scholar] [CrossRef] [PubMed]
- Vanini, F.; Kashfi, K.; Nath, N. The Dual Role of INOS in Cancer. Redox Biol. 2015, 6, 334–343. [Google Scholar] [CrossRef] [PubMed]
- Korde Choudhari, S.; Chaudhary, M.; Bagde, S.; Gadbail, A.R.; Joshi, V. Nitric Oxide and Cancer: A Review. World J. Surg. Oncol. 2013, 11, 118. [Google Scholar] [CrossRef] [PubMed]
- Kim, H.K.; Cheon, B.S.; Kim, Y.H.; Kim, S.Y.; Kim, H.P. Effects of Naturally Occurring Flavonoids on Nitric Oxide Production in the Macrophage Cell Line RAW 264.7 and Their Structure-Activity Relationships. Biochem. Pharmacol. 1999, 58, 759–765. [Google Scholar] [CrossRef]
- Jiang, W.J.; Kitanaka, S.; Takamiya, T.; Iijima, H. Stereospecific Inhibition of Nitric Oxide Production in Macrophage Cells by Flavanonols: Synthesis and the Structure-Activity Relationship. Part 2. Bioorganic Med. Chem. 2017, 25, 4277–4284. [Google Scholar] [CrossRef] [PubMed]
- Alvarez-Suarez, J.M.; Carrillo-Perdomo, E.; Aller, A.; Giampieri, F.; Gasparrini, M.; González-Pérez, L.; Beltrán-Ayala, P.; Battino, M. Anti-Inflammatory Effect of Capuli Cherry against LPS-Induced Cytotoxic Damage in RAW 264.7 Macrophages. Food Chem. Toxicol. 2017, 102, 46–52. [Google Scholar] [CrossRef] [PubMed]
- Xu, W.; Liu, L.Z.; Loizidou, M.; Ahmed, M.; Charles, I.G. The Role of Nitric Oxide in Cancer. Cell Res. 2002, 12, 311–320. [Google Scholar] [CrossRef]
- Aron, A.T.; Gentry, E.C.; McPhail, K.L.; Nothias, L.F.; Nothias-Esposito, M.; Bouslimani, A.; Petras, D.; Gauglitz, J.M.; Sikora, N.; Vargas, F.; et al. Reproducible Molecular Networking of Untargeted Mass Spectrometry Data Using GNPS. Nat. Protoc. 2020, 15, 1954–1991. [Google Scholar] [CrossRef] [PubMed]
- Mosmann, T. Rapid Colorimetric Assay for Cellular Growth and Survival: Application to Proliferation and Cytotoxicity Assays. J. Immunol. Methods 1983, 65, 55–63. [Google Scholar] [CrossRef] [PubMed]
- Marcocci, L.; Maguire, J.J.; Droy-Lefaix, M.T.; Packer, L. The Nitric Oxide-Scavenging Properties of Ginkgo Biloba Extract EGb 761. Biochem. Biophys. Res. Commun. 1994, 201, 748–755. [Google Scholar] [CrossRef] [PubMed]
- Bates, T.E.; Loesch, A.; Burnstock, G.; Clark, J.B. Immunocytochemical Evidence for a Mitochondrially Located Nitric Oxide Synthase in Brain and Liver. Biochem. Biophys. Res. Commun. 1995, 213, 896–900. [Google Scholar] [CrossRef] [PubMed]
- Green, L.C.; Wagner, D.A.; Glogowski, J.; Skipper, P.L.; Wishnok, J.S.; Tannenbaum, S.R. Analysis of Nitrate, Nitrite, and [15N]Nitrate in Biological Fluids. Anal. Biochem. 1982, 126, 131–138. [Google Scholar] [CrossRef] [PubMed]
- Pang, Z.; Zhou, G.; Ewald, J.; Chang, L.; Hacariz, O.; Basu, N.; Xia, J. Using MetaboAnalyst 5.0 for LC–HRMS Spectra Processing, Multi-Omics Integration and Covariate Adjustment of Global Metabolomics Data. Nat. Protoc. 2022, 17, 1735–1761. [Google Scholar] [CrossRef] [PubMed]
- Lu, Y.; Pang, Z.; Xia, J. Comprehensive Investigation of Pathway Enrichment Methods for Functional Interpretation of LC-MS Global Metabolomics Data. Brief. Bioinform. 2023, 24, bbac553. [Google Scholar] [CrossRef] [PubMed]


Disclaimer/Publisher’s Note: The statements, opinions and data contained in all publications are solely those of the individual author(s) and contributor(s) and not of MDPI and/or the editor(s). MDPI and/or the editor(s) disclaim responsibility for any injury to people or property resulting from any ideas, methods, instructions or products referred to in the content. |
© 2024 by the authors. Licensee MDPI, Basel, Switzerland. This article is an open access article distributed under the terms and conditions of the Creative Commons Attribution (CC BY) license (https://creativecommons.org/licenses/by/4.0/).
Share and Cite
Chitiva, L.C.; Santamaría-Torres, M.A.; Rezende-Teixeira, P.; Borlot, J.R.P.d.O.; Romagna, R.d.A.; Londoño, X.; Kitagawa, R.R.; Costa-Lotufo, L.V.; Prieto-Rodríguez, J.A.; Castro-Gamboa, I.; et al. Uncovering Metabolic Alterations in HCT-116 Colon Cancer Cells upon Exposure to Bamboo Leaf Extract Obtained from Guadua incana Londoño. Molecules 2024, 29, 2985. https://doi.org/10.3390/molecules29132985
Chitiva LC, Santamaría-Torres MA, Rezende-Teixeira P, Borlot JRPdO, Romagna RdA, Londoño X, Kitagawa RR, Costa-Lotufo LV, Prieto-Rodríguez JA, Castro-Gamboa I, et al. Uncovering Metabolic Alterations in HCT-116 Colon Cancer Cells upon Exposure to Bamboo Leaf Extract Obtained from Guadua incana Londoño. Molecules. 2024; 29(13):2985. https://doi.org/10.3390/molecules29132985
Chicago/Turabian StyleChitiva, Luis Carlos, Mary Andrea Santamaría-Torres, Paula Rezende-Teixeira, Jessica Rodrigues Pereira de Oliveira Borlot, Rodrigo de Almeida Romagna, Ximena Londoño, Rodrigo Rezende Kitagawa, Leticia V. Costa-Lotufo, Juliet A. Prieto-Rodríguez, Ian Castro-Gamboa, and et al. 2024. "Uncovering Metabolic Alterations in HCT-116 Colon Cancer Cells upon Exposure to Bamboo Leaf Extract Obtained from Guadua incana Londoño" Molecules 29, no. 13: 2985. https://doi.org/10.3390/molecules29132985
APA StyleChitiva, L. C., Santamaría-Torres, M. A., Rezende-Teixeira, P., Borlot, J. R. P. d. O., Romagna, R. d. A., Londoño, X., Kitagawa, R. R., Costa-Lotufo, L. V., Prieto-Rodríguez, J. A., Castro-Gamboa, I., & Costa, G. M. (2024). Uncovering Metabolic Alterations in HCT-116 Colon Cancer Cells upon Exposure to Bamboo Leaf Extract Obtained from Guadua incana Londoño. Molecules, 29(13), 2985. https://doi.org/10.3390/molecules29132985