Article

Stable Radical Isoporphyrin Copolymer Prepared with Di(phenylphosphane)

1
Zhengzhou Research Base, National Key Laboratory of Cotton Bio-Breeding and Integrated Utilization, School of Agricultural Sciences, Zhengzhou University, Zhengzhou 450001, China
2
Institut de Chimie, UMR CNRS 7177, Université de Strasbourg, 4 Rue Blaise Pascal, CS 90032, F-67081 Strasbourg Cedex, France
3
LEPMI, Université 589 Grenoble Alpes, Université Savoie Mont Blanc, CNRS, 590 Grenoble INP, F-38000 Grenoble, France
4
Institut des Nanosciences de Paris, UMR CNRS 7588, Sorbonne Université, 4 Place Jussieu, Boîte Courrier 840, F-75252 Paris, France
5
UFR des Sciences Fondamentales et Biomédicales, Université Paris-Cité, 45 Rue des Saints Pères, F-75006 Paris, France
*
Author to whom correspondence should be addressed.
Molecules 2024, 29(13), 3056; https://doi.org/10.3390/molecules29133056
Submission received: 3 June 2024 / Revised: 22 June 2024 / Accepted: 24 June 2024 / Published: 27 June 2024
(This article belongs to the Section Inorganic Chemistry)

Abstract

:
Two diphosphanes with variable-length ligands tested as nucleophiles to prepare isoporphyrin copolymers in the presence of ditolylporphyrin of zinc (ZnT2P) prevented the oxidation of the diphosphine ligand. This paper demonstrates the power of this approach and describes the photoelectrocatalytic properties. The obtained copolymers were characterized by UV–vis spectroscopy, X-ray photoelectron spectroscopy, atomic force micrograph (AFM), EQCM (Electrochemical Quartz Cristal Microbalance) and electrochemistry. Their impedance properties (EIS) were studied and their photovoltaic performances were also investigated by photocurrent transient measurements under visible light irradiation.

1. Introduction

Over the years, several extended porphyrin structures have been prepared and studied with a particular interest in the dependence of the geometric factors on their physical properties. Structural flexibility is determined by the nature of the bridge. To observe efficient interactions between the different chromophores, a large variety of bridging chains have been used as spacers in the building of dimers, but only a few papers were devoted to phosphanylporphyrins. Electrochemistry has been shown to be an appropriate synthetic tool in the coupling of porphyrins.
Phosphorus ligands are useful nucleophiles and could nucleophilic attack the π cation radicals of metalloporphyrins.
In an original study, Smith and colleagues demonstrated that triphenylphosphine (PPh3) functions as a nucleophile in the meso position when reacting with the cation radical of the Zn(II) octaethylporphyrin complex (ZnOEP), initially formed via chemical oxidation [1,2]. Additionally, Shine et al. described the reactivity at the meso-position of the zinc(II) tetraphenylporphyrin cation radical ZnTPP+●, which was also chemically generated, in the presence of PPh3 [3,4]. Subsequently, Latos-Grażyński et al. reported the chemical β-functionalization of preformed FeIIITPP(ClO4)2 with PPh3, resulting in the formation of the dimer [FeIIITPP-β-+PPh3]2O(ClO4), albeit with modest yields in both meso- and β-phosphonium-based porphyrins [5]. Giraudeau et al. made significant strides in improving the yield of phosphonium-based porphyrins by continuously generating the porphyrin π-cation radical in the presence of PPh3 through controlled potential electrolysis. Under these conditions, ZnIITPP-β-+PPh3ClO4 was produced with a 50% yield [6].
Lastly, the electrochemical oxidation of zinc 5,15-bis(p-tolyl)-10-phenylporphyrin in the presence of PPh3 resulted in the formation of meso-substituted triphenylphosphonium porphyrin, coordinated by one O=PPh3 molecule, with a good yield of 84% [7].
In a direct one-pot electrochemical reaction, the bis(diphenylphosphino)acetylene ligand acts as a nucleophile allowing the electrosynthesis of diporphyrins with a diphosphonium spacer bridged directly at their meso position upon oxidation of the zinc meso-tetraphenyl porphyrin (ZnTPP) at an applied potential of 0.80 V vs. SCE [8]. We also described the efficient synthesis of various diphosphonium-bridged homometallated porphyrin dimers and trimers by controlled potential electrolysis in a direct one-pot electrochemical reaction using more or less rigid diphosphanes with variable length [9,10]. It clearly illustrates that phosphorus ligands act as powerful nucleophiles which allow electrochemical β-substitutions on meso-tetra-phenylporphyrins. However, such diphosphane compounds are easily oxidized which can limit the use of such ligands for the electrosynthesis, which is conditioned by the applied potential as well as the potential of the first oxidation of the porphyrin.
It must be noted that not only diphosphonium ligands can act as bridges between porphyrins. In the case of an aminophenyl derivative with –NH2 groups at the para position of the phenyl substituents, for example in 5,10,15,20-tetrakis(4-amino-phenyl)porphyrin or 5,15-bis(4-aminophenyl)-10,20-bis(4-carbomethoxyphenyl)porphyrin, oxydation gives a highly interconnected nanofibrous network and a linear porphyrin polymer [11,12,13]. The mechanism is considered analogous to that found in aniline polymerization, except that the attack of the electrophilic nitrogen must occur exclusively to the meta-positions of the aminophenyl substituents of another porphyrin molecule. Furthermore, oxidative electrodeposition of CoTSPP (tetrakis 4-sulfonatophenyl Co porphyrin) on ITO electrode from NaOH 0.1 M aqueous solution has been also studied [14], following the procedure previously described by Bedioui et al. for Ni-porphyrins electrodeposition [15].
Recently, we also discovered the formation of stable isoporphyrins copolymers linked by pyridyl ligands [16,17]. Our group has shown that stable isoporphyrins copolymers could be prepared during porphyrin electro-oxidation when sterically less hindered porphyrin is used, such as the zinc-meso-5,15-ditolyl-porphyrin (ZnT2P), which presents only two meso positions occupied by one substitutable proton at positions C10 and C20 (Scheme 1).
In this respect, we report hereafter, the formation of stable isoporphyrin copolymers (Scheme 2) from the ditolyl porphyrin of zinc, ZnT2P in the presence of diphosphanes such as cis-1,2-bis(diphenylphosphino)ethene (1), and 1,2-bis(diphenylphosphino)benzene (2) (Scheme 1). The morphology of the copolymers has been studied by atomic force micrograph (AFM). The obtained copolymers were characterized by UV–vis spectroscopy, X-ray photoelectron spectroscopy, EQCM (Electrochemical Quartz Cristal Microbalance) and electrochemistry. Their impedance properties (EIS) were studied and their photovoltaic performances were also investigated by photocurrent transient measurements under visible light irradiation.

2. Results and Discussion

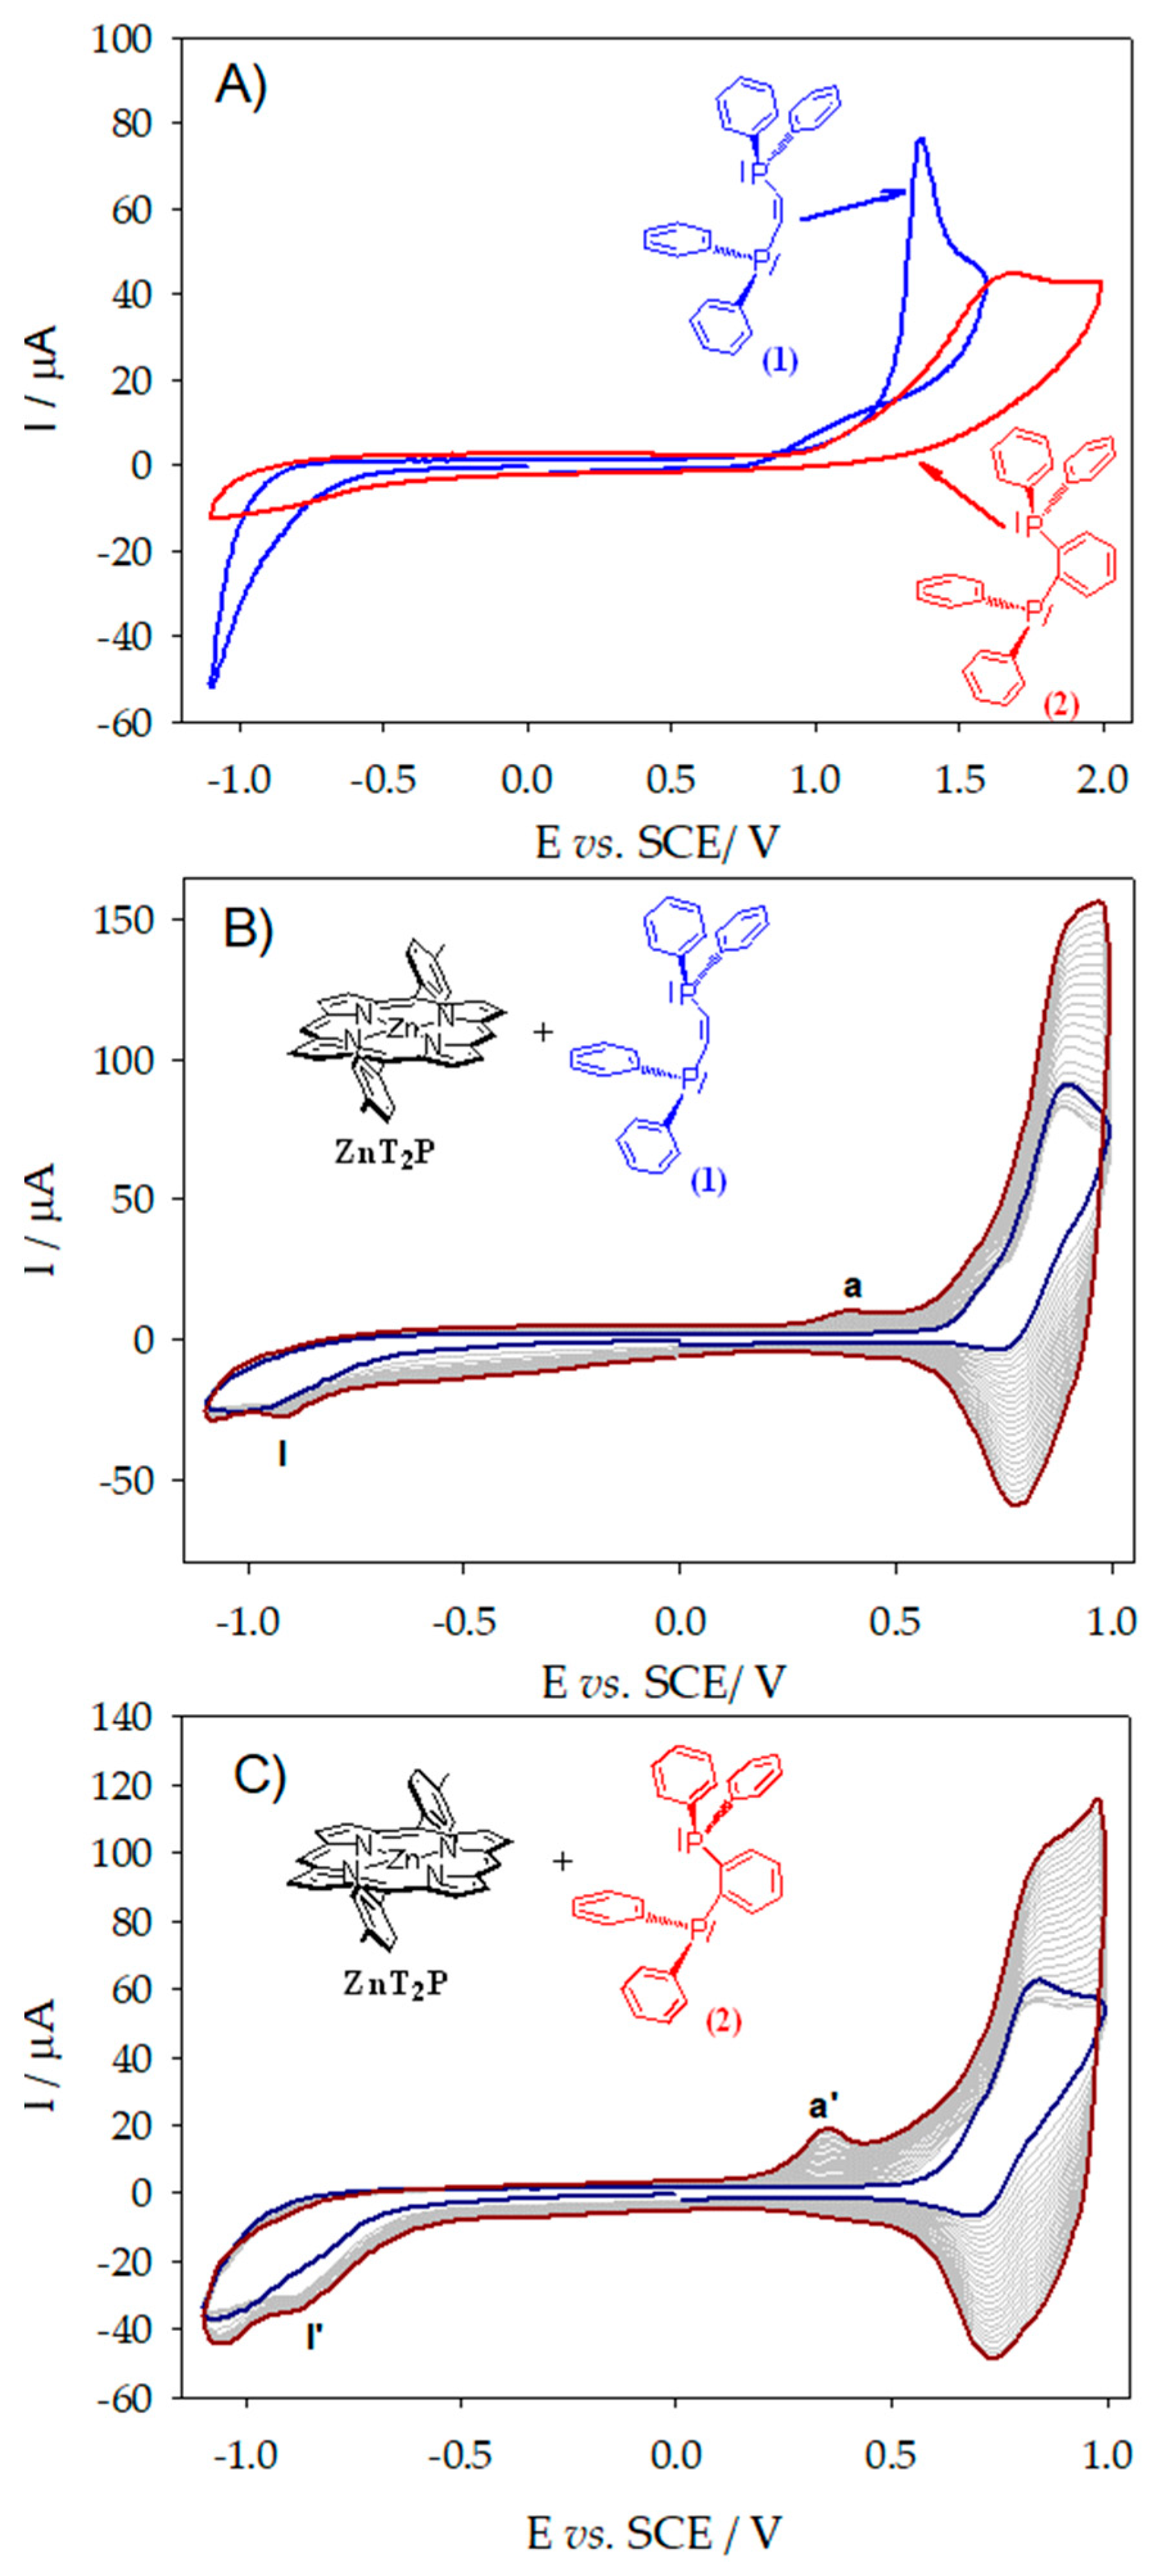
2.1. Electropolymerization of Isoporphyrin Copolymers

As already reported, in the presence of various nucleophiles, the second oxidation step of the tetraphenyl porphyrin of zinc (ZnTPP) became irreversible and a new cathodic peak appeared, as observed in the reduction of electrochemically generated isoporphyrins [18,19,20,21,22].
In the case of the applied potential close to the second oxidation of the ZnTPP porphyrin (1.16 V vs. SCE) in the presence of tertiary diphosphane cis-1,2-bis(diphenylphosphino)ethene (1) or 1,2-bis(diphenylphosphino)benzene (2), oxidation of the di(phenylphosphane) occurs generating first the diphosphine cation radical, which is fully converted to the diphenylphosphino monooxide without formation of the dimer of porphyrin. The only product formed after purification was the diphenylphosphino monooxide. If using ZnTPP, no copolymer is obtained applying the potential at the first oxidation of the ZnTPP (0.80 V vs. SCE) where only the dimer of porphyrin with diphosphonium spacer is obtained as already published [8]. It must be noted that at this potential first oxidation of the porphyrin, the oxidation of the diphosphane ligand does not occur. Indeed, irreversible oxidation waves have been measured for cis-1,2-bis(diphenylphosphino)ethene (1) and 1,2-bis(diphenylphosphino)benzene (2) at +1.37 V and +1.68 V vs. SCE (Table 1 and Figure 1A) corresponding to the oxidation of the -P(Ph)2- phosphane group. This result is probably due to the steric hindrance of the ZnTPP porphyrin which leads to the slower kinetic of the nucleophilic attack at the meso positions (Scheme 1) [11,12].
In the case of the zinc-meso-5,15-ditolyl-porphyrin (ZnT2P), two sides occupied by hydrogen at the meso position 5 and 15 and at β positions are present (Scheme 1), leading to the decrease in the steric hindrance with faster nucleophilic attack at meso positions 5 and 15. Thus, oxidation at the first oxidation of ZnT2P should be more favorable to generate copolymers of isoporphyrin [16].
Cyclic voltammograms during electropolymerization of ZnT2P in the presence of cis-1,2-bis(diphenylphosphino)ethene (1) or 1,2-bis(diphenylphosphino)benzene (2) conducted between −1.1 V and +1.0 V vs. SCE are shown in Figure 1B,C.
Upon the increase in the iterative scans n, the oxidation waves continue to increase, showing the growth of copolymer materials (Figure 1B,C). Finally, brown deposited films could be observed on the ITO surface (Figure 2D) showing the electrodeposition of the film.
The electrochemical synthesis of the polyisoporphyrin copolymers relies on the previously reported Eox1CN1Eox2CB1(Eox3+nCB1+n)n process of nucleophilic substitution on porphyrins [16]. The mechanism of electropolymerization can be explained as follows: First, the porphyrin radical cation (ZnT2P+•, electrochemical step Eox1) is electrogenerated at 0.79 V vs. SCE. Then, ZnT2P+• can be attacked by a diphenylphosphane groups (chemical step CNmeso) at meso-carbon position to yield an isoporphyrin. This later compound can be oxidized (electrochemical step Eox2) and the hydrogen atom initially located on the meso-carbon is released inducing the rearomatization of the porphyrin (chemical step CB1) which give the mono-substituted porphyrin ZnT2P-meso-(Ph)2P+-Ph-P(Ph)2 PF6. At this stage, we have already obtained the monosubstituted porphyrin with one phosphonium covalently connected to the porphyrin and one pendant phosphane, which is still active for nucleophilic attack. Thus, the oxidation of the monosubstituted porphyrin will generate the β radical cation porphyrin (Eox3 step) which can react itself (nucleophilic attack of the pendant phosphane group –P(Ph2)), forming isoporphyrin radical copolymer (CN2 step) with diphosphonium spacers (Scheme 2 and Supplementary Materials Schemes S1 and S2). Thus, the first oxidation of the ZnT2P generated the β-radical cation porphyrin ZnT2P+●, the di(phenylphosphane) ligand could react with ZnT2P+● to form stable poly-isoporphyrin radical copolymers. Indeed, isoporphyrin radical films were found to be highly stable in the presence of dioxygen (still stable in the solid state even after four years).

2.2. Electrochemical Quartz Cristal Microbalance (EQCM)

The formation of poly-ZnT2isoP1 and poly-ZnT2isoP2 prepared from ZnT2P and cis-1,2-bis(diphenylphosphino)ethene) (1) or 1,2-bis(diphenylphosphino)benzene) (2) has been monitored in situ by EQCM with iterative scans between −1.0 V and +1.0 V vs. SCE (Figure 2 and Figure S1).
Electropolymerization occurs in the presence of diphosphane ligand and ZnT2P via the oxidation. Further, the trace of the first scan in Figure 2A shows a significant decrease in the resonance frequency and thus an increase in the deposited mass at the first oxidation of the porphyrin, i.e., electropolymerization occurs upon the formation of the radical cation porphyrin ZnT2P+● in the presence of 1,2-bis(diphenylphosphino)benzene (2).
The resonance frequency displays a significant decrease meaning an increase in the deposited mass during the electropolymerization as shown in Figure 2B. Indeed, according to the Sauerbrey’s equation, the decrease in resonance frequency in Figure 2 corresponds to the increase in deposited mass. The mass of the copolymer film increased with the increase in number of potential cycle n (Figure 2B). Similar results have been obtained in the case of poly-ZnT2isoP1 (Figure S1). Note that a change in slope is observed for n > 15 in the case of poly-ZnT2isoP2 (Figure 2B). It might be related to the incorporation of supporting electrolyte, monomers as well as solvent molecules.
After 25 iterative scans, 7.81 µg.cm−2 of poly-ZnT2isoP1 and 11.46 µg.cm−2 of poly-ZnT2isoP2 are deposited. The repeat units are (isoZnT2P-+PPh2-HC=CH-PPh2+·2PF6) and (isoZnT2P-+PPh2-Ph-PPh2+·2PF6) for poly-ZnT2isoP1 and poly-ZnT2isoP2, respectively (Figure 3).
The calculated surface coverages Γ, after n = 25 iterative scans between −1.0 V and +1.0 V vs. SCE, are 8.36 × 10⁻⁹ mol·cm−2 and 11.78 × 10⁻⁹ mol·cm−2 for poly-ZnT2isoP1 and poly-ZnT2isoP2, respectively. The result showed that the mass deposited of poly-isoporphyrin copolymer obtained is higher in the case of 1,2-bis(diphenylphosphino)benzene which means that this ligand shows better reactivity toward the nucleophilic attack than cis-1,2-bis(diphenylphosphino)ethene. It may be due to the higher flexibility of the disphosphane cis-1,2-bis(diphenylphosphino)ethene where Z/E isomerization under illumination is possible. Such isomerization is not possible in the case of the rigid 1,2-bis(diphenylphosphino)benzene (2).
The mass change Δmcalc can also be calculated from Faraday’s law by using the anodic charge Q as well as the molecular mass of the repeat unit of the copolymer. The calculated values Δmcalc are close to the experimental measurement ΔmEQCM obtained from EQCM study matching well to the formation of the 1D copolymer (Figure 3B and Table S1).

2.3. X-ray Photoelectron Spectroscopy (XPS)

The X-Ray photoelectron spectroscopy of poly-ZnT2isoP2 was also investigated as shown in Figure 4. The analysis of the survey spectra confirms the presence of the isoporphyrin and diphosphonium subunits (Zn 2p3 at 1022.0 eV, N 1s, and C 1s peaks), while the signals for F 1s (686.7 eV) and for P 2p (136.9 eV and 136.3 eV) electrons stem from the incorporated counterion PF6 as well as the phosphonium linkers (for the second P 2p signal at 136.3 eV). The C1s peaks are composed of two signals, 286.5 eV and 285.0 eV attributed to homo and hetero (connected to nitrogen) carbon atoms, respectively. The N1s peaks at 402.5 eV, 400.6 eV and 398.5 eV reveal the presence of three chemically different nitrogens due to the counter cation tetrabutylammonium, and the inner iminic nitrogen of the porphyrin. The whole XPS spectra are shown in Figure S3. Similar results have been obtained in the case of the second copolymer poly-ZnT2isoP1 (Figure S2).
Analysis from the XPS data for the two copolymers can give the zinc-to-phosphorus atomic ratio, which is approximately 0.24 for the two copolymers. It is in agreement and very close to the theoretical ratio (0.25, one Zn per four P atoms, corresponding to the two phosphonium of the linker and the two PF6 counter anions) in the case of the formation of the 1D copolymer where the repeat units are (isoZnT2P-+PPh2-HC=CH-PPh2+·2PF6) and (isoZnT2P-+PPh2-Ph-PPh2+·2PF6) for poly-ZnT2isoP1 and poly-ZnT2isoP2, respectively. Thus, it confirms the 1D copolymer formation as suggested by the EQCM measurements.

2.4. Electron Paramagnetic Resonance (EPR)

The conspicuous central signal within these spectra confirms the presence of isoporphyrin-based free radicals (Figure 5), exhibiting a g-factor of 2.003 and a linewidth of approximately 0.6 mT [18]. Notably, an increase in the deposition concentration of the copolymers on the ITO led to a commensurate rise in the EPR signal strength. Typically, in the literature, isoporphyrins and their radical cationic forms are known to be highly reactive, prone to decomposition [19,20].
However, in this study, the isoporphyrin free radical films of poly-ZnT2isoP1 and poly-ZnT2isoP2 exhibited surprising stability in a solid state, even when exposed to the atmosphere, enduring up to 4 years. This remarkable stability can likely be attributed to the following factors: the electron-withdrawing groups playing a pivotal role in facilitating the reduction and stabilization of the radical cations, and the free radicals benefiting from the electronic delocalization effects of the porphyrin, in addition to the π–π interactions between molecules and the π–π stacking effects between the macrocycles.

2.5. UV–Visible–NIR Spectroscopy

Figure 6A showed UV–visible–NIR spectra on ITO electrodes coated with the poly-isoporphyrin measured at various thicknesses. The absorption intensity increases with iterative scan number which showed same trend with EQCM results (Figure S4).
A typical UV–visible–NIR spectrum of poly-ZnT2isoP1 obtained after electropolymerization between −1.1 and +1.0 V vs. SCE exhibited a split Soret absorption band at λ = 432 nm and λ = 505 nm. The bands were red shifted by 18 and 90 nm, respectively, compared to the ZnT2P monomer (Table 2).
The visible bands (Q bands), observed at 587 and 633 nm, are also red-shifted by 41 and 49 nm compared to ZnT2P, while for this poly-isoporphyrin, additional band in the NIR region were detected at 810 nm (Figure 6A). For poly-ZnT2isoP2, Soret absorption bands are at λ = 432 nm and λ = 497 nm, and Q bands are at 574 nm, 632 nm, also one additional absorption band in NIR region at 805 nm. This bathochromic shift may result from the electron withdrawing effect of the positive charge on the phosphonium cations.
The red shift observed in the Soret (B) and Q bands should be attributed to the nonplanar conformation of the macrocycle, as well as the electron-withdrawing effects of the pyridinium groups. Indeed, the red shift observed in the Soret (B band) and Q bands caused by the non-planarity of porphyrins are well documented in the literature [21,22,23,24]. Optical red shifts may be also attributed to the electron-withdrawing effects of the pyridinium groups. This phenomenon is explained by a greater destabilization of the highest occupied molecular orbitals (HOMOs) compared to the lowest unoccupied molecular orbitals (LUMOs), leading to narrower HOMO–LUMO gaps [25,26,27,28]. These spectral changes can also be interpreted by considering the intra- and intermolecular exciton coupling between the porphyrin macrocycles within the copolymer [29,30].
The splitting of the Soret band as well as the additional NIR band could be the result to the formation of the related radical isoporphyrin [16]. The weak absorption band in NIR region more pronounced for poly-ZnT2isoP2 (Figure 6A and Figure S4) may because of the high delocalization of π-cation radicals of poly-isoporphyrin as well as the presence of the isoporphyrin subunits [16]. Similar bands have been already observed in the case of stable isoporphyrin monomer [31].
In Figure S4C, we observe results which seem contradictory to those obtained by the EQCM measurements if we only compare the maximum absorption intensity at λ = 432 nm. However, it can be noted that for poly-ZnT2isoP1, the splitting of the Soret absorption bands is more marked with a more marked widening of the bands. This is undoubtedly due to greater flexibility for poly-ZnT2isoP1 where the spacer is the cis-1,2-bis(diphenylphosphonium)ethene. It is therefore difficult in this case to compare only the intensity of the Soret band at λ = 432 nm.
Interestingly, the broadening and the splitting of the Soret band as well as the presence of one additional band in the NIR between 750 nm and 1000 nm are expected to be advantageous to photovoltaic applications by extending the domain of solar light absorption.

2.6. Film Morphology (Atomic Force Microscopy, AFM)

The obtained films were studied by scanning atomic force microscopy (AFM) (Figure 7A,C).
In a typical image of poly-ZnT2isoP1, the copolymer is seen on the surface as densely packed coils with an average diameter of approximately 80–150 nm and a height approximately 22.0 nm for the film produced after 10 iterative scans between −1.1 V and +1.0 V (Figure 6A). The rms surface roughness of the two films was estimated to be 14.2 nm for poly-ZnT2isoP1, based on calculations from an area of 1.0 μm2 with 10 scans (Figure 6).
The poly-ZnT2isoP1 copolymer films obtained after higher iterative scan number exhibited comparable morphology but showed in several positions some aggregation of the coils accompanied by a larger value of the rms surface roughness (24.9 nm for n = 15). The formation of coil aggregates might be related to the change in slope of the deposited mass, observed from EQCM measurements in Figure 2B.
The poly-ZnT2isoP2 films were also studied by AFM (Figure 7C,D). The poly-ZnT2isoP2 copolymer appears on the surface yet again as tightly packed coils with an average diameter of ca. 80–100 nm, the height being approximately 24.0–33.0 nm for the film. The rms surface roughness of the films has been estimated at 7.6 nm for n = 10 scans (calculated from an area of 1.0 μm2).

2.7. Electrochemistry of the Copolymer

The cyclic voltammetry of electroactive polymers deposited on ITO surfaces have been characterized by electrochemical methods (Table 2). The CV curves shown in Figures S5 and S6 have been recorded for poly-ZnT2isoP1 and poly-ZnT2isoP2 with copolymer grown on the electrode surface for various potential scans (n = 1, 2, 3, 5, 10, 15, 20, 25 cycles) in a clean electrolytic solution containing only the solvent and the supporting electrolyte.
When porphyrin was substituted by such electron-withdrawing groups, the oxidation of the substituted isoporphyrins was more difficult than the oxidation of the corresponding unsubstituted porphyrins ZnT2P (Table 2).
In the anodic part, three successive waves are observed, the first wave is reversible while the two last waves are irreversible (Table 2). The first reversible processes were measured at +0.86 V and +0.88 V for poly-ZnT2isoP1 and poly-ZnT2isoP2, respectively. This corresponded to the wave which increases in intensity during electropolymerization (Figure 1B,C). The reversible wave corresponds to the reversible oxidation of the isoporphyrin radical isoP giving the oxidized isoporphyrin isoP+.
The two irreversible oxidation peaks were observed after the reversible wave for poly-ZnT2isoP1 and poly-ZnT2isoP2 at 1.15 V and 1.39 V vs. SCE and at 1.17 V and 1.40 V vs. SCE, respectively (Figure S5).
In the cathodic domain, not well-resolved wave observed approximately –0.91 V vs. SCE and –0.87 V vs. SCE (peaks I or I’) for poly-ZnT2isoP1 and poly-ZnT2isoP2, respectively, are attributed to the reduction of the phosphonium forming the corresponding radical (-P(Ph)2-).
Furthermore, after the reduction of the phosphonium units, the additional wave measured at +0.42 V and +0.38 V for poly-ZnT2isoP1 and poly-ZnT2isoP2, respectively (peak a or a’), which were also observed during electropolymerization (peaks a or a’) might correspond to the reaction between the radical phosphine –(Ph)2P– formed after reduction of the phosphonium unit and the radical present on to the isoporphyrin isoP.
Thus, the reduction of the diphosphonium generates one biradical which can react rapidly via radical coupling with the radical present onto the isoporphyrin (formation of the internal C-C bound between (-P(Ph)2- and the IsoP) as proposed in Scheme S3.
The peaks a or a’ might be due to the oxidation of the resulting compound obtained to regenerate the starting isoporphyrin radical-phosphonium material.
Poly-ZnT2isoP1 and poly-ZnT2isoP2 are highly stable even after 4 years, but at a higher applied potential than the first oxidation wave, which is reversible, at 0.86 V and 0.88 V, respectively, for instance at an applied potential of 1.60 V, fully decomposition of the film occurs leading to the fully removal of the film from the ITO slides (Figure S5, right).

2.8. Electrochemical Impedance Spectroscopy (EIS) and Photoelectrochemical Properties

The electrochemical and photoelectrochemical properties of this two poly-isoporphyrins are investigated and compared (Figure 6B,C, and Figures S7 and S8).
The typical current–potential curves were obtained by photocurrent measurements (Figures S7 and S8). For the best photocurrent value of both poly-ZnT2isoP1 (20 scans) and poly-ZnT2isoP2 (10 scans) samples, the amount of deposited copolymer on ITO substrate is approximately the same (ca. 6.5 µg/cm2), thus enabling the comparison of their (photo)electrochemical properties.
Compared with Figure S7, the photocurrent response depends on the number of deposition scans. The magnitude of the photocurrent increased from n = 1 to n = 10, and then as decreased with higher deposition scans of poly-ZnT2isoP1. The same trend is observed for poly-ZnT2isoP2.
The electrical properties of copolymer films were studied by electrochemical impedance spectroscopy (EIS), which is widely used in the investigation of dye sensitized solar cell. Under light illumination, the poly-ZnT2isoP2 showed a better conductivity than poly-ZnT2isoP1 according to the smaller semi-circle (Figure 6D and Figure S9). This appearance seems to be correlated with the magnitude of the photocurrent measured under visible illumination. All the results showed that the poly-ZnT2isoP2 had a better photocurrent generation under visible illumination (Figure 6C and Figure S9).
The Nyquist plots of a typical impedance spectra measured for poly-ZnT2isoP1 and poly-ZnT2isoP2 at 0 V in 5 mM I3/0.5 M I aqueous solution with different scan numbers (n = 1, 2, 3, 5, 10, 15, 20 and 25) are plotted in Figure S9. The Nyquist diagrams can be fitted with an equivalent circuit composed of two parallel RC circuits in series. One RC circuit can be attributed to the charge transfer resistance Rct of the I/I3 species at the ITO/solution interface in parallel with the interfacial capacitance Ci, while the other RC circuit also is due to the ion transport resistance Rf within the copolymer film in parallel with the Cf capacitance of the film. The evolution of the Rct and Rf values with the number of polymerization scan number under and without illumination shown in Figure S10.
Under illumination, the charge transfer resistance decreased compared to ones measured in the dark conditions, illustrating the shift of the open circuit potential and then the photochemical activity of copolymers when illuminated. The charge transfer resistance (Rct) decreases with scan number indicating that the presence of the copolymer film is catalyzing the electron transfer kinetics between I/I3 and the ITO electrode. Meanwhile, the Rf tends to increase with the number of electrodeposition scans n due to the increase in film thickness due to the ionic resistance into the copolymer film. Thus, the lowest total charge transfer resistance is obtained with 20 scans for poly-ZnT2isoP1 and 15 scans for poly-ZnT2isoP2, which showed almost the same trend with photocurrent. It suggests that the photocurrent efficiency is dependent on charge transfer resistance. For poly-ZnT2isoP1 at 20 scans under light illumination, Rct is 397 ohms versus Rf of 534 ohms. For poly-ZnT2isoP2, at 15 scans under light illumination, Rct is 456 ohms versus Rf of 18 ohms. Thus, poly- poly-ZnT2isoP2 possessed better conductivity with similar deposited mass than poly-ZnT2isoP1.
To investigate the electron transfer mechanism in the system, the energies of the relevant electronic states have been estimated. In the case of copolymer poly-ZnT2isoP1, an energy level diagram can be built using the oxidation potential of isoporphyrin subunit and the reduction potential of phosphonium subunits, together with the optical absorption spectra of copolymer films (Figure 8). It describes the thermodynamics for spectral sensitization of the ITO electrode. The LUMO levels of the excited poly-ZnT2isoP1 and poly-ZnT2isoP2 species can be roughly estimated by subtracting the excitation energy of the Soret or Q bands from the HOMO level energies. The levels of the excited isoporphyrin, isoPorph+/isoPorph*, are calculated from the absorption spectra of the film and the wavelength of the Soret (B), Q and NIR bands. The ground state isoporphyrin (isoPorph+/isoPorph) is calculated from the oxidation potential of the isoporphyrin giving for instance in the absolute scale –5.60 eV for the poly-ZnT2isoP1 film. The energy level of I3/I on the absolute scale is –5.00 eV. The energy Level of poly-ZnT2isoP2 corresponding to the band in the NIR region has also been indicated in the energy diagram (Figure 8). Under illumination at 0 V, the photon absorption by the (iso)porphyrin entities generate an electron hole pair in the copolymer. The electron is transferred from the excited (iso)porphyrins to the phosphonium subunit acting as a relay for the electron transfer forming the radical phosphane. This radical phosphane gives in turn the electron to the I3, which is reduced into I which, is reoxidized at the counter-electrode. The oxidized (iso)porphyrins are regenerated by an electron transfer from the ITO substrate. The I3 reduction is in competition with the recombination of the photogenerated electron-hole pair. Thus, fast electron transfer kinetics between the ITO and the oxidized (iso)porphyrins and/or between the excited (iso)porphyrins and the I3 are crucial for the efficient photocurrent generation.

3. Materials and Methods

3.1. Reagents

All solvents were of reagent-grade quality and used without further purification. Most common laboratory chemicals were reagent grade, purchased from commercial sources and used without further purification. The zinc-5,15-ditolylporphyrin (ZnT2P) was purchased from SAS PorphyChem®. cis-1,2-bis(diphenylphosphino)ethene (1) or 1,2-bis(diphenylphosphino)benzene (2).

3.2. Electrochemistry

Voltametric data were collected using a standard three-electrode setup with a PARSTAT 2273 potentiostat. The electrolyte solution was a mixture of CH3CN and 1,2-C2H4Cl2 (3:7) containing 0.1 mol·L−1 of tetrabutylammonium hexafluorophosphate (NBu4PF6). Single-side-coated indium-tin-oxide (ITO, SOLEMS, 25–35 Ω/cm2) electrodes with a surface area of 1 cm2 served as the working electrode, while a platinum wire functioned as the auxiliary electrode. The reference electrode was a saturated calomel electrode, connected to the solution via a junction bridge filled with the electrolyte. Electrochemical impedance spectroscopy (EIS) measurements were conducted with a sinusoidal voltage excitation of 10 mV amplitude across a frequency range of 100 kHz to 100 mHz. Additionally, ITO electrodes were employed to obtain UV–vis spectra of the electrochemically deposited copolymers using an Agilent 8453 spectrophotometer.

3.3. Electropolymerization

Electropolymerization was performed under an argon atmosphere using a solution of 0.1 mol·L−1 TBAPF6 in 1,2-C2H4Cl2/CH3CN (7/3) containing 0.25 mmol·L−1 of ZnT2P and 0.25 mmol·L−1 of either cis-1,2-bis(diphenylphosphino)ethene (1) or 1,2-bis(diphenylphosphino)benzene (2), within a voltage range of −1.1 to 1.0 V vs. SCE.
The formation of the copolymer can be carried out either by applying a constant potential (chronoamperometry), or by iterative scanning between two potentials (cyclic voltammetry). Chronoamperometry works but gives less controlled deposits and less homogeneous materials in terms of film thickness. It must be noted that electropolymerization at controlled potential is only possible beyond the first oxidation potential of the porphyrin ZnT2P, i.e., 0.79 V vs. SCE and below the oxidation potentials of the diphosphine ligand, namely the cis-1,2-bis(diphenylphosphino)ethene (1) or 1,2-bis(diphenylphosphino)benzene (2), at 1.37 V and 1.68 V vs. SCE, respectively. Furthermore, by applying a constant potential between 0.79 V and 1.37 V or 1.69 V vs. SCE for cis-1,2-bis(diphenylphosphino)ethene (1) or 1,2-bis(diphenylphosphino)benzene (2), respectively, an accumulation of the released H+ occurs which can induce a demetalation of the metalloporphyrin ZnT2P, follow by a protonation of the free base obtained H2T2P, leading to the formation of protonated porphyrin which will stop the reaction, these protonated porphyrins being much more difficult to be oxidized.
The cyclic voltammetry method over a voltage range of −1.1 to 1.0 V vs. SCE gave better results from the deposit quality point of view with a more homogeneous deposit thickness across the entire sample. The potential of 1.0 V was chosen to be sufficiently higher than the first oxidation potential of ZnT2P (0.79 V) and sufficiently lower than the oxidation potentials of cis-1,2-bis(diphenylphosphino)ethene (1) and 1,2-bis(diphenylphosphino)benzene (2). The scan rate v = 100 mV·s−1 allowed to obtain good-quality films with a preparation time for each sample that is not too long. The advantage of iterative scanning between −1.1 V and 1.0 V vs. SCE in cyclic voltammetry mode also makes it possible to consume and reduce the H+ released during the substitution by forming H2(g).
Below −1.1 V, a reduction in porphyrin macrocycle also occurs, inducing the formation of poor-quality film. Control of the optical spectra of the solution shows that no demetallation of the ZnT2P porphyrin is noticed in the case of iterative scan between −1.1 V to 1.0 V vs. SCE.
ITO electrodes with a surface area of 1 cm2 were used as the working electrode. Each copolymer underwent 20 iterative scans. Following electropolymerization, the modified working electrodes were rinsed with CH3CN and then with CH2Cl2 to remove any residual monomers and conducting salt from the deposited films.

3.4. Electrochemical Quartz Cristal Microbalance (EQCM)

A QCA-922 system (SEIKO EG&G instrument) combined with a Versa STAT 3 was employed for simultaneous electrochemical quartz crystal microbalance (EQCM) and cyclic voltammetry measurements. The electrochemical cell was assembled inside a glove box, using an ITO AT-cut quartz crystal resonator (mirror-finished, resonant frequency: 9.08 MHz ± 50 kHz, A = 0.2 cm2, SEIKO EG&G., Ltd.) as the working electrode, a platinum wire as the counter electrode, and an Ag/AgCl wire as a quasi-reference electrode. The solution used for electropolymerization was identical to that used for the copolymers with the larger ITO electrode. Iterative scans were performed at a scan rate of 100 mV·s−1 at room temperature, with simultaneous recording of the quartz resonance frequency. The change in quartz resonance frequency (Δf) was converted into mass change (Δm) using Sauerbrey’s equation (Equation (1)):
∆f = −2f02∆m/A(µ·ρ)1/2
where μ is the shear modulus of quartz (2.947 × 10¹¹ g·cm−1·s−2), A is the working area (0.2 cm2) of the ITO quartz crystal resonator, and f0 is the resonant frequency of the fundamental mode, and ρ is the density of the crystal (2.684 g/cm3).

3.5. X-ray Photoelectron Spectroscopy

XPS experiments were conducted using a RBD upgraded PHI-5000C ESCA system (Perkin-Elmer) with Mg Kα radiation (hν = 1253.6 eV) or Al Kα radiation (hν = 1486.6 eV). Typically, the X-ray anode operated at 250 W, with a high voltage of 14.0 kV and a detection angle of 54°. The pass energy was set at 23.5, 46.95, or 93.90 eV to ensure adequate sensitivity and resolution. The base pressure in the analyzer chamber was approximately 5 × 10⁻⁸ Pa. Samples were pressed into self-supported disks (10 × 10 mm), mounted on a sample holder, and then transferred into the analyzer chamber. Both the full spectra (0–1100 eV) and the high-resolution narrow spectra of all elements were recorded using an RBD 147 interface (RBD Enterprises, Briarwood, NY, USA) with Auger Scan 3.21 software. Binding energies were calibrated using contaminant carbon (C1s = 284.6 eV). Data analysis was performed using either RBD Auger Scan 3.21 software from RBD Enterprises or XPS Peak 4.1 provided by Raymund W.M. Kwok (The Chinese University of Hong Kong, China).

3.6. Atomic Force Microscopy (AFM)

Atomic force micrographs (AFM) measurements have been conducted directly on the ITO surfaces using a NX10 Park Instrument in the tapping mode under ambient conditions. Silicon cantilevers Bruker with a spring constant of 40 N/m and a resonance frequency in the range of 300 kHz have been used. The scanning rate was 1.0 Hz.

3.7. EPR Measurements

CW EPR experiments were performed using an X-band (9–10 GHz) Bruker ESP300 spectrometer equipped with a high-sensitivity resonator (ER4119HS, Bruker) at room temperature.

3.8. Photoelectrochemistry

Photoelectrochemical measurements were conducted in a three-electrode electrochemical cell, with glass-ITO electrodes covered by the copolymer thin film as the photocathode, a Pt plate as the counter-electrode, and a Pt wire as the pseudo-reference electrode. The photoelectrochemical responses of the films were obtained through on–off light illumination in a 0.5 M I/5 mM I3 aqueous solution using a 300 W Xe arc lamp. The I and I3 anions worked as redox mediators. A water filter was used to block IR radiation, and long pass filters at either λ > 405 nm or λ > 800 nm were employed to isolate visible-NIR or NIR radiation, respectively. Current–potential curves were recorded both in the dark and under illumination using a PARSTAT 2273 potentiostat with linear sweep voltammetry at a scan rate of 10 mV·s−1. EIS spectra were acquired under illumination by applying a sinusoidal potential modulation (10 mV over the Open Circuit Photopotential) across frequencies ranging from 0.1 to 100,000 Hz.
In photoelectrochemistry and voltametric measurements have been performed with a standard three-electrode system using a PARSTAT 2273 potentiostat. Glass carbon or single-side-coated indium-tin-oxide (ITO, SOLEMS, 25–35 Ω·cm−2) electrodes, with a surface of about 1 cm2 has been used as working electrode. A platinum wire has been used as an auxiliary electrode. The reference electrode was a saturated calomel electrode. It was electrically connected to the solution by a junction bridge filled with the electrolyte. Photoelectrochemical responses for films were obtained by on–off light illumination of a 300 W Xe Arc lamp (with λ > 405 nm long pass filter). Solutions were prepared by bubbling with argon (Ar–U, from Air Liquide) in order to have deaerated prior to illumination. All experiments were conducted at room temperature using a water filter to block IR radiation, ensuring that the solution temperature did not increase by more than 1 degree during light exposure. UV–vis absorption spectra were recorded using a Hewlett-Packard HP 8453 diode array spectrophotometer, which operated with a resolution of 2 nm.

4. Conclusions

In summary, copolymer films have been prepared by the electro-oxidation of 5,15-ditolylporphyrin (ZnT2P) in the presence of various types of di(phenylphosphane) ligands. Electrogenerated radical cation porphyrin is a powerful electrophile which can rapidly react to form copolymer containing stable isoporphyrin subunits (poly-ZnT2isoP). The achieved copolymers were characterized by UV–vis–NIR spectroscopy, and X-ray photoelectron spectroscopy. Mechanisms of electrochemical routes to these electroactive copolymers have been discussed as well as the description of the unusual redox properties of copolymers containing stable isoporphyrin.
The photocurrent measurements under visible–NIR light irradiation show that poly-ZnT2isoP2 thin films exhibit significantly better performance than poly-ZnT2isoP1. However, the photovoltaic performances reach an optimum depending on the number of electropolymerization potential scan number. The best performances for poly-ZnT2isoP1 and poly-ZnT2isoP2 are obtained for n = 20 and 10, respectively. Therefore, the control of the thickness of the copolymer films is of great importance to optimize the generation of photocurrent under visible illumination. The copolymer in the solid state could be stored for over several months and even one year without any degradation under ambient conditions in air.

Supplementary Materials

The following supporting information can be downloaded at: https://www.mdpi.com/article/10.3390/molecules29133056/s1, Scheme S1: The electropolymerization mechanism proposed to form the poly-ZnT2isoP1 with the zinc 5,15-ditolylporphyrin (ZnT2P) and cis-1,2-bis(diphenylphosphino)ethene. Scheme S2: The electropolymerization mechanism proposed to form the poly-ZnT2isoP2 with the zinc 5,15-ditolylporphyrin (ZnT2P) and 1,2-bis(diphenylphosphino)benzene. Scheme S3: Proposed reactivity after reduction of the diphosphonium reduction (peak I or I’) in the case of poly-ZnT2isoP1. Figure S1: (A) Electrochemical quartz crystal microbalance measurements (Δm) and consecutive cyclic voltammograms (first 25 scans) of poly-ZnT2isoP1 with 1,2-bis(diphenylphosphino)ethene ligand. (B) Mass change (Δm) of the first 25 scans calculated from Sauerbrey’s equation versus the number of scan n of poly-ZnT2isoP1. Figure S2: XPS spectra of the modified ITO electrodes with poly-ZnT2isoP1 obtained with cis-1,2-bis(diphenylphosphino)benzene after 25 iterative scans between −1.1 V and 1.0 V versus SCE. XPS full spectra (A), C 1s (B), N 1s (C), Zn 2p (D), P 2p (E), F 1s (F) O 1s (G). Figure S3: XPS spectra of the modified ITO electrodes with poly-ZnT2isoP2 obtained with 11,2-bis(diphenylphosphino)ethene after 25 iterative scans between −1.1 V and 1.0 V versus SCE. XPS full spectra (A), C 1s (B), N 1s (C), Zn 2p (D), P 2p (E), F 1s (F) O 1s (G). Figure S4: UV–vis spectra of A) poly-ZnT2isoP1 and B) poly-ZnT2isoP2 obtained after n iterative scans (n = 1, 2, 3, 5, 10, 15, 20 and 25) on ITO. C) Plot of the intensity of the absorbance of the Soret band (432 nm) versus the iterative scan number between −1.1 V and +1.00 V versus SCE. Figure S5: Cyclic voltammograms of poly-ZnT2isoP1 and poly-ZnT2isoP2 obtained after n = 10 scans using iterative scan between −1.1 V and +1.0 V in CH3CN/1,2-C2H4Cl2 (3/7) with 0.1 M TBAPF6. WE: ITO. S = 1 cm2. v = 0.1 V·s−1. Right: Pictures of poly-ZnT2isoP1 and poly-ZnT2isoP2 copolymer films deposited at 25 scans between −1.1 and 1.0 V on the ITO and after oxidization to an applied potential of 1.6 V on the ITO. Figure S6: Cyclic voltammograms of (A) poly-ZnT2isoP1 between −1.0 V and +1.0 V and (B) poly-ZnT2isoP2 after n = 1, 3, 5, 10, 15 and 20 scans between −1.1 V and +0.9 V in CH3CN/1,2-C2H4Cl2 (3/7) with 0.1 M NBu4PF6. WE: ITO. S = 1 cm2, v = 0.1 V·s−1. Irreversible peaks not labelled in anodic part correspond to the oxidation of the π-ring of the macrocycle. Figure S7: Photoelectrochemical response of poly-ZnT2isoP1 (black line) and of poly-ZnT2isoP2 (red line) obtained with n = 1, 2, 3, 5, 10, 15, 20 and 25 iterative scans. Figure S8: (A) Current–potential curves of poly-ZnT2isoP1 (obtained with n = 20 iterative scans between −1.0 V and +1.0 V vs. SCE) and poly-ZnT2isoP2 (obtained with n = 10 iterative scans between −1.1 V and +1.0 V vs. SCE) thin films on ITO electrodes in 0.5 M I/5 mM I3 aqueous solution in the dark or under visible illumination. (B) and (C) Photoelectrochemical response of poly-ZnT2isoP1 and poly-ZnT2isoP2 films obtained with n = 1, 2, 3, 5, 10, 15, 20 or 25 iterative scans. Measurements have been obtained under on–off light illumination from a 300 W Xe arc lamp (with λ > 385 nm long pass filter) in I3 5 mmol·L−1 and I 0.5 mol·L−1 aqueous solution. BIAS potential: 0.00 V vs. OCP. Figure S9: (A) ESI Nyquist of poly-ZnT2isoP1 and (B) poly-ZnT2isoP2. Measurements have been obtained in the dark and in H2O containing I3 5 mmol·L−1 and I 0.5 mol·L−1. BIAS potential: 0.00 V vs. OCP. Figure S10: Plot of the Log(R) versus n (number of iterative scan, v = 100 mVs−1) for (A) poly-ZnT2isoP1 and (B) poly-ZnT2isoP2. Measurements have been obtained in H2O under on (red line) and off light (black line) illumination from a 300W Xe arc lamp (with λ > 385 nm long pass filter) in containing I3 5 mmol·L−1 and I 0.5 mol·L−1. BIAS potential: 0.00 V vs. OCP. (Rct = charge transfer resistance at the ITO/copolymer interface (triangle plot with solid line), Rf = the charge transfer resistance of films (square plot with dotted line). Table S1: Mass change calculated from CV and Faraday’s law compared with the masse change measured from EQCM during CV measurements during electropolymerization for poly-ZnT2isoP1 and poly-ZnT2isoP2.

Author Contributions

Y.L., investigation and writing—review and editing. G.D. and M.G., AFM studies, writing—review and editing. S.C. and N.L.B., EPR studies and writing—review and editing. C.B., formal analysis and writing—review and editing. V.B., formal analysis and writing—review and editing. A.B., writing—review and editing. L.R., conceptualization, formal analysis, investigation, writing—review and editing and funding acquisition. All authors have read and agreed to the published version of the manuscript.

Funding

We thank the CNRS and the University of Strasbourg for continuous financial support. We also thank the FRC-Labex CSC and the Fondation Recherche Chimie. Financial support from the IR Infrananalytics FR2054 for conducting the research is gratefully acknowledged.

Institutional Review Board Statement

Not applicable.

Informed Consent Statement

Not applicable.

Data Availability Statement

Data are contained within the article and the Supplementary Materials.

Conflicts of Interest

The authors declare no conflict of interest.

References

  1. Evans, B.; Smith, K.M. Novel meso-substitution reactions of zinc (II) octaethylporphyrin. Tetrahedron Lett. 1977, 18, 3079–3082. [Google Scholar] [CrossRef]
  2. Smith, K.M.; Barnett, G.H.; Evans, B.; Martynenko, Z. Novel meso-substitution reactions of metalloporphyrins. J. Am. Chem. Soc. 1979, 101, 5953–5961. [Google Scholar] [CrossRef]
  3. Padilla, A.G.; Wu, S.-M.; Shine, H.J. Reaction of zinc tetraphenylporphyrin cation radical perchlorate with pyridine. J. Chem. Soc. Chem. Commun. 1976, 7, 236–237. [Google Scholar] [CrossRef]
  4. Shine, H.J.; Padilla, A.G.; Wu, S.-M. Ion radicals. 45. Reactions of zinc tetraphenylporphyrin cation radical perchlorate with nucleophiles. J. Org. Chem. 1979, 44, 4069–4075. [Google Scholar] [CrossRef]
  5. Malek, A.; Latos-Grazynski, L.; Bartczak, T.J.; Zadlo, A. Reactions of the iron(III) tetraphenylporphyrin.pi. cation radical with triphenylphosphine and the nitrite anion. Formation of β-substituted iron(III) porphyrins. Inorg. Chem. 1991, 30, 3222–3230. [Google Scholar] [CrossRef]
  6. Giraudeau, A.; El Kahef, L. β-Substitution de la méso-terraphénylporphyrine de zinc par voie électrochimique. Can. J. Chem. 1991, 69, 1161–1165. [Google Scholar] [CrossRef]
  7. Dimé, A.K.D.; Cattey, H.; Lucas, D.; Devillers, C.H. Electrosynthesis and X-ray crystallographic Structure of ZnII meso-triaryltriphenylphosphonium porphyrin and structural comparison with MgII meso-triphenylphosphonium porphine. Eur. J. Inorg. Chem. 2018, 2018, 4834–4841. [Google Scholar] [CrossRef]
  8. Ruhlmann, L.; Giraudeau, A. One-pot electrochemical generation of a porphyrin dimer with bis(diphenylphosphonium)acetylene bridge. Chem. Commun. 1996, 17, 2007–2008. [Google Scholar] [CrossRef]
  9. Ruhlmann, L.; Giraudeau, A. A first series of diphosphonium electrochemically bridged porphyrins. Eur. J. Inorg. Chem. 2001, 2001, 659–668. [Google Scholar] [CrossRef]
  10. Ruhlmann, L.; Gross, M.; Giraudeau, A. Bisporphyrins with bischlorin features obtained by direct anodic coupling of porphyrins, Chem. Eur. J. 2003, 9, 5085–5096. [Google Scholar] [CrossRef]
  11. Holmes-Smith, A.S.; Zheng, X.; Uttamlal, M. Characterization of an electropolymerized Pt(II) diamino phenyl porphyrin polymer suitable for oxygen sensing. Meas. Sci. Technol. 2006, 17, 3328–3334. [Google Scholar] [CrossRef]
  12. Walter, M.G.; Wamser, C.C. Synthesis and Characterization of Electropolymerized Nanostructured Aminophenylporphyrin Films. J. Phys. Chem. C 2010, 114, 7563–7574. [Google Scholar] [CrossRef]
  13. Arce, R.; del Río, R.; Ruiz-León, D.; Velez, J.; Isaacs, M.; del Valle, M.A.; Aguirre, M.J. Evidence for the Formation of a Copolymer by Simultaneous Electropolymerization of p-Tetraaminophenyl Porphyrin Cobalt (II)) and o-Phenylenediamine on Glassy Carbon. Int. J. Electrochem. Sci. 2012, 7, 11596–11608. [Google Scholar] [CrossRef]
  14. Pérez-Morales, M.; de Miguel, G.; Muñoz, E.; Martín-Romero, M.T.; Camacho, L. Reversible binding of molecular dioxygen to CoTSPP electrodeposited films from aqueous basic media. Electrochem. Commun. 2006, 8, 638–642. [Google Scholar] [CrossRef]
  15. Trevin, S.; Bedioui, F.; Devynck, J. New electropolymerized nickel porphyrin films. Application to the detection of nitric oxide in aqueous solution. J. Electroanal. Chem. 1996, 408, 261–265. [Google Scholar] [CrossRef]
  16. Boudiaf, M.; Liang, Y.; Lamare, R.; Weiss, J.; Bonnefont, A.; Ruhlmann, L. Stable isoporphyrin copolymer: Electrochemical mechanism and behavior and photovoltaic properties. Electrochim. Acta 2019, 309, 432–449. [Google Scholar] [CrossRef]
  17. Liang, Y.; Sokolov, M.N.; Mikhaylov, M.A.; Ibrahim, H.; Goldmann, M.; Choua, S.; Le Breton, N.; Boudon, C.; Badets, V.; Bonnefont, A.; et al. A 3D electropolymerized thin film based on an isoporphyrin and on a pyridine end-decorated molybdenum(II) halide cluster: Photoelectrochemical and impedance properties. Electrochim. Acta 2021, 388, 138493. [Google Scholar] [CrossRef]
  18. Inisan, C.; Saillard, J.-Y.; Guilard, R.; Tabard, A.; Mest, Y. Electrooxidation of porphyrin free bases: Fate of the π-cation radical. New J. Chem. 1998, 22, 823–830. [Google Scholar] [CrossRef]
  19. Zheng, W.; Shan, N.; Yu, L.; Wang, X. UV–visible, fluorescence and EPR properties of porphyrins and metalloporphyrins. Dye. Pigment. 2008, 77, 153–157. [Google Scholar] [CrossRef]
  20. Lan, M.; Zhao, H.; Yuan, H.; Jiang, C.; Zuo, S.; Jiang, Y. Absorption and EPR spectra of some porphyrins and metalloporphyrins. Dye. Pigment. 2007, 74, 357–362. [Google Scholar] [CrossRef]
  21. Fajer, J. Structural effects in chemistry and biology. J. Porphyr. Phthalocyanines 2000, 4, 382–390. [Google Scholar] [CrossRef]
  22. Shelnutt, J.A.; Song, X.; Ma, J.G.; Jia, S.L.; Jentzen, W.; Medforth, C.J. Nonplanar porphyrins and their significance in proteins. Chem. Soc. Rev. 1998, 27, 31–42. [Google Scholar] [CrossRef]
  23. Barkigia, K.M.; Berber, M.D.; Fajer, J.; Medforth, C.J.; Renner, M.W.; Smith, K.M. Nonplanar porphyrins. X-ray structures of (2,3,7,8,12,13,17,18-octaethyl- and -octamethyl-5,10,15,20-tetraphenylporphinato) zinc(II). J. Am. Chem. Soc. 1990, 112, 8851–8857. [Google Scholar] [CrossRef]
  24. Sparks, L.D.; Medforth, C.J.; Park, M.S.; Chamberlain, J.R.; Ondrias, M.R.; Senge, M.O.; Smith, K.M.; Shelnutt, J.A. Metal dependence of the nonplanar distortion of octaalkyltetraphenylporphyrins. J. Am. Chem. Soc. 1993, 115, 581–592. [Google Scholar] [CrossRef]
  25. Senge, M.O.; Renner, M.W.; Kalisch, W.W.; Fajer, J. Molecular structure of (5,10,15,20-tetrabutyl-2,3,7,8,12,13,17,18-octaethylporphyrinato)nickel(II)d correlation of nonplanarity with frontier orbital shifts. J. Chem. Soc. Dalton Trans. 2000, 3, 381–385. [Google Scholar] [CrossRef]
  26. D’Souza, F.; Zandler, M.E.; Tagliatesta, P.; Ou, Z.; Shao, J.; Van Caemelbecke, C.E.; Kadish, K.M. Electronic, spectral, and electrochemical properties of (TPPBrx)Zn where TPPBrx is the dianion of b-brominated-pyrrole tetraphenylporphyrin and x varies from 0 to 8. Inorg. Chem. 1998, 37, 4567–4572. [Google Scholar] [CrossRef] [PubMed]
  27. Anderson, M.E.; Barrett, A.G.M.; Hoffman, B.M. Super-charged Porphyrazines: Synthesis and physical properties of octacationic tetraazaporphyrins. Inorg. Chem. 1999, 38, 6143–6151. [Google Scholar] [CrossRef] [PubMed]
  28. Bernard, C.; Gisselbrecht, J.-P.; Gross, M.; Vogel, E.; Lausmann, M. Redox properties of porphycenes and metalloporphycenes. A comparison with porphyrins. Inorg. Chem. 1994, 33, 2393–2401. [Google Scholar] [CrossRef]
  29. Kasha, M. Relation between exciton bands and conduction bands in molecular lamellar systems. Rev. Mod. Phys. 1959, 31, 162–169. [Google Scholar] [CrossRef]
  30. Sessler, J.L.; Johnson, M.R.; Creager, S.E.; Fettinger, J.C.; Ibers, J.A. Synthesis and characterization of quinone-substituted octaalkyl porphyrin monomers and dimers. J. Am. Chem. Soc. 1990, 112, 9310–9329. [Google Scholar] [CrossRef]
  31. Abhilash, G.J.; Bhuyan, J.; Singh, P.; Maji, S.; Pal, K.; Sarkar, S. NO2-Mediated meso-hydroxylation of iron(III) porphyrin. Inorg. Chem. 2009, 48, 1790–1792. [Google Scholar] [CrossRef] [PubMed]
Scheme 1. Representation of the zinc-tetraphenylporphyrin (ZnTPP), zinc-meso-5,15-ditolyl-porphyrin (ZnT2P), cis-1,2-bis(diphenylphosphino)ethene (1), and 1,2-bis(diphenylphosphino)benzene (2).
Molecules 29 03056 sch001
Scheme 2. Representation of electropolymerization reaction from zinc-meso-5,15-ditolyl-porphyrin (ZnT2P), cis-1,2-bis-(diphenyl-phosphino)ethene (1), and 1,2-bis-(diphenylphosphino)-benzene (2).
Molecules 29 03056 sch002
Figure 1. (A) Cyclic voltammograms recorded of cis-1,2-bis(diphenylphosphino)ethene and 1,2-bis(diphenylphosphino)benzene in CH3CN/1,2-C2H4Cl2 (3/7) with 0.1 mmol·L−1 NBu4PF6, v = 0.1 V·s−1. Cyclic voltammograms recorded during 25 iterative scans conducted between −1.1 V and +1.0 V vs. SCE in the presence of ZnT2P (0.25 mmol·L−1) with (B) cis-1,2-bis(diphenylphosphino)ethene (0.25 mmol·L−1) and (C) 1,2-bis(diphenylphosphino)benzene (0.25 mmol·L−1) in a 1,2-C2H4Cl2/CH3CN (7/3) solution with NBu4PF6 (0.1 mol·L−1). WE: ITO. S = 1 cm2. v = 0.1 V·s−1. Blue curve: first scan (n = 1). Red curve: final scan (n = 25).
Molecules 29 03056 g001
Figure 2. (A) Electrochemical quartz crystal microbalance measurements (Δm) and consecutive cyclic voltammograms (first 25 scans) of poly-ZnT2isoP2 and 1,2-bis(diphenylphosphino)benzene ligand. (B) Mass change (Δm) of the first 25 scans calculated from Sauerbrey’s equation versus the number of scan n of poly-ZnT2isoP2. (C) Proposed redox reactivity of poly-ZnT2isoP2. (D) Figure of poly-ZnT2isoP2 copolymer films deposited at 25 scans between −1.0 V and 1.0 V (v = 100 mV·s−1) on the ITO and after oxidized to 1.6 V on the ITO.
Molecules 29 03056 g002
Figure 3. (A) Repeat unit are (isoZnT2P-+PPh2-HC=CH-PPh2+·2PF6) and (isoZnT2P-+PPh2-Ph-PPh2+·2PF6) for poly-ZnT2isoP1 and poly-ZnT2isoP2, respectively. (B) The mass change calculated from Faraday’s law (Δmcalc = MQ/(nFA), where M is the molecular mass of the repeat unit, Q is the anodic charge measured from CV, n the number of electrons exchanged, 3 electrons and is the surface of the electrode) and compared with ΔmEQCM measured from EQCM data vs. the iterative scan numbers n (n = 3, 5, 10 and 20).
Molecules 29 03056 g003
Figure 4. XPS spectra of the modified ITO electrodes with poly-ZnT2isoP2 obtained after 25 iterative scans between −1.1 V and 1.0 V versus SCE. XPS spectra (A), P 2p (B), C 1s (C), N 1s (D).
Molecules 29 03056 g004
Figure 5. X-Band EPR spectrum in DMF of poly-ZnT2isoP1 and poly-ZnT2isoP2 at room temperature. The solution of copolymer was prepared by washing with 160 mL of DMF the covered ITO obtained using 25 scans between 1.1 V and +1.0 V versus SCE and -, v = 100 mV·s−1. In order to have enough solution, the operation was repeated three times.
Molecules 29 03056 g005
Figure 6. (A) UV–vis–NIR spectra of poly-ZnT2isoP1 and of poly-ZnT2isoP2. (B) Cyclic voltammograms recorded for poly-ZnT2isoP1 and poly-ZnT2isoP2. (C) Photoelectrochemical response. (D) ESI Nyquist of poly-ZnT2isoP1 after 20 iterative scans and of poly-ZnT2isoP2 for the film obtained after 10 iterative scans.
Molecules 29 03056 g006
Figure 7. Tapping mode AFM topography of (A,C) of poly-ZnT2isoP1 and poly-ZnT2isoP2, respectively. (B,D) Section analysis of the coils marked by a white line of poly-ZnT2isoP1 and poly-ZnT2isoP2, respectively.
Molecules 29 03056 g007
Figure 8. (A) The structures of poly-ZnT2isoP1 and poly-ZnT2isoP2. (B,C) Schematic illustrations of the energy level diagram for poly-ZnT2isoP1 showing electron transfer processes in H2O containing I3 5 mmol·L−1 and I 0.5 mol·L−1 (-(Ph)2P+- = di(phenylphosphonium); Porp = porphyrin).
Molecules 29 03056 g008
Table 1. UV–visible spectral data for ZnT2P, cis-1,2-bis(diphenylphosphino)ethene and 1,2-bis(diphenylphosphino)benzene in 1,2-CH2Cl2, poly-ZnT2isoP1, poly-ZnT2isoP2 on optical transparent ITO electrodes. Under bracket: molar extinction coefficient (ε/103 L·M·cm−1).
CompoundSoret Band/nmQ and NIR Bands/nmπ–π* Band/nm
ZnT2P 1415 (405.4)546 (18.9),
584 (4.9)
cis-1,2-bis(diphenyl-phosphino)ethene 1 214 (44.9), 257 (19.7)
1,2-bis(diphenyl-phosphino)benzene 2 214 (58.7), 278 (17.9)
poly-ZnT2isoP1 3432, 505587, 633, 810
poly-ZnT2isoP2 4432, 497 574, 632, 805
1 Due to the steric hindrance of cis-1,2-bis(diphenylphosphino)ethene (1) or 1,2-bis(diphenylphosphino)benzene (2), coordination between the diphosphine ligand and the Zn is not observed giving a similar optical spectrum with and without diphosphine 1 or 2 with ZnT2P; 2 in CH2Cl2; 3 Copolymers obtained by iterative scan between −1.1 V and +1.0 V vs. SCE onto ITO; 4 Copolymers obtained by iterative scan between −1.1 V and +1.0 V vs. SCE onto ITO.
Table 2. Electrochemical data for ZnT2P, cis-1,2-bis(diphenylphosphino)ethene) and 1,2-bis(diphenylphosphino)benzene, poly-ZnT2isoP1 and poly-ZnT2isoP2.
CompoundsRing Oxidation Reduction of the
-P+(Ph)2-
Ring ReductionOxidation of Phosphane -P+●(Ph)2−/
-P(Ph2)-
peak
a or a’
peak
I or I’
ZnT2P 1 1.08
(150)
0.79
(90)
−1.41
(160)
−1.84
(170)
cis-1,2-bis(diphenyl
phosphino)ethene)
1.37 irr
1,2-bis(diphenyl
phosphino)benzene
1.68 irr
poly-ZnT2isoP11.39 irr1.15 irr+0.86
(250)
+0.42 irr−0.91 irr
poly-ZnT2isoP21.40 irr1.17 irr+0.88
(196)
+0.38 irr−0.87 irr
1 Potentials in V vs. SCE were obtained from cyclic voltammetry in 1,2-C2H4Cl2 with 0.1 mol·L−1 TBAPF6. Scan rate = 100 mV·s−1. Working electrode: ITO, S = 1 cm2. The given half-wave potentials are equal to E1/2 = (Epa+ Epc)/2. Under bracket: △Ep = |Epa-Epc|. Please note that the potential oxidation of the porphyrin did not change in the presence of cis-1,2-bis(diphenylphosphino)ethene (1) or 1,2-bis(diphenylphosphino)benzene (2). irr = irreversible.
Disclaimer/Publisher’s Note: The statements, opinions and data contained in all publications are solely those of the individual author(s) and contributor(s) and not of MDPI and/or the editor(s). MDPI and/or the editor(s) disclaim responsibility for any injury to people or property resulting from any ideas, methods, instructions or products referred to in the content.

