Abstract
Activated carbon has an excellent porous structure and is considered a promising adsorbent and electrode material. In this study, activated carbon fibers (ACFs) with abundant microporous structures, derived from natural cotton fibers, were successfully synthesized at a certain temperature in an Ar atmosphere and then activated with KOH. The obtained ACFs were characterized by field emission scanning electron microscopy (FESEM), transmission electron microscopy (TEM), elemental analysis, nitrogen and carbon dioxide adsorption–desorption analysis, X-ray diffraction (XRD), X-ray photoelectron spectroscopy (XPS) and N2 adsorption–desorption measurement. The obtained ACFs showed high porous qualities and had a surface area from 673 to 1597 m2/g and a pore volume from 0.33 to 0.79 cm3/g. The CO2 capture capacities of prepared ACFs were measured and the maximum capture capacity for CO2 up to 6.9 mmol/g or 4.6 mmol/g could be achieved at 0 °C or 25 °C and 1 standard atmospheric pressure (1 atm). Furthermore, the electrochemical capacitive properties of as-prepared ACFs in KOH aqueous electrolyte were also studied. It is important to note that the pore volume of the pores below 0.90 nm plays key roles to determine both the CO2 capture ability and the electrochemical capacitance. This study provides guidance for designing porous carbon materials with high CO2 capture capacity or excellent capacitance performance.
1. Introduction
Porous carbons have received attention due to their large surface area, abundant porosity, thermal and chemical stability, and high conductivity and other advantages. They have shown great application prospects in adsorption and separation [1,2,3], energy storage and conversion [4,5], catalysis, and other fields [6]. Among them, ACF samples are one of the most important types, with faster adsorption kinetics than particle types [7].
Biochar is usually produced by carbonizing the original biomass material and then activating it, which has been a recent research hotspot. So far, various biomass-derived activated carbons, macadamia nut shell [8], cow dung [9], pine nut shells [10], macadamia nut shell-based carbon [11], and so on, have been reported [12,13,14,15,16,17,18,19,20,21,22,23,24,25]. These activated carbons have shown promising applications as solid CO2 adsorbents [8,9,10,11,12,13,14,15,16,17,18,19,20,21,22,23,24,25,26,27] and electrode materials for supercapacitors [28,29,30,31,32,33,34,35,36,37,38,39].
In terms of structural adjustment and optimization of porous carbon materials, it is even more necessary to explore their underlying mechanisms in order to conduct research at a more microscopic level. In addition, with energy shortages and environmental pollution, it is necessary to develop simple, clean, and inexpensive porous carbon materials. This will help address energy and environmental crises and have significant impacts in a wider range of areas.
Everyone knows that the CO2 capture capacity of porous carbon is mainly determined by its porous structure. For example, some reports showed that the narrow micropores have a great contribution to the CO2 capture capability [40,41]. Thus, more and more studies devote to improve the CO2 capture ability by adjusting the porous structure of activated carbons [8,9,10,11,12,42].
In addition, developing clean energy as fossil fuels is an effective way to reduce carbon dioxide emissions [43]. At present, supercapacitors are an efficient energy storage device with advantages such as high power density, long cycle life, and environmental friendliness [5,44]. Electric double-layer supercapacitors (EDLCs) generate a layer at the electrode-electrolyte interface by generating dual charges. Therefore, their electrochemical performance is closely related to the pore structure. Therefore, porous carbon has shown great potential in the preparation of supercapacitors due to its multifunctional and adjustable pore structure [5,44,45].
Natural cotton fiber (CF) is a natural renewable agricultural resource and it has been widely used for many fields. CF consists of cellulose which is a natural polymer composed of many sugar glucose molecules. CF is also among the longest fiber types known in the plant kingdom. Each CF is basically a hollow tube a few centimeters in length. Although Xing et al. used a one-step activation method to prepare porous carbon derived from cotton fibers, the one-step method had a strong destructive effect on the fibers, making it difficult for the generated porous carbon material to maintain its fibrous shape [46]. Muhammad et al. prepared spider silk-derived ACFs for high-pressure CO2 capture [26]. We also used silk fibers as raw materials to prepare nitrogen-doped ACFs for CO2 capture [27].
In this study, CF was used as a crude material to prepare high-performance ACF by simple carbonization in an Ar atmosphere and then activated with KOH. The long hollow CF provided an important morphological foundation for the excellent CO2 capture capacity and high specific capacitance. The CO2 adsorption and electrochemical performance of the obtained ACFs were measured. It was found that the CO2 adsorption performance and electrochemical performance of the ACF material was relatively superior. We also characterized the structure of the ACF material in detail, and the effects of the porosity characteristics (pore volume) of the ACF material on the CO2 capture capacity and the specific capacitance were also systematically explored.
2. Results and Discussion
2.1. Sample Structure
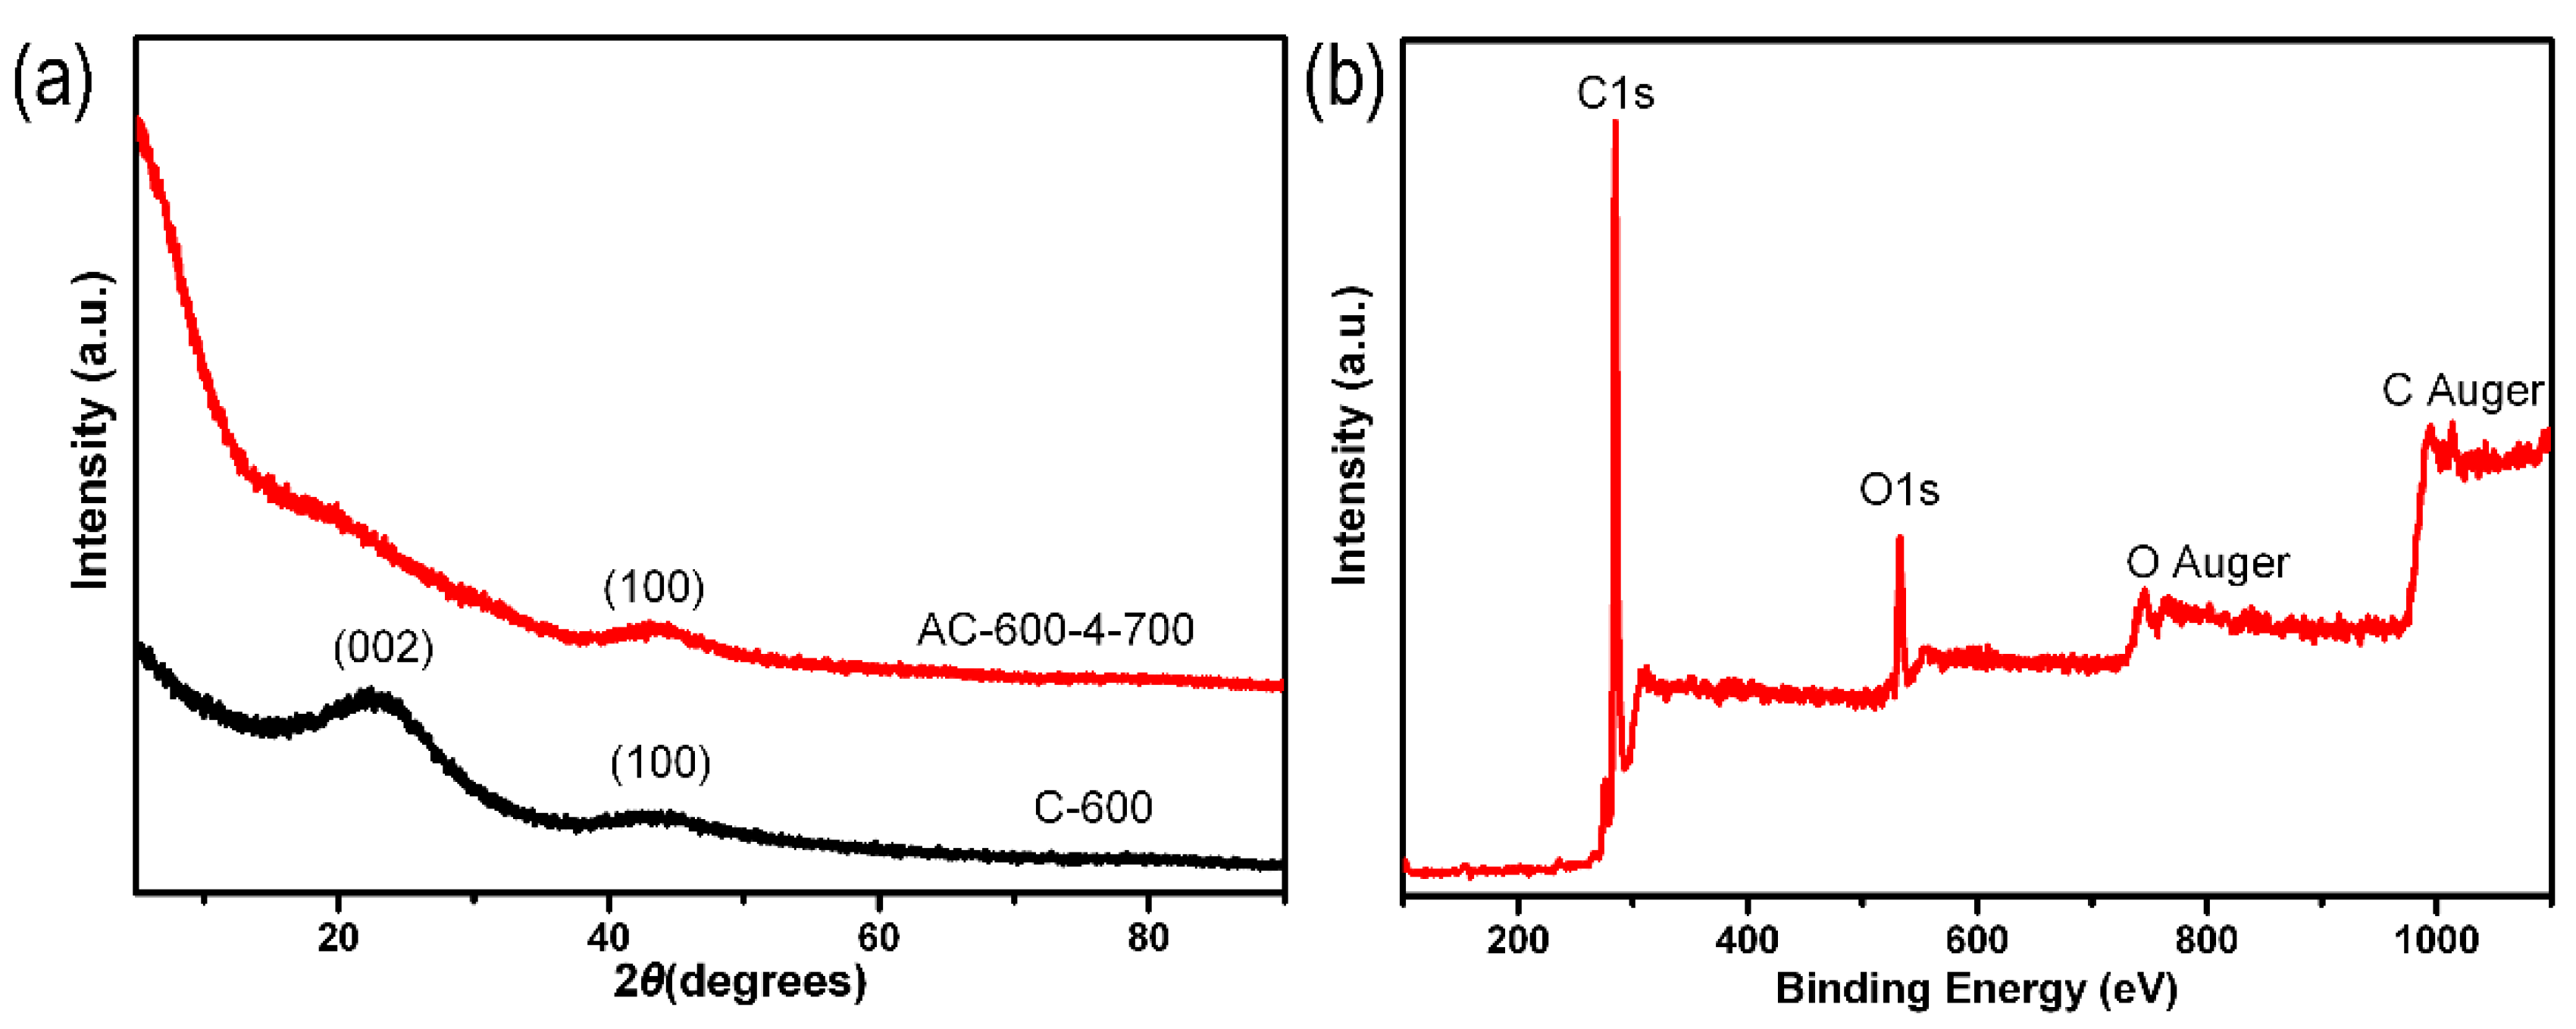
A series of ACF samples were prepared by adjusting the carbonization temperature, weight ratio of KOH and C-x, and activation temperature. Figure 1a showed the XRD measurement characteristics of C-600 and AC-600-4-700. In Figure 1a, there were two diffraction peaks of the C-600 sample displayed at 23° and 43°, related to the (002) and (100) planes of amorphous graphite-like carbon. The intensity of the original (002) peak significantly decreased and almost disappeared, but the 100 peak still existed after activation (AC-600-4-700). The high diffraction intensity of AC-600-4-700 samples at low angle scattering indicated the presence of a large number of pores [47,48]. Using XPS measurement, 12.48 wt% O and 87.52 wt% C were detected in the AC-600-4-700 sample (Figure 1b).

Figure 1.
(a) XRD patterns of the C-600 and AC-600-4-700 samples. (b) XPS full-spectrum of the AC-600-4-700 sample.
Figure 2 shows SEM images and digital photographs of the surface morphology of CF, C-600, and AC-600-4-700 derived from cotton fibers (inserted). The C-600 slightly shrank in size and shape after the carbonization (Figure 2a,b). Furthermore, KOH activation transformation led to local curvature and many defects generated on the surface of C-600 fibers, giving rise to micropores, which resulted in the cotton carbon fibers cracking into pieces, as shown in Figure 2c. The TEM image of AC-600-4-700 (Figure 2d) evidenced that the porosity was made up of randomly oriented uniform micropores.
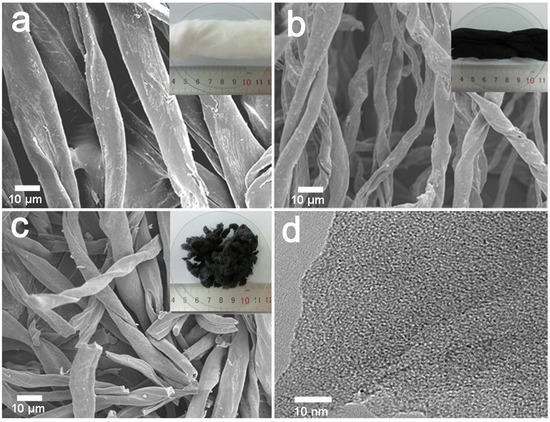
Figure 2.
SEM images and the digital photograph (insert) of the materials derived from CFs: (a) natural CFs, (b) C-600, (c) AC-600-4-700, (d) TEM image of the AC-600-4-700 sample.
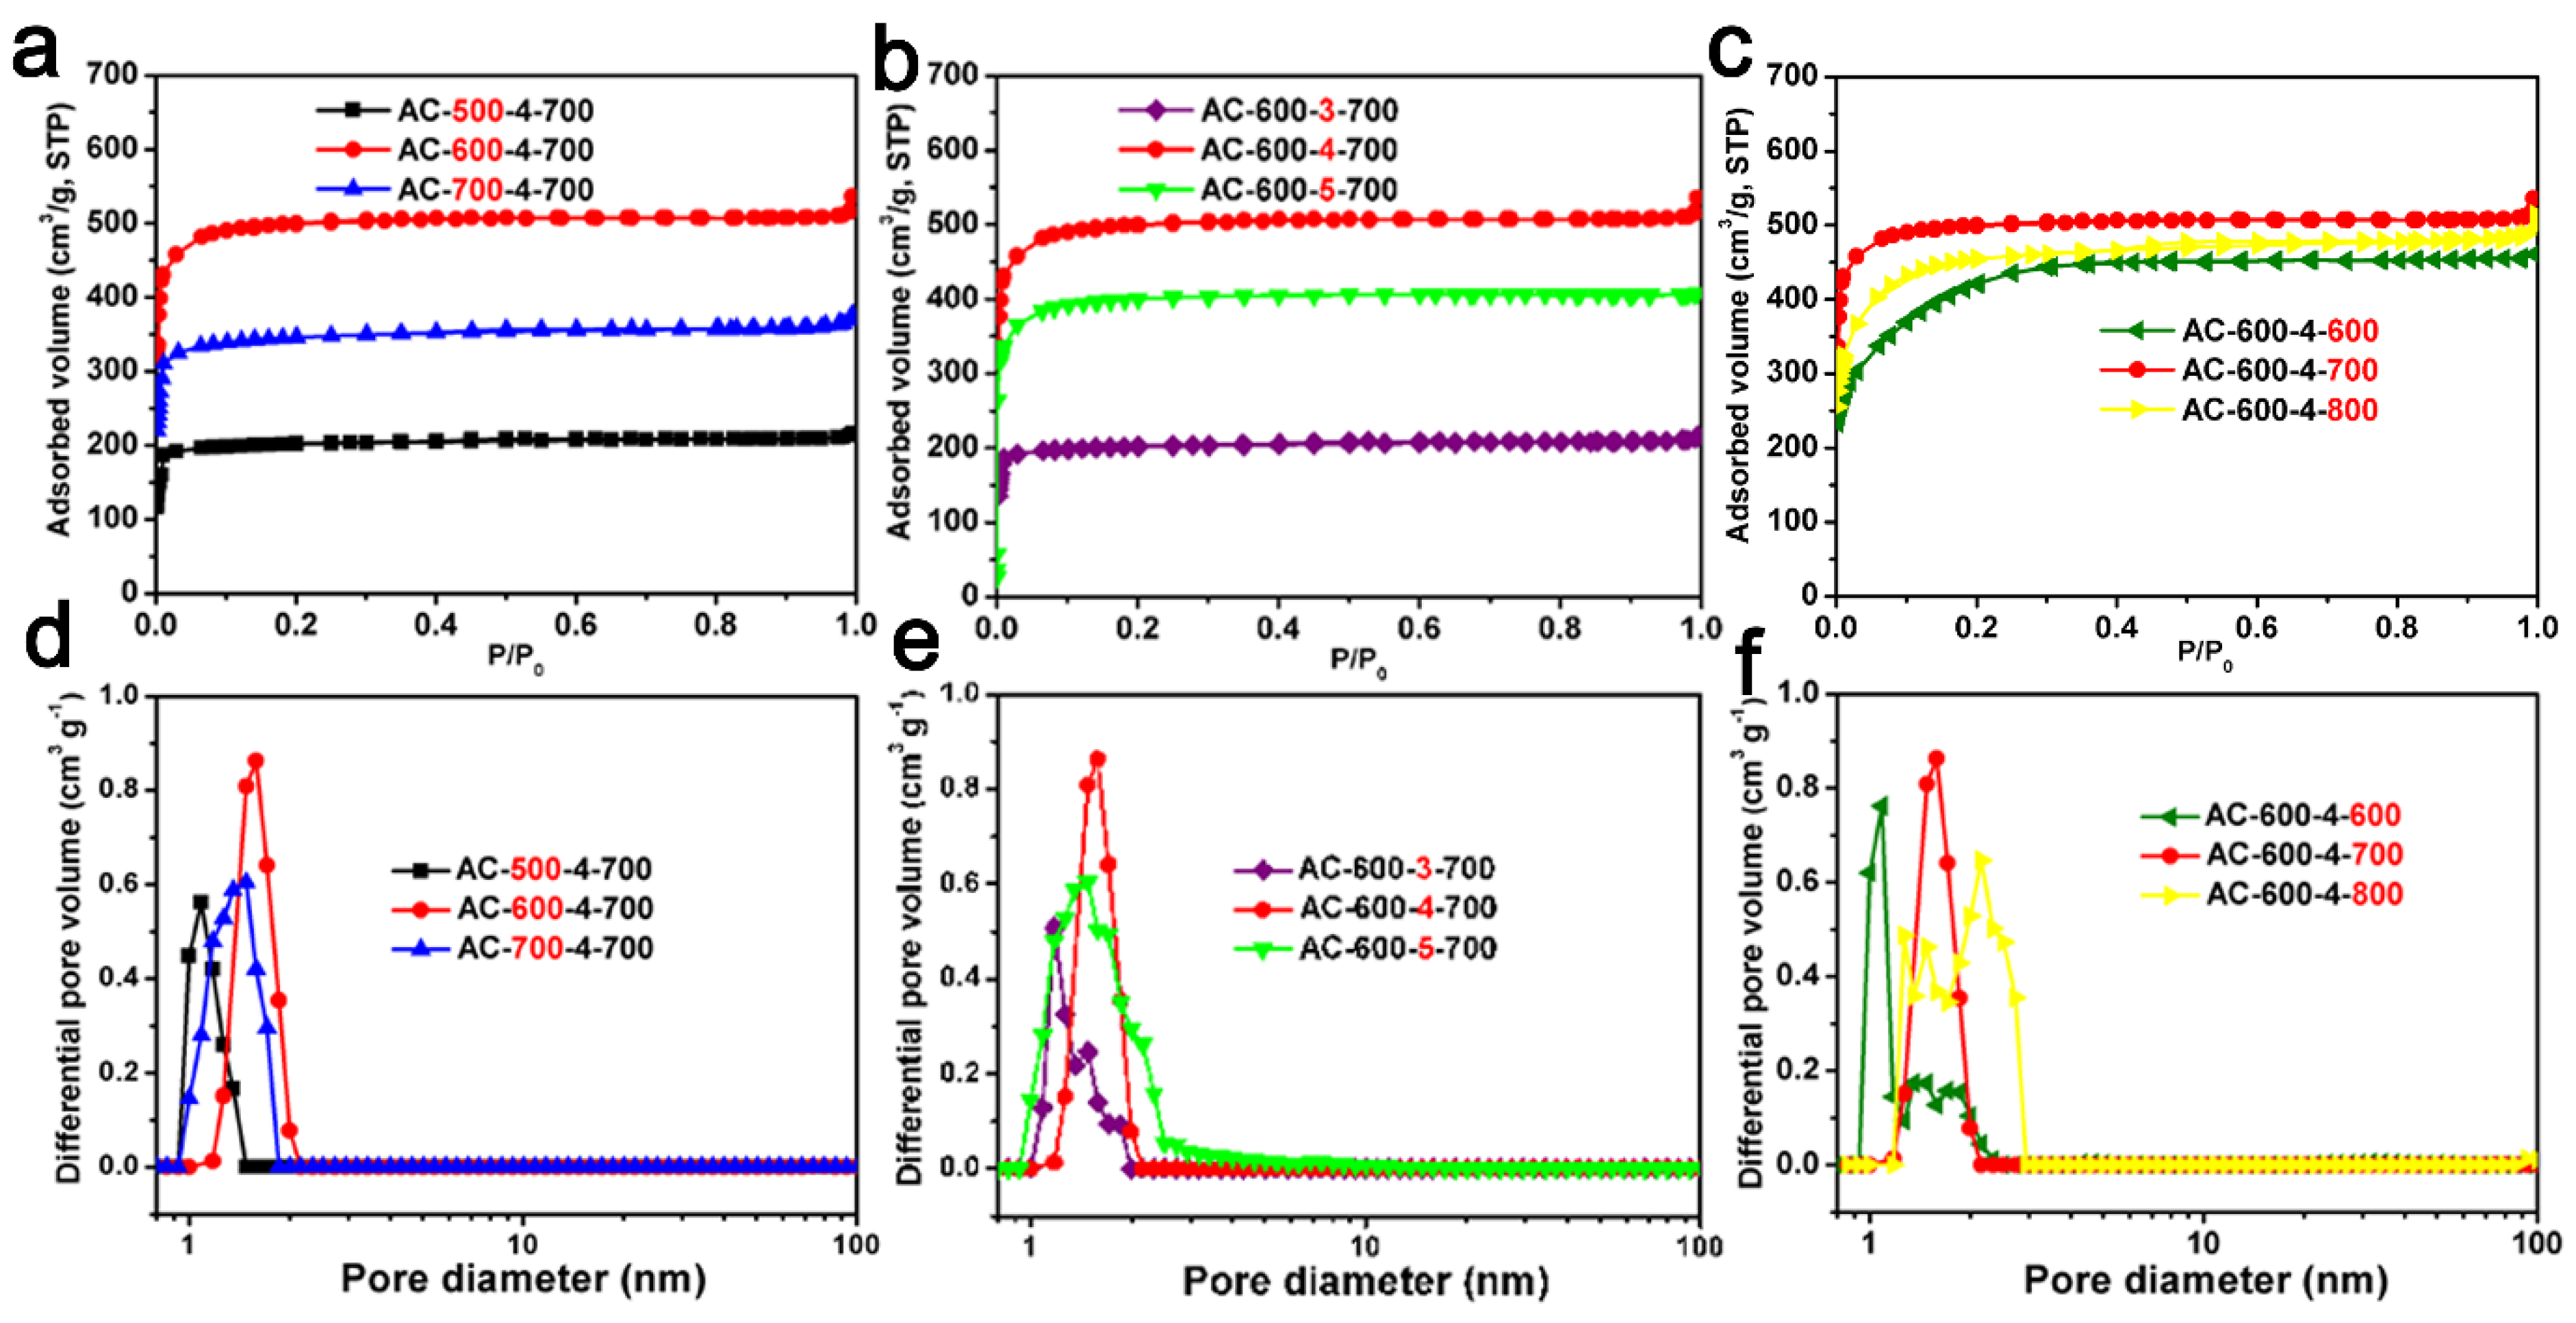
The N2 adsorption–desorption isotherms and corresponding pore size distribution of the ACF samples are shown in Figure 3. The Type IV isotherms of AC-500-4-700 and AC-600-4-800 were related to capillary condensation occurring in the mesopores and exhibit significant hysteresis loops, according to the IUPAC classification. The Type I isotherms of the remaining samples were obtained [49,50]. For most samples, the main N2 adsorption occurred at less than 0.1 P/P0. At higher P/P0 values, a relatively horizontal adsorption platform appeared, indicating that ACF samples prepared through carbonization and KOH activation were highly microporous, consistent with the TEM images [51].

Figure 3.
The N2 adsorption and desorption curves of ACF samples: (a) AC-x-4-700 (x = 500, 600 and 700); (b) AC-600-y-700 (y = 3, 4 and 5); (c) AC-600-4-z (z = 600, 700 and 800). The corresponding NLDFT pore size distribution of ACFs: (d) AC-x-4-700 (x = 500, 600 and 700); (e) AC-600-y-700 (y = 3, 4 and 5); (f) AC-600-4-z (z = 600, 700 and 800).
As indicated in Table 1, these ACF samples have an SSA from 673 to 1597 m2/g, and a pore volume from 0.33 to 0.79 cm3/g. From Table 1, It can be seen that even under the same activation conditions (activated with KOH chemical etching agent at 700 °C for one hour), the SSA and pore volume of AC-x-4-700 (x = 500, 600, 700) samples are different and related to the carbonization temperature. In the Table 1, it can be seen that AC-600-4-700 had the highest SSA and pore volume among AC-600-y-700 (y = 3, 4, 5) materials, and it can also be seen that the AC-600-4-z (z = 600, 700, 800) materials exhibited relatively high surface areas and pore volumes compared to other series. The PSD curves of ACF samples are shown in Figure 3d–f. The curves show that the ACF samples were almost composed of micropores (<2 nm). The pore structure of biomass-derived ACFs is closely related to their own structure, for example, spider fiber carbon fibers and silk fibers have a relatively large SSA and pore volume (spider silk-derived ACF: 2730 m2/g and 1.56 cm3/g; silk fiber-derived ACF: 3000 m2/g and 1.38 cm3/g) [26,27]. However, relatively speaking, cotton fiber is cheaper and easier to obtain.

Table 1.
Textural properties of ACF samples derived from CFs.
2.2. CO2 Capture Capacity
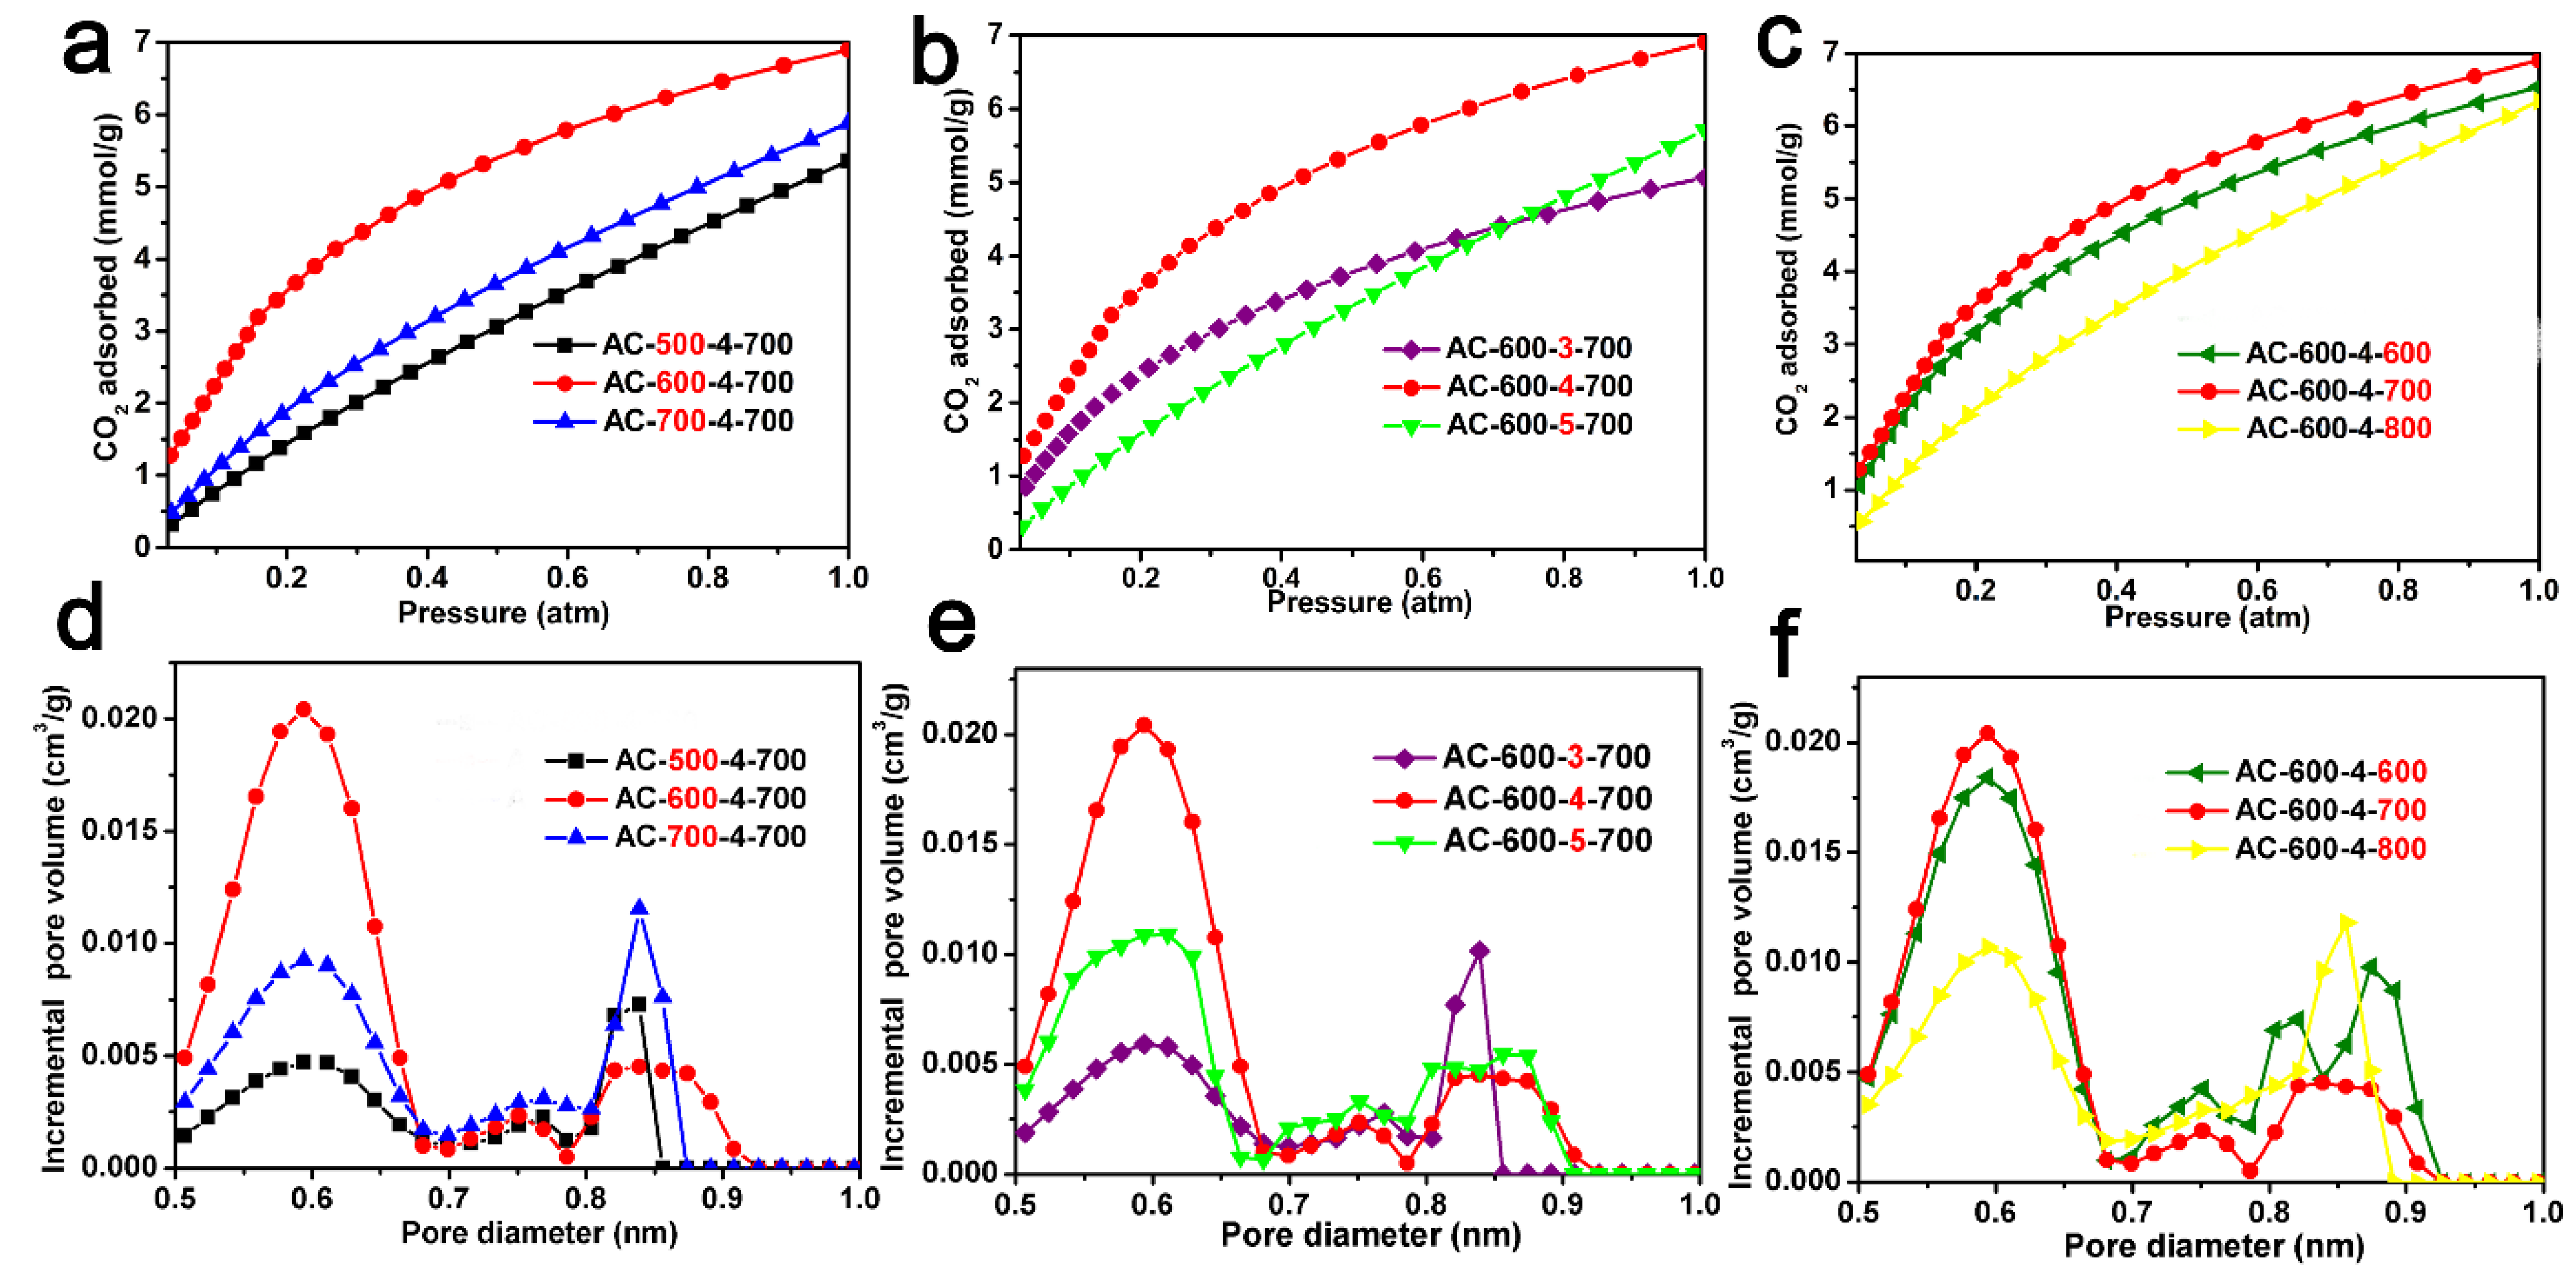
The CO2 adsorption isotherms (0 °C, 1.0 atm) and the pore size distribution of the ACF samples derived from CO2 adsorption data using the NLDFT model are shown in Figure 4, respectively. Table 1 also lists the CO2 absorption of the ACF samples (0 °C and 25 °C, 1.0 atm) and the pore characteristics calculated based on the CO2 adsorption isotherms. Figure 4a shows the CO2 adsorption isotherms of AC-x-4-700 (x = 500, 600, and 700), with a CO2 adsorption capacity ranging from 4.3 to 6.9 mmol/g. Figure 4b shows the CO2 absorption isotherms of AC-600-x-700 (x = 3, 4, and 5). These ACF samples exhibit high CO2 absorption in the range of 4.9–6.9 mmol/g. Figure 4c shows the CO2 adsorption isotherms of AC-600-4-z (z = 600, 700, and 800). AC-600-4-z materials had large CO2 uptakes in the range of 6.3–6.9 mmol/g. It is worth mentioning that AC-600-4-700 exhibited a significant optimal CO2 absorption of 6.9 mmol/g. This value is comparable to most other biomass-derived activated carbons (Table 2) [8,9,10,11,12,13,14,15,16,17,18,19,20,21,22,23,24,25,27]. In Figure 4d–f, the PSD of the ACF samples derived from CO2 adsorption data below 1.0 nm are displayed, indicating the presence of abundant micropores in the ACF materials.
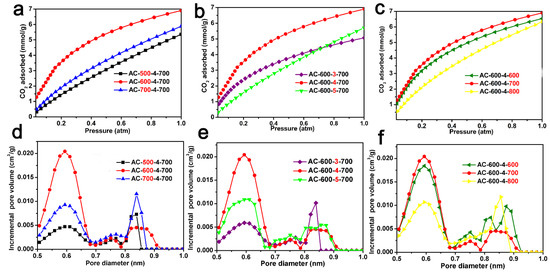
Figure 4.
CO2 adsorption curves of ACF samples: (a) AC-x-4-700 (x = 500, 600 and 700); (b) AC-600-y-700 (y = 3, 4 and 5); (c) AC-600-4-z (z = 600, 700 and 800). The pore size distribution for ACFs derived from CO2 adsorption using the NLDFT model: (d) AC-x-4-700 (x = 500, 600 and 700); (e) AC-600-y-700 (y = 3, 4 and 5); (f) AC-600-4-z (z = 600, 700 and 800).
Table 2.
CO2 uptakes (at 0 °C and 1 atm) of other biomass-derived activated carbons in comparison with our ACFs a.
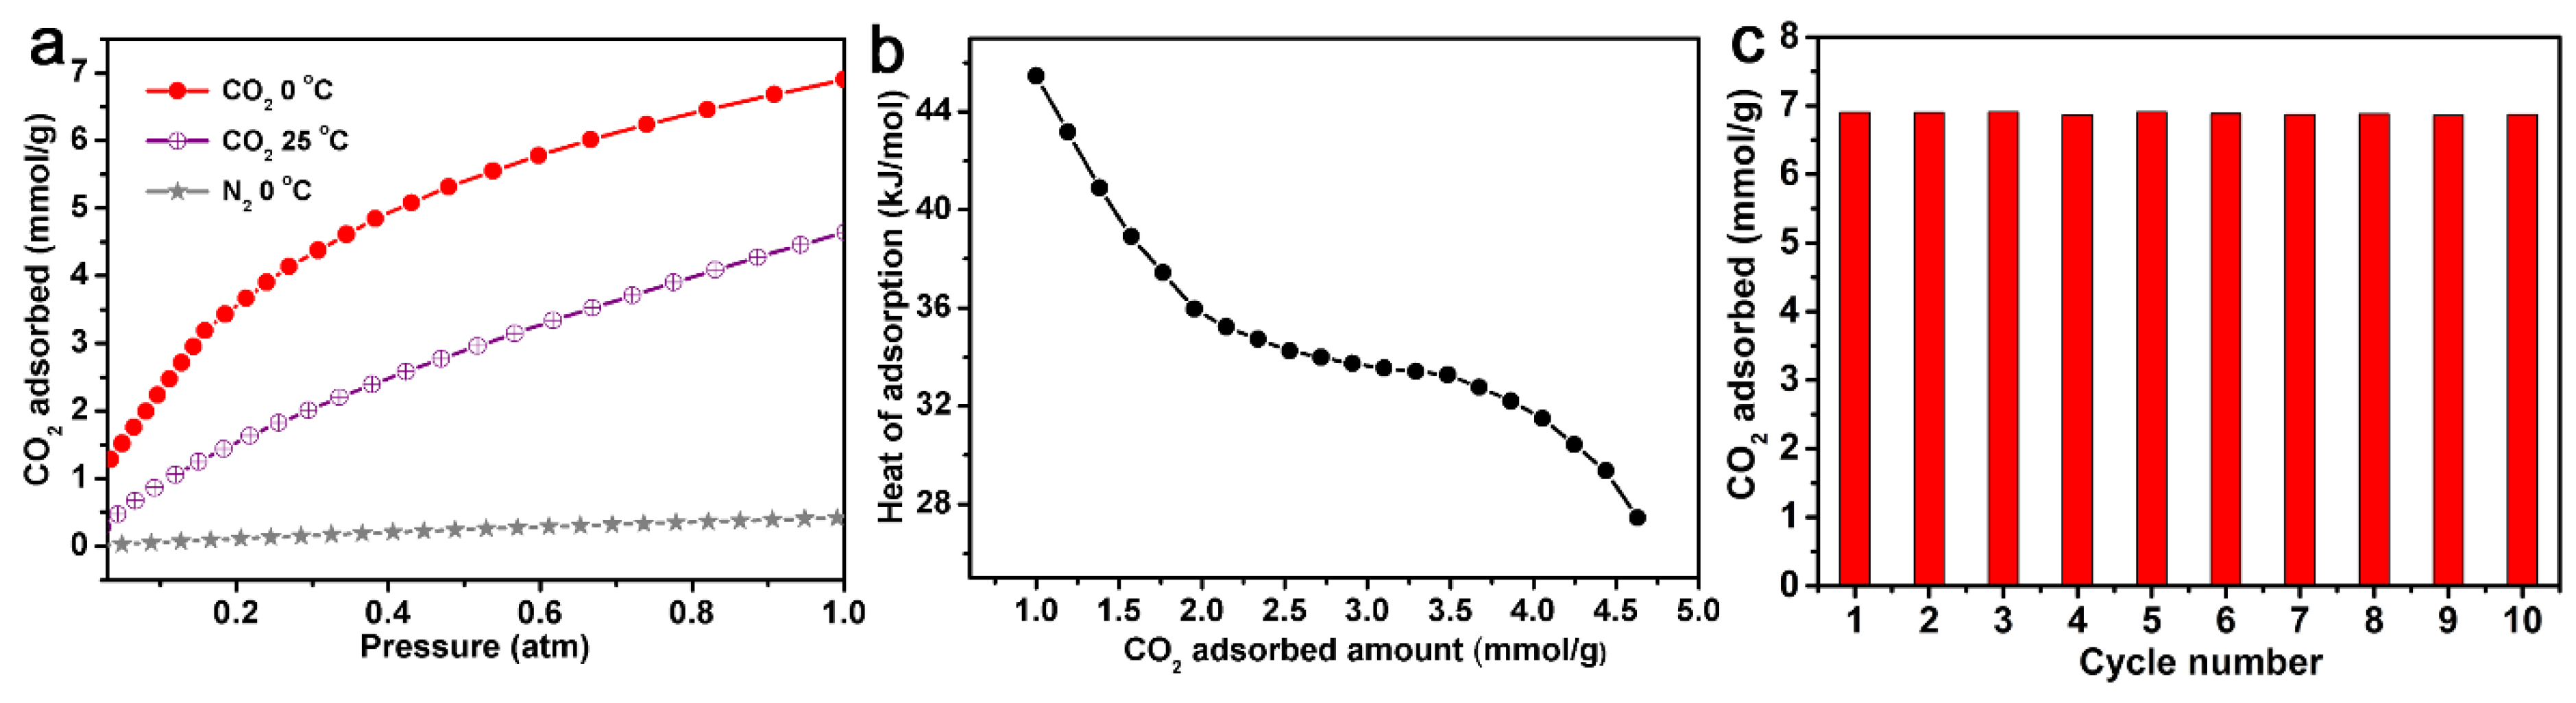
The adsorption capacity of AC-600-4-700 for N2 was also measured at 0 °C and 1 atm. As shown in Figure 5a, compared with CO2 adsorption at the same condition (6.9 mmol/g), the N2 adsorption capacity could only reach a maximum of 0.4 mmol/g, with a much lower adsorption capacity. This meant that AC-600-4-700 was a selective adsorbent that could be applied for the separation of CO2 and N2. The adsorption capacity of AC-600-4-700 for CO2 at 25 °C and 1 atm could reach 4.6 mmol/g.
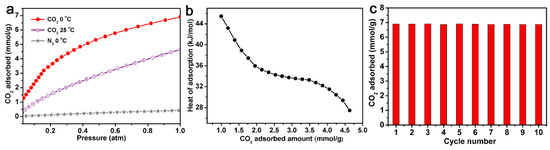
Figure 5.
(a) CO2 and N2 adsorption curves of AC-600-4-700 at 0 and 25 °C, 1 atm. (b) Isosteric heats of CO2 adsorption on AC-600-4-700 calculated from the adsorption isotherms at 0 and 25 °C, 1 atm. (c) CO2 multi-circle adsorption curves of AC-600-4-700 at 0 °C.
The isosteric heat of adsorption (Qst) calculated based on the CO2 adsorption isotherms of AC-600-4-700 at 0 °C and 25 °C is shown in Figure 5b. The Qst of N-AC-3-1000 under low CO2 absorption was between 27 and 45 kJ/mol, which was compared with other porous carbon materials [9,11,13]. When the CO2 coverage was low, the Qst value was higher, which was due to the adsorption in the pores and the interaction with surface non-uniformity. As the CO2 adsorption increased, the Qst decreased, indicating an uneven surface of the material. Figure 5c also shows the CO2 absorption bar chart of AC-600-4-700 after 10 repeated regeneration runs at 0 °C. Obviously, although the CO2 adsorption capacity remained almost unchanged after 10 repetitions under the same conditions, this indicated that AC-4600-700 had high stability and could recover and capture CO2.
2.3. Electrochemical Studies
As-obtained carbon materials were also used as electrodes for supercapacitors. Figure 6 and Figure S1 show the CV curves and GCD curves of all of the samples. The specific capacitances of samples were 141–282 F/g, which are shown in Table 1. Among them, AC-600-4-700 had the most superior electrochemical performance. As shown in Figure 6a, it could be observed that the CV curve could maintain a rectangular shape at different scanning rates, indicating that the AC-600-4-700 electrode had excellent electrochemical reversibility [5,44].
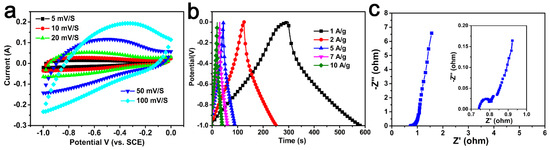
Figure 6.
(a) CV curves for the AC-600-4-700 electrode sample at different sweep ratios. (b) GCD profiles for the AC-600-4-700 at different current densities. (c) Nyquist plot of the AC-600-4-700. Inset shown in the high frequencies.
Figure 6b shows the charge–discharge curves of the AC-600-4-700 electrode at different current densities. All curves were highly symmetrical with their corresponding charge counterparts in the potential region, indicating pure capacitive behavior. It can be seen that compared to the specific capacitance of 282 F/g at 1 A/g, the specific capacitance at 10 A/g still had 195 F/g, indicating that the electrode had a good discharge rate. These results and analyses confirmed that the AC-600-4-700 electrode exhibited excellent capacitive behavior, which was comparable to most other biomass-derived activated carbons (Table 3) [28,29,30,31,32,33,34,35,36,37,38,39].
Table 3.
Biomass-derived activated carbons electrodes and capacitive performance for EDLC.
The frequency response of the AC-600-4-700 electrode material was investigated by EIS (Figure 6c). The impedance plots show three distinct parts including the high-frequency region, diffusion segment and low-frequency region. The X-intercept of the Nyquist plot at high frequencies showed the equivalent series resistance; a value of 0.64 Ω could be calculated from the illustration. In addition, the slope of about 45° in the low frequency range corresponded to Warburg resistance, which was related to the diffusion resistance of the electrolyte ions entering the electrode material. In addition, the AC-600-4-700 electrode exhibited almost vertical lines in the low frequency range, indicating excellent capacitive behavior [52].
2.4. The Relationship between Pore Volume with a Specific Range of Pores and the CO2 Adsorption Capacity or Specific Capacity of ACF Samples
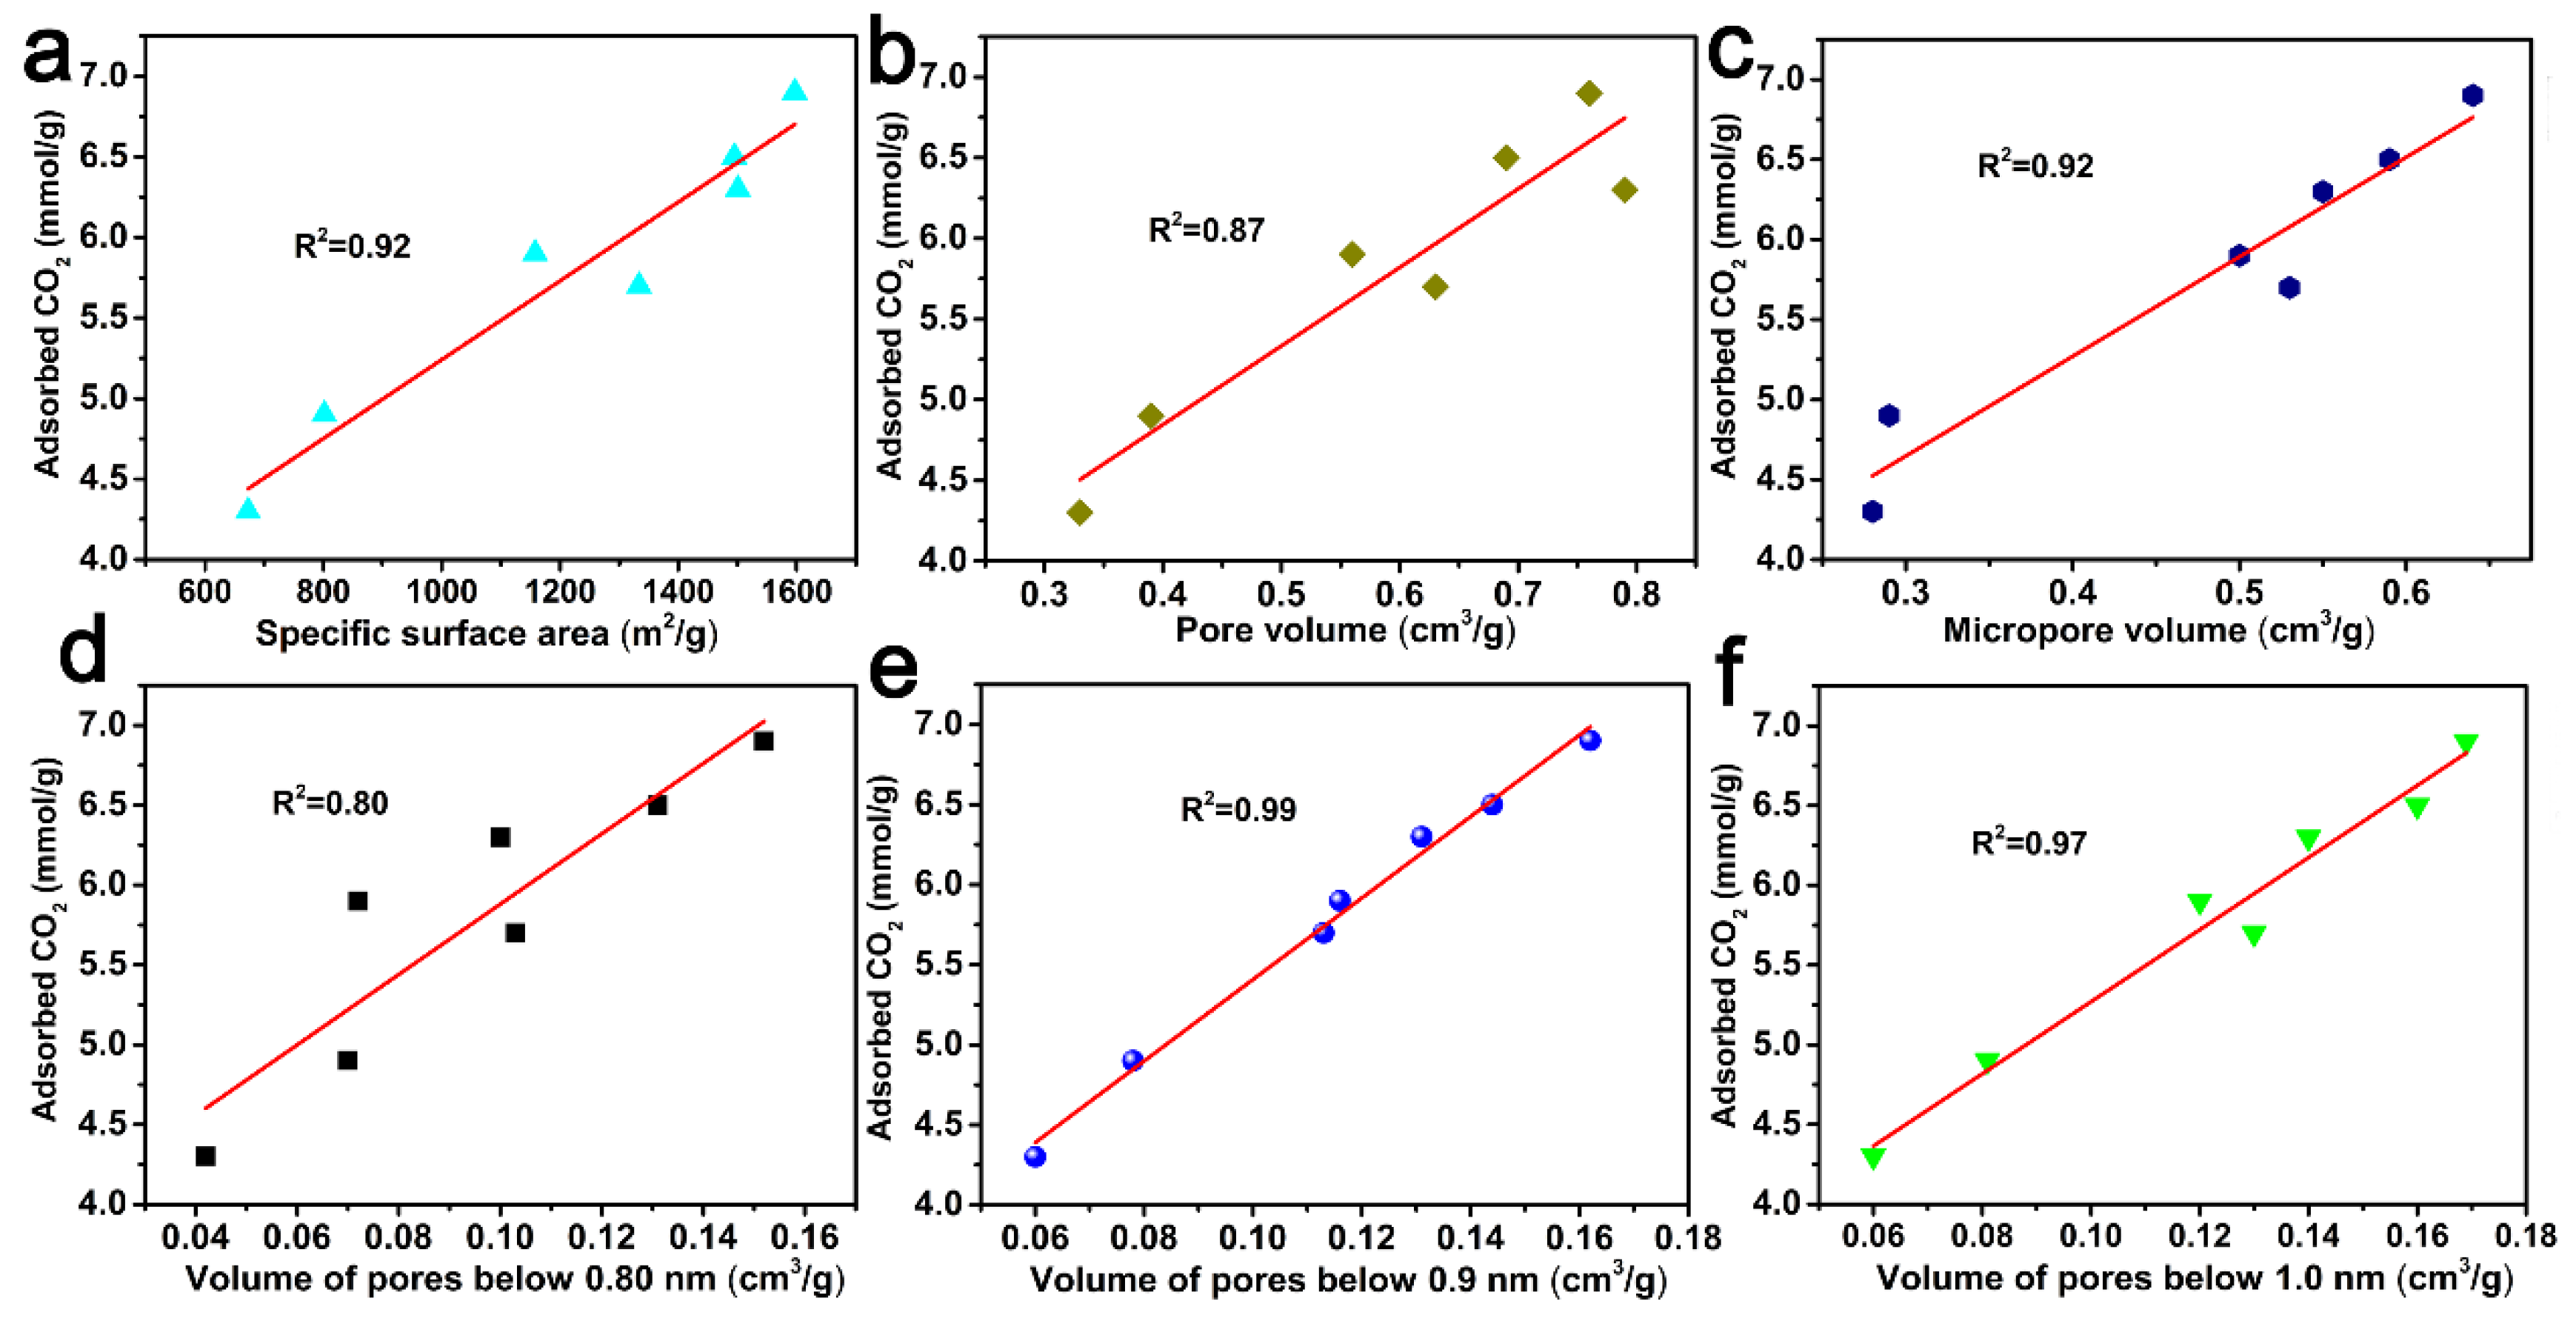
In order to better understand the role of porous structures in the CO2 adsorption behavior of ACF samples, the correlation curves between the CO2 adsorption capacity and the specific surface area, pore volume, micropore volume, and pore volumes below 0.80 nm, 0.90 nm, and 1.0 nm are shown in Figure 7. And from Figure 7, it can be concluded that pore volumes below 0.90 nm had a better correlation with CO2 adsorption at 0 °C and 1.0 atm.
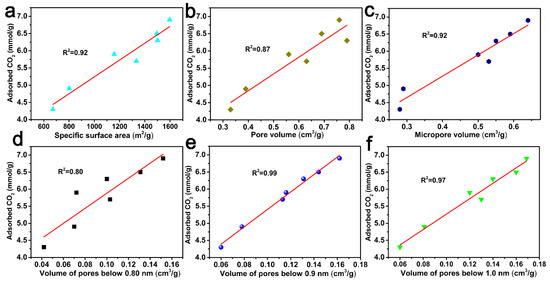
Figure 7.
CO2 uptake at 0 °C and 1 atm versus specific surface area (a), pore volume (b), micropore volume (c), the pore volume of pores below 0.80 nm (d), 0.90 nm (e) and 1.0 nm (f) derived from CO2 adsorption data.
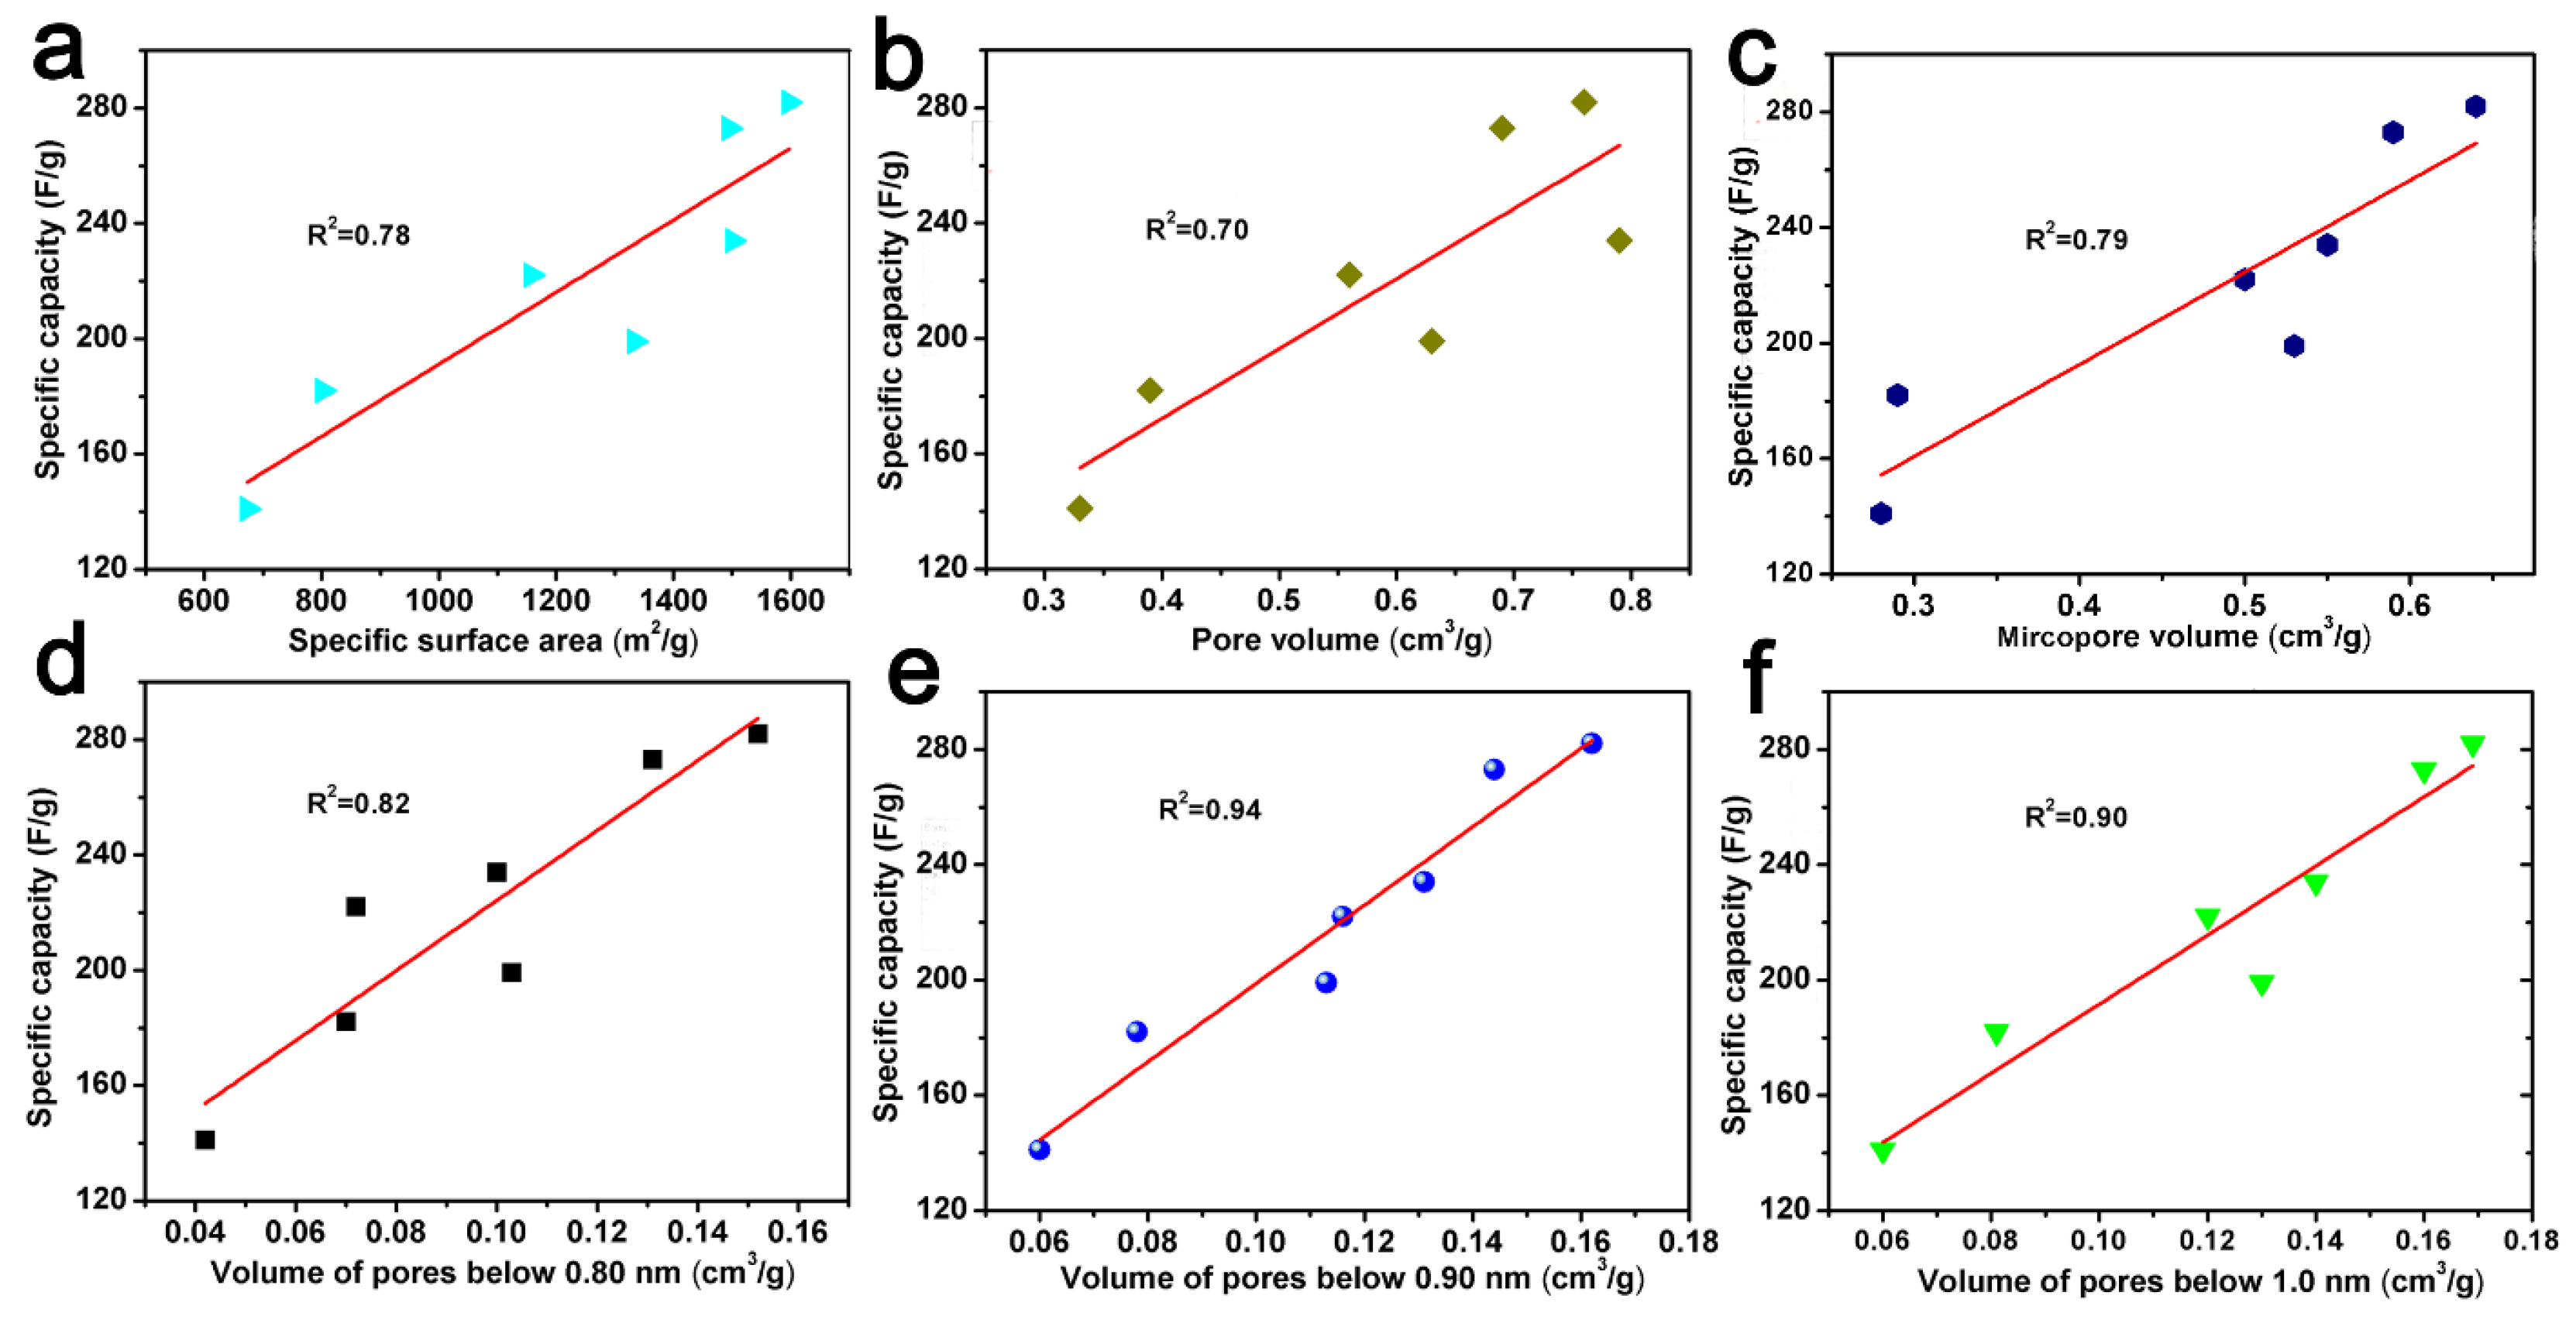
In addition, the correlation curves between specific capacity and the specific surface area, pore volume, micropore volume, and pore volume below 0.80 nm, 0.90 nm, and 1.0 nm are also shown in Figure 8. It could also show that there is a good correlation between the pore volume and specific capacity below 0.90 nm. This trend seems to indicate that the double layer formed in small pores, i.e., pores with a size of less than 0.90 nm, mainly contributed to the capacitance value [52]. A similar phenomena was also found by Vix-Guterl et al., which indicates that the specific pore volume of pores less than 0.90 nm has an effect on both the CO2 capture ability and the electrochemical capacitance [42].

Figure 8.
The relationship between specific capacity versus specific surface area (a), pore volume (b), micropore volume (c), the pore volume of pores below 0.80 nm (d), 0.90 nm (e) and 1.0 nm (f) derived from CO2 adsorption data.
3. Materials and Methods
3.1. Materials
CF was purchased from the Xinjiang Long staple Cotton Distribution Company, Ürümqi, Xinjiang, China. KOH (>95%) was purchased from Aladdin Chemical Reagent Company, Shanghai, China. Ar gas (>99.9999%) was purchased from Zhongke Kate Co., Ltd., Lanzhou, Gansu, China. All reagents were used without any further purification.
3.2. ACFs Material Preparation
CF was firstly carbonized at 500, 600 or 700 °C for 2 h in Ar flow; the resulting carbonized carbon was activated by KOH: a given mass of C-x was impregnated with KOH solutions of different mass ratios (KOH/C-x = 3, 4, and 5), and evaporated under vacuum at 80 °C. Then, the mixture was heated at 600, 700 or 800 °C for 1 h under Ar flow, and the activated sample was neutralized with 1 M HCl until the pH reached 7. The obtained ACF samples were denoted as AC-x-y-z, where x represents the corresponding carbonization temperature, y represents the corresponding KOH/C-x mass ratio, and z represents the corresponding activation temperature.
3.3. Characterizations of ACFs Material
A scanning electron microscope (SEM, JSM-6701F, JEOL, Tokyo, Japan) was used to investigate the morphology and microstructure of the prepared samples. The acceleration voltage during the testing process was 0.5–30 kV. Crystallite structures were observed on an XRD (X’ Pert Pro, Philips, Eindhoven, The Netherlands) using Cu Kα radiation from 5° to 90°, a scanning speed of 2 °/min, an acceleration voltage of 45 kV, and a current of 40 mA. An X-ray photoelectron spectroscope (XPS), Physical Electronics, Chanhassen, MN, USA, was used to measure Al Ka radiation. N2 adsorption–desorption isotherms were measured at 77 K on a Micrometrics ASAP 2020 volumetric adsorption analyzer (Norcross, GA, USA). Before adsorption measurements were taken, samples were degassed at 200 °C for 4 h. The specific surface area (SSA) and pore size distribution of each sample were calculated from the N2 adsorption curve by the BET method and the non-local density functional theory (NLDFT) method, respectively. The total pore volume of the sample was calculated based on the adsorption capacity at a relative pressure of P/P0 = 0.99.
3.4. CO2 Capture Measurement
CO2 adsorption isotherms of the ACF samples were measured with a Micromeritics ASAP 2020 static volumetric analyzer at 0 °C or 25 °C between 0.03 and 1 atm. Before each adsorption test, the sample was also degassed at 200 °C for 4 h. The CO2 adsorption isotherms were also used to calculate the pore size distribution and pore volume of pores (below 1.0 nm) using the NLDFT model [53]. The N2 adsorption isotherm of the ACF sample was measured at 0 °C between 0.03 and 1 atm.
3.5. Electrochemical Test
Firstly, the ACF samples were ground into powder. Subsequently, 80 wt% powder active material was mixed with 7.5 wt% acetylene black (>99.9%) and 7.5 wt% conductive graphite in an agate mortar until a uniform black powder was obtained; then 5 wt% poly (tetrafluoroethylene) and a few drops of ethanol were added to the mixture. The resulting paste was coated onto a nickel mesh, dried, pressed at 10 MPa and used as a working electrode.
Electrochemical measurements were performed using a three electrode system in a 2 M KOH electrolyte at room temperature on each prepared electrode using an electrochemical workstation (CHI660D, Shanghai Chenhua Instrument Co., Ltd., Shanghai, China). A Pt electrode and saturated calomel electrode were used as the counter electrode and reference electrode, respectively. Cyclic voltammetry (CV) measurements were performed at different scanning rates, constant current charging/discharging (GCD) measurements were performed at different current densities, and electrochemical impedance spectroscopy (EIS) was studied.
4. Conclusions
In this study, we successfully prepared ACF samples with abundant micropores through high-temperature carbonization and KOH activation derived from natural cotton fibers. This study exhibited the highest CO2 capture ability of ACF samples at 0 °C and 1 atm, reaching up to 6.9 mmol/g. The ACF samples also showed good selectivity and excellent recyclability for the separation of CO2-N2. Furthermore, it was found that a specific pore volume below 0.90 nm played a crucial role in determining the CO2 capture capacity and electrochemical capacitance. The large capture capacity and high electrochemical capacitance of CO2 enable CF to serve as a new biomass source for carbon materials used in CO2 capture and high-performance supercapacitors.
Supplementary Materials
The following supporting information can be downloaded at: https://www.mdpi.com/article/10.3390/molecules29133153/s1, Figure S1: CV curves for 5 mV·s−1 of (a) AC-x-4-800 (x = 500, 600 and 700); (b) AC-600-y-700, (y = 3, 4 and 5); (c) AC-600-4-z (z = 600, 700 and 800); and galvanostatic charge/discharge profiles (GCD) at current density of 1 A·g−1 of (d) AC-x-4-800 (x = 500, 600 and 700); (e) AC-600-y-700, (y = 3, 4 and 5); (f) AC-600-4-z (z = 600, 700 and 800).
Author Contributions
Conceptualization, L.Y.; Methodology, H.L. and W.Z.; Formal analysis, Q.C.; Investigation, W.Z. and X.W.; Data curation, W.C., B.Y. and C.L.; Writing—original draft, P.W.; Writing—review & editing, Z.C. All authors have read and agreed to the published version of the manuscript.
Funding
This work was supported by the National Nature Science Foundations of Gansu Province (21JR11RA020). This work was also supported by the Fundamental Research Funds for the Central Universities (31920220073, 31920230056, 31920200098, 1001450232, 31920240057). This work was supported by Gansu Province Higher Education Youth Doctoral Fund Project (2022QB-019). This work was also supported by the Innovation Project for Young Science and Technology Talents of Lanzhou City (2023-QN-96). This work was supported by the National Nature Science Foundations of China (12164040).
Institutional Review Board Statement
Not applicable.
Informed Consent Statement
Not applicable.
Data Availability Statement
Data are contained within the article and Supplementary Materials.
Conflicts of Interest
The authors declare no conflict of interest.
References
- Dissanayake, P.D.; You, S.M.; Igalavithana, A.D.; Xia, Y.F.; Bhatnagar, A.; Gupta, S.; Kua, H.W.; Kim, S.; Kwon, J.H.; Tsang DC, W.; et al. Biochar-based adsorbents for carbon dioxide capture: A critical review. Renew. Sustain. Energy Rev. 2020, 119, 109582. [Google Scholar] [CrossRef]
- Jiang, L.; Liu, W.; Wang, R.Q.; Gonzalez-Diaz, A.; Rojas-Michaga, M.F.; Michailos, S.; Pourkashanian, M.; Zhang, X.J.; Font-Palma, C. Sorption direct air capture with CO2 utilization. Prog. Energy Combust. Sci. 2023, 95, 101069. [Google Scholar] [CrossRef]
- Kim, C.; Talapaneni, S.N.; Dai, L. Porous carbon materials for CO2 capture, storage and electrochemical conversion. Mater. Rep. Energy 2023, 3, 100199. [Google Scholar] [CrossRef]
- Yin, Y.; Liu, Q.; Zhao, Y.; Chen, T.; Wang, J.; Gui, L.; Lu, C. Recent progress and future directions of biomass-derived hierarchical porous carbon: Designing, preparation, and supercapacitor applications. Energy Fuels 2023, 37, 3523–3554. [Google Scholar] [CrossRef]
- Yuan, C.; Xu, H.; El-khodary, S.A.; Ni, G.; Esakkimuthu, S.; Zhong, S.; Wang, S. Recent advances and challenges in biomass-derived carbon materials forsupercapacitors: A review. Fuel 2024, 362, 130795. [Google Scholar] [CrossRef]
- Nazir, G.; Rehman, A.; Hussain, S.; Mahmood, Q.; Fteiti, M.; Heo, K.; Ikram, M.; Din, M.A.U. Towards a sustainable conversion of biomass/biowaste to porous carbons for CO2 adsorption: Recent advances, current challenges, and future directions. Green Chem. 2023, 25, 4941–4980. [Google Scholar] [CrossRef]
- Wang, T.; Chen, Z.; Gong, W.; Xu, F.; Song, X.; He, X.; Fan, M. Electrospun carbon nanofibers and their applications in several areas. ACS Omega 2023, 8, 22316–22330. [Google Scholar] [CrossRef]
- Bai, J.; Huang, J.; Yu, Q.; Demir, M.; Kilic, M.; Altay, B.N.; Hu, X.; Wang, L. N-doped porous carbon derived from macadamia nut shell for CO2 adsorption. Fuel Process. Technol. 2023, 249, 107854. [Google Scholar] [CrossRef]
- Wu, R.; Bao, A. Preparation of cellulose carbon material from cow dung and its CO2 adsorption performance. J. CO2 Util. 2023, 68, 102377. [Google Scholar] [CrossRef]
- Tang, Z.; Gao, J.; Zhang, Y.; Du, Q.; Feng, D.; Dong, H.; Peng, Y.; Zhang, T.; Xie, M. Ultra-microporous biochar-based carbon adsorbents by a facile chemical activation strategy for high-performance CO2 adsorption. Fuel Process. Technol. 2023, 241, 107613. [Google Scholar] [CrossRef]
- Wu, C.; Liu, J.; Wang, Y.; Zhao, Y.; Li, G.; Zhang, G. KCl-assisted activation of macadamia nut shell-derived carbon: Unveiling enhanced pore structure, adsorption and supercapacitor performance. Sep. Purif. Technol. 2024, 329, 125188. [Google Scholar] [CrossRef]
- Bai, J.; Huang, J.; Yu, Q.; Demir, M.; Gecit, F.H.; Altay, B.N.; Wang, L.; Hu, X. One-pot synthesis of self S-doped porous carbon for efficient CO2 adsorption. Fuel Process. Technol. 2023, 244, 107700. [Google Scholar] [CrossRef]
- Jin, Y.; Xu, Q.; Zheng, F.; Lu, J. Enhancement in CO2 adsorption by zeolite synthesized from co-combustion ash of coal and rice husk modified with lithium ion. J. Energy Inst. 2023, 110, 101348. [Google Scholar] [CrossRef]
- Sevilla, M.; Fuertes, A.B. Sustainable porous carbons with a superior performance for CO2 capture. Energy Environ. Sci. 2011, 4, 1765–1771. [Google Scholar] [CrossRef]
- Singh, G.; Kim, I.Y.; Lakhi, K.S.; Srivastava, P.; Naidu, R.; Vinu, A. Single step synthesis of activated bio-carbons with a high surface area and their excellent CO2 adsorption capacity. Carbon 2017, 116, 448–455. [Google Scholar] [CrossRef]
- Serafin, J.; Srenscek-Nazzal, J.; Kaminska, A.; Paszkiewicz, O.; Michalkiewicz, B. Management of surgical mask waste to activated carbons for CO2 capture. J CO2 Util. 2022, 59, 101970. [Google Scholar] [CrossRef]
- Vazhayal, L.; Wilson, P.; Prabhakaran, K. Utilization of waste aquatic weeds for the sustainable production of nitrogen doped nanoporous carbon for CO2 capture. Mater. Today Proc. 2021, 52, 2315–2321. [Google Scholar] [CrossRef]
- Singh, G.; Bahadur, R.; Mee, L.J. Nanoporous activated biocarbons with high surface areas from alligator weed and their excellent performance for CO2 capture at both low and high pressures. Chem. Eng. J. 2021, 406, 126787. [Google Scholar] [CrossRef]
- Ismail, I.S.; Singh, G.; Smith, P. Oxygen functionalized porous activated biocarbons with high surface area derived from grape marc for enhanced capture of CO2 at elevated-pressure. Carbon 2020, 160, 113–124. [Google Scholar] [CrossRef]
- Kiełbasa, K.; Bayar, Ş.; Varol, E.A.; Sreńscek-Nazzal, J.; Bosacka, M.; Miądlicki, P.; Serafin, J.; Wróbel, R.J.; Michalkiewicz, B. Carbon dioxide adsorption over activated carbons produced from molasses using H2SO4, H3PO4, HCl, NaOH, and KOH as Activating Agents. Molecules 2022, 27, 7467. [Google Scholar] [CrossRef]
- Zhao, J.; Zhang, W.; Shen, D.; Zhang, H.; Wang, Z. Preparation of porous carbon materials from black liquor lignin and its utilization as CO2 adsorbents. J. Energy Inst. 2023, 107, 101179. [Google Scholar] [CrossRef]
- Rahimi, V.; Ferreiro-Salgado, A.; Gómez-Díaz, D.; Freire, M.S.; González-Álvarez, J. Evaluating the performance of carbon-based adsorbents fabricated from renewable biomass precursors for post-combustion CO2 capture. Sep. Purif. Technol. 2024, 344, 127110. [Google Scholar] [CrossRef]
- Xu, Y.; Liu, Y.; Zhan, W.; Zhang, D.; Liu, Y.; Xu, Y.; Wu, Z. Enhancing CO2 capture with K2CO3-activated carbon derived from peanut shell. Biomass Bioenergy 2024, 183, 107148. [Google Scholar] [CrossRef]
- Serafin, J.; Dziejarski, B.; Vendrell, X.; Kiełbasa, K.; Michalkiewicz, B. Biomass waste fern leaves as a material for a sustainable method of activated carbon production for CO2 capture. Biomass Bioenergy 2023, 175, 106880. [Google Scholar] [CrossRef]
- Kim, M.J.; Choi, S.W.; Kim, H.; Mun, S.; Lee, K.B. Simple synthesis of spent coffee ground-based microporous carbons using K2CO3 as an activation agent and their application to CO2 capture. Chem. Eng. J. 2020, 397, 125404. [Google Scholar] [CrossRef]
- Muhammad, R.; Nah, Y.-C.; Oh, H. Spider silk-derived nanoporous activated carbon fiber for CO2 capture and CH4 and H2 storage. J. CO2 Util. 2023, 69, 102401. [Google Scholar] [CrossRef]
- Wang, P.; Lang, J.; Xu, S.; Wang, X. Nitrogen-containing activated carbon fibers derived from silk fibers for CO2 capture. Mater. Lett. 2015, 152, 145–147. [Google Scholar] [CrossRef]
- Wang, S.; Sun, W.; Yang, D.-S.; Yang, F. Conversion of soybean waste to sub-micron porous-hollow carbon spheres for supercapacitor via a reagent and template-free route. Mater. Today Energy 2019, 13, 50–55. [Google Scholar] [CrossRef]
- Yu, M.; Han, Y.; Li, J.; Wang, L. CO2-activated porous carbon derived from cattail biomass for removal of malachite green dye and application as supercapacitors. Chem. Eng. J. 2017, 317, 493–502. [Google Scholar]
- Li, Y.; Sun, Y.; Li, H.; Sun, M.; Shen, J.; Wang, S. High nitrogen-oxygen dual-doped three-dimensional hierarchical porous carbon network derived from Eriocheir sinensis for advanced supercapacitors. Energy 2023, 270, 126942. [Google Scholar] [CrossRef]
- Jiang, C.; Yakaboylu, G.A.; Yumak, T.; Zondle, J.W.; Sabolsky, E.M.; Wang, J. Activated carbons prepared by indirect and direct CO2 activation of lignocellulosic biomass for supercapacitor electrodes. Renew. Energy 2020, 155, 38–52. [Google Scholar] [CrossRef]
- Chen, W.; Li, K.; Xia, M.; Chen, Y.; Yang, H.; Chen, Z.; Chen, X.; Chen, H. Influence of NH3 concentration on biomass nitrogen-enriched pyrolysis. Bioresour. Technol. 2018, 263, 350–357. [Google Scholar] [CrossRef]
- Prasankumar, T.; Salpekar, D.; Bhattacharyya, S.; Manoharan, K.; Yadav, R.M.; Mata MA, C.; Miller, K.A.; Vajtai, R.; Jose, S.; Roy, S.; et al. Biomass derived hierarchical porous carbon for supercapacitor application and dilute stream CO2 capture. Carbon 2022, 199, 249–257. [Google Scholar] [CrossRef]
- Khan, A.; Senthil, R.A.; Pan, J.; Osman, S.; Sun, Y.; Shu, X. A new biomass derived rod-like porous carbon from tea-waste as inexpensive and sustainable energy material for advanced supercapacitor application. Electrochim. Acta 2020, 335, 135588. [Google Scholar] [CrossRef]
- Mohammed, A.A.; Chen, C.; Zhu, Z. Low-cost, high-performance supercapacitor based on activated carbon electrode materials derived from baobab fruit shells. J. Colloid Interface Sci. 2019, 538, 308–319. [Google Scholar] [CrossRef]
- Tan, Y.; Xu, Z.; He, L.; Li, H. Three-dimensional high graphitic porous biomass carbon from dandelion flower activated by K2FeO4 for supercapacitor electrode. J. Storage Mater. 2022, 52, 104889. [Google Scholar] [CrossRef]
- Cheng, J.; Hu, S.-C.; Sun, G.-T.; Kang, K.; Zhu, M.-Q.; Geng, Z.-C. Comparison of activated carbons prepared by one-step and two-step chemical activation process based on cotton stalk for supercapacitors application. Energy 2021, 215, 119144. [Google Scholar] [CrossRef]
- Khan, A.; Senthil, R.A.; Pan, J.; Sun, Y.; Liu, X. Hierarchically porous biomass carbon derived from natural withered rose flowers as high-performance material for advanced supercapacitors. Batter. Supercaps 2020, 3, 731–737. [Google Scholar] [CrossRef]
- Guo, F.; Jiang, X.; Jia, X.; Liang, S.; Qian, L.; Rao, Z. Synthesis of biomass carbon electrode materials by bimetallic activation for the application in supercapacitors. J. Electroanal. Chem. 2019, 844, 105–115. [Google Scholar] [CrossRef]
- Wickramaratne, N.P.; Jaroniec, M. Importance of small micropores in CO2 capture by phenolic resin-based activated carbon spheres. J. Mater. Chem. A 2013, 1, 112–116. [Google Scholar] [CrossRef]
- Presser, V.; McDonough, J.; Yeonb, S.-H.; Gogotsi, Y. Effect of pore size on carbon dioxide sorption by carbide derived carbon. Energy Environ. Sci. 2011, 4, 3059–3066. [Google Scholar] [CrossRef]
- Vix-Guterl, C.; Frackowiak, E.; Jurewicz, K.; Friebe, M.; Parmentierc, J.; Béguin, F. Electrochemical energy storage in ordered porous carbon materials. Carbon 2005, 43, 1293–1302. [Google Scholar] [CrossRef]
- Li, Q.; Lu, T.; Wang, L.; Pang, R.; Shao, J.; Liu, L.; Hu, X. Biomass based N-doped porous carbons as efficient CO2 adsorbents and high-performance supercapacitor electrodes. Sep. Purif. Technol. 2021, 275, 119204. [Google Scholar] [CrossRef]
- Lu, W.; Si, Y.; Zhao, C.; Chen, T.; Li, C.; Zhang, C.; Wang, K. Biomass-derived carbon applications in the field of supercapacitors: Progress and prospects. Chem. Eng. J. 2024, 495, 153311. [Google Scholar] [CrossRef]
- Li, C.; Yan, L.; Wang, M.; Kong, J.; Bao, W.; Chang, L. Synthesis strategies and applications for pitch-based anode: From industrial by-products to power sources. Chem. Rec. 2022, 23, e202200216. [Google Scholar] [CrossRef]
- Xing, L.-A.; Yang, F.; Zhong, X.; Liu, Y.; Lu, H.; Guo, Z.; Lv, G.; Yang, J.; Yuan, A.; Pan, J. Ultra-microporous cotton fiber-derived activated carbon by a facile one-step chemical activation strategy for efficient CO2 adsorption. Sep. Purif. Technol. 2023, 324, 124470. [Google Scholar] [CrossRef]
- Zhu, Y.; Murali, S.; Stoller, M.D.; Ganesh, K.J.; Cai, W.; Ferreira, P.J.; Pirkle, A.; Wallace, R.M.; Cychosz, K.A.; Thommes, M.; et al. Carbon-based supercapacitors produced by activation of graphene. Science 2011, 332, 1537–1541. [Google Scholar] [CrossRef]
- Vinodh, R.; Sangeetha, D. Carbon supported silver (Ag/C) electrocatalysts for alkaline membrane fuel cells. J. Mater. Sci. 2012, 47, 852–859. [Google Scholar] [CrossRef]
- Sing, K.S.W.; Everett, D.H.; Haul, R.A.W.; Moscou, L.; Pierotti, R.A.; Rouquerol, J.; Siemieniewska, T. Reporting physisorption data for gas/solid systems with special reference to the determination of surface area and porosity. Pure Appl. Chem. 1985, 57, 603–619. [Google Scholar] [CrossRef]
- Liu, H.-Y.; Wang, K.-P.; Teng, H.A. simplified preparation of mesoporous carbon and the examination of the carbon accessibility for electric double layer formation. Carbon 2005, 43, 559–566. [Google Scholar] [CrossRef]
- Alhamed, Y.A.; Bamufleh, H.S. Theoretical study of the transesterification of triglycerides to biodiesel fuel. Fuel 2009, 88, 87–91. [Google Scholar] [CrossRef]
- Chmiola, J.; Largeot, C.; Taberna, P.-L.; Simon, P.; Gogotsi, Y. Desolvation of ions in subnanometer pores and its effect on capacitance and double-layer theory. Angew. Chem. Int. Ed. 2008, 47, 3392. [Google Scholar] [CrossRef]
- Thommes, M.; Morlay, C.; Ahmad, R.; Joly, J.P. Assessing surface chemistry and pore structure of active carbons by a combination of physisorption (H2O, Ar, N2, CO2), XPS and TPD-MS. Adsorption 2011, 17, 653–661. [Google Scholar] [CrossRef]


Disclaimer/Publisher’s Note: The statements, opinions and data contained in all publications are solely those of the individual author(s) and contributor(s) and not of MDPI and/or the editor(s). MDPI and/or the editor(s) disclaim responsibility for any injury to people or property resulting from any ideas, methods, instructions or products referred to in the content. |
© 2024 by the authors. Licensee MDPI, Basel, Switzerland. This article is an open access article distributed under the terms and conditions of the Creative Commons Attribution (CC BY) license (https://creativecommons.org/licenses/by/4.0/).