Abstract
Interest in measuring major and trace elements in plants has increased in recent years because of growing concerns about the elements’ contribution to daily intakes or the health risks posed by ingesting vegetables contaminated by potentially toxic elements. The recent advances in using inductively coupled plasma atomic emission spectrometry (ICP-OES) to measure major and trace elements in plant samples are reviewed in the present work. The sample preparation before instrumental determination and the main advantages and limitations of ICP-OES are described. New trends in element extraction in liquid solutions using fewer toxic solvents and microextractions are observed in recently published literature. Even though ICP-OES is a well-established and routine technique, recent innovations to increase its performance have been found. Validated methods are needed to ensure the obtaining of reliable results. Much research has focused on assessing principal figures of merit, such as limits of detection, quantification, selectivity, working ranges, precision in terms of repeatability and reproducibility, and accuracy through spiked samples or certified reference materials analysis. According to the published literature, the ICP-OES technique, 50 years after the release of the first commercially available equipment, remains a powerful and highly recommended tool for element determination on a wide range of concentrations.
1. Introduction
The determination of mineral elements is a critical aspect of chemical analysis in most types of samples. Even though about three-quarters of the elements in the periodic table are metals, only several are known as being essential for living organisms due to their biochemical role in the human body. Elements like Ca, K, P, Na, and Mg are major essential elements, whereas elements such as Fe, Zn, Mn, Cu, and Se are trace essential elements [1,2,3,4]. The deficiencies of these elements may cause malfunctioning of organisms, while their concentration above certain thresholds may negatively affect the organism’s health [5,6]. Other elements (Cd, Pb, Hg, As, and Sr) with no known biological function represent a health risk even at low concentrations [7,8,9].
Amongst the most widespread methods for determining major and trace elements, spectrometric methods based on inductively coupled plasma (ICP), like inductively coupled plasma–optical emission spectroscopy (ICP-OES) and inductively coupled plasma-mass spectrometry (ICP-MS), are known for their robustness, low detection limits, good accuracies, large linear ranges of concentrations, low detection limits, and multielement determination capability [10,11,12,13,14]. The robustness of the ICP-OES technique is also demonstrated by the fact that 50 years after the first commercial instrument appeared [10], it remains one of the most widely used techniques for determining major and trace elements in various types of liquid and solid samples.
In ICP-OES, plasma is used to emit photons with characteristic wavelengths for each analyzed element, ensuring thus the element’s identification, while the intensity of emitted radiation is proportionally linked to the concentration of the analyte. The samples typically need to be introduced into the plasma in their liquid form by nebulization. Therefore, the analysis of vegetables implies their digestion to bring analytes from their solid matrix into a liquid aqueous solution. In the case of vegetable analysis by ICP-OES, the sample preparation usually includes several steps, such as washing/cleaning, drying, crushing, sieving, digestion using a mixture of acids, filtration, and then measurement by ICP-OES [15]. Thus, plant sample preparation before ICP-OES analysis has been extensively studied.
Given the general tendency in analytical chemistry to achieve greener methodologies, determining chemical elements by inductively coupled plasma-based techniques should become as environmentally friendly as possible. Anastas [16] first drew attention to the necessity of adapting analytical methodologies to the requirements of green chemistry. Nowak et al. [17] introduced the concept of white analytical chemistry, while Gałuszka et al. [18] formulated the 12 main principles of green analytical chemistry to protect the environment and analysts while performing analytical procedures. The primary strategy of this concept comprises reducing the stages of analytical procedures, performing on-site analysis using portable instruments, replacing or eliminating toxic reagents in sample preparation or sampling procedures, minimizing the use of energy, performing multi-parameter analysis, and increasing the safety of analysts [18,19]. Thus, one of the aims of this review was also to assess the possible integration of metals analysis in vegetables by ICP-OES in the principles of green analytical chemistry, both from the instrumentation and from sample preparation points of view.
This review aims to present comprehensive information on the new trends and findings from ICP-OES application in plant analysis. It emphasizes the necessity and importance of ensuring appropriate quality control in plant analysis and characterization. The literature published in the last ten years was mostly considered.
2. Plants Samples Preparation for ICP-OES Analysis
Figure 1 presents a schematic representation of the analytical steps required for determining major and trace elements in plants by ICP-OES.
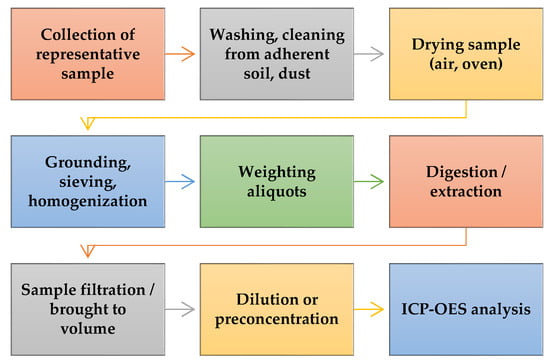
Figure 1.
Summary of steps for plant sample preparation process for ICP-OES determination.
Sample preparation is a critical issue for obtaining representative and consistent results. Firstly, the samples should be representative of the intended study. Depending on the scope, the edible part should be collected [20,21,22]. Next, the samples must be cleaned and washed with tap water and then distilled/deionized water to eliminate dust and soil-adhering particles [23,24]. To obtain the dry mass of plant samples, these can be dried using different approaches, like air-drying [23,25] for days to weeks, drying in an oven at constant temperature for hours to days until constant weight [26,27,28,29], or freeze-drying [22]. When dried in the oven, generally temperatures of 50–80 °C are used to ensure faster water evaporation and low enough temperatures to avoid possible loss of the analytes. The dried samples are powdered with grinders, blenders, and agate/porcelain mortars and pestles [30,31]. The plant sample powder obtained by grinding is often directly digested, while other authors have sieved the powders before digestion [32,33].
Different approaches have been developed and presented in the literature to extract analytes from solid plant samples to liquid solutions. These are typically focused on five methodologies: (1) wet acid digestion; (2) combustion, followed by ash acid digestion; (3) extraction to liquids with complexing chemicals; (4) extraction in simulated body fluids for bioaccessibility studies; and (5) extraction using non-toxic solvents or use of microextraction, on trend with greener sample preparation methods. These approaches are summarized in Figure 2.
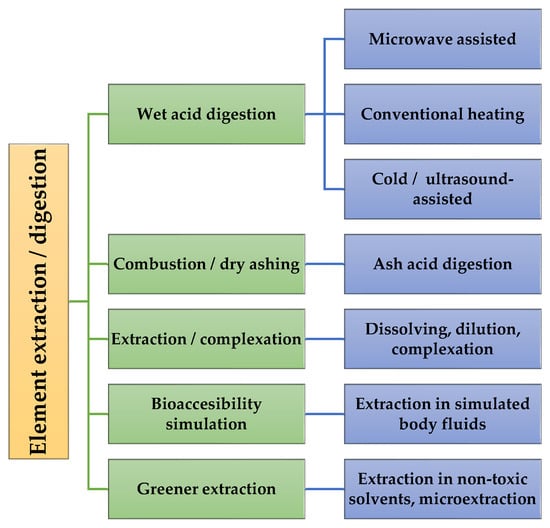
Figure 2.
Classification of main element extraction procedures from plant powders for ICP-OES analysis.
The commonly used methodologies for element extraction from solid plants are based on matrix digestion. This can be carried out directly on powdered plant samples using oxidizing acids to destroy organic matter and minimize spectral interferences. Nitric acid is frequently used due to its oxidizing role and because some elements form soluble nitrates. Also, mixtures of HNO3 with H2O2, HCl, HClO4, HF, or H2SO4 are used for sample mineralization [24,34,35]. Depending on the matrix and the analyte of interest, different optimizations of the composition of the mixtures used for digestion and the conditions for wet digestion were carried out. Good digestion efficiency is obtained if the organic components of the samples are removed. In this sense, sample combustion prior to acid extraction can be employed, even though this involves supplementary steps and is a possible source of contamination.
2.1. Wet Acid Digestion of Plant Samples for Metals Determination
Table 1 provides examples of wet acid digestion procedures for element extraction from plant samples before their instrumental determination from selected literature published from 2014 to 2024.

Table 1.
Examples of wet acid digestion procedures for element extraction from plant samples.
Even though acid–wet digestion can be performed on a hot plate or in closed microwave systems, microwave-assisted digestion was chosen in most studies. The use of microwave conditions with closed vessels has several advantages, since the time for digestion is shorter, while the contamination or the loss of analytes is minimized. Moreover, the high pressure and temperature obtained in closed vessels contribute to the degradation of organic matter; thus, the combustion step is not necessary. On the other hand, a lower mass of sample can be digested in closed vessels, typically in the range of 0.1–0.5 g, because the high amount of organic matter increases the pressure in the closed vessels. Conversely, heating on a hotplate in an open vessel has the advantage of digesting higher amounts of sample (reported up to 5–10 g) [39], which represents an advantage in analyzing a more representative sample and in obtaining lower limits of quantification, which is an essential aspect in the measurement of trace elements by ICP-OES.
Even though, in some cases, only HNO3 or mixtures of mineral acids were used for digestion [7,32,41,52,67], in most of the published papers, H2O2 was used as an oxidant agent for the wet digestion of organic matter [13,68,69,70,71,72,73]. Some authors [37] used only H2O2 to digest the samples, but in particular conditions: single-reaction chamber microwave system that allows temperature up to 300 °C and pressure up to 199 bars. However, digestion based on only H2O2 is well in agreement with green analytical chemistry recommendations due to the low acidity of resulted solutions and residues [73]. Thus, it is highly recommended for future developments.
It is important to note that in the majority of studies, there is no clear definition of metrics for evaluating the greenness of analytical methodologies. In many cases, the developed analytical methods are considered green by the authors without checking this [74]. To ensure appropriate assessment, several tools have been developed to confirm if a method adheres to green analytical chemistry principles: the National Environmental Methods Index (NEMI) [75], Green Analytical Procedure Index (GAPI) [76], Complementary Green Analytical Procedure Index (ComplexGAPI) [77], Analytical Eco-Scale (AES) [78], Analytical Method Greenness Score (AMGS) [79], Analytical Greenness Metric (AGREE) [80], and the Analytical Greenness Metric for Sample Preparation (AGREEprep) [81]. On the topic of metals and metalloids analysis by ICP-OES following sample digestion, the existing literature on greenness evaluation procedures is scarce. These evaluations are predominantly applied to chromatographic methods, which typically involve the use of higher quantities of chemicals [82]. However, in several papers, the authors used the abovementioned tools to assess the green character of developed methods. For instance, Pereia Junior et al. [83] developed a sample preparation method for the determination of As, Ca, Cd, Cu, Cr, K, Fe, P, Pb, Mg, Mn, Na, Sr, and Zn in medicinal herbs by digestion in a closed digester block prior to ICP-OES measurement. The optimized parameters for digesting 0.10 g of a medicinal herb sample were as follows: a heating period of 120 min at 180 °C was employed, utilizing a mixture comprising 1.38 mL of 65% HNO3, 1.00 mL of 30% H2O2, and 2.62 mL of deionized water. The AGREE metric yielded a score of 0.63, thereby establishing the method’s environmental friendliness [83]. In a study by Ncube et al. [84], a microwave-assisted digestion method was developed for the determination of arsenic, cadmium, chromium, lead, and tin in pet food samples. Hydrogen peroxide was used as a digestion reagent, and subsequent metal determination was conducted using inductively coupled plasma optical emission spectrometry (ICP-OES). The AGREEprep metric instrument was employed by the authors to evaluate the method’s green degree, resulting in a score of 0.76, which confirmed its green nature [84].
2.2. Combustion and Acid Digestion
Plant samples contain high amounts of organic substances, so their incineration may be very suitable for sample digestion. Practically, in this way, the organic matrix is eliminated in the form of CO2 and H2O, while the remaining residue after burning represents inorganic substances that diluted mineral acids can dissolve. Table 2 shows several selected examples of combustion followed by dissolving the resulting residue for element measurement in plant samples.
Table 2.
Examples of combustion and wet acid digestion of ashes for element extraction from plant samples.
In general, the methods based on combustion involve relatively simple equipment. The amount of the analyzed sample can be higher than in direct microwave digestion because the decomposition of organic matter is made separately, generally in open vessels, and thus does not produce high pressure. The mass of the resulting ash is much lower than that of the initial sample and can be dissolved with diluted mineral acids [55,89,90,91]. However, this process is longer than direct acid digestion, and the risk of contamination or analyte loss may appear due to the multiple steps involved. Thus, the entire procedure should be carefully conducted.
2.3. Dissolving, Complexing, and Green Extraction Methods
Even though the metals were analyzed after acid digestion in most reported studies, several papers reported the extraction of metals with different other types of reagents, or in mixtures of diluted acids. For example, Butorova et al. [25] measured the metals concentration in the ethanol/water extracts.
Deep eutectic solvents (DESs) are newly reported as environmentally friendly solvents for metal extraction from samples with organic matrices, including from plant samples. DESs involve a system formed from a hydrogen bond donor (HBD) and an acceptor (HBA) [92,93]. This system decreases the melting point so that the extraction can be performed even at room temperature. The typical HBA is choline chloride, which is a natural compound. Many substances, such as tartaric, citric, benzoic, oxalic, acetic, malonic, malic, formic, maleic, succinic, adipic, boric, lactic, ascorbic, gallic, and mandelic acids; 1,4-butanediol; glycerol; sorbitol; ethylene glycol; triethylene glycol; benzamide; urea; thiourea; fructose; glucose; sucrose; and maltose have been tested as HDB [92,94]. Table 3 displays some examples of metals extraction from plant samples by extraction with solvents, including DES as green solvents.
Table 3.
Examples of procedures for element extraction with complexing reagents and green solvents.
The number of published papers on this topic is relatively limited, while the tools for assessing the greenness of analytical methods have rarely been employed. Abellan-Martín and co-workers [101] developed a methodology for the measurement of As, Cd, Hg, and Pb in drugs by ICP OES, based on chemical vapor generation subsequent to dispersive liquid–liquid microextraction using a natural deep eutectic solvent as the extractant. An 50-fold improvement of LOQs was reported. The developed method was demonstrated to have an excellent green character using the AGREEprep metrics, as evidenced by the AGREEprep score of 0.40 [101]. Sihlahla et al. [102] used alcohol-based deep eutectic solvents (DES) for sample digestion and determination of Se by ICP-OES. DES were prepared from choline chloride (ChCl) as a HBA and phenol as a HBD, in different molar ratios. A 0.1 g sample was mixed with 4 mL of the DES and shaken for 3 min using a vortex. The sample was digested for 25 min at 125 °C. Following cooling to room temperature, 4 mL of 3 M NHO3 was added. The greenness of the method was evaluated using three metrics tools: NEMI, AES, and AGREE, and it was demonstrated that the developed protocol is an excellent green method [102]. Given the paucity of existing literature on this subject, further research is required to develop more environmentally friendly techniques for the determination of metals by ICP-OES, as well as to assess their sustainability using the existing assessment tools.
2.4. Extraction for Bioaccesibility Studies on Plant Samples
The total concentration of metals in vegetal foodstuffs is not totally transferred and absorbed by the human body. Thus, recent studies on metal content in edible plants focused on assessing the fraction of the metal released into the food matrix in similar conditions to those from the gastrointestinal tract that can be transferred to the body. This portion of elements is referred to as bioaccessible concentration [103,104]. Table 4 presents several examples of digestion methods used in bioaccessibility studies.
Table 4.
Examples of digestion methods used in bioaccesibility studies on plant samples.
The studies dealing with the bioaccessibility of metals from different plants used fresh or dried samples, from which metals are extracted in simulated body fluids (SBF) having similar pH and enzymes (pepsin, pancreatin, amylase) with those from gastrointestinal tract, and being kept for a similar time of contact (saliva, pH @ 6.8, 5 min; gastric juice pH = 2–3, 1 h; duodenal juice, pH = 6.5–7.0, 3 h) [41]. This method of analyzing bioaccessible fractions of trace elements is a good surrogate of bioavailable concentration and has received acceptance [105].
3. Advantages, Limitations and Advances in Plasma Viewing, Sample Introduction Systems and Miniaturization of Optical Emission Spectrometry Instrumentation
The main advantage of ICP-OES is that it is capable of multielement determination over a wide range of element concentrations, making it a very productive technique compared with atomic absorption-based methods. As the main drawbacks, the limits of detection (LODs) and limits of quantification (LOQs), which are higher than in ICP-MS or GFAAS, make this sometimes not suitable for direct analysis of toxic elements in plants or vegetables used as foodstuffs due to their very low maximum admitted levels. For this reason, efforts have been made in recent years to improve the mentioned parameters by new approaches in producing plasma, sample introduction systems, plasma viewing, or detection systems [10,106,107].
Inductively coupled plasma (ICP) is generated in an inert gas (typically argon) in a torch having three concentric tubes made of quartz or ceramic, with the aid of a radiofrequency (RF) generator and an induction coil [108]. Legally, authorized frequencies for plasma generators are 27.12 MHz and 40.68 MHz, but the frequency of 40.68 MHz is increasingly used in modern equipment because it ensures higher plasma stability and establishes a higher central channel into the ICP, helping in the more accessible introduction of the sample, conducting to increased performance [109].
Concerning plasma viewing, there are two possibilities for observing the light emitted by the plasma: radial and axial view. Both viewing modes have advantages and disadvantages. In radial mode, the analytical signals are lower, which can lead to higher detection limits. In the case of elements found at trace concentrations, this represents a clear disadvantage. However, for major elements or elements with a high sensitivity, this is an advantage, because no dilution of sample is required. Moreover, the background signal is lower in this case; thus, the matrix effect is decreased [109]. Axially viewed plasma has the advantage of collecting all the element emissions over the whole length of the plasma, and thus, the emission path length is enhanced compared to radial view [110]. This has an effect on the increased sensitivity for trace elements, but this comes with the disadvantages of increased background signal and with the signal saturation for analytes in high concentrations or with high sensitivity (e.g., sodium, potassium, lithium, strontium, etc.). For these reasons, one of the advances in ICP-OES instruments was dual viewing (axial and radial). In this approach, the viewing mode can be selected for each specific element, taking advantage of the plasma viewing mode in multielement analysis.
Another advance in ICP-OES systems was made in sample introduction systems. Nebulization efficiency was improved by the development of ultrasonic nebulizers, which generate higher aerosol amounts up to 10-fold. In an ultrasonic nebulizer, the sample is injected into a piezoelectric transducer, which destroys the sample into a homogeneous fine aerosol, decreasing the limits of detections compared to a pneumatic nebulizer [111]. Chemical vapor generation was another approach developed to improve the analytical performances of ICP-OES. In this technique, the analyte is extracted as a gas from the matrix, and it is selectively and more efficiently introduced into the equipment, obtaining excellent improvements in LODs [112,113,114,115].
The miniaturization of ICP-OES equipment is a growing trend in research aimed at making this analytical technique more economically sustainable and practical for on-site applications. The critical aspects of the advances in the miniaturization of ICP-OES instruments are the miniaturized components [116]. Microplasma technology involves the use of microtorches with microplasmas that run at low power consumption and small gas flow rates [117,118,119]. However, this is still at the research level, and future developments are needed for producing commercial equipment.
4. Method Validation and Performance Parameters for ICP-OES Used in Plant Sample Analysis
Because digested plant samples comprise complex matrices, ICP-OES measurements need studies on the method’s performance in the validation process to obtain reliable results. In these types of samples, both spectral and non-spectral interference may occur. Other spectral wavelengths can be selected to solve the problem of spectral interferences if the sensitivity is not severely affected. Another possibility is using spectral corrections with spectrometer software, which is available for many commercial instruments. The minimization or removal of non-spectral or matrix interferences is usually obtained in three ways: (1) using “matrix matching” calibration standards for instrument calibration, (2) using the standard addition method, or (3) using internal standards added in blanks, calibration solutions and the samples, with the condition that internal standard is absent in these solutions and has a similar behavior in the plasma to the analytes [120]. However, the method development step should carefully study all three methods to obtain good accuracy. Table 5 gives examples of figures of merit reported for element determination in plants using ICP-OES.
Table 5.
Figures of merit reported in plant analysis by ICP-OES.
The most studied performance parameters in plant analysis by ICP-OES were LODs/LOQs, precision in terms of repeatability and reproducibility, and accuracy in terms of studying recovery using certified reference materials or spiked samples. Generally, satisfactory performances were reported for accuracy and precision, the two parameters used for quality control in ICP-OES, within the acceptability criteria. Although CRMs with the same matrices as the sample matrix were unavailable, accuracy assessment was reported by analyzing CRMs with similar matrices. For example, Giacomino et al. [60] used a tomato leaf CRM for quality control of vegetal oil analysis, and the recoveries found were 75% to 101.5%. Higher recoveries (93.1–102.7%) were reported by González-Suárez et al. [88] for analysis of four CRMs of bovine liver, apple leaves, typical diet, and wheat flour. At the same time, the standard addition method was employed for recovery assessment for lithium. Sakar et al. [3] obtained recoveries of over 90% for analyzing metals in standard reference materials (SRMs) of tomato leaves and rice flour. Giraldo et al. [121] found that for Cd determination, recovery percentages for ICP-OES were similar to those by ICP-MS (over 90%). Also, similar recoveries (96.0–108.3%) were obtained by ICP-OES and ICP-MS techniques for elements analysis in CRMs after the ultrasound-assisted extraction method [122]. In all studies, the reported recoveries for CRM analysis indicated good accuracies compared with legal requirements [123].
The methods were generally validated in terms of selectivity, sensitivity, limits of detection and quantification, accuracy, and precision prior to their use for real sample analysis [124]. The ICP-OES is a versatile technique, mainly due to its multielement capability, with up to 70 elements measured at the same time and wide working ranges [125].
5. Conclusions
ICP-OES has been successfully used to analyze major and trace elements in plant samples. Although it has been 50 years since the first ICP-OES equipment was marketed, the technique remains a fascinating area of research. Of course, this technique can be applied to the analysis of many types of samples, but the analysis of plants is a niche analysis that requires special attention because of their organic matrix, as well as the need to determine trace and ultra-high concentrations. Many recently published papers deal with improving the sample preparation step. Because of the tendency in analytical chemistry to achieve greener methodologies, much research was carried out to replace or eliminate toxic reagents in sample preparation procedures. The regularly used procedures for element extraction from plant samples are based on acid digestion. This is aided by heating on a hot plate or often with microwaves. Because removing the organic matrix accomplishes an increased digestion efficiency, a supplementary step of sample combustion can be applied before acid extraction. Deep eutectic solvents are increasingly studied as environmentally friendly solvents for metal extraction prior to ICP-OES analysis. Another area of research extensively studied in the last years is the assessment of the bioaccessibility of different elements, mainly from plants used as food sources.
Regarding instrumental ICP-OES developments, many efforts have been made to lower LODs and LOQs through new plasma production methodologies, new sample introduction systems, and improvements in plasma viewing and detection systems. The miniaturization of ICP-OES instruments is a flourishing trend in research aimed at making this analytical technique more economical.
ICP-OES, a well-established technique in many laboratories, has been the focus of recent research aimed at validating ICP-OES-based methods to enhance their accuracy and precision. This comprehensive review not only brings together the recent applications of ICP-OES in various vegetable samples but also underscores its outstanding advantages. In conclusion, the ICP-OES continues to be a fascinating area of research, particularly in its potential to reduce initial and maintenance costs, and in its role in the development of greener sample preparation methodologies, a prospect that is sure to inspire our professional colleagues and researchers in the field.
Funding
This research was funded by Ministry of Research, Innovation and Digitization through Program 1—Development of the national research & development system, Subprogram 1.2—Institutional performance—Projects that finance the RDI excellence, contract no. 18PFE/30.12.2021 and through the Core Program within the National Research Development and Innovation Plan 2022–2027, carried out with the support of MCID, project no. PN 23 05.
Institutional Review Board Statement
Not applicable.
Informed Consent Statement
Not applicable.
Data Availability Statement
Not applicable.
Conflicts of Interest
The author declares no conflict of interest. The funders had no role in the design of the study; in the collection, analyses, or interpretation of data; in the writing of the manuscript, or in the decision to publish the results.
References
- Welna, M.; Szymczycha-Madeja, A.; Pohl, P. Novel ICP-OES-based method for the reliable determination of the total content of 15 elements in yerba mate drinks along with the determination of caffeine and the in vitro bioaccessibility of the compounds. Molecules 2023, 28, 3374. [Google Scholar] [CrossRef] [PubMed]
- Senila, M.; Cadar, O.; Senila, L.; Angyus, B.S. Simulated bioavailability of heavy metals (Cd, Cr, Cu, Pb, Zn) in contaminated soil amended with natural zeolite using diffusive gradients in thin-films (DGT) technique. Agriculture 2022, 12, 321. [Google Scholar] [CrossRef]
- Sarkar, M.I.U.; Islam, S.; Hosain, M.T.; Naidu, R.; Rahman, M.M. Distribution of essential and non-essential elements in rice-based products sold in Australian markets: Exposure assessment. J. Food Compos. Anal. 2023, 120, 105339. [Google Scholar] [CrossRef]
- Frentiu, T.; Ponta, M.; Senila, M.; Mihaltan, A.I.; Darvasi, E.; Frentiu, M.; Cordos, E. Evaluation of figures of merit for Zn determination in environmental and biological samples using EDL excited AFS in a new radiofrequency capacitively coupled plasma. J. Anal. At. Spectrom. 2010, 25, 739–742. [Google Scholar] [CrossRef]
- Senila, M.; Levei, E.; Miclean, M.; Senila, L.; Stefanescu, L.; Mărginean, S.; Ozunu, A.; Roman, C. Influence of pollution level on heavy metals mobility in soil from NW Romania. Environ. Eng. Manag. J. 2011, 10, 59–64. [Google Scholar] [CrossRef]
- Biolé, F.G.; Llamazares Vegh, S.; Bavio, M.; Tripodi, P.; Volpedo, A.V.; Thompson, G. Essential and non-essential elements in marine silverside Odontesthes argentinensis from southwestern Atlantic coast: Tissues bioaccumulation, biomagnification and public health risk assessment. Food Chem. Toxicol. 2024, 185, 114452. [Google Scholar] [CrossRef] [PubMed]
- Zeiner, M.; Šoltic, M.; Nemet, I.; Juranovic Cindric, I. Multielement determination in turmeric (Curcuma longa L.) using different digestion methods. Molecules 2022, 27, 8392. [Google Scholar] [CrossRef] [PubMed]
- Senila, M.; Cadar, O.; Senila, L.; Hoaghia, A.; Miu, I. Mercury determination in natural zeolites by thermal decomposition atomic absorption spectrometry: Method validation in compliance with requirements for use as dietary supplements. Molecules 2019, 24, 4023. [Google Scholar] [CrossRef]
- Hlodák, M.; Matúš, P.; Urík, M.; Korenková, L.; Mikusová, P.; Senila, M.; Diviš, P. Evaluation of various inorganic and biological extraction techniques suitability for soil mercury phytoavailable fraction assessment. Water Air Soil Pollut. 2015, 226, 198. [Google Scholar] [CrossRef]
- Douvris, C.; Vaughan, T.; Bussan, D.; Bartzas, G.; Thomas, R. How ICP-OES changed the face of trace element analysis: Review of the global application landscape. Sci. Total Environ. 2023, 905, 167242. [Google Scholar] [CrossRef] [PubMed]
- Gajek, M.; Wysocki, P.; Pawlaczyk, A.; Sac, Ł.; Szynkowska-Józwik, M.I. The elemental profile of beer available on Polish market: Analysis of the potential impact of type of packaging material and risk assessment of consumption. Molecules 2022, 27, 2962. [Google Scholar] [CrossRef] [PubMed]
- Leśniewicz, A.; Kurowska, D.; Pohl, P. Mineral constituents profiling of ready-to-drink nutritional supplements by Inductively Coupled Plasma Optical Emission Spectrometry. Molecules 2020, 25, 851. [Google Scholar] [CrossRef] [PubMed]
- Senila, M.; Resz, M.A.; Torok, I.; Senila, L. Nutritional composition and health risk of toxic metals of some edible wild mushrooms growing in a mining area of Apuseni Mountains, Western Carpathians. J. Food Compos. Anal. 2024, 128, 106061. [Google Scholar] [CrossRef]
- Petrean, I.A.; Micle, V.; Sur, I.M.; Șenilă, M. Characterization of sterile mining dumps by the ICP-OES analytical method: A case study from Baia Mare mining area (Maramures, Romania). Sustainability 2023, 15, 1158. [Google Scholar] [CrossRef]
- Senila, M. Real and simulated bioavailability of lead in contaminated and uncontaminated soils. J. Environ. Health Sci. Eng. 2014, 12, 108. [Google Scholar] [CrossRef]
- Anastas, P.T. Green Chemistry and the role of analytical methodology development. Crit. Rev. Anal. Chem. 1999, 29, 167–175. [Google Scholar] [CrossRef]
- Nowak, P.M.; Wietecha-Posłuszny, R.; Pawliszyn, J. White Analytical Chemistry: An approach to reconcile the principles of Green Analytical Chemistry and functionality. Trends Anal. Chem. 2021, 138, 116223. [Google Scholar] [CrossRef]
- Gałuszka, A.; Migaszewski, Z.; Namiesnik, J. The 12 principles of green analytical chemistry and the SIGNIFICANCE mnemonic of green analytical practices. Trends Anal. Chem. 2013, 50, 78–84. [Google Scholar] [CrossRef]
- Senila, M. Metal and metalloid monitoring in water by passive sampling—A review. Rev. Anal. Chem. 2023, 42, 20230065. [Google Scholar] [CrossRef]
- Roma, A.; Abete, M.C.; Brizio, P.; Picazio, G.; Caiazzo, M.; D’auria, J.L.; Esposito, M. Evaluation of trace elements in potatoes (Solanum tuberosum) from a suburban area of Naples, Italy: The “Triangle of Death”. J Food Prot. 2017, 80, 1167–1171. [Google Scholar] [CrossRef]
- Can, H.; Ozyigit, I.I.; Can, M.; Hocaoglu-Ozyigit, A.; Yalcin, I.E. Multidimensional scaling of the mineral nutrient status and health risk assessment of commonly consumed fruity vegetables marketed in Kyrgyzstan. Biol. Trace Elem. Res. 2022, 200, 1902–1916. [Google Scholar] [CrossRef] [PubMed]
- Baumgärtel, C.; Götzke, L.; Weigand, J.J.; Christoph, N.; Panzo, M.H.G.; Afonso, F.; Lautenschläger, T. Beneficial or hazardous? A comprehensive study of 24 elements from wild edible plants from Angola. J. Appl. Bot. Food Qual. 2023, 96, 30–40. [Google Scholar] [CrossRef]
- Bashir, S.; Hussain, Q.; Shaaban, M.; Hu, H. Efficiency and surface characterization of different plant derived biochar for cadmium (Cd) mobility, bioaccessibility and bioavailability to Chinese cabbage in highly contaminated soil. Chemosphere 2018, 211, 632–639. [Google Scholar] [CrossRef] [PubMed]
- Li, X.; Luo, Y.; Zeng, C.; Zhong, Q.; Xiao, Z.; Mao, X.; Cao, F. Selenium accumulation in plant foods and selenium intake of residents in a moderately selenium-enriched area of Mingyueshan, Yichun, China. J. Food Compos. Anal. 2023, 116, 105089. [Google Scholar] [CrossRef]
- Butorova, L.; Polovka, M.; Porizka, J.; Vitova, E. Multi-experimental characterization of selected medical plants growing in the Czech Republic. Chem. Pap. 2017, 71, 1605–1621. [Google Scholar] [CrossRef]
- Ghasemidehkordi, B.; Malekirad, A.A.; Nazem, H.; Fazilati, M.; Salavati, H.; Shariatifar, N.; Rezaei, M.; Fakhri, Y.; Khaneghah, A.M. Concentration of lead and mercury in collected vegetables and herbs from Markazi province, Iran: A non-carcinogenic risk assessment. Food Chem. Toxicol. 2018, 113, 204–210. [Google Scholar] [CrossRef] [PubMed]
- Mahlangeni, N.T.; Moodley, R.; Jonnalagadda, S.B. Uptake, translocation, and bioaccumulation of elements in forest nettle (Laportea alatipes). Anal. Lett. 2019, 52, 1050–1067. [Google Scholar] [CrossRef]
- Houdegbe, A.C.; Achigan-Dako, E.G.; Sogbohossou, E.O.D.; Schranz, M.E.; Odindo, A.O.; Sibiya, J. Leaf elemental composition analysis in spider plant [Gynandropsis gynandra L. (Briq.)] differentiates three nutritional groups. Front. Plant Sci. 2022, 13, 841226. [Google Scholar] [CrossRef] [PubMed]
- Bankaji, I.; Kouki, R.; Dridi, N.; Ferreira, R.; Hidouri, S.; Duarte, B.; Sleimi, N.; Caçador, I. Comparison of digestion methods using atomic absorption spectrometry for the determination of metal levels in plants. Separations 2023, 10, 40. [Google Scholar] [CrossRef]
- Kohrman, H.; Chamberlain, C.P. Heavy metals in produce from urban farms in the San Francisco Bay area. Food Addit. Contam. B 2014, 7, 127–134. [Google Scholar] [CrossRef] [PubMed]
- Norton, G.J.; Deacon, C.M.; Mestrot, A.; Feldmann, J.; Jenkins, P.; Baskaran, C.; Meharg, A.A. Cadmium and lead in vegetable and fruit produce selected from specific regional areas of the UK. Sci. Total Environ. 2015, 533, 520–527. [Google Scholar] [CrossRef] [PubMed]
- Giri, A.; Bharti, V.K.; Kalia, S.; Acharya, S.; Kumar, B.; Chaurasia, O.P. Health risk assessment of heavy metals due to wheat, cabbage, and spinach consumption at cold-arid high altitude region. Biol. Trace Elem. Res. 2022, 200, 4186–4198. [Google Scholar] [CrossRef] [PubMed]
- Islam, M.S.; Kormoker, T.; Mazumder, M.; Anika, S.E.; Islam, M.T.; Hemy, D.H.; Mimi, U.S.; Proshad, R.; Kabir, M.H.; Idris, M.A. Trace elements concentration in soil and plant within the vicinity of abandoned tanning sites in Bangladesh: An integrated chemometric approach for health risk assessment. Toxin Rev. 2022, 41, 752–767. [Google Scholar] [CrossRef]
- Barin, J.S.; Mello, P.A.; Mesko, M.F.; Duarte, F.A.; Flores, E.M. Determination of elemental impurities in pharmaceutical products and related matrices by ICP-based methods: A review. Anal. Bioanal. Chem. 2016, 408, 4547–4566. [Google Scholar] [CrossRef] [PubMed]
- Kritsananuwat, R.; Sahoo, S.K.; Arae, H.; Fukushi, M. Distribution of 238U and 232Th in selected soil and plant samples as well as soil to plant transfer factors around Southern Thailand. J. Radioanal. Nucl. Chem. 2015, 303, 2571–2577. [Google Scholar] [CrossRef]
- Alhogbi, B.G.; Al-Ansari, S.A.; El-Shahawi, M.S. A comparative study on the bioavailability and soil-to-plant transfer factors of potentially toxic element contamination in agricultural soils and their impacts: A case study of dense farmland in the western region of Saudi Arabia. Processes 2023, 11, 2515. [Google Scholar] [CrossRef]
- Anschau, K.F.; Enders, M.S.P.; Senger, C.M.; Duarte, F.A.; Dressler, V.L.; Muller, E.I. A novel strategy for medical foods digestion and subsequent elemental determination using inductively coupled plasma optical emission spectrometry. Microchem. J. 2019, 147, 1055–1060. [Google Scholar] [CrossRef]
- Bakkali, K.; Martos, N.R.; Souhail, B.; Ballesteros, E. Determination of heavy metal content in vegetables and oils from Spain and Morocco by inductively coupled plasma mass spectrometry. Anal. Lett. 2012, 45, 907–919. [Google Scholar] [CrossRef]
- Iqbal, S.Z.; Ullah, Z.; Asi, M.R.; Jinap, S.; Ahmad, M.N.; Sultan, M.T.; Malik, N. Heavy metals in selected vegetables from markets of Faisalabad, Pakistan. J. Food Prot. 2018, 81, 806–809. [Google Scholar] [CrossRef]
- Izquierdo-Díaz, M.; Holm, P.E.; Barrio-Parra, F.; De Miguel, E.; Lekfeldt, J.D.S.; Magid, J. Urban allotment gardens for the biomonitoring of atmospheric trace element pollution. J. Environ. Qual. 2019, 48, 518–525. [Google Scholar] [CrossRef] [PubMed]
- Kohzadi, S.; Shahmoradi, B.; Ghaderi, E.; Loqmani, H.; Maleki, A. Concentration, source, and potential human health risk of heavy metals in the commonly consumed medicinal plants. Biol. Trace Elem. Res. 2019, 187, 41–50. [Google Scholar] [CrossRef] [PubMed]
- Luo, L.; Shen, Y.; Wang, X.; Chu, B.; Xu, T.; Liu, Y.; Zeng, Y.; Liu, J. Phytoavailability, bioaccumulation, and human health risks of metal(loid) elements in an agroecosystem near a lead-zinc mine. Environ. Sci. Pollut. Res. Int. 2018, 25, 24111–24124. [Google Scholar] [CrossRef] [PubMed]
- Pereira, M.; Tissot, F.; Faccio, R.; Ibáñez, F.; Pistón, M. A simple and economical ultrasound-assisted method for Cd and Pb extraction from fruits and vegetables for food safety assurance. Results Chem. 2021, 3, 100089. [Google Scholar] [CrossRef]
- Popović-Djordjević, J.B.; Kostić, A.Ž.; Rajković, M.B.; Miljković, I.; Krstić, Đ.; Caruso, G.; Siavash Moghaddam, S.; Brčeski, I. Organically vs. conventionally grown vegetables: Multi-elemental analysis and nutritional evaluation. Biol. Trace. Elem. Res. 2022, 200, 426–436. [Google Scholar] [CrossRef] [PubMed]
- Ruchuwararak, P.; Intamat, S.; Tengjaroenkul, B.; Neeratanaphan, L. Bioaccumulation of heavy metals in local edible plants near a municipal landfill and the related human health risk assessment. Hum. Ecol. Risk Assess. 2019, 25, 1760–1772. [Google Scholar] [CrossRef]
- Sage, L.; Bassetti, O.; Johnson, E.; Shakya, K.; Weston, N. Assessment of heavy metal contamination in soil and produce of Philadelphia community gardens. Environ. Pollut. Bioavail. 2023, 35, 2209283. [Google Scholar] [CrossRef]
- Shen, M.; Chen, L.; Han, W.; Ma, A. Methods for the determination of heavy metals in indocalamus leaves after different preservation treatment using inductively-coupled plasma mass spectrometry. Microchem. J. 2018, 139, 295–300. [Google Scholar] [CrossRef]
- Silva, P.S.C.; Francisconi, L.S.; Gonçalves, R.D.M.R. Evaluation of major and trace elements in medicinal plants. J. Braz. Chem. Soc. 2016, 27, 2273–2289. [Google Scholar] [CrossRef]
- Squadrone, S.; Brizio, P.; Griglione, A.; Falsetti, S.; Curcio, A.; Abete, M.C. Aluminium occurrence in plant feed from Northwestern Italy. J. Trace Elem. Med. Biol. 2021, 68, 126850. [Google Scholar] [CrossRef] [PubMed]
- Tadesse, A.W.; Gereslassie, T.; Yan, X.; Wang, J. Determination of heavy metal concentrations and their potential sources in selected plants: Xanthium strumarium L. (Asteraceae), Ficus exasperata Vahl (Moraceae), Persicaria attenuata (R.Br) Sojak (Polygonaceae), and Kanahia laniflora (Forssk.) R.Br. (Asclepiadaceae) from Awash River Basin, Ethiopia. Biol. Trace Elem. Res. 2019, 191, 231–242. [Google Scholar] [CrossRef]
- Tahir, M.A.; Shaheen, H.; Rathinasabapathi, B. Health risk associated with heavy metal contamination of vegetables grown in agricultural soil of Siran valley, Mansehra, Pakistan—A case study. Environ. Monit. Assess. 2022, 194, 551. [Google Scholar] [CrossRef] [PubMed]
- Uddin, A.H.; Khalid, R.S.; Alaama, M.; Abdualkader, A.M.; Kasmuri, A.; Abbas, S.A. Comparative study of three digestion methods for elemental analysis in traditional medicine products using atomic absorption spectrometry. J. Anal. Sci. Technol. 2016, 7, 6. [Google Scholar] [CrossRef]
- Ugulu, I.; Unver, M.C.; Dogan, Y. Potentially toxic metal accumulation and human health risk from consuming wild Urtica urens sold on the open markets of Izmir. Euro-Mediterr. J. Environ. Integr. 2019, 4, 36. [Google Scholar] [CrossRef]
- Usman, K.; Al Jabri, H.; Abu-Dieyeh, M.H.; Alsafran, M.H.S.A. Comparative Assessment of Toxic Metals Bioaccumulation and the Mechanisms of Chromium (Cr) Tolerance and Uptake in Calotropis procera. Front. Plant Sci. 2020, 11, 883. [Google Scholar] [CrossRef] [PubMed]
- Zhang, N.; Li, Z.; Zheng, J.; Yang, X.; Shen, K.; Zhou, T.; Zhang, Y. Multielemental analysis of botanical samples by ICP-OES and ICP-MS with focused infrared lightwave ashing for sample preparation. Microchem. J. 2017, 134, 68–77. [Google Scholar] [CrossRef]
- Zhuang, M.; Zhao, J.; Li, S.; Liu, D.; Wang, K.; Xiao, P.; Yu, L.; Jiang, Y.; Song, J.; Zhou, J.; et al. Concentrations and health risk assessment of rare earth elements in vegetables from mining area in Shandong, China. Chemosphere 2017, 168, 578–582. [Google Scholar] [CrossRef] [PubMed]
- Corrado, G.; Pannico, A.; Zarrelli, A.; Kyriacou, M.C.; De Pascale, S.; Rouphael, Y. Macro and trace element mineral composition of six hemp varieties grown as microgreens. J. Food Compos. Anal. 2022, 114, 104750. [Google Scholar] [CrossRef]
- Dobrowolska-Iwanek, J.; Zagrodzki, P.; Galanty, A.; Fołta, M.; Kryczyk-Kozioł, J.; Szlósarczyk, M.; Rubio, P.S.; Saraiva de Carvalho, I.; Pasko, P. Determination of essential minerals and trace elements in edible sprouts from different botanical families—Application of chemometric analysis. Foods 2022, 11, 371. [Google Scholar] [CrossRef]
- Abdi, L.; Aghaee, E.M.; Nazmara, S.; Alipour, M.R.; Fakhri, Y.; Khaneghah, A.M. Potentially toxic elements (PTEs) in corn (Zea mays) and soybean (Glycine max) samples collected from Tehran, Iran: A health risk assessment study. Int. J. Environ. Anal. Chem. 2020, 102, 4640–4651. [Google Scholar] [CrossRef]
- Giacomino, A.; Inaudi, P.; Silletta, G.; Diana, A.; Bertinetti, S.; Gaggero, E.; Malandrino, M.; Stilo, F.; Abollino, O. Analytical methods for the characterization of vegetable oils. Molecules 2023, 28, 153. [Google Scholar] [CrossRef] [PubMed]
- Karaś, K.; Zioła-Frankowska, A.; Bartoszewicz, M.; Krzyśko, G.; Frankowski, M. Investigation of chocolate types on the content of selected metals and non-metals determined by ICP-OES analytical technique. Food Addit. Contam. Part A 2020, 38, 293–303. [Google Scholar] [CrossRef] [PubMed]
- Khaleeq, A.; Ahmed, M.; Huma, R.; Mujtaba, A.; Noor, S.; Rehman, R.; Sheikh, T.A.; Qamar, S.; Iqbal, D.N.; Alharthy, R.D.; et al. Evaluation of trace and heavy metals in different varieties of sauces to characterize their impact on human health. J. Food Compos. Anal. 2022, 114, 104789. [Google Scholar] [CrossRef]
- Manousi, N.; Isaakidou, E.; Zachariadis, G.A. An inductively coupled plasma optical emission spectrometric method for the determination of toxic and nutrient metals in spices after pressure-assisted digestion. Appl. Sci. 2022, 12, 534. [Google Scholar] [CrossRef]
- Mehri, F.; Heshmati, A.; Ghane, E.T.; Mahmudiono, T.; Fakhri, Y. Concentration of Heavy Metals in Traditional and Industrial Fruit Juices from Iran: Probabilistic Risk Assessment Study. In Biological Trace Element Research; Springer: Berlin/Heidelberg, Germany, 2024. [Google Scholar] [CrossRef]
- Pastor, K.; Nastić, N.; Ilić, M.; Skendi, A.; Stefanou, S.; Ačanski, M.; Rocha, J.M.; Papageorgiou, M. A screening study of elemental composition in legume (Fabaceae sp.) cultivar from Serbia: Nutrient accumulation and risk assessment. J. Food Compos. Anal. 2024, 130, 106127. [Google Scholar] [CrossRef]
- Sharafi, K.; Mansouri, B.; Omer, A.K.; Bashardoust, P.; Ebrahimzadeh, G.; Sharifi, S.; Massahi, T.; Soleimani, H. Investigation of health risk assessment and the effect of various irrigation water on the accumulation of toxic metals in the most widely consumed vegetables in Iran. Sci. Rep. 2022, 12, 20806. [Google Scholar] [CrossRef] [PubMed]
- Jacimovic, S.; Popovic-Djordjevic, J.; Saric, B.; Krstic, A.; Mickovski-Stefanovic, V.; Pantelic, N.Ð. Antioxidant activity and multi-elemental analysis of dark chocolate. Foods 2022, 11, 1445. [Google Scholar] [CrossRef] [PubMed]
- Senila, M.; Resz, M.-A.; Senila, L.; Torok, I. Application of Diffusive Gradients in Thin-films (DGT) for assessing the heavy metals mobility in soil and prediction of their transfer to Russula virescens. Sci. Total Environ. 2024, 909, 168591. [Google Scholar] [CrossRef] [PubMed]
- Aldakheel, R.K.; Gondal, M.A.; Alsayed, H.N.; Almessiere, M.A.; Nasr, M.M.; Shemsi, A.M. Rapid determination and quantification of nutritional and poisonous metals in vastly consumed ayurvedic herbal medicine (Rejuvenator Shilajit) by humans using three advanced analytical techniques. Biol. Trace Elem. Res. 2022, 200, 4199–4216. [Google Scholar] [CrossRef] [PubMed]
- Al-Juhaimi, F.; Kulluk, D.A.; Mohamed Ahmed, I.A.; Özcan, M.M.; Adiamo, O. Quantitative determination of macro and micro elements and heavy metals accumulated in wild fruits analyzed by ICP-OES method. Environ. Monit. Assess. 2023, 195, 1370. [Google Scholar] [CrossRef] [PubMed]
- Martinez, S.; Sánchez, R.; Lefevre, J.; Todoli Torro, J. The accurate direct elemental analysis of fats and oils is accomplished according to a dilution and shot analysis method. J. Anal. At. Spectrom. 2020, 35, 1897–1909. [Google Scholar] [CrossRef]
- Taghizadeh, S.F.; Rezaee, R.; Boskabady, M.; Sardoo, H.M.; Karimi, G. Exploring the carcinogenic and non-carcinogenic risk of chemicals present in vegetable oils. Int. J. Environ. Anal. Chem. 2022, 102, 5756–5784. [Google Scholar] [CrossRef]
- Covaci, E.; Angyus, S.B.; Senila, M.; Ponta, M.; Darvasi, E.; Frentiu, M.; Frentiu, T. Eco-scale non-chromatographic method for mercury speciation in fish using formic acid extraction and UV–Vis photochemical vapor generation capacitively coupled plasma microtorch optical emission spectrometry. Microchem. J. 2018, 141, 155–162. [Google Scholar] [CrossRef]
- de la Guardia, M.; Garrigues, S. Challenges in Green Analytical Chemistry, 2nd ed.; The Royal Society of Chemistry: Cambridge, UK, 2020. [Google Scholar]
- Keith, L.H.; Gron, L.U.; Young, J.L. Green analytical methodologies. Chem. Rev. 2007, 107, 2695–2708. [Google Scholar] [CrossRef] [PubMed]
- Płotka-Wasylka, J. A new tool for the evaluation of the analytical procedure: Green Analytical Procedure Index. Talanta 2018, 181, 204–209. [Google Scholar] [CrossRef] [PubMed]
- Płotka-Wasylka, J.; Wojnowski, W. Complementary green analytical procedure index (ComplexGAPI) and software. Green Chem. 2021, 23, 8657. [Google Scholar] [CrossRef]
- Gałuszka, A.; Migaszewski, Z.M.; Konieczka, P.; Namieśnik, J. Analytical Eco-Scale for assessing the greenness of analytical procedures. TrAC Trends Anal. Chem. 2012, 37, 61–72. [Google Scholar] [CrossRef]
- Hicks, M.B.; Farrell, W.; Aurigemma, C.; Lehmann, L.; Weisel, L.; Nadeau, K.; Lee, H.; Moraff, C.; Wong, M.; Huang, Y.; et al. Making the move towards modernized greener separations: Introduction of the analytical method greenness score (AMGS) calculator. Green Chem. 2019, 21, 1816–1826. [Google Scholar] [CrossRef]
- Pena-Pereira, F.; Wojnowski, W.; Tobiszewski, M. Agree—Analytical GREEnness metric approach and software. Anal. Chem. 2020, 92, 10076–10082. [Google Scholar] [CrossRef]
- Wojnowski, W.; Tobiszewski, M.; Pena-Pereira, F.; Psillakis, E. AGREEprep–Analytical greenness metric for sample preparation. TrAC Trends Anal. Chem. 2022, 149, 116553. [Google Scholar] [CrossRef]
- Cetinkaya, A.; Kaya, S.I.; Ozkan, S.A. An overview of the current progress in green analytical chemistry by evaluating recent studies using greenness assessment tools. TrAC Trends Anal. Chem. 2023, 168, 117330. [Google Scholar] [CrossRef]
- Pereira Junior, J.B.; Carvalho, V.S.; Ferreira, W.Q.; Araujo, R.G.O.; Ferreira, S.L.C. Green sample preparation of medicinal herbs in closed digester block for elemental determination by ICP OES. J. Pharm. Biomed. Anal. 2024, 238, 115810. [Google Scholar] [CrossRef] [PubMed]
- Ncube, N.; Tancu, Y.; Mketo, N. A greener, rapid and accurate microwave-assisted hydrogen peroxide digestion method for ICP-OES determination of heavy metals in pet food samples. J. Food Compos. Anal. 2024, 131, 106201. [Google Scholar] [CrossRef]
- Igual, M.; Fernandes, Â.; Dias, M.I.; Pinela, J.; García-Segovia, P.; Martínez-Monzó, J.; Barros, L. The in vitro simulated gastrointestinal digestion affects the bioaccessibility and bioactivity of beta vulgaris constituents. Foods 2023, 12, 338. [Google Scholar] [CrossRef] [PubMed]
- Kfle, G.; Asgedom, G.; Goje, T.; Abbebe, F.; Habtom, L.; Hanes, H. The level of heavy metal contamination in selected vegetables and animal feed grasses grown in wastewater irrigated area, around Asmara, Eritrea. J. Chem. 2020, 2020, 1359710. [Google Scholar] [CrossRef]
- Tremlová, J.; Sehnal, M.; Száková, J.; Goessler, W.; Steiner, O.; Najmanová, J.; Horáková, T.; Tlustoš, P. A Profile of arsenic species in different vegetables growing in arsenic-contaminated soils. Arch. Agron. Soil Sci. 2017, 63, 918–927. [Google Scholar] [CrossRef]
- González-Suárez, S.; Paz-Montelongo, S.; Niebla-Canelo, D.; Alejandro-Vega, S.; González-Weller, D.; Rubio-Armendáriz, C.; Hardisson, A.; Gutiérrez-Fernández, Á.J. Baby food jars as a dietary source of essential (K, Na, Ca, Mg, Fe, Zn, Cu, Co, Mo, Mn) and toxic elements (Al, Cd, Pb, B, Ba, V, Sr, Li, Ni). Appl. Sci. 2022, 12, 8044. [Google Scholar] [CrossRef]
- Koch, W.; Czop, M.; Iłowiecka, K.; Nawrocka, A.; Wiacek, D. Dietary intake of toxic heavy metals with major groups of food products—Results of analytical determinations. Nutrients 2022, 14, 1626. [Google Scholar] [CrossRef] [PubMed]
- Padrón, P.; Paz, S.; Rubio, C.; Gutiérrez, Á.J.; González-Weller, D.; Hardisson, A. Trace element levels in vegetable sausages and burgers determined by ICP-OES. Biol. Trace Elem. Res. 2020, 194, 616–626. [Google Scholar] [CrossRef] [PubMed]
- Koch, W.; Czop, M.; Nawrocka, A.; Wiacek, D. Contribution of major groups of food products to the daily intake of selected elements—Results from analytical determinations supported by chemometric analysis. Nutrients 2020, 12, 3412. [Google Scholar] [CrossRef]
- Shishov, A.; Savinov, S.; Volodina, N.; Gurev, I.; Bulatov, A. Deep eutectic solvent-based extraction of metals from oil samples for elemental analysis by ICP-OES. Microchem. J. 2022, 179, 107456. [Google Scholar] [CrossRef]
- Yilmaz, E.; Soylak, M. A novel and simple deep eutectic solvent based liquid phase microextraction method for rhodamine B in cosmetic products and water samples prior to its spectrophotometric determination. Spectrochim. Acta A Mol. Biomol. Spectrosc. 2018, 202, 81–86. [Google Scholar] [CrossRef] [PubMed]
- Shishov, A.; Gerasimov, A.; Bulatov, A. Deep eutectic solvents based on carboxylic acids for metals separation from plant samples: Elemental analysis by ICP-OES. Food Chem. 2022, 366, 130634. [Google Scholar] [CrossRef] [PubMed]
- Torres, A.; Romero, I.; Sánchez, R.; Beltrán, A.; Guillena, G.; Todolí, J.L. Multielemental analysis of oils and animal fat by using deep eutectic solvents assisted by an aerosol phase extraction procedure. Talanta Open 2023, 7, 100234. [Google Scholar] [CrossRef]
- Santana, A.P.R.; Andrade, D.F.; Mora-Vargas, J.A.; Amaral, C.D.B.; Oliveira, A.; Gonzalez, M.H. Natural deep eutectic solvents for sample preparation prior to elemental analysis by plasma-based techniques. Talanta 2019, 199, 361–369. [Google Scholar] [CrossRef] [PubMed]
- Altunay, N.; Yildirim, E.; Gürkan, R. Extraction and preconcentration of trace Al and Cr from vegetable samples by vortex-assisted ionic liquid-based dispersive liquid-liquid microextraction prior to atomic absorption spectrometric determination. Food Chem. 2018, 245, 586–594. [Google Scholar] [CrossRef] [PubMed]
- Öner, M.; Bodur, S.; Demir, C.; Yazici, E.; Erarpat, S.; Bakirdere, S. An effective and rapid magnetic nanoparticle based dispersive solid phase extraction method for the extraction and preconcentration of cadmium from edible oil samples before ICP OES measurement. J. Food Compos. Anal. 2021, 101, 103978. [Google Scholar] [CrossRef]
- Askarpour, S.A.; Molaee-Aghaee, E.; Ghaderi-Ghahfarokhi, M.; Shariatifar, N.; Mahmudiono, T.; Sadighara, P.; Fakhri, Y. Potentially toxic elements (PTEs) in refined and cold-pressed vegetable oils distributed in Ahvaz, Iran: A probabilistic health risk assessment. Biol. Trace Elem. Res. 2023, 201, 4567–4575. [Google Scholar] [CrossRef] [PubMed]
- Nyaba, L.; Nomngongo, P.N. Determination of trace metals in vegetables and water samples using dispersive ultrasound-assisted cloud point-dispersive μ-solid phase extraction coupled with inductively coupled plasma optical emission spectrometry. Food Chem. 2020, 322, 126749. [Google Scholar] [CrossRef] [PubMed]
- Abellán-Martín, S.J.; Pérez, J.; Pinheiro, F.C.; Nóbrega, J.A.; Aguirre, M.Á.; Vidal, L.; Canals, A. Synergistic combination of natural deep eutectic solvent and chemical vapor generation for trace determination of As, Cd, Hg and Pb in drug samples by inductively coupled plasma optical emission spectrometry. Adv. Sample Prep. 2023, 7, 100084. [Google Scholar] [CrossRef]
- Sihlahla, M.; Mpupa, A.; Sojka, M.; Saeid, A.; Nomngongo, P.N. Determination of selenium in cereal and biofortified samples by ICP-OES using an alcohol-based deep eutectic solvent in digestion procedure. Adv. Sample Prep. 2023, 8, 100092. [Google Scholar] [CrossRef]
- Khoja, K.K.; Buckley, A.; Aslam, M.F.; Sharp, P.A.; Latunde-Dada, G.O. In vitro bioaccessibility and bioavailability of iron from mature and microgreen fenugreek, rocket and broccoli. Nutrients 2020, 12, 1057. [Google Scholar] [CrossRef] [PubMed]
- Tokalioğlu, Ş. Bioaccessibility of Cu, Mn, Fe, and Zn in fruit and vegetables by the in vitro UBM and statistical evaluation of the results. Biol. Trace Elem. Res. 2023, 201, 1538–1546. [Google Scholar] [CrossRef]
- Altundag, H.; Mutlu, E.; Altintig, E.; Tuzen, M. Effect of Cu, Fe, Mn, Ni, and Zn and bioaccessibilities in the hazelnuts growing in Sakarya, Turkey using in-vitro gastrointestinal extraction method. Biol. Trace Elem. Res. 2020, 194, 596–602. [Google Scholar] [CrossRef] [PubMed]
- Martins, C.A.; Scheffler, G.L.; Pozebon, D. Straightforward determination of U, Th, and Hf at trace levels using ultrasonic nebulization and axial view ICP OES. Anal. Methods 2016, 8, 504–509. [Google Scholar] [CrossRef]
- Özcan, M.M.; Yılmaz, F.G.; Kulluk, D.A. The accumulation of element and heavy metal concentrations in different parts of some carrot and radish types. Environ. Monit. Assess. 2023, 195, 754. [Google Scholar] [CrossRef] [PubMed]
- Beller, E.; Roessler, C.; Probst, U.; Thueringer, R.; Volkmar, C. A radio-frequency generator for ion thrusters based on a Class-E power circuit. J. Electr. Propuls. 2022, 1, 8. [Google Scholar] [CrossRef]
- Horiba Scientific. Available online: https://www.horiba.com/aut/scientific/technologies/inductively-coupled-plasma-optical-emission-spectroscopy-icp-oes/excitation-source/ (accessed on 7 June 2024).
- Perkin Elmer. Available online: https://resources.perkinelmer.com/lab-solutions/resources/docs/TCH_Avio-Series-ICP-OES-Vertical-Dual-wiew_013462_01.pdf (accessed on 7 June 2024).
- de Andrade, M.F.; da Silva, I.J.S.; Pimentel, M.F.; Paim, A.P.S.; Cervera, M.L.; de la Guardia, M. Ultrasonic nebulization inductively coupled plasma optical emission spectrometry method for wine analysis. Spectrochim. Acta Part B At. Spectrosc. 2020, 170, 105924. [Google Scholar] [CrossRef]
- García, M.; Aguirre, M.Á.; Canals, A. Determination of As, Se, and Hg in fuel samples by in-chamber chemical vapor generation ICP OES using a Flow Blurring® multinebulizer. Anal. Bioanal. Chem. 2017, 409, 5481–5490. [Google Scholar] [CrossRef] [PubMed]
- Cai, Z.; Wang, Z. Evaluation of solution anode glow discharge as a vapor generator in ICP-OES procedures: Application to highly sensitive determination of Cd and Hg. Anal. Chim. Acta 2022, 1203, 339724. [Google Scholar] [CrossRef] [PubMed]
- Shen, Y.; Zheng, C.; Jiang, X.; Wu, X.; Hou, X. Integration of hydride generation and photochemical vapor generation for multi-element analysis of traditional Chinese medicine by ICP-OES. Microchem. J. 2015, 123, 164–169. [Google Scholar] [CrossRef]
- Fornieles, A.C.; de Torres, A.G.; Alonso, E.V.; Pavón, J.M.C. Simultaneous determination of traces of Pt, Pd, and Ir by SPE-ICP-OES. Test for chemical vapor generation. Microchem. J. 2016, 124, 82–89. [Google Scholar] [CrossRef]
- Butaciu, S.; Senila, M.; Sarbu, C.; Ponta, M.; Tanaselia, C.; Cadar, O.; Roman, M.; Radu, E.; Sima, M.; Frentiu, T. Chemical modeling of groundwater in the Banat Plain, southwestern Romania, with elevated As content and co-occurring species by combining diagrams and unsupervised multivariate statistical approaches. Chemosphere 2017, 172, 127–137. [Google Scholar] [CrossRef] [PubMed]
- Zioła-Frankowska, A.; Frankowski, M. Determination of metals and metalloids in wine using inductively coupled plasma optical emission spectrometry and minitorch. Food Anal. Methods 2017, 10, 180–190. [Google Scholar] [CrossRef]
- Frentiu, T.; Butaciu, S.; Darvasi, E.; Ponta, M.; Senila, M.; Petreus, D.; Frentiu, M. Analytical characterization of a method for mercury determination in food using cold vapour capacitively coupled plasma microtorch optical emission spectrometry–compliance with European legislation requirements. Anal. Methods 2015, 7, 747–752. [Google Scholar] [CrossRef]
- Covaci, E.; Senila, M.; Tanaselia, C.; Angyus, S.B.; Ponta, M.; Darvasi, E.; Frentiu, M.; Frentiu, T. A highly sensitive eco-scale method for mercury determination in water and food using photochemical vapor generation and miniaturized instrumentation for capacitively coupled plasma microtorch optical emission spectrometry. J. Anal. At. Spectrom. 2018, 33, 799–808. [Google Scholar] [CrossRef]
- Drava, G.; Minganti, V. Influence of an internal standard in axial ICP OES analysis of trace elements in plant materials. J. Anal. At. Spectrom. 2020, 35, 301–306. [Google Scholar] [CrossRef]
- Giraldo, Y.R.; Sánchez, E.R.; Torres, L.G.; Montenegro, A.C.; Pichimata, M.A. Development of validation methods to determine cadmium in cocoa almond from the beans by ICP-MS and ICP-OES. Talanta Open 2022, 5, 100078. [Google Scholar] [CrossRef]
- Ul-Haq, I.; Ahmed, E.; Sharif, A.; Ahmed, M.; Ahmad, W. Optimization of ultrasound-assisted extraction of essential and non-essential/toxic trace metals in vegetables and their determination by FAAS and ICP-OES: An evaluation of human health risk. Food Anal. Methods 2021, 14, 2262–2275. [Google Scholar] [CrossRef]
- CAC/GL, 71, 22; Guidelines for the Design and Implementation of National Regulatory Food Safety Assurance Program Associated with the Use of Veterinary Drugs in Food Producing Animals. Codex Alimentarius. United Nations: New York, NY, USA, 2009.
- Liu, H.; Meng, Q.; Zhao, X.; Ye, Y.; Tong, H. Inductively coupled plasma mass spectrometry (ICP-MS) and inductively coupled plasma optical emission spectrometer (ICP-OES)-based discrimination for the authentication of tea. Food Control 2021, 123, 107735. [Google Scholar] [CrossRef]
- Khan, S.R.; Sharma, B.; Chawla, P.A.; Bhatia, R. Inductively coupled plasma optical emission spectrometry (ICP-OES): A powerful analytical technique for elemental analysis. Food Anal. Methods 2022, 15, 666–688. [Google Scholar] [CrossRef]
Disclaimer/Publisher’s Note: The statements, opinions and data contained in all publications are solely those of the individual author(s) and contributor(s) and not of MDPI and/or the editor(s). MDPI and/or the editor(s) disclaim responsibility for any injury to people or property resulting from any ideas, methods, instructions or products referred to in the content. |
© 2024 by the author. Licensee MDPI, Basel, Switzerland. This article is an open access article distributed under the terms and conditions of the Creative Commons Attribution (CC BY) license (https://creativecommons.org/licenses/by/4.0/).