


Differential Chemical Components Analysis of Periplocae Cortex, Lycii Cortex, and Acanthopanacis Cortex Based on Mass Spectrometry Data and Chemometrics

 , ,
, ,
Abstract
1. Introduction
2. Results
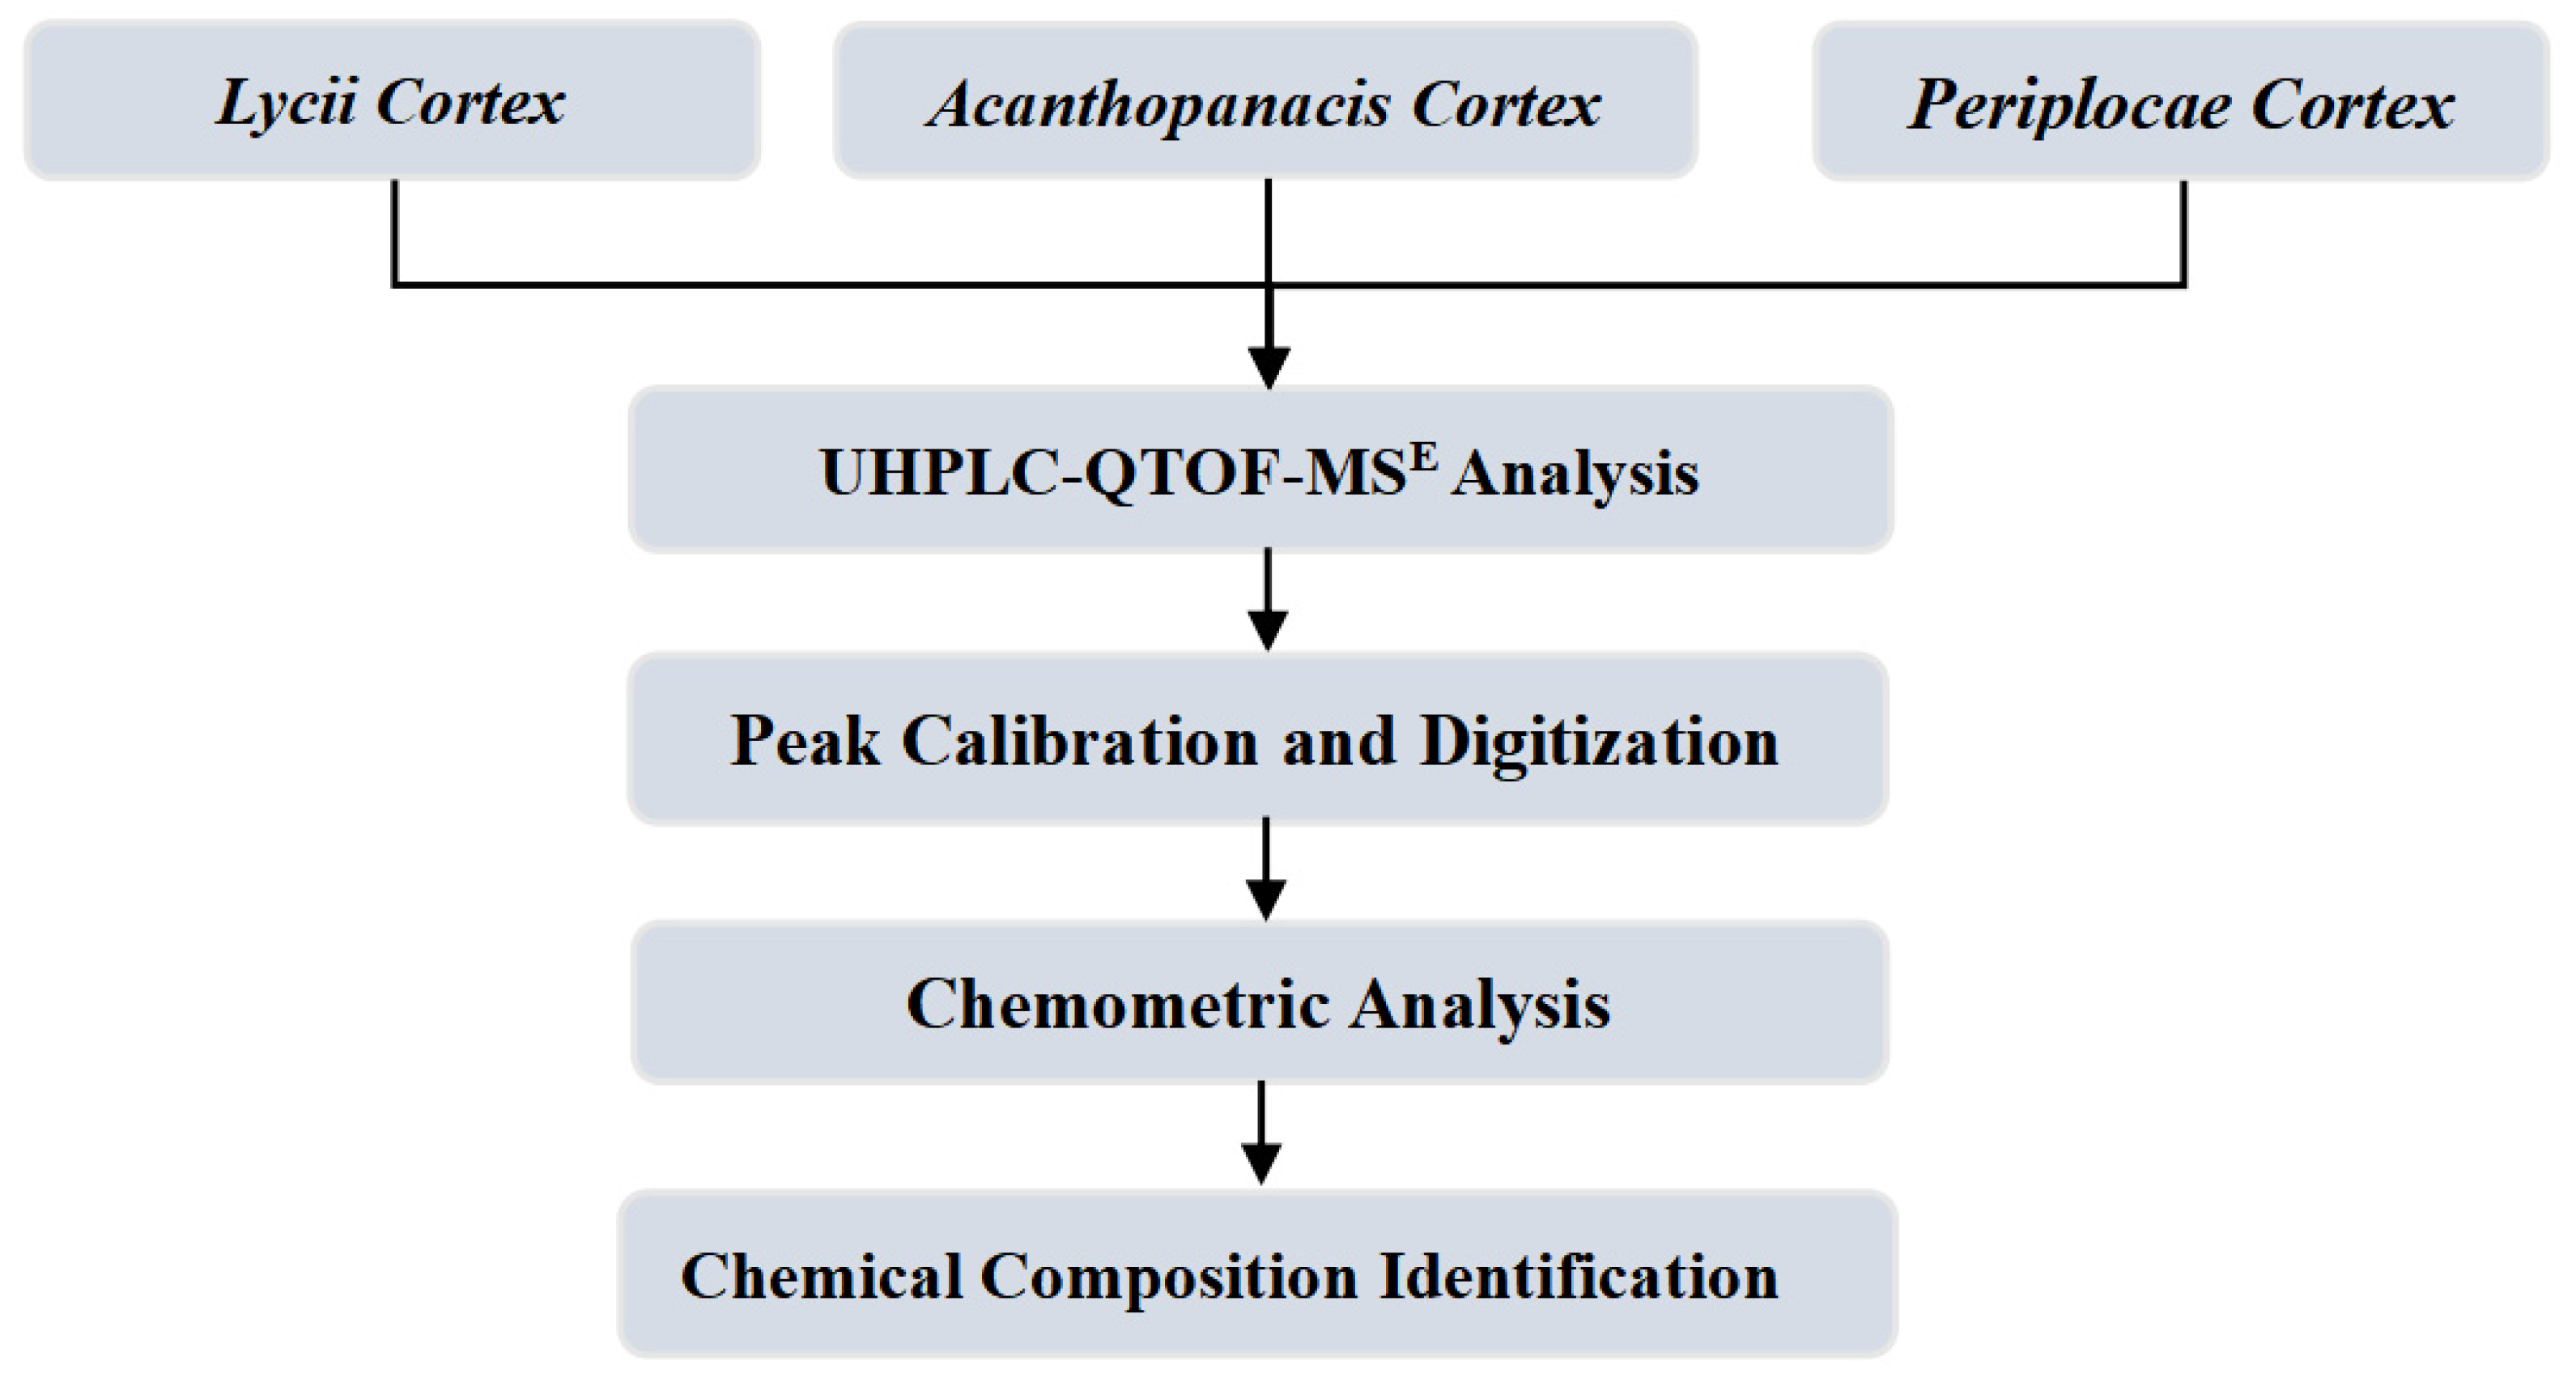
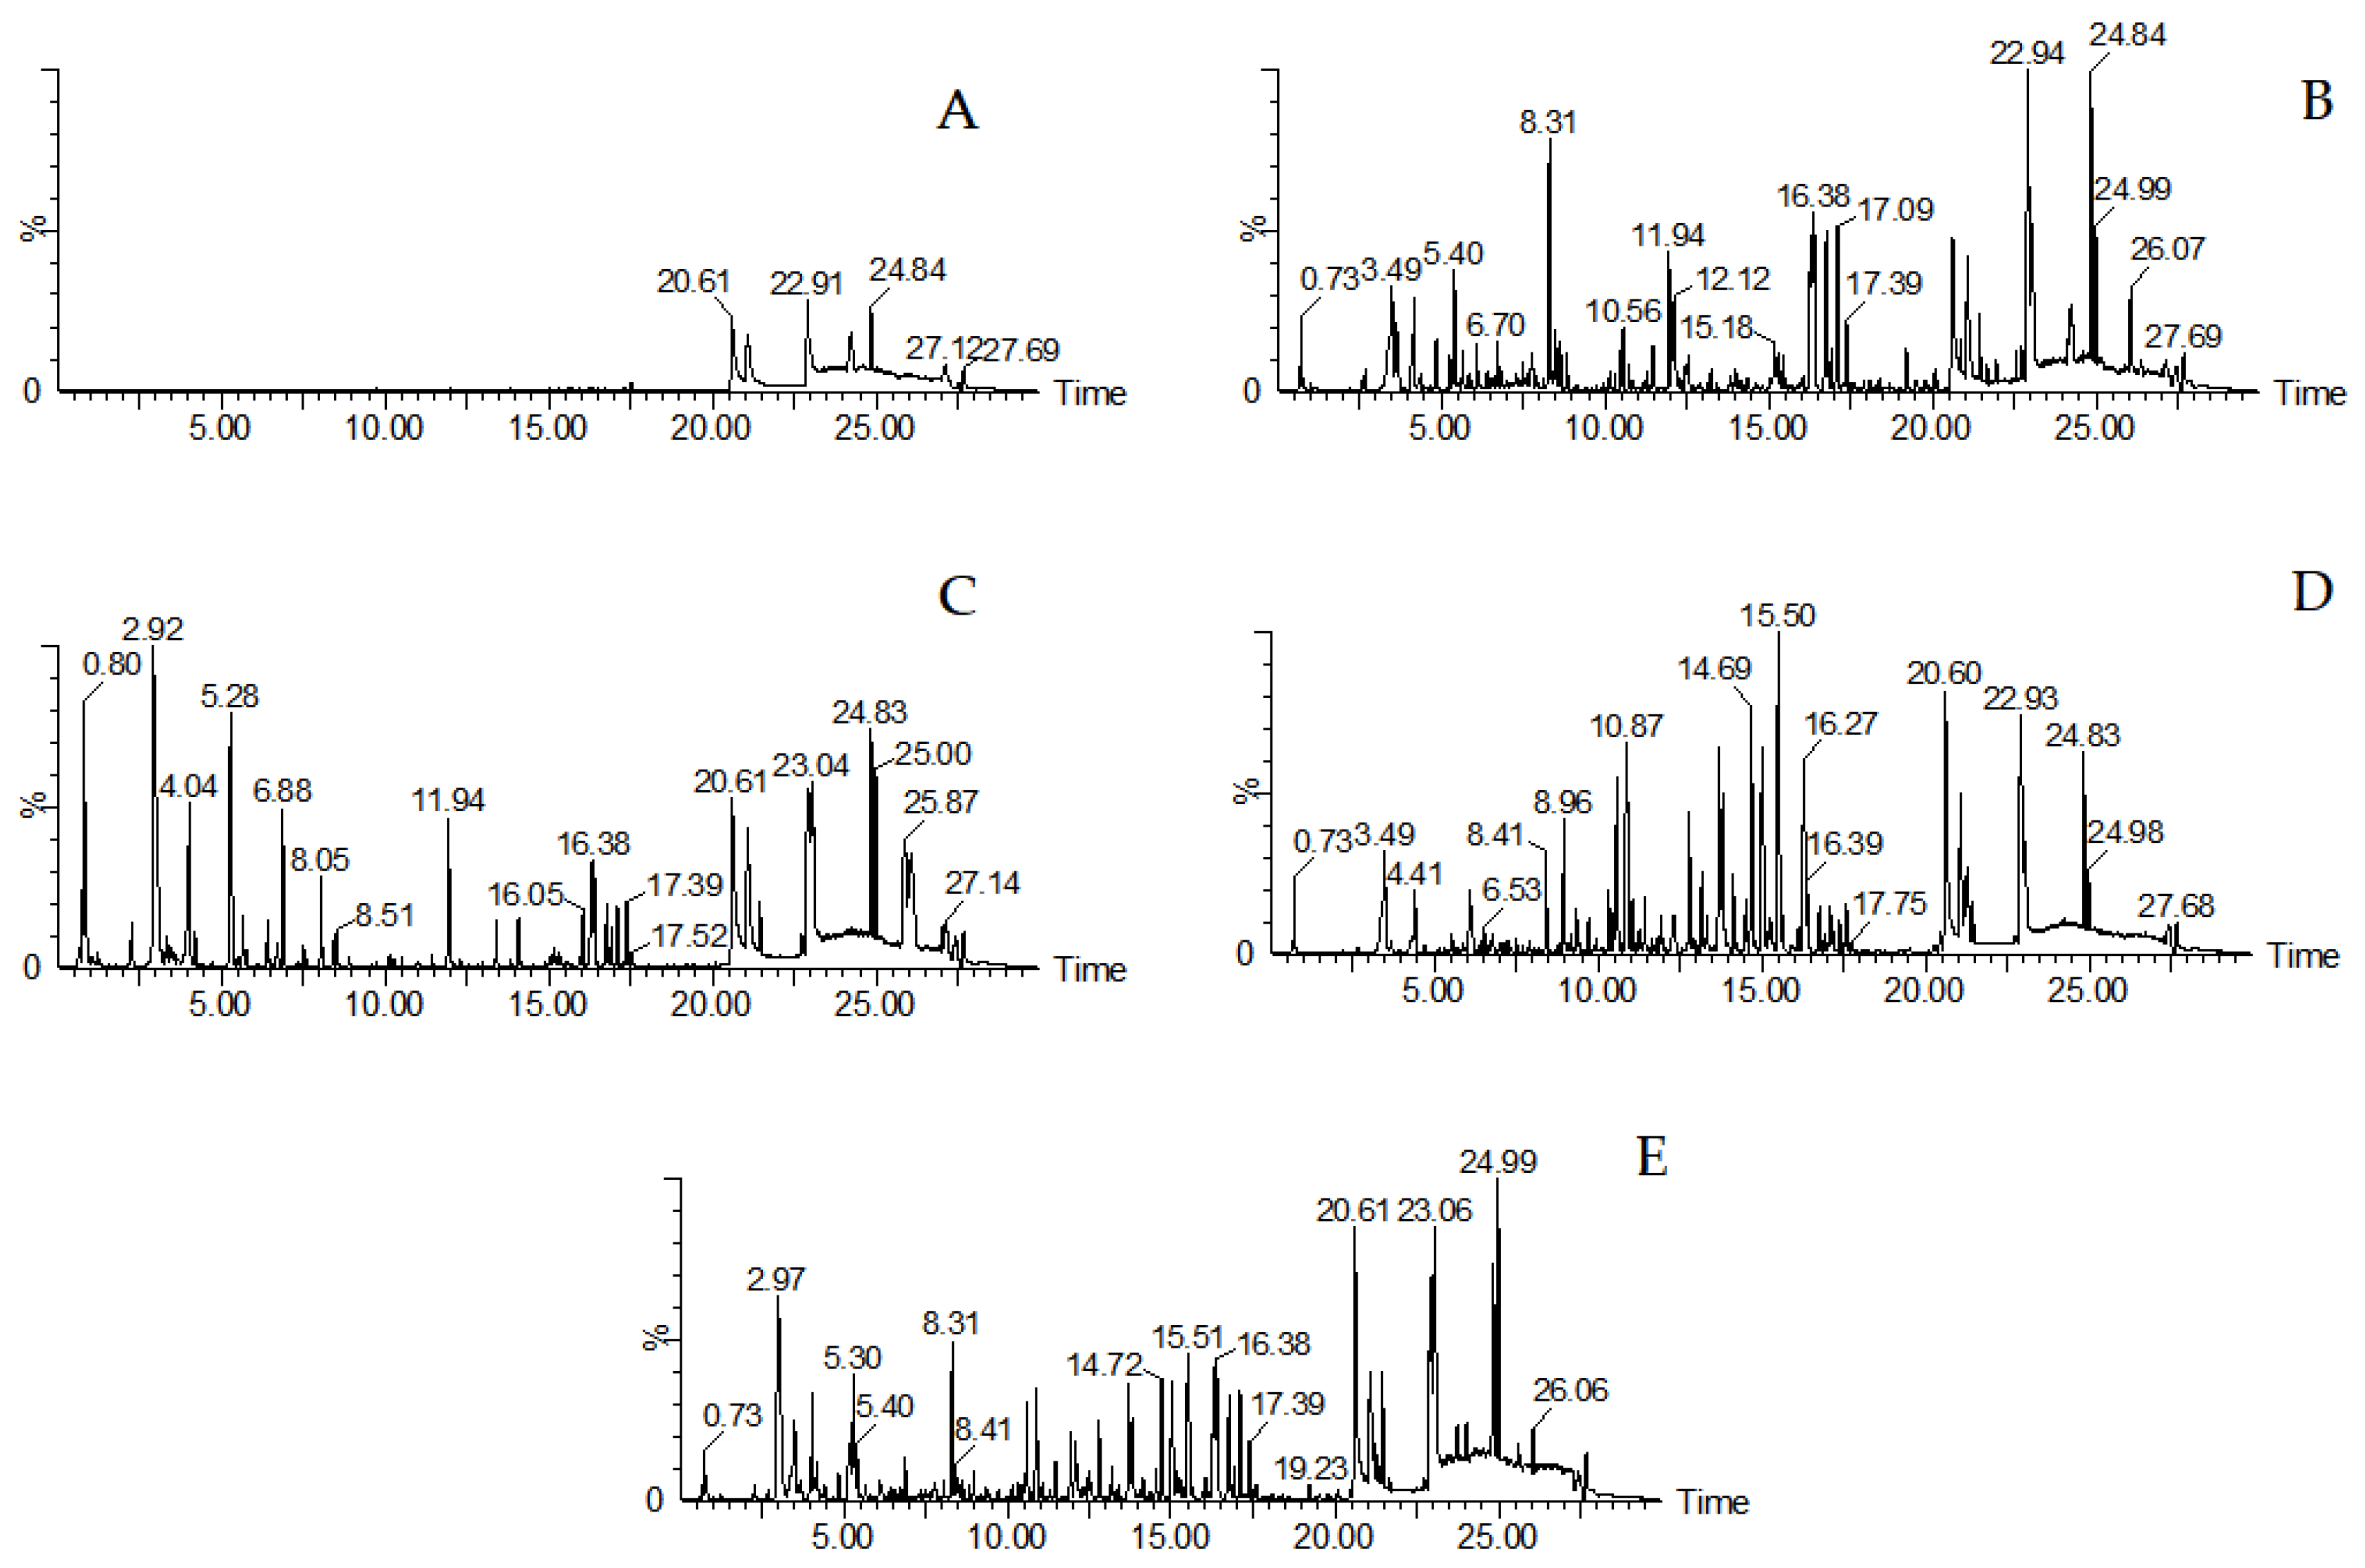
2.1. The Results of UHPLC-QTOF-MSE Analysis
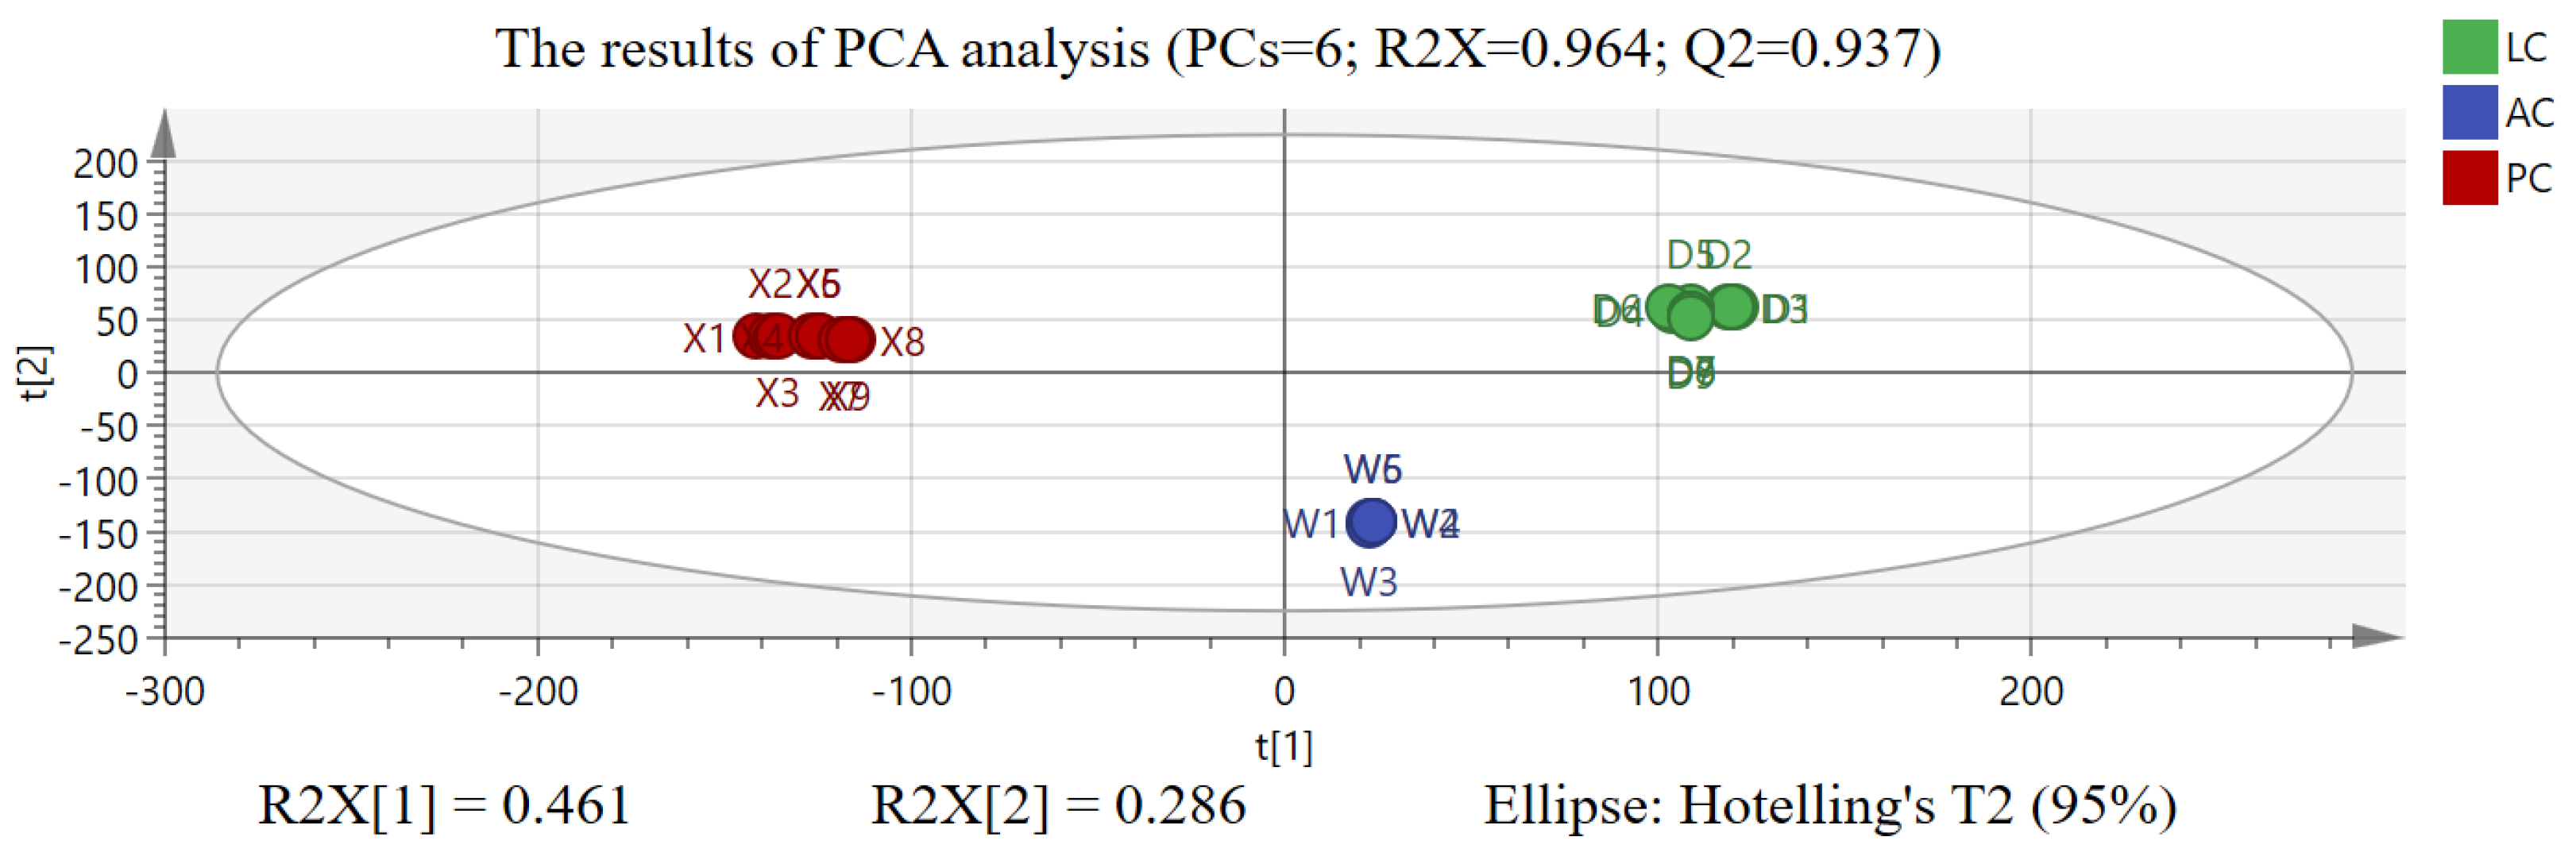
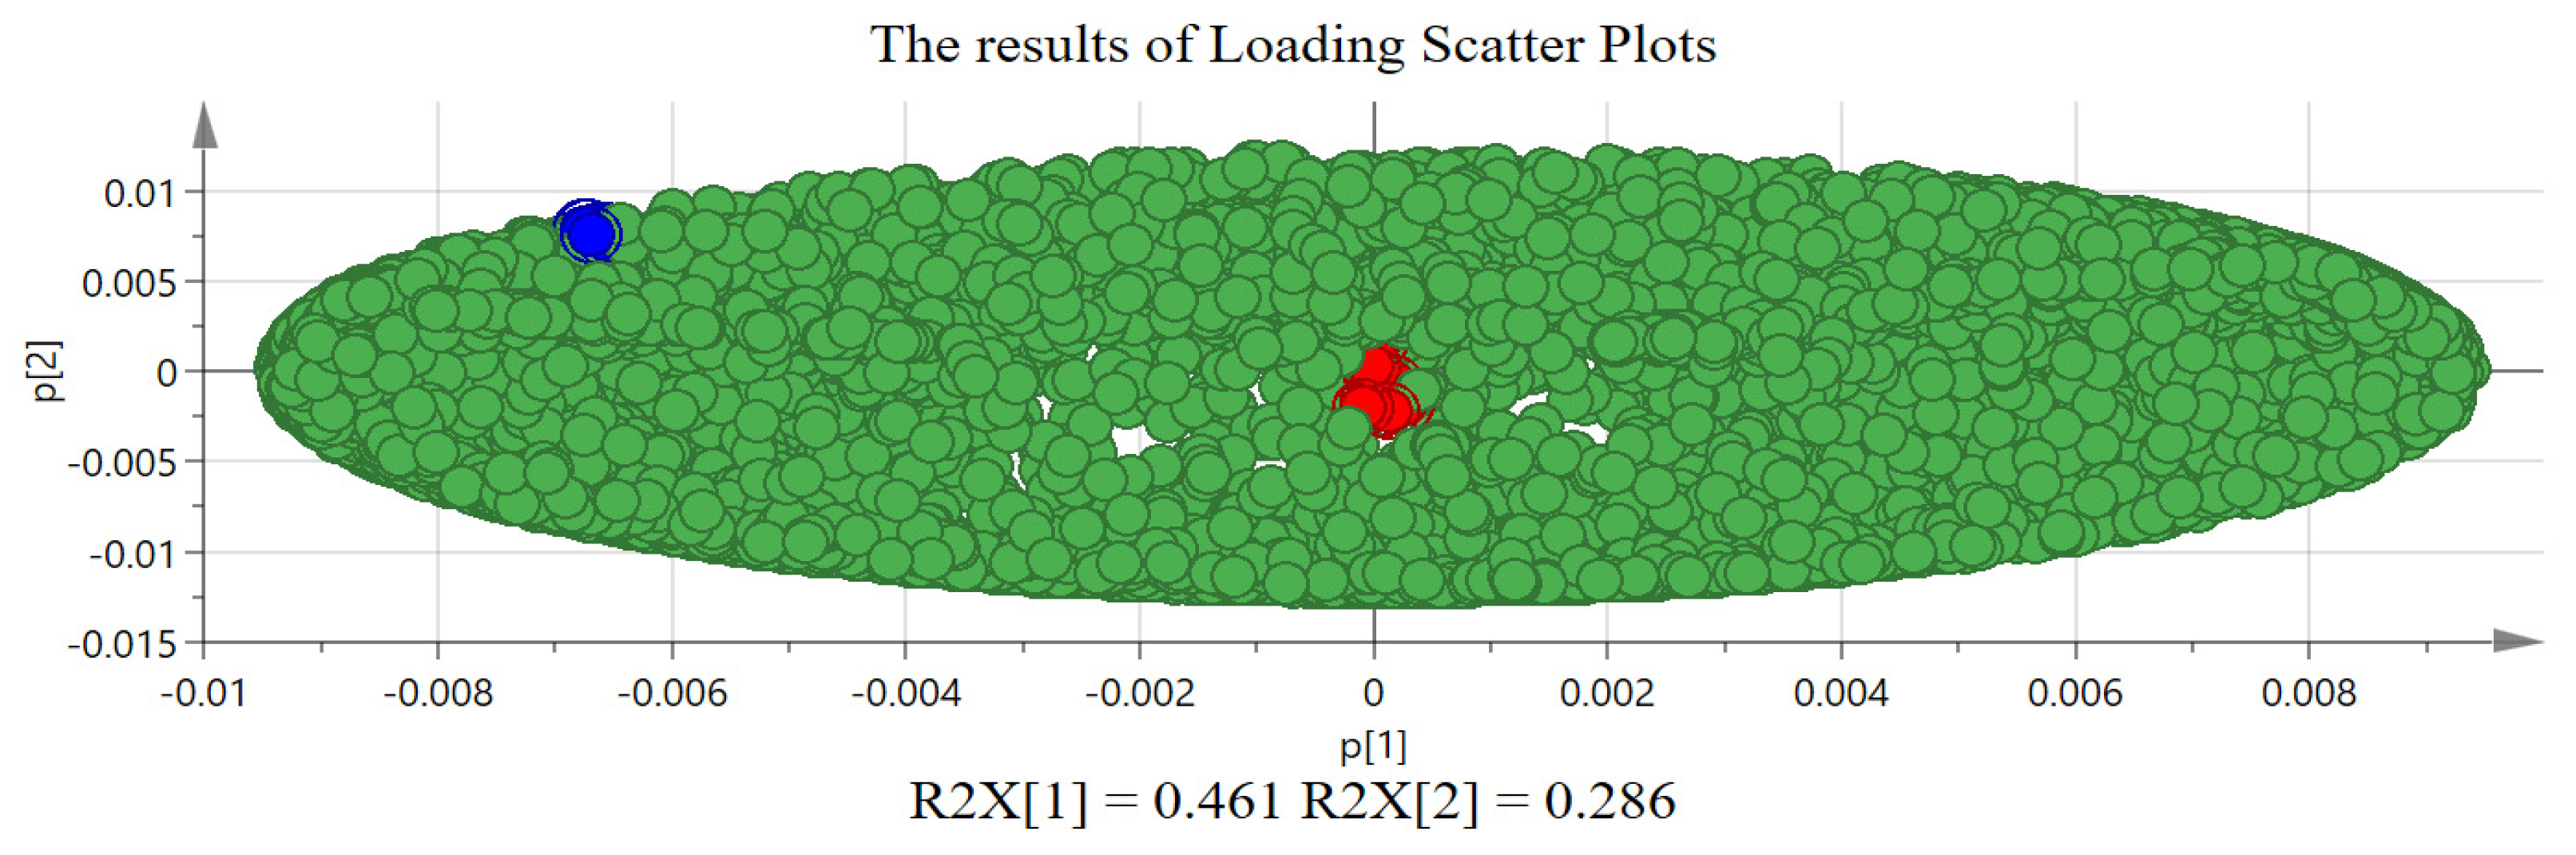
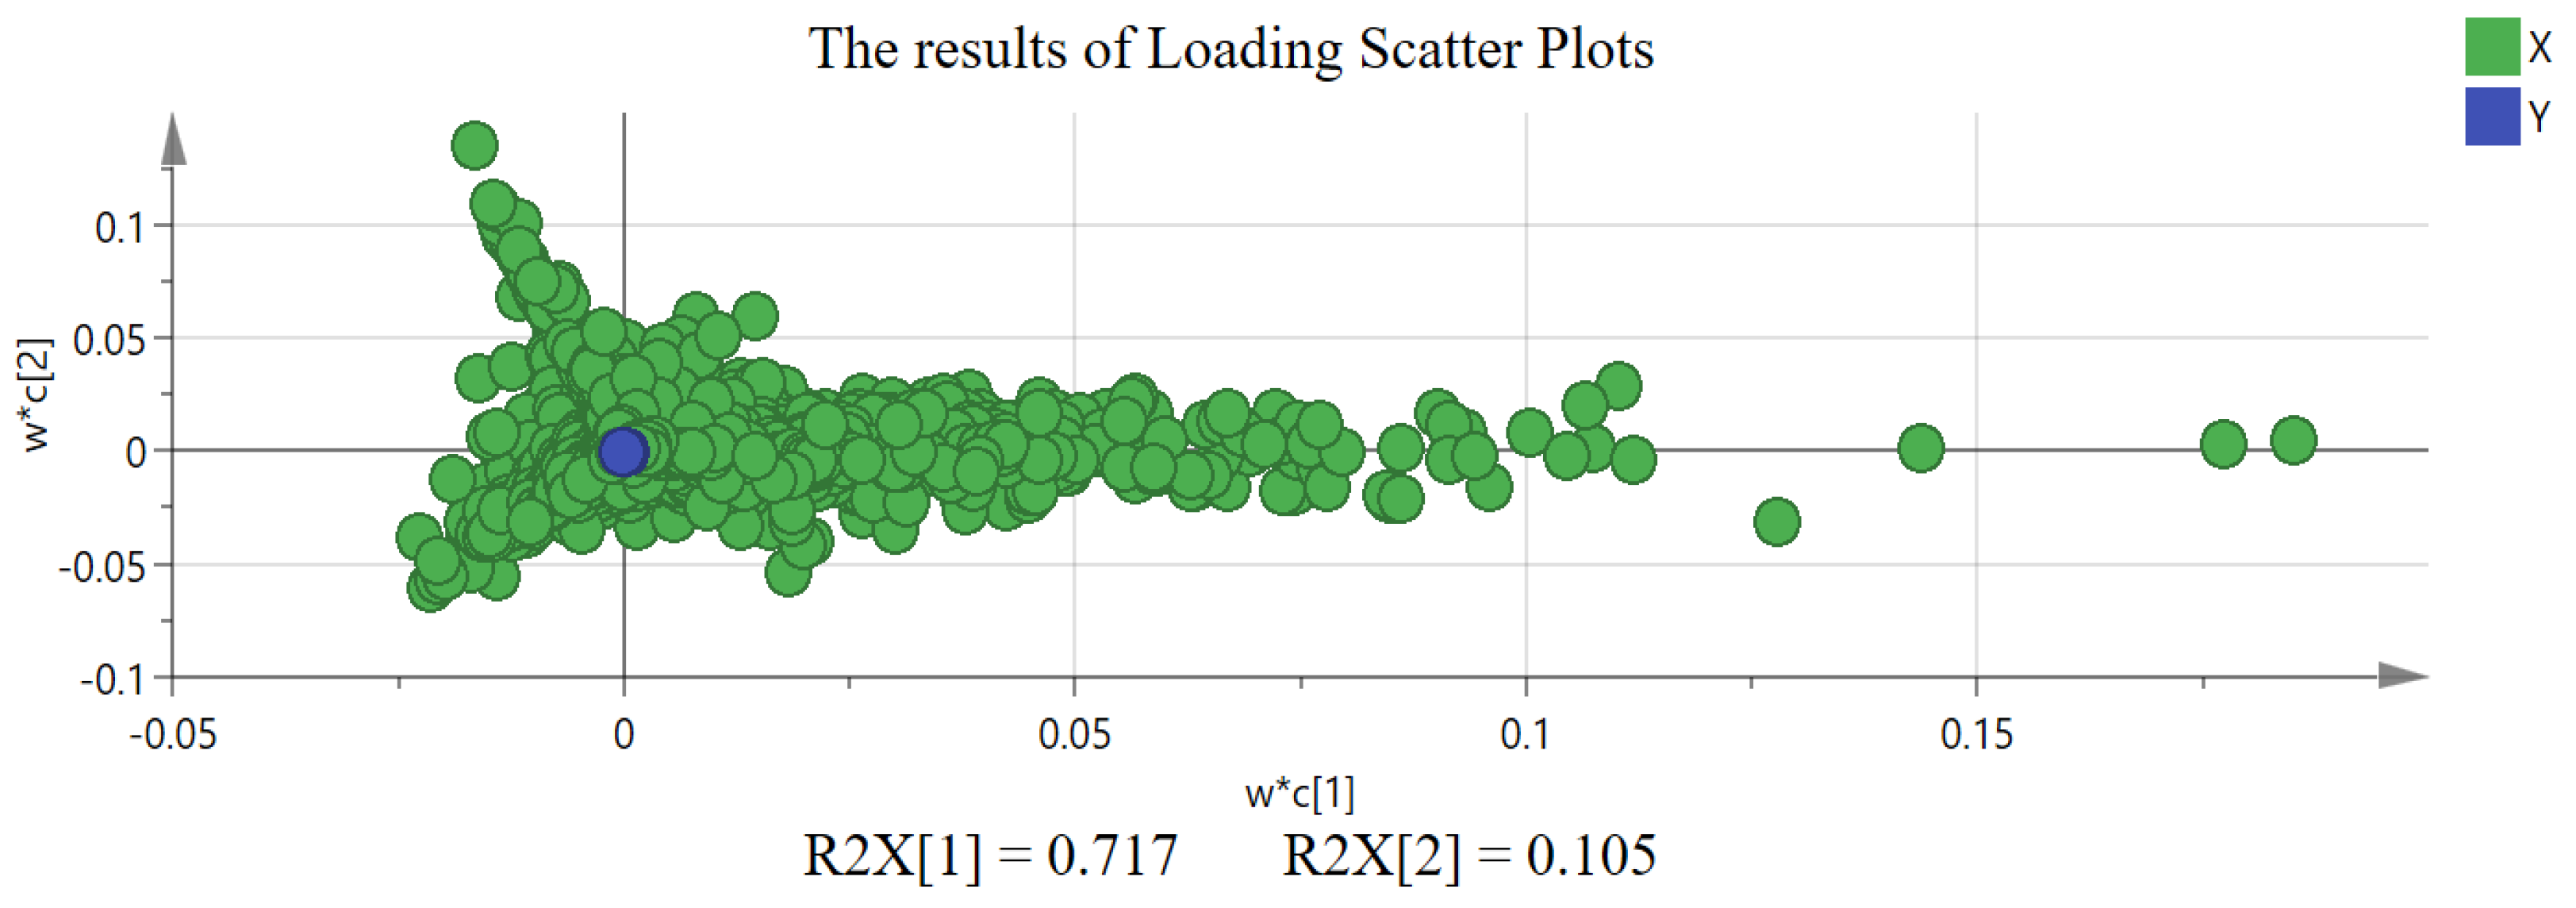
2.2. The Results of Chemometric Analysis
3. Discussion
3.1. Optimization of Analysis Conditions
3.2. Discussion on Chemometric Analysis
3.3. Discussion on Sample Representativeness
3.4. Discussion on Analysis Results
3.5. Research Advantage, Limitation, and Prospect
4. Materials and Methods
4.1. Experimental Materials
4.2. Reagent Materials
4.3. Sample Pretreatment and UHPLC-QTOF-MSE Analysis
4.4. Data Processing and Analysis
5. Conclusions
Supplementary Materials
Author Contributions
Funding
Institutional Review Board Statement
Informed Consent Statement
Data Availability Statement
Acknowledgments
Conflicts of Interest
References
- Yang, H.D.; Tang, Z.S.; Xue, T.T.; Zhu, Y.Y.; Su, Z.H.; Xu, H.B. Acyl-quinic acids from the root bark of Acanthopanax gracilistylus and their inhibitory effects on neutrophil elastase and cyclooxygenase-2 in vitro. Bioorg. Chem. 2023, 140, 106798. [Google Scholar] [CrossRef]
- National Pharmacopoeia Commission. Pharmacopoeia of the People’s Republic of China, 11th ed.; China medical science press: Beijing, China, 2020; pp. 67–68+269. [Google Scholar]
- Liu, C.; Yan, L.; Qian, Y.; Song, P.; Wang, T.; Wei, M. The Extract of Acanthopanacis Cortex Relieves the Depression-Like Behavior and Modulates IL-17 Signaling in Chronic Mild Stress-Induced Depressive Mice. Dose Response 2023, 21, 15593258221148817. [Google Scholar] [CrossRef]
- Shi, S.; Cho, H.; Sun, Q.; He, Y.; Ma, G.; Kim, Y.; Kim, B.; Kim, O. Acanthopanacis Cortex extract: A novel photosensitizer for head and neck squamous cell carcinoma therapy. Photodiagnosis Photodyn. Ther. 2019, 26, 142–149. [Google Scholar] [CrossRef]
- Li, Y.; Li, J.; Zhou, K.; He, J.; Cao, J.; An, M.; Chang, Y.X. A Review on Phytochemistry and Pharmacology of Cortex Periplocae. Molecules 2016, 21, 1702. [Google Scholar] [CrossRef]
- Lin, Z.; Chen, L.; Cheng, M.; Zhu, F.; Yang, X.; Zhao, W.; Zuo, J.; He, S. Cortex periplocae modulates the gut microbiota to restrict colitis and colitis-associated colorectal cancer via suppression of pathogenic Th17 cells. Biomed. Pharmacother. 2022, 153, 113399. [Google Scholar] [CrossRef]
- Wei, J.; Chahel, A.A.; Ni, Y.; Wei, X.; Zhao, Y.; Wang, Y.; Zeng, S. Lycium RIN negatively modulate the biosynthesis of kukoamine A in hairy roots through decreasing thermospermine synthase expression. Int. J. Biol. Macromol. 2023, 252, 126246. [Google Scholar] [CrossRef]
- Zhang, J.; Guan, S.; Sun, J.; Liu, T.; Chen, P.; Feng, R.; Chen, X.; Wu, W.; Yang, M.; Guo, D.A. Characterization and profiling of phenolic amides from Cortex Lycii by ultra-high performance liquid chromatography coupled with LTQ-Orbitrap mass spectrometry. Anal. Bioanal. Chem. 2015, 407, 581–595. [Google Scholar] [CrossRef]
- Li, X.; Jiang, X.W.; Chu, H.X.; Zhao, Q.C.; Ding, H.W.; Cai, C.H. Neuroprotective effects of kukoamine A on 6-OHDA-induced Parkinson’s model through apoptosis and iron accumulation inhibition. Chin. Herb. Med. 2020, 13, 105–115. [Google Scholar] [CrossRef]
- Li, Z.T.; Zhang, F.X.; Fan, C.L.; Ye, M.N.; Chen, W.W.; Yao, Z.H.; Yao, X.S.; Dai, Y. Discovery of potential Q-marker of traditional Chinese medicine based on plant metabolomics and network pharmacology: Periplocae Cortex as an example. Phytomedicine 2021, 85, 153535. [Google Scholar] [CrossRef]
- Zhang, J.X.; Guan, S.H.; Yang, M.; Feng, R.H.; Wang, Y.; Zhang, Y.B.; Chen, X.; Chen, X.H.; Bi, K.S.; Guo, D.A. Simultaneous determination of 24 constituents in Cortex Lycii using high-performance liquid chromatography-triple quadrupole mass spectrometry. J. Pharm. Biomed. Anal. 2013, 77, 63–70. [Google Scholar] [CrossRef]
- Sun, L.; Wu, J.; Wang, K.; Liang, T.; Liu, Q.; Yan, J.; Yang, Y.; Qiao, K.; Ma, S.; Wang, D. Comparative Analysis of Acanthopanacis Cortex and Periplocae Cortex Using an Electronic Nose and Gas Chromatography-Mass Spectrometry Coupled with Multivariate Statistical Analysis. Molecules 2022, 27, 8964. [Google Scholar] [CrossRef] [PubMed]
- Li, N.; Xie, L.; Yang, N.; Sun, G.; Liu, H.; Bi, C.; Duan, J.; Yuan, Y.; Yu, H.; Xu, Y.; et al. Rapid classification and identification of chemical constituents in Epimedium koreanum Nakai by UHPLC-Q-TOF-MS combined with data post-processing techniques. Phytochem. Anal. 2021, 32, 575–591. [Google Scholar] [CrossRef] [PubMed]
- Zhou, M.; Huo, J.; Wang, C.; Wang, W. UHPLC/Q-TOF MS Screening and Identification of Antibacterial Compounds in Forsythia suspensa (Thunb.) Vahl Leaves. Front. Pharmacol. 2022, 12, 704260. [Google Scholar] [CrossRef]
- Liu, H.; Yang, L.; Wan, C.; Li, Z.; Yan, G.; Han, Y.; Sun, H.; Wang, X. Exploring potential mechanism of ciwujia tablets for insomnia by UHPLC-Q-TOF-MS/MS, network pharmacology, and experimental validation. Front. Pharmacol. 2022, 13, 990996. [Google Scholar]
- Wang, Y.; He, S.; Cheng, X.; Lu, Y.; Zou, Y.; Zhang, Q. UHPLC-Q-TOF-MS/MS fingerprinting of Traditional Chinese Formula SiJunZiTang. J. Pharm. Biomed. Anal. 2013, 80, 24–33. [Google Scholar] [CrossRef] [PubMed]
- Sang, Q.; Jia, Q.; Zhang, H.; Lin, C.; Zhao, X.; Zhang, M.; Wang, Y.; Hu, P. Chemical profiling and quality evaluation of Zhishi-Xiebai-Guizhi Decoction by UHPLC-Q-TOF-MS and UHPLC fingerprint. J. Pharm. Biomed. Anal. 2021, 194, 113771. [Google Scholar] [CrossRef] [PubMed]
- Yang, B.; Xuan, S.; Ruan, Q.; Jiang, S.; Cui, H.; Zhu, L.; Luo, X.; Jin, J.; Zhao, Z. UHPLC/Q-TOF-MS/MS-based metabolomics revealed the lipid-lowering effect of Ilicis Rotundae Cortex on high-fat diet induced hyperlipidemia rats. J. Ethnopharmacol. 2020, 256, 112784. [Google Scholar] [CrossRef]
- Chang, K.; Gao, P.; Lu, Y.Y.; Tu, P.F.; Jiang, Y.; Guo, X.Y. Identification and characterization of quinoline alkaloids from the root bark of Dictamnus dasycarpus and their metabolites in rat plasma, urine and feces by UHPLC/Qtrap-MS and UHPLC/Q-TOF-MS. J. Pharm. Biomed. Anal. 2021, 204, 114229. [Google Scholar] [CrossRef] [PubMed]
- Zhang, J.; Yang, W.; Li, S.; Yao, S.; Qi, P.; Yang, Z.; Feng, Z.; Hou, J.; Cai, L.; Yang, M.; et al. An intelligentized strategy for endogenous small molecules characterization and quality evaluation of earthworm from two geographic origins by ultra-high performance HILIC/QTOF MS(E) and Progenesis QI. Anal. Bioanal. Chem. 2016, 408, 3881–3890. [Google Scholar] [CrossRef]
- Ben Salem, K.; Ben Abdelaziz, A. Principal Component Analysis (PCA). Tunis. Med. 2021, 99, 383–389. [Google Scholar]
- Casal, C.A.; Losada, J.L.; Barreira, D.; Maneiro, R. Multivariate Exploratory Comparative Analysis of LaLiga Teams: Principal Component Analysis. Int. J. Environ. Res. Public. Health 2021, 18, 3176. [Google Scholar] [CrossRef] [PubMed]
- Xu, G.; Shu, Y.; Xu, Y. Metabolomics analyses of traditional Chinese medicine formula Shuang Huang Lian by UHPLC-QTOF-MS/MS. Chin. Med. 2022, 17, 62. [Google Scholar] [CrossRef] [PubMed]
- Zhang, W.; Cao, J.; Li, Z.; Li, Q.; Lai, X.; Sun, L.; Chen, R.; Wen, S.; Sun, S.; Lai, Z. HS-SPME and GC/MS volatile component analysis of Yinghong No. 9 dark tea during the pile fermentation process. Food Chem. 2021, 357, 129654. [Google Scholar] [CrossRef]
- Gavaghan, C.L.; Wilson, I.D.; Nicholson, J.K. Physiological variation in metabolic phenotyping and functional genomic studies: Use of orthogonal signal correction and PLS-DA. FEBS Lett. 2002, 530, 191–196. [Google Scholar] [CrossRef] [PubMed]
- Du, Y.; Fan, P.; Zou, L.; Jiang, Y.; Gu, X.; Yu, J.; Zhang, C. Serum Metabolomics Study of Papillary Thyroid Carcinoma Based on HPLC-Q-TOF-MS/MS. Front. Cell Dev. Biol. 2021, 9, 593510. [Google Scholar] [CrossRef] [PubMed]
- Olsson, M.; Hellman, U.; Wixner, J.; Anan, I. Metabolomics analysis for diagnosis and biomarker discovery of transthyretin amyloidosis. Amyloid 2021, 28, 234–242. [Google Scholar] [CrossRef] [PubMed]
- Qiu, X.; Wang, H.; Lan, Y.; Miao, J.; Pan, C.; Sun, W.; Li, G.; Wang, Y.; Zhao, X.; Zhu, Z.; et al. Blood biomarkers of post-stroke depression after minor stroke at three months in males and females. BMC Psychiatry 2022, 22, 162. [Google Scholar] [CrossRef]
- Horai, H.; Arita, M.; Kanaya, S.; Nihei, Y.; Ikeda, T.; Suwa, K.; Ojima, Y.; Tanaka, K.; Tanaka, S.; Aoshima, K.; et al. MassBank: A public repository for sharing mass spectral data for life sciences. J. Mass. Spectrom. 2010, 45, 703–714. [Google Scholar] [CrossRef]
- Wishart, D.S.; Guo, A.; Oler, E.; Wang, F.; Anjum, A.; Peters, H.; Dizon, R.; Sayeeda, Z.; Tian, S.; Lee, B.L.; et al. HMDB 5.0: The Human Metabolome Database for 2022. Nucleic Acids Res. 2022, 50, D622–D631. [Google Scholar] [CrossRef]
- Ru, J.; Li, P.; Wang, J.; Zhou, W.; Li, B.; Huang, C.; Li, P.; Guo, Z.; Tao, W.; Yang, Y.; et al. TCMSP: A database of systems pharmacology for drug discovery from herbal medicines. J. Cheminformatics 2014, 6, 13. [Google Scholar] [CrossRef]
- Li, Z.T.; Zhang, F.X.; Chen, W.W.; Chen, M.H.; Tang, X.Y.; Ye, M.N.; Yao, Z.H.; Yao, X.S.; Dai, Y. Characterization of chemical components of Periplocae Cortex and their metabolites in rats using ultra-performance liquid chromatography coupled with quadrupole time-of-flight mass spectrometry. Biomed. Chromatogr. 2020, 34, e4807. [Google Scholar] [CrossRef]
- Itokawa, H.; Xu, J.; Takeya, K.; Watanabe, K.; Shoji, J. Studies on chemical constituents of antitumor fraction from Periploca sepium. II. Structures of new pregnane glycosides, periplocosides A, B and C. Chem. Pharm. Bull. 1988, 36, 982–987. [Google Scholar] [CrossRef]
- Chen, X.H.; Su, L.; Jiang, L.J.; Zhang, W.; Jiang, Y.Y.; Liu, B. Identification of compounds in Lycii cortex by UPLC-LTQ-orbitrap-MS. Zhongguo Zhong Yao Za Zhi 2019, 44, 4486–4494. [Google Scholar]
- Beszterda, M.; Frański, R. Comment on “Phenolic profiling and evaluation of in vitro antioxidant, α-glucosidase and α-amylase inhibitory activities of Lepisanthes fruticosa (Roxb) Leenh fruit extracts”. Food Chem. 2021, 361, 130107. [Google Scholar] [CrossRef]
- Concannon, S.; Ramachandran, V.N.; Smyth, W.F. A study of the electrospray ionisation of selected coumarin derivatives and their subsequent fragmentation using an ion trap mass spectrometer. Rapid Commun. Mass. Spectrom. 2000, 14, 1157–1166. [Google Scholar] [CrossRef]
- Ruiz-Perez, D.; Guan, H.; Madhivanan, P.; Mathee, K.; Narasimhan, G. So you think you can PLS-DA? BMC Bioinform. 2020, 21 (Suppl. 1), 2. [Google Scholar] [CrossRef]
- Lee, L.C.; Liong, C.Y.; Jemain, A.A. Partial least squares-discriminant analysis (PLS-DA) for classification of high-dimensional (HD) data: A review of contemporary practice strategies and knowledge gaps. Analyst 2018, 143, 3526–3539. [Google Scholar] [CrossRef] [PubMed]
- Zheng, R.; Chen, Z.; Guan, Z.; Zhao, C.; Cui, H.; Shang, H. Variable importance for projection (VIP) scores for analyzing the contribution of risk factors in severe adverse events to Xiyanping injection. Chin. Med. 2023, 18, 15. [Google Scholar] [CrossRef] [PubMed]
- Xu, S.; Bai, C.; Chen, Y.; Yu, L.; Wu, W.; Hu, K. Comparing univariate filtration preceding and succeeding PLS-DA analysis on the differential variables/metabolites identified from untargeted LC-MS metabolomics data. Anal. Chim. Acta 2024, 1287, 342103. [Google Scholar] [CrossRef] [PubMed]


| Composition | m/z | Fragment Ions | Adduct Ion | Molecular Formula |
|---|---|---|---|---|
| 3,5-Di-O-caffeoylquinic acid | 517.1357 | 499.1244\355.1080\145.0284\135.0427 | [M+H]+ | C25H24O12 |
| Lyciumin A | 874.3739 | 856.3706\666.2883\503.2260\486.2028 372.1536\181.0995 | [M+H]+ | C42H51N9O12 |
| Lyciumin B | 897.3897 | 879.3695\851.3809\689.3059\643.2662\503.2247\395.1719\181.1010\159.0917 | [M+H]+ | C44H52N10O11 |
| Periploside H2 | 1165.6003 | 819.4387\703.4024\657.3876 485.1868\323.1347\315.1425\203.0941\171.0657 | [M+H]+ | C56H92O25 |
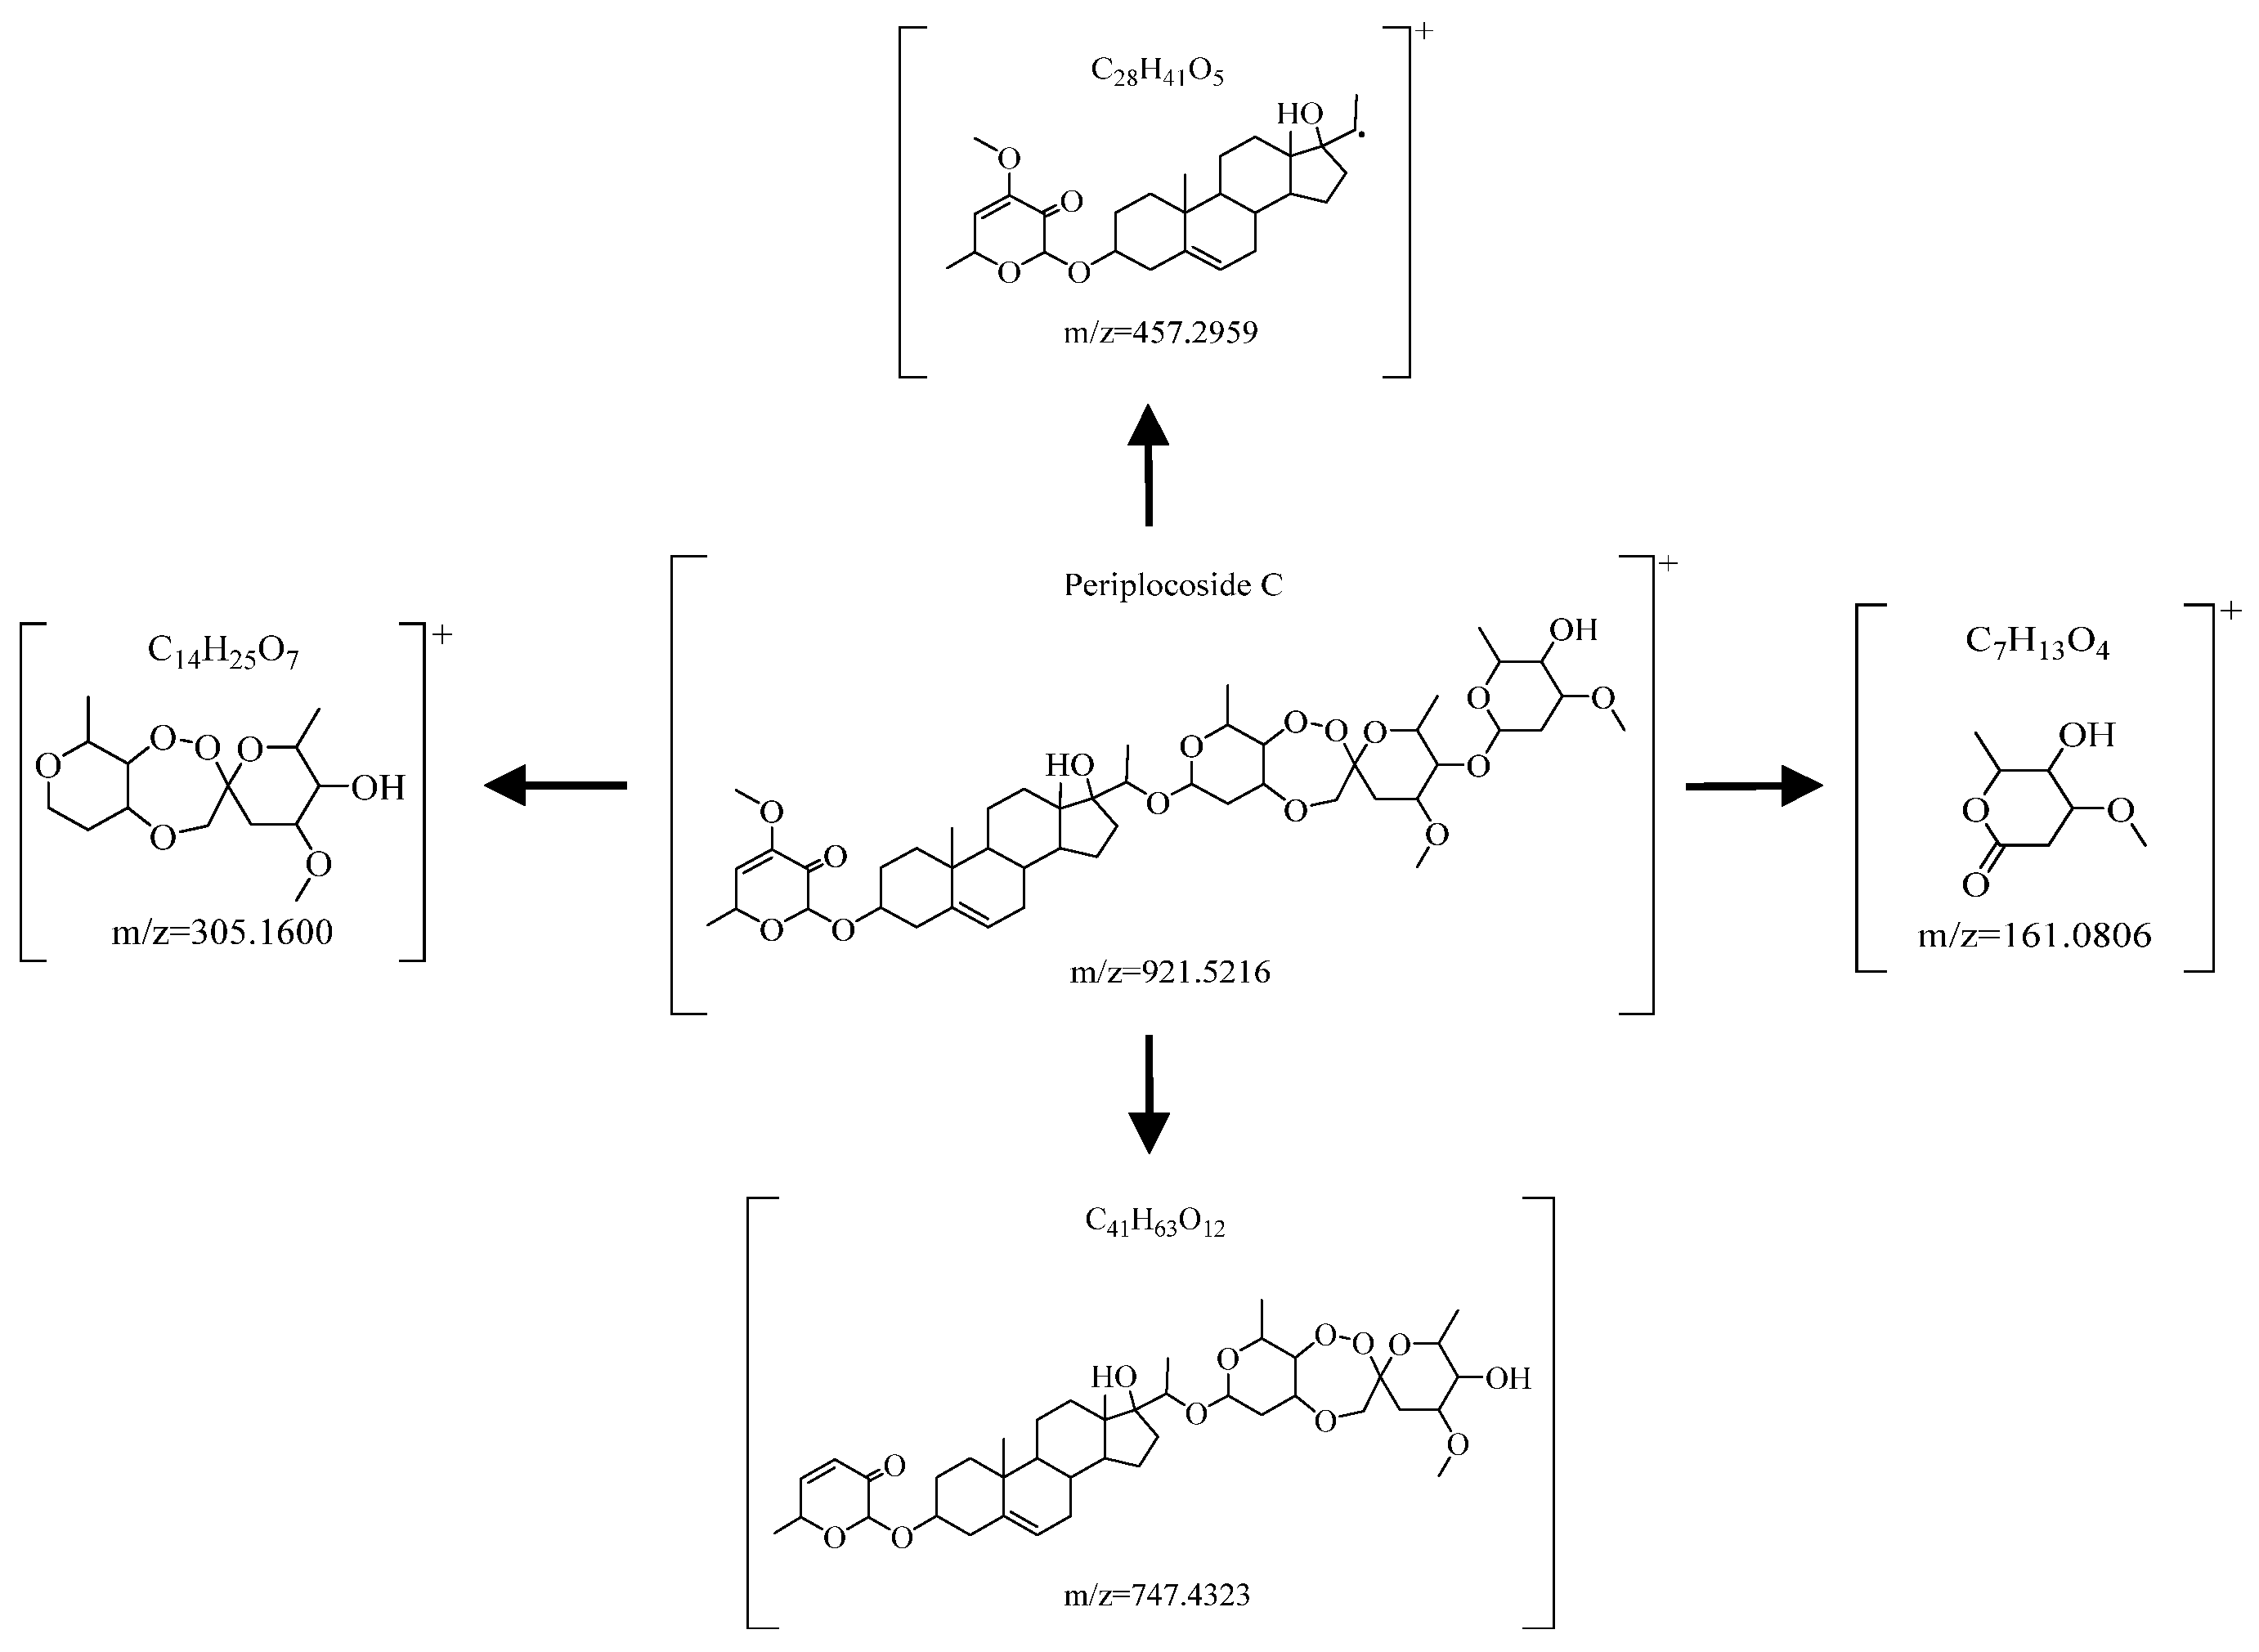
| Periplocoside C | 921.5216 | 161.0806\203.0914\305.1600\417.2136\587.3598\747.4313 | [M+H]+ | C49H76O16 |
| Periplocoside B | 1065.5992 | 1035.5977\921.5239\747.4311\551.3381\439.2844\417.2163 | [M+H]+ | C56H88O19 |
| Periplocoside | 719.3613 | 665.3542\535.3222\391.2525\373.1476\355.2287\337.2187\275.1131 | [M+Na]+ | C36H56O13 |
| 3-O-(β-D-glucopyranose (1→2)-β-D-glucopyranose)-16α-ethoxy -oleanolic acid-28-O-β-D-glucopyranoside | 1009.5346 | 807.4570\687.4120\371.1729\337.2332\291.1958\162.1353 | [M+Na]+ | C50H82O19 |
| Kukoamine A | 531.3184 | 367.2711\293.1868\251.1363\222.1112\167.0721\165.0528\123.0441 | [M+H]+ | C28H42N4O6 |
| 5-Hydroxy-6,7-dimethoxyflavone-4′-O-beta-D-glucopyranoside | 499.1244 | 315.0693\171.1120\163.0667\145.0286 | [M+Na]+ | C23H24O11 |
| 2-Hydroxy-4-methoxybenzaldehyde | 153.0555 | 135.0420\125.0600\121.0285 | [M+H]+ | C8H8O3 |
| Periplocoside K | 825.4255 | 629.2805\485.1865\325.1138\323.1341\203.0940 | [M+Na]+ | C40H66O16 |
| N-FeruloyltyraMine | 314.1392 | 177.0548\134.0356 | [M+H]+ | C18H19NO4 |
| N-caffeoyltyramine | 300.1238 | 121.0640 | [M+H]+ | C17H17NO4 |
| 3-O-acetyl-caffeic acid | 223.0606 | 123.0443\134.0367 | [M+H]+ | C11H10O5 |
| 1-Monopalmitin | 353.2667 | 313.2765\239.2404 | [M+Na]+ | C19H38O4 |
| 7-methoxycoumain [36] | 177.0552 | 162.0364\149.0584\133.0698\118.0383 | [M+H]+ | C10H8O3 |
| Compounds | Class Median | Kruskal-Wallis-H Value | p | ||
|---|---|---|---|---|---|
| LC (n = 9) | AC (n = 6) | PC (n = 9) | |||
| 3,5-Di-O-caffeoylquinic acid | 5830.110 (2778.9, 9303.2) | 184,194.500 (181,343.5, 194,189.5) | 12,993.500 (11,643.9, 16396.9) | 20.25 | 0.000 ** |
| Lyciumin A | 1,600,530.000 (355,550.0, 2,149,495.0) | 494.760 (487.2, 499.8) | 1889.880 (1871.3, 1922.7) | 20.25 | 0.000 ** |
| Lyciumin B | 34,775.800 (26,950.8, 55,647.2) | 0.000 (0.0, 0.0) | 0.000 (0.0, 0.0) | 21.41 | 0.000 ** |
| Periploside H2 | 26.202 (0.0, 24,765.5) | 82.655 (71.5, 107.0) | 292,979.000 (281,991.0, 353,838.5) | 16.72 | 0.000 ** |
| Periplocoside C | 11,552.900 (10,465.3, 31,519.0) | 26,186.300 (25,263.7, 26,754.5) | 179,990.000 (140,397.0, 182,907.0) | 16.65 | 0.000 ** |
| Periplocoside B | 8872.360 (8011.5, 44,087.2) | 23,943.500 (23,182.0, 24,265.3) | 152,935.000 (133,812.0, 212,033.0) | 16.65 | 0.000 ** |
| Periplocoside | 262.189 (167.4, 11,596.4) | 2095.605 (1985.1, 2163.4) | 28,947.300 (27,909.1, 39,741.9) | 16.65 | 0.000 ** |
| 3-O-(β-D-glucopyranose (1→2)-β-D-glucopyranose) -16α-ethoxy-oleanolic acid -28-O-β-D-glucopyranoside | 0.000 (0.0, 5724.1) | 3487.590 (3211.4, 3559.4) | 31,907.300 (23,078.8, 45,327.4) | 16.91 | 0.000 ** |
| Kukoamine A | 6,393,320.000 (4,404,335.0, 6,703,815.0) | 0.000 (0.0, 0.0) | 1055.530 (292.7, 1394.1) | 20.56 | 0.000 ** |
| 5-Hydroxy-6,7-dimethoxyflavone-4′-O-beta-D-glucopyranoside | 3283.940 (755.7, 5009.4) | 341,882.000 (334,246.8, 366,415.5) | 34,851.100 (22,416.1, 37,870.1) | 20.25 | 0.000 ** |
| 2-Hydroxy-4-methoxybenzaldehyde | 217.577 (95.0, 1380.7) | 3061.145 (3021.6, 3138.2) | 50,979.300 (20,609.9, 57,093.0) | 20.25 | 0.000 ** |
| Periplocoside K | 3144.210 (224.8, 8289.9) | 2119.750 (2048.7, 2207.6) | 13,786.500 (12,795.0, 14,256.9) | 16.25 | 0.000 ** |
| N-FeruloyltyraMine | 237,802.000 (146,926.5, 781,073.0) | 1271.425 (1259.4, 1344.9) | 1012.490 (786.3, 1113.7) | 18.89 | 0.000 ** |
| N-caffeoyltyramine | 246,638.000 (85,521.4, 348,217.0) | 530.405 (501.3, 557.8) | 1011.030 (581.5, 1052.8) | 19.40 | 0.000 ** |
| 3-O-acetyl-caffeic acid | 18,414.500 (8236.1, 25,494.3) | 600.173 (542.5, 667.1) | 25,812.000 (18,788.3, 37,798.0) | 15.01 | 0.001 ** |
| 1-Monopalmitin | 377,254.000 (331,131.0, 602,292.0) | 63,102.600 (57,234.3, 67,633.6) | 36,612.100 (29,466.7, 42,631.4) | 20.25 | 0.000 ** |
| 7-methoxycoumain | 1629.570 (1294.6, 3267.7) | 602.553 (579.9, 627.4) | 20,946.200 (13,503.5, 23,814.5) | 20.25 | 0.000 ** |
Disclaimer/Publisher’s Note: The statements, opinions and data contained in all publications are solely those of the individual author(s) and contributor(s) and not of MDPI and/or the editor(s). MDPI and/or the editor(s) disclaim responsibility for any injury to people or property resulting from any ideas, methods, instructions or products referred to in the content. |
© 2024 by the authors. Licensee MDPI, Basel, Switzerland. This article is an open access article distributed under the terms and conditions of the Creative Commons Attribution (CC BY) license (https://creativecommons.org/licenses/by/4.0/).
Share and Cite
Wang, X.; Zhang, J.; He, F.; Jing, W.; Li, M.; Guo, X.; Cheng, X.; Wei, F. Differential Chemical Components Analysis of Periplocae Cortex, Lycii Cortex, and Acanthopanacis Cortex Based on Mass Spectrometry Data and Chemometrics. Molecules 2024, 29, 3807. https://doi.org/10.3390/molecules29163807
Wang X, Zhang J, He F, Jing W, Li M, Guo X, Cheng X, Wei F. Differential Chemical Components Analysis of Periplocae Cortex, Lycii Cortex, and Acanthopanacis Cortex Based on Mass Spectrometry Data and Chemometrics. Molecules. 2024; 29(16):3807. https://doi.org/10.3390/molecules29163807
Chicago/Turabian StyleWang, Xianrui, Jiating Zhang, Fangliang He, Wenguang Jing, Minghua Li, Xiaohan Guo, Xianlong Cheng, and Feng Wei. 2024. "Differential Chemical Components Analysis of Periplocae Cortex, Lycii Cortex, and Acanthopanacis Cortex Based on Mass Spectrometry Data and Chemometrics" Molecules 29, no. 16: 3807. https://doi.org/10.3390/molecules29163807
APA StyleWang, X., Zhang, J., He, F., Jing, W., Li, M., Guo, X., Cheng, X., & Wei, F. (2024). Differential Chemical Components Analysis of Periplocae Cortex, Lycii Cortex, and Acanthopanacis Cortex Based on Mass Spectrometry Data and Chemometrics. Molecules, 29(16), 3807. https://doi.org/10.3390/molecules29163807